- 1Ocean Georesources Research Department, Korea Institute of Ocean Science and Technology, Busan, Republic of Korea
- 2Department of Astronomy, Space Science and Geology, Chungnam National University, Daejeon, Republic of Korea
We have estimated the resource potential of cobalt-rich ferromanganese crusts (CFCs) on the summit area of the KC-8 seamount in the West Pacific, based on the acoustic backscatter intensity (ABI), ROV video footage, and CFC thickness measurements. To estimate the spatial distribution of CFC across 13 equally divided blocks within a 360 km2 area, shipboard and deep-tow ABIs were compared with visual data. The presence of CFCs is evident in the areas where ABI is higher than average, validating the use of ABI data to delineate the exposure of CFCs. With high accuracy in distinguishing between CFCs and sediment-dominant areas, the distribution area of CFCs was precisely calculated. The variation in CFC thickness across the KC-8 seamount summit was measured through CFC samples retrieved using a CFC corer. CFC thickness is highly variable even between adjacent sites, but it shows a roughly increasing trend from south to northwest. Based on the CFC distribution area associated with thickness, we calculated a CFC resource abundance. Of the estimation, 82% have remained on the gentle slope (<10°) areas, which can be accessible for future mining. Overall, our study suggests that the combination of an acoustic survey with reliable thickness information is highly effective in estimating CFC abundance.
1 Introduction
Cobalt-rich ferromanganese crusts (CFCs) are one of the important submarine potential mineral resources mainly distributed in seamounts. They have higher concentrations of metallic elements such as cobalt (Co), nickel (Ni), manganese (Mn), platinum (Pt), and rare earth elements (REEs), which are essential for high-technology and green energy applications (Halbach et al., 1989; Hein et al., 2013; 2015; 2016; Okamoto and Usui, 2014; Nozaki et al., 2016; Lusty et al., 2018; Koschinsky et al., 2020; Benites et al., 2023). CFCs mainly form on the outer summit area and flanks of seamounts at depths of 400 to 4,000 m, with the thickest and rich in metal contents particularly at depths of 1,000 to 2,500 m (e.g., Hein et al., 2000; 2013). Generally, CFCs precipitate from cold ambient bottom waters onto the surface of seamounts, ridges, and plateaus as pavements and coatings on rocks in areas that are kept sediment-free with a very slow growth rate of 1–5 mm/Ma (e.g., Segl et al., 1989; Ingram et al., 1990; Ling et al., 1997). The thickness of CFCs in the West Pacific seamounts can reach up to 260 mm, typically being thicker on older seamounts (Usui and Someya, 1997), with the maximum age determined to be 70 Ma (Hein et al., 2013). Approximately 70% of global CFCs are concentrated in the West Pacific Seamount Province (WPSP) (Hein et al., 2003; Hein and Koschinsky, 2014; Blümel et al., 2021), called a Pacific Prime Crust Zone (PCZ) (Hein et al., 2009), where a lot of seamounts are distributed. In the high seas of the WPSP, South Korea, China, Japan, and Russia have conducted scientific surveys to identify the CFC dominant area on the summits of seamounts since the 2000s.
The spatial distribution of CFCs is closely related to the contribution of pelagic sediments because high productivity and sediments flux prevented CFC growth (e.g., Hein et al., 2000; Zhao et al., 2020; Yang et al., 2023). Hence, geomorphological characteristics of the CFC pavements have to be constrained using sea-surface and near-bottom observations, including seafloor acoustic characteristics, seafloor image mapping, and sampling. The seafloor acoustic characteristic (i.e., acoustic backscatter intensity, ABI) generally depends on the roughness and hardness of the seafloor substrates (e.g., Jackson et al., 1986; Hughes Clarke, 1994; Fonseca and Mayer, 2007; Jackson and Richardson, 2007; Blondel, 2009; Gavrilov and Parnum, 2010; Hamilton and Parnum, 2011). For example, hard substrates (e.g., bedrocks and CFCs) typically produce high ABI, indicating strong reflectivity, whereas softer substrates (e.g., pelagic sediments) result in lower ABI due to their weaker reflectivity. Thus, such variations in seafloor ABI can be used as a proxy to identify the spatial distribution of CFCs at the seamount. Sea-surface acoustic surveying using shipboard multibeam echo-sounder (MBES) has been widely utilized to identify the distribution of CFCs across wide regions rapidly (e.g., Usui and Okamoto, 2010; Kim et al., 2013; Yang et al., 2016; 2020; Joo et al., 2020; Yao et al., 2021; Hino et al., 2023; Kaji et al., 2023; Pillai et al., 2023). Subsequently, near-bottom acoustic survey is conducted using towing systems, autonomous underwater vehicle (AUV), or remotely operated vehicle (ROV) to produce higher resolution mapping than MBES across narrow regions (e.g., Yeo et al., 2019). Meanwhile, global distribution of CFC has been predicted using random forest data-driven machine learning algorithm (Josso et al., 2023).
To enhance the identification of the spatial distribution of CFCs covering the seamount, several studies have analyzed the acoustic data and seafloor observation results (i.e., seafloor video footage and CFC sampling) (Usui and Okamoto, 2010; Kim et al., 2013; Joo et al., 2020; Yang et al., 2020; Kaji et al., 2023; Pillai et al., 2023). They found that high ABIs on the marginal summit of seamounts are associated with CFCs, and proposed a positive correlation between variation of ABIs and the presence of CFCs. Such coincidence was confirmed by direct seafloor observations and CFC samplings.
In this study, we characterize the spatial distribution and abundance of CFCs on the marginal summit of the KC-8 seamount in the WPSP (Figure 1). To address this issue, the acoustic data, seafloor video footage, and CFC core samples were utilized. We analyze ABI from MBES and deep-tow side-scan sonar (DTSSS), and correlate to seafloor images from ROV to accurately estimate the distribution area of CFCs. By measuring CFC thickness from core samples, the abundance of CFCs is estimated.
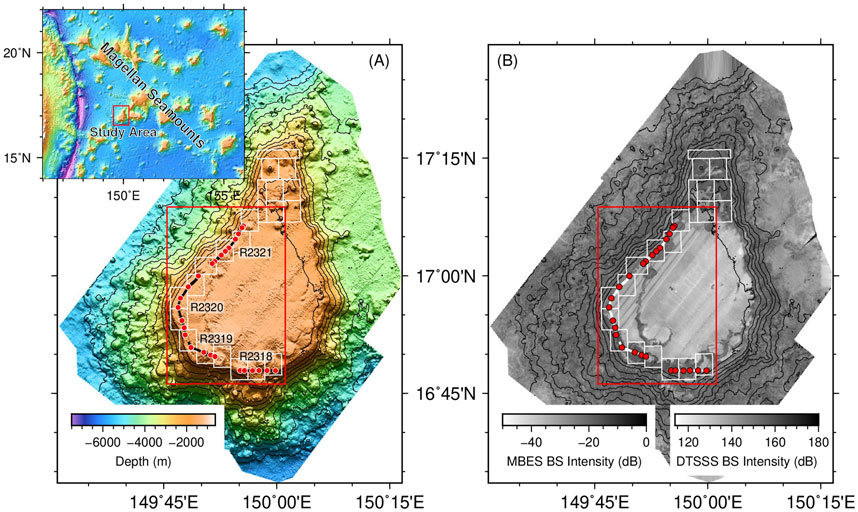
Figure 1. Bathymetry and acoustic backscatter maps of KC-8 seamount. Contour interval is 400 m and the thick contour marks 1,600 m (flat summit). (A) The observed bathymetric map. The inset shows the Magellan Seamounts in the West Pacific and the study area. (B) The acoustic backscatter intensities (ABIs) obtained from MBES and DTSSS IMI-30 systems. Over the MBES data, available IMI-30 data were laid on the western marginal summit. White box = 20 km2 exploration block (blocks 119 to 139 on the KC8), red box = study blocks (blocks 127–139), thick black and white lines = four ROV visual transects (R2318 to R2321), and red circles = CFC coring locations.
2 Materials and methods
2.1 Study area
Magellan Seamounts, located in the WPSP, are known as the developed well repository of CFC. Geologically, the seamounts in the WPSP are of the Late Jurassic to Cretaceous seafloor, identified by magnetic stripe patterns on the Pacific seafloor (Nakanishi et al., 1992). They were formed by hotspot activity at around 0 to 10°S during the Cretaceous (i.e., ∼120 to 74 Ma) and subsequently relocated to current locations by the tectonic movement of the Pacific Plate (Koppers et al., 1998; Glasby et al., 2007).
In 2018, South Korea signed a CFC exploration contract with the ISA. The contract area comprises nine seamounts (KC-1 to KC-9) of Magellan Seamounts with a total of 3,000 km2, divided into 150 blocks of 20 km2 each. On the summit of the seamounts, the 3,000 km2 exploration contract area is believed to have high resource potential based on ABIs and seafloor images (e.g., Kim et al., 2013; Joo et al., 2016; 2020).
In this study, we investigate the resource abundance of CFC on the KC-8 seamount (Skornyakova Guyot; Lat./Long. = 16°57.809′N/149°57.331′E), which is one of the nine exploration contract seamounts of South Korea (Figure 1). The KC-8 seamount was formed at ∼98 Ma (Tang et al., 2019). The study area has a flat summit, which is defined by a depth below 1,600 m (Figure 1). On the KC-8, 21 exploration blocks (119–139; white boxes in Figure 1) have been designated, and this study analyzed 13 blocks from 127 to 139 (red box in Figure 1).
2.2 Data acquisition and methods
To estimate the CFC abundance, we utilized acoustic data, video footage, and CFC thickness. CFC exposure area was estimated using the acoustic characteristics of CFCs (i.e., ABI) and seafloor conditions classified from ROV video footage. The average CFC thickness of each block was then used to calculate the CFC volumes for each block. Finally, we estimate the CFC abundance in each block by calculating the product of the CFC volume and the generally accepted CFC dry-bulk density of 1.3 g/m3 (Hein et al., 2000).
To obtain acoustic characteristic data, we analyzed near-bottom acoustic data, which was acquired by the DTSSS IMI-30 system from Hawaii Mapping Research Group (HMRG) in 2014 (Figure 2A). High-resolution ABIs were obtained over 142 km of 6 transects (165 km2 area). The IMI-30 system is towed at an altitude of ∼300 m above the seafloor, generating acoustic waves at a frequency of 30 kHz. Due to its frequency and the proximity to the seafloor, it has the advantage of observing the target in more detail than a 12 kHz shipboard MBES (e.g., Ballard et al., 2002; Quinn et al., 2005; Sakellariou et al., 2007; Bagnitsky et al., 2011). For instance, our survey scheme can produce a resolution that is 15–20 times higher than that of the shipboard survey. Acquired raw data were processed using HMRG Data Interface software to produce reflection times and intensities of the acoustic waves. Then the processed data were converted into bathymetry and backscatter values. Using the GMT program, the backscatter values were resampled into grid files with a horizontal resolution of 5 m × 5 m.
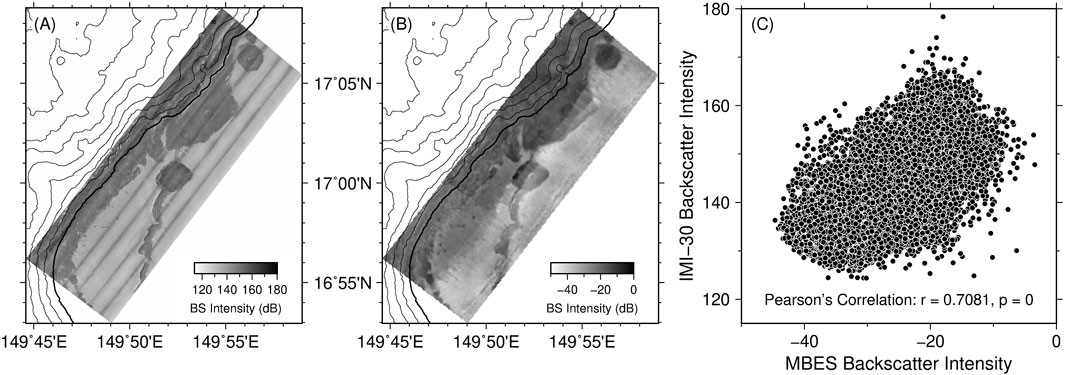
Figure 2. Comparison of the ABIs from (A) IMI-30 and (B) MBES. (C) Scatter plot of ABIs from IMI-30 and MBES.
To understand the seafloor condition indicated by ABI and directly observe the CFC distribution area, we conducted ROV visual surveys using the ROPOS ROV from the Canadian Scientific Submersible Facility in 2023. We designed the transects along the margin of the KC-8 summit area (above the 1,600 m depth) based on the previous seafloor image footage, acoustic characteristic data, and topography data (e.g., Joo et al., 2020). Continuous seafloor videos were obtained for a 44.5 km section through 4 dives (black and white thick lines in Figure 1). HD images were acquired at an average height of 5 m while moving at a speed of 0.5–1.0 knots. ROV flying positions were determined by a combination of ROV gyrocompass and Kongsberg HiPAP system installed in R/V ISABU. Seafloor conditions were monitored at every 5–30 s and manually classified.
To identify the thickness variation of the CFCs, we acquired CFC core samples using ROV-mounted CFC corer, KIOST Remotely Operated Coring System (KROCS). The KROCS can core up to 10 cores per dive, with the drilling speed remotely controllable depending on the physical properties of the CFC and bedrock. It can get cores up to 50 cm long. In this study, a total of 26 CFC core samples were obtained during ROV video surveys in 2023 (red circles in Figure 1), and the thickness of the CFCs in the core samples was measured.
3 Results
3.1 Acoustic characteristics
In this study, ABIs obtained using the IMI-30 system were analyzed to identify the variation of ABIs according to the seafloor acoustic characteristics. Since our IMI-30 data covers only seven (blocks 127–133) out of the 13 blocks on KC-8, we use MBES data for the remaining six blocks (blocks 134–139). The ABI from IMI-30 is illustrated as an intensity map in Figure 2A. The ABI varies within the range from 114 to 180 dB with an average of 143.45 dB. Distinct variations in intensity are observed even in adjacent areas, which, upon reviewing the topographic data, are deemed to reflect differences in the hardness of the materials constituting the seafloor. In the bright areas where the ABI is below the average of 143.45 dB, the soft substrates (e.g., sediments) are expected to be predominant. In the dark area where the intensity value is above 143.45 dB, hard substrates (e.g., CFCs and rocky outcrops) are expected to be predominant.
To verify whether the relatively low-resolution MBES acoustic data (i.e., horizontal resolution of 100 m × 100 m) can reflect the variation of the seafloor conditions effectively, a comparison was made with the IMI-30 data for the seven blocks (Figures 2A, B). Assuming a linear relationship between the two data sets, the correlation was quantified using Pearson’s product-moment correlation coefficient (Figure 2C). We also computed a p-value, which gives the probability of the correlation coefficient. A low p-value indicates a small probability of the true correlation being zero. The result shows a strong correlation between the two data sets, with a correlation coefficient of r = 0.7081 and p = 0 (Figure 2C), indicating that the ABIs from MBES can be applied to trace the variation of the seafloor conditions on KC-8. Although many data points are located away from the linear relationship, this may be raised by the resolution difference between the two datasets. Based on the correlation results, the ABIs from MBES were used in the remaining six blocks.
3.2 Visual observation
We acquired the seafloor video footage along the preselected transects with 44.5 km distance on the KC-8 from four ROV dives. Direct observation of the seafloor is essential to verify what the ABIs represent. In general, the seafloor in the study area shows a complex geological feature revealing the presence of CFCs, manganese nodules, sediments, or their mixture. However, we simplified the classification into three types for comparison with ABIs: CFC-dominant area (C), sediment-dominant area (S), and mixed area (M) (Figure 3). According to such notation, a qualitative classification of the seafloor was performed based only on the color and texture of the seafloor seen in the video. Although data are not shown here, sediments were checked and sampled using push corer for biological study. CFCs were also sampled as described in Chapter 3.4.
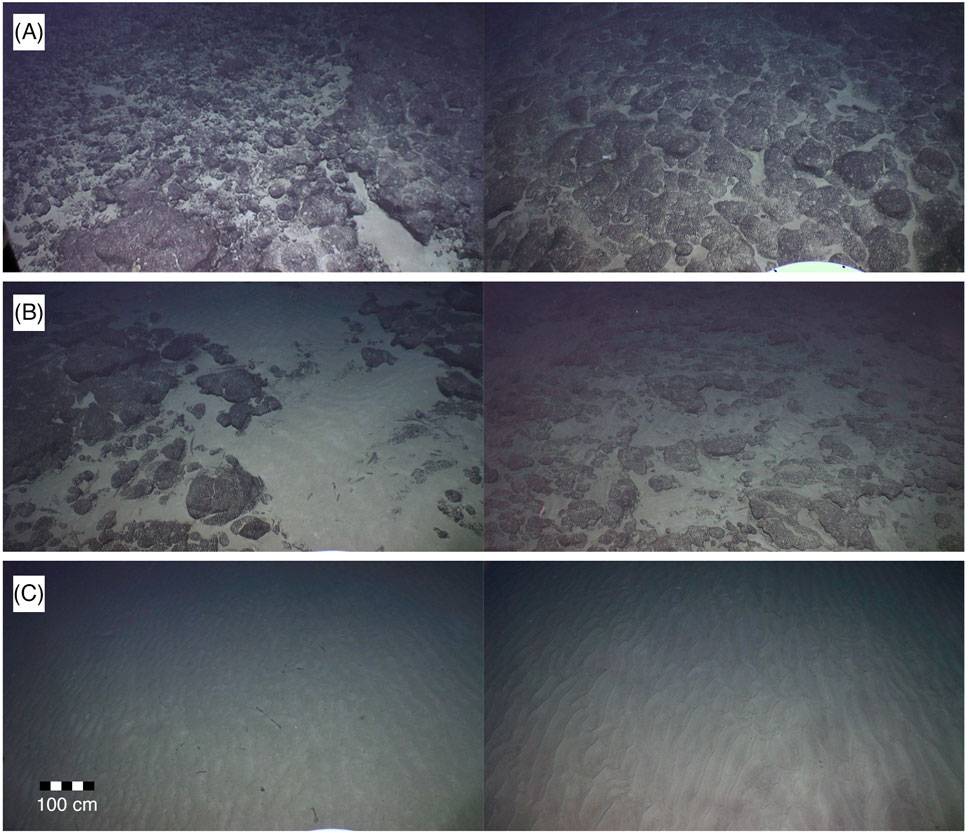
Figure 3. Examples of seafloor images observed in the KC8 seamount using an ROV. The seafloor conditions are classified into (A) CFC-dominant (C type), (B) CFC partially covered by sediments (M type), and (C) sediment-dominant (S type).
The seafloor characteristics, categorized into three types along the transects, are shown in Figure 4. In the northwestern part (R2320, blocks 127–130), the proportion of the C type seafloor accounts for 6.35%, the M type for 72.21%, and the S type for 21.45% (Figure 4A). Although the M type is predominant throughout the study area, there exists a distinctive variation in the proportion of C and S seafloor types toward the southern part. As shown in Figure 4D, C type increases up to 16.54% with a decrease in S type to 12.92% in the southern part (R2318, blocks 137–139), while M type remains high proportion (70.54%). It should be noted that the M type was defined even in cases where CFCs were predominant with sediments partially covering them (Figure 3), resulting in a high proportion of the M type. According to Zhao et al. (2020), such M type is believed to result from the gradual coverage of sediments over CFC, showing a thickness of <30 cm. In addition, these sediments in the M type originated from the thick central sediments formed in the seamount summit.
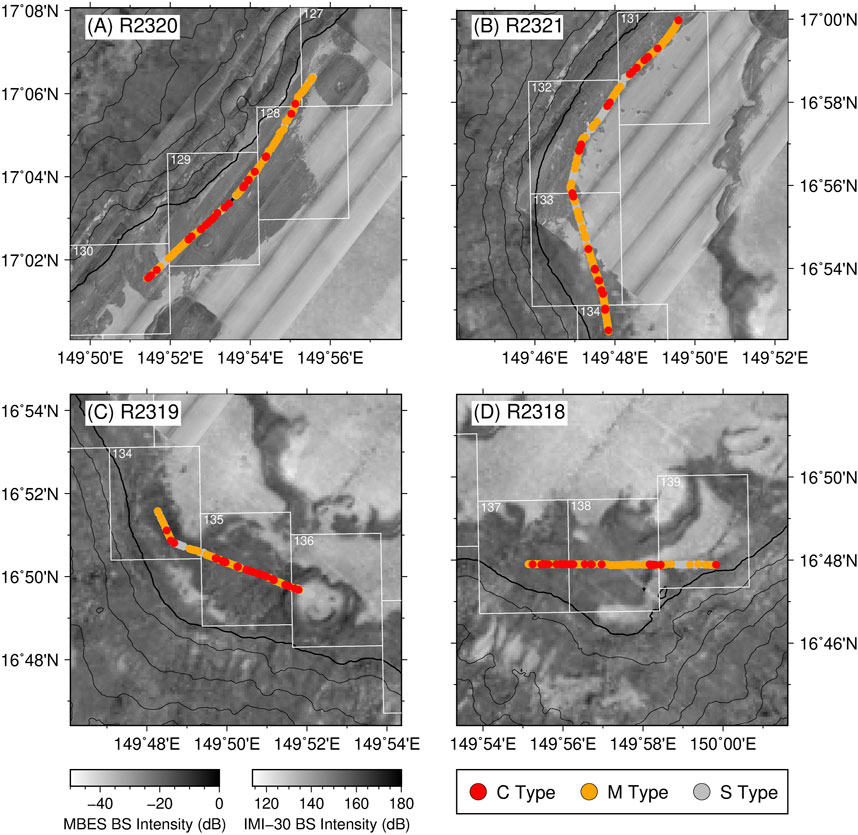
Figure 4. Spatial variation in occurrences of CFCs along ROV transects from the northwest to southern areas of (A) R2320, (B) R2321, (C) R2319, and (D) R2318. Red, orange, and gray circles = C type, M type, and S type seafloor conditions, respectively. White box = 30 km2 exploration block.
Overall, the C type area may be more extensive than the area identified by ROV video footage. Moreover, the higher proportion of M type toward the northwestern part, despite the influence of a high S type proportion, can be caused by more horizontal sediment influx on CFC.
3.3 Comparison between ABI and video footage
Previous studies suggested a positive correlation between the ABI data, seafloor slopes, and the occurrence of CFCs (e.g., Usui and Okamoto, 2010; Joo et al., 2020; Yang et al., 2020). Based on their finding, we can infer that seafloor types containing CFCs (C types) will exhibit high ABI, while sediment-dominated seafloor types (S) will have low intensity. Moreover, the mixture of CFCs and sediments seafloor types (M) can also exhibit high ABI if the sediment covers the CFC very thinly and/or partially, as mentioned in Chapter 3.2.
To test our inference, we first extracted the ABI along the transects where ROV footage was obtained. We then calculated the average and standard deviation for the three predefined C, S, and M types of the seafloor. Figure 5 shows these calculations for each seafloor type along each transect using ABIs from the IMI-30 (Figure 5A) and MBES (Figure 5B), respectively. For all transects, the C types exhibit significantly high average values (approximately 151 dB for IMI-30 data and −19 dB for MBES data) with lower standard deviations in contrast to the S types (below approximately 147 dB for IMI-30 and -23 dB for MBES). For the M type, the IMI-30 data for R2320 and R2321 transects shows the medium average ABI (approximately 149 dB) between the C type and the S type (Figure 5A). On the other hand, the average values of the M types from the MBES data (approximately −19 dB) show no significant difference from the C type, but they are higher than the S type (Figure 5B). Especially, the M type of the R2318 transect even shows slightly higher average values but higher standard deviations than the C type (Figure 5B). Resultantly, both the IMI-30 and the MBES data show that seafloor types containing the CFC (i.e., C and M types) exhibit significantly higher average intensities with a small standard deviation compared to the S type.
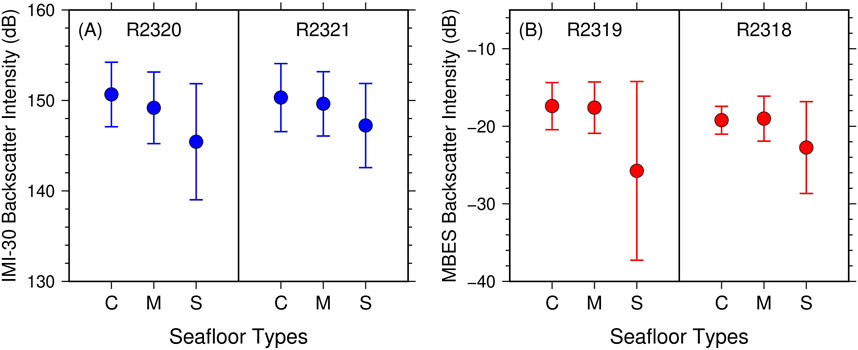
Figure 5. Comparisons of seafloor types defined by visual survey and ABI data from (A) IMI-30 system for the northwestern–western area (R2320 and R2321) and (B) MBES for the southwestern–southern area (R2319 and R2318). Circle = average ABI for each seafloor type and vertical bar = one standard deviation (1σ).
3.4 CFC thickness
To estimate the volume of CFC distributed on the KC-8 seamount, we collected CFC core samples using the KROCS during the ROV visual survey. A total of 26 CFC cores were retrieved (see Figure 6). In the northwestern part of the study area (R2320, blocks 127–130), we obtained nine CFC cores with thicknesses ranging from 107.5 to 200 mm (Figure 6A). Moving to the western part (R2321, blocks 131–134), we collected seven CFC cores with varying thicknesses from 55 to 250 mm, the thickest CFC within the study area (Figure 6B). In the southwestern part (R2319, blocks 134–136), four CFC cores were retrieved with thicknesses ranging from 40to 130 mm (Figure 6C). Lastly, at the southern part (R2318, blocks 137–139), six CFC cores were collected with thicknesses between 50 and 150 mm (Figure 6D).
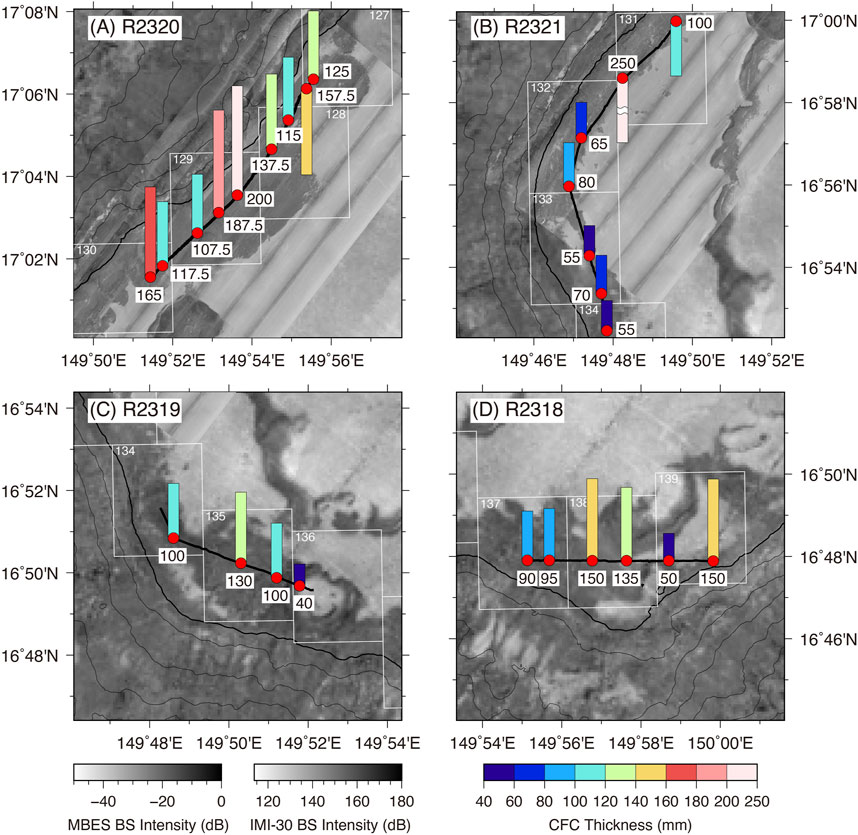
Figure 6. Variation of CFC thickness along ROV transects of (A) R2320, (B) R2321, (C) R2319, and (D) R2318 from northwest to south of the study area. Red circle = CFC coring location and vertical bar = CFC thickness.
All the CFC cores tend to be thicker in the north compared to the south along similar longitudes (i.e., R2320 and R2321) and exhibit relatively thicker towards the east at similar latitudes (i.e., R2319 and R2318). This variation indicates that the formation environments and growth conditions for CFCs may differ between the western and the southern margins of the KC-8 seamount.
4 Discussion
4.1 Estimation of CFC distribution area
If seafloor video footage is available for all areas, it would be possible to accurately determine the CFC distribution area. However, as this method is impractical in terms of time and cost, the CFC distribution area is estimated by integrating video footage with ABI data from the IMI-30 and MBES.
We compared all the data along ROV transects. Our finding revealed that C type and M type seafloors are more predominantly observed with higher ABIs than those of S type (Figures 4, 5). Notably, the average ABI for the M type differs in the IMI-30 and MBES data, with IMI-30 showing medium values between C and S types (Figure 5A) and MBES showing values similar to the C type (Figure 5B). This indicates that the MBES data for M type reflected the hardness of the CFCs rather than distinguishing the acoustic contribution of partially covered sediments due to their low resolution (Joo et al., 2020). On the other hand, the average ABI for the M type appears to be lower than that for the C type, likely because the high-resolution IMI-30 data can reflect the contribution of thin sediment layers, which reduces the ABI. Despite some sediment content, the lower bounds of ABI for the M type are consistently higher than the S type, suggesting CFC contribution to ABI. These results indicate that the ABIs from the IMI-30 and the MBES can be suitable for estimating the spatial distribution of CFCs.
While the M type could be considered a potential CFC, we utilize the average ABI of the C type for each transect as the criteria of CFC classification to conservatively constrain the spatial distribution of CFCs for each exploration block. The applicability of the cutoff criterion is discussed in detail below. Initially, we identified the area shallower than 1,600 m depth as the flat summit area of the KC-8 seamount (Figure 7A). We then selected areas where the ABI values of the summit area were greater than or equal to the average ABI of the C type of each transect (Table 1; Figure 7B). The total estimated CFC distribution area for contract blocks is 63.77 km2, showing high variations ranging from 2.68 km2 to 7.86 km2 without any trend from the northwest margin (127–133 blocks) to the southern margin (134–139 blocks) (Table 1).
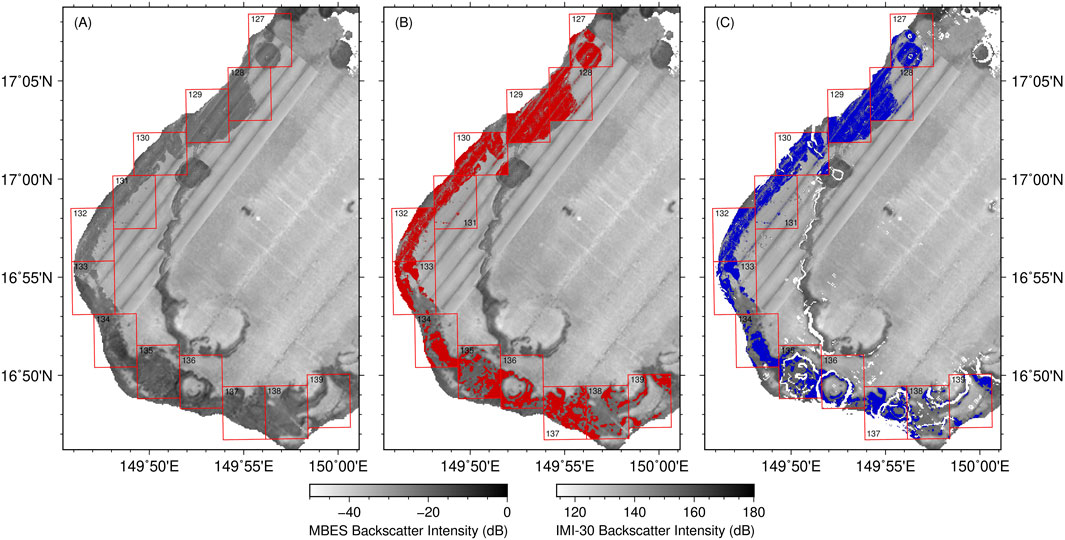
Figure 7. Spatial distribution map of CFC at the summit area of the KC-8 seamount. (A) Identified summit area where is shallower than 1,600 m depth. The background data is MBES and IMI-30 acoustic backscatter datasets. (B) Estimated CFC distribution area (reddish color) and (C) re-estimated CFC distribution area (blueish color) considering gentle slope (<10°).
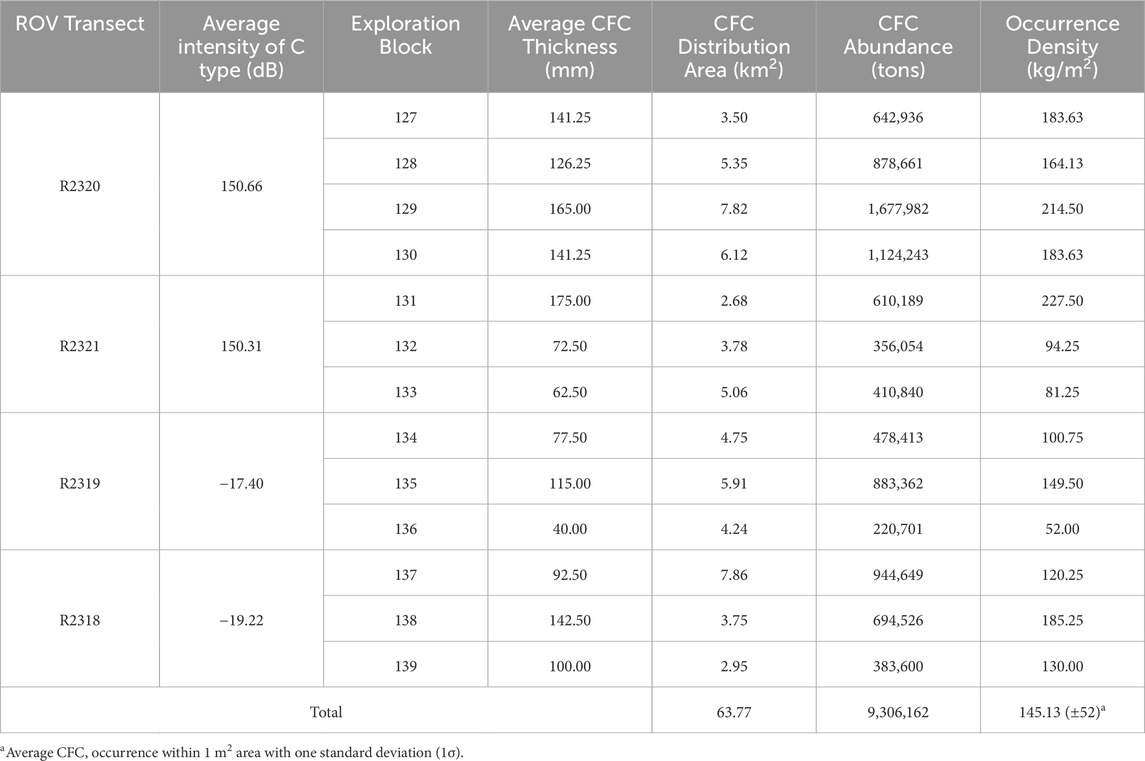
Table 1. Average ABI for the C type and CFC thickness along ROV transects. For each exploration block CFC distribution area, abundance, and occurrence density were summarized.
We verified how accurately the average ABIs from MBES and IMI-30 for the C type, applied as criteria to determine the CFC distribution area, reflect the actual seafloor conditions. To do this, the ABIs measured at locations classified as C, M, and S types from the video footage were compared against the average ABI for the C type. Depending on the length of the ROV survey lines and the consistency of the seafloor conditions, available ABI data from 301 to 1,119 points were compared. For instance, we assigned 30% accuracy if 30 out of 100 locations showed ABIs higher than the criterion. On R2320 and R2321 transects, where high-resolution IMI-30 ABI data are available, the locations identified as C and M types demonstrate accuracies ranging from 67% to 82%, while the S type locations show accuracies of 38% and 39%, respectively (Table 2). Such high accuracies observed in the locations of C and M types suggest well-defined ABI criteria. The lower ABIs in 18%–33% locations are likely natural, as visual seafloor classification during the ROV survey was based on changes in seafloor conditions. The locations captured shortly after the seafloor changes probably reflect contributions from both C (or M) and S types, leading to a decrease in ABI below the criterion. The accuracies of 38% and 39% for the S type locations, which are theoretically expected to be 0%, are also likely caused by the same reason. In the case of R2319 and R2318 transects, where MBES data are available, comparatively low accuracies are observed for the C type (47% and 32%, respectively) and the S type (34% and 32%, respectively). However, the accuracies for the M type remain notable (56% and 66%, respectively). Such low accuracies for the C type are caused by the low spatial resolution of MBES because a single ABI from MBES represents an area of 100 m x 100 m where S type contribution could be significant within the area, which decreases the ABI. Nevertheless, ABIs from MBES are still useful in outlining the CFC distribution area because of their high affinity with ABI from IMI-30, as shown in Figure 2 (e.g., Yang et al., 2020; Yao et al., 2021; Kaji et al., 2023; Pillai et al., 2023).
Overall, our study demonstrates that high-resolution ABI data can successfully delineate the CFC distribution area, although marginal issues may arise where the seafloor transitions between sediments and CFC. When applying comparatively low-resolution ABI data, it should be noted that data verification through comparison with high-resolution data, even in selected sections, is essential.
4.2 Resource potential in the KC-8 seamount
The comprehensive analysis of CFC abundance in the KC-8 seamount, incorporating high-resolution acoustic data, visual observations, and core sampling, provides a detailed assessment of the CFC resource potential. Thus, we estimated the volume and abundance of CFC for each exploration block using the CFC thickness variations (Figure 6) and the CFC distribution areas (Figure 7B). The volumes of CFCs are calculated by multiplying the distribution areas by the average thickness of CFCs in each block. Then, we estimate the CFC abundance, based on a dry-bulk CFC density of 1,300 kg/m3 (Hein et al., 2000).
A total abundance is estimated to ∼9,300,000 tons with an average occurrence of 147.84 kg/m2 ranging widely from 52.00 kg/m2 to 227.50 kg/m2 (Table 1). Depending on changes in the thickness and distribution area, CFC abundance shows significant variation between blocks with differences of >1,000,000 tons even along the same survey transect. Nevertheless, the northwestern blocks (blocks 127–130) exhibit the highest CFC abundance in the study area, which is likely due to the relatively thick and stable CFC layers rather than highly variable distribution areas. Although variations in CFC thickness play a crucial role in resource estimation, comparable to the importance of distribution area, we utilize a limited number of retrieved cores and thus could not fully obtain thickness information. To refine the estimate of CFC abundance, it is essential to acquire more thickness data through drilling and, to some extent, employ geophysical survey techniques for continuous thickness measurement (e.g., Thornton et al., 2011; Hong et al., 2019; Neettiyath et al., 2021).
Recent numerical performance modeling and actual sea trials of CFC mining equipment proposed that mining operation is effective in gentle slope areas (<10°), which are more accessible to mining equipment (Hein et al., 2009; Xie et al., 2022). Considering the future mining operation, we also defined areas with gentle slopes (<10°), even on the flat summit of the seamount. From the CFC distribution map (Figure 7B), we thus exclude areas of >10° slopes and recalculate the distribution area (Figure 7C). Fortunately, the drilling locations were not affected by this screening process, and the CFC thickness data were used for abundance estimation. The re-estimated CFC abundance for each exploration block is presented in Table 3. Compared to the initial estimation, total CFC abundance is reduced to 82% due to cutoff of high-slope areas. According to topographical characteristics, quite different ranges of reduction rates are observed. In the northwestern and western areas (blocks 127–134), most of the steep edges were excluded, leading to 2%–20% reductions in CFC abundance. In comparison, a high reduction was observed in the southern area (blocks 135–139), where higher relief features, such as parasitic cones, were excluded, resulting in a maximum reduction of 43%. Despite the greater reduction in the southern area, the substantial total residual abundance (82%) suggests that most of the northwestern and western CFC areas are topographically gentle and, therefore, suitable for future mining. As previously noted, well-developed CFCs are distributed in these areas.
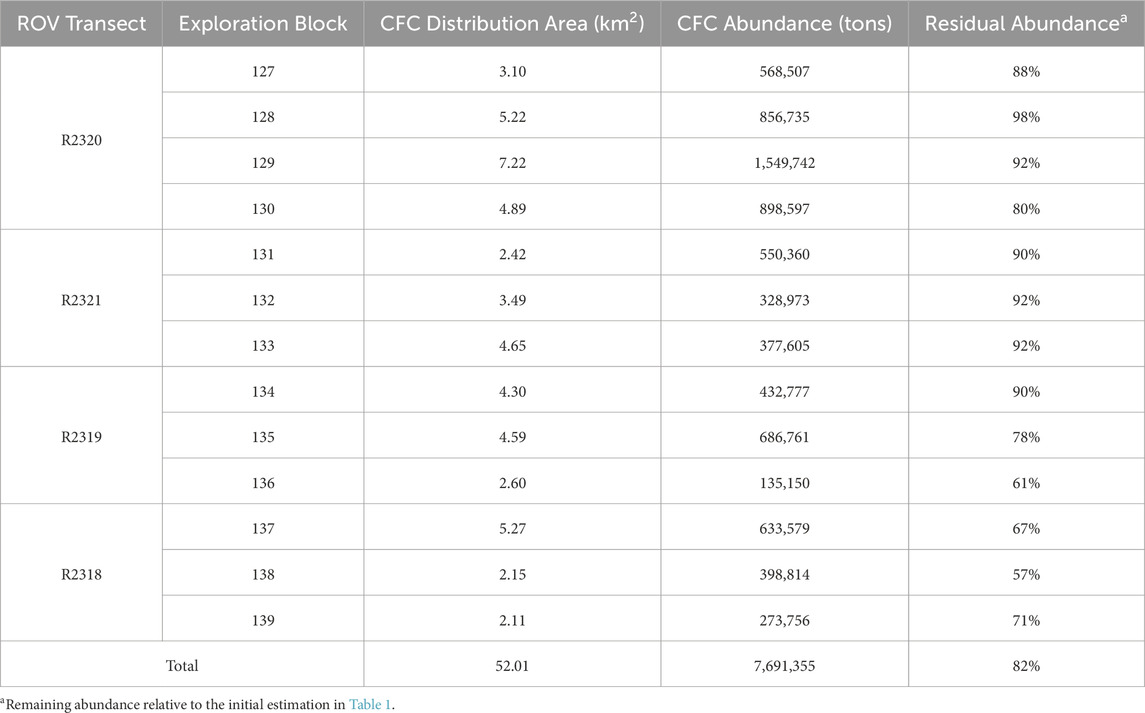
Table 3. Re-estimated CFC distribution area, abundance, and remaining proportion for each exploration block considering gentle slope summit areas (<10°).
5 Conclusion
We estimated the distribution area and abundance of CFCs in the summit area of the KC-8 seamount using acoustic data, visual observations, and core sampling. The thickness of CFCs throughout the study area ranged from 40 to 250 mm. Despite significant variability in thickness, even between adjacent sites, CFCs in the northwestern region were generally thicker and less variable, with an average thickness of 145.8 mm. To determine the CFC distribution area, we applied a selection criterion based on the average ABI for the C type, which was verified through visual inspection and validated by comparison with site-specific ABI data. Although acoustic reflections exhibited deflections at the boundary between sediments and CFCs, the ABI data effectively delineated the CFC distribution area. Based on the thickness and calculation of the distribution area, we estimated the total CFC abundance to be ∼9,300,000 tons, with an average occurrence of 147.8 kg/m2. However, due to the highly variable thickness and spatial distribution, the occurrence density ranged widely from 52.0 to 227.5 kg/m2. Excluding areas with steep slopes (>10°), which are less favorable for future mining, the southern area showed a maximum reduction in resource potential of 43%, primarily due to the higher relief of parasitic cones. Nevertheless, the significant total residual abundance (82%) suggests that most of the northwestern and western CFC areas remain viable for future mining. Although this study relied on a limited number of in situ thickness measurements from coring, it is essential to acquire more detailed thickness data to improve the accuracy of the CFC abundance estimate. Additionally, combining thickness data with ABI data and visual inspections is crucial for accurately estimating resource abundance in areas where CFC distribution is highly variable.
Data availability statement
The datasets presented in this study can be found in online repositories. The names of the repository/repositories and accession number(s) can be found below: https://data.mendeley.com/datasets/n62dwrftcg/1.
Author contributions
GH: Data curation, Formal Analysis, Methodology, Visualization, Writing–original draft, Writing–review and editing. YK: Funding acquisition, Supervision, Writing–review and editing. SY: Data curation, Methodology, Writing–review and editing. WK: Conceptualization, Methodology, Project administration, Supervision, Validation, Writing–original draft, Writing–review and editing.
Funding
The author(s) declare that financial support was received for the research, authorship, and/or publication of this article. This research was a part of the project titled ‘Selection of prospective mining area for Co-rich ferromanganese crust in western Pacific seamounts: 3-D resource estimation and environmental impact evaluation’, funded by the Korean Ministry of Oceans and Fisheries, Korea (No. 20220509, RS-2022-KS221644).
Acknowledgments
We thank the ROV ROPOS pilots and technical team, and the captain and crew of the R/V ISABU for their critical contribution to the collection of the video data for this project. This paper was improved by the comments from the editor and the reviewers.
Conflict of interest
The authors declare that the research was conducted in the absence of any commercial or financial relationships that could be construed as a potential conflict of interest.
Publisher’s note
All claims expressed in this article are solely those of the authors and do not necessarily represent those of their affiliated organizations, or those of the publisher, the editors and the reviewers. Any product that may be evaluated in this article, or claim that may be made by its manufacturer, is not guaranteed or endorsed by the publisher.
References
Bagnitsky, A., Inzartsev, A., Pavin, A., Melman, S., and Morozov, M. (2011). “Side scan sonar using for underwater cables & pipelines tracking by means of AUV,” in 2011 IEEE symposium on underwater technology and workshop on scientific use of submarine cables and related Technologies (IEEE), 1–10. doi:10.1109/UT.2011.5774119
Ballard, R. D., Stager, L. E., Master, D., Yoerger, D., Mindell, D., Whitcomb, L. L., et al. (2002). Iron age shipwrecks in deep water off ashkelon, Israel. Am. J. Archaeol. 106, 151–168. doi:10.2307/4126241
Benites, M., González, J., Hein, J., Marino, E., Reyes, J., Millo, C., et al. (2023). Controls on the chemical composition of ferromanganese crusts from deep-water to the summit of the rio grande rise, south atlantic ocean. Mar. Geol. 462, 107094. doi:10.1016/j.margeo.2023.107094
Blondel, P. (2009). The handbook of sidescan sonar. Handb. Sidescan Sonar. doi:10.1007/978-3-540-49886-5
Blümel, M., Fisch, K., Franke, D., Frey, T., Froese, R., Greinert, J., et al. (2021). World Ocean review: the ocean, guarantor of life ? Sustainable use. Hamburg, Germany: Maribus. Available at: https://worldoceanreview.com/en/wor-7/.
Fonseca, L., and Mayer, L. (2007). Remote estimation of surficial seafloor properties through the application Angular Range Analysis to multibeam sonar data. Mar. Geophys. Res. 28, 119–126. doi:10.1007/s11001-007-9019-4
Gavrilov, A. N., and Parnum, I. M. (2010). Fluctuations of seafloor backscatter data from multibeam sonar systems. IEEE J. Ocean. Eng. 35, 209–219. doi:10.1109/JOE.2010.2041262
Glasby, G. P., Ren, X., Shi, X., and Pulyaeva, I. A. (2007). Co–rich Mn crusts from the Magellan Seamount cluster: the long journey through time. Geo-Marine Lett. 27, 315–323. doi:10.1007/s00367-007-0055-5
Halbach, P., Kriete, C., Prause, B., and Puteanus, D. (1989). Mechanisms to explain the platinum concentration in ferromanganese seamount crusts. Chem. Geol. 76, 95–106. doi:10.1016/0009-2541(89)90130-7
Hamilton, L. J., and Parnum, I. (2011). Acoustic seabed segmentation from direct statistical clustering of entire multibeam sonar backscatter curves. Cont. Shelf Res. 31, 138–148. doi:10.1016/j.csr.2010.12.002
Hein, J., Koschinsky, A., Bau, M., Manheim, F., Kang, J.-K., and Roberts, L. (2000). “Cobalt-rich ferromanganese crusts in the pacific,” in Handbook of marine mineral deposits, 239–279.
Hein, J. R., Conrad, T., Mizell, K., Banakar, V. K., Frey, F. A., and Sager, W. W. (2016). Controls on ferromanganese crust composition and reconnaissance resource potential, Ninetyeast Ridge, Indian Ocean. Deep Sea Res. Part I Oceanogr. Res. Pap. 110, 1–19. doi:10.1016/j.dsr.2015.11.006
Hein, J. R., Conrad, T. A., and Dunham, R. E. (2009). Seamount characteristics and mine-site model applied to exploration- and mining-lease-block selection for cobalt-rich ferromanganese crusts. Mar. Georesources Geotechnol. 27, 160–176. doi:10.1080/10641190902852485
Hein, J. R., and Koschinsky, A. (2014). “Deep-Ocean ferromanganese crusts and nodules,” in Treatise on geochemistry (Elsevier), 273–291. doi:10.1016/B978-0-08-095975-7.01111-6
Hein, J. R., Koschinsky, A., and Halliday, A. N. (2003). Global occurrence of tellurium-rich ferromanganese crusts and a model for the enrichment of tellurium. Geochim. Cosmochim. Acta 67, 1117–1127. doi:10.1016/S0016-7037(02)01279-6
Hein, J. R., Mizell, K., Koschinsky, A., and Conrad, T. A. (2013). Deep-ocean mineral deposits as a source of critical metals for high- and green-technology applications: comparison with land-based resources. Ore Geol. Rev. 51, 1–14. doi:10.1016/j.oregeorev.2012.12.001
Hein, J. R., Spinardi, F., Okamoto, N., Mizell, K., Thorburn, D., and Tawake, A. (2015). Critical metals in manganese nodules from the Cook Islands EEZ, abundances and distributions. Ore Geol. Rev. 68, 97–116. doi:10.1016/j.oregeorev.2014.12.011
Hino, H., Usui, A., Morozumi, H., Suzuki, A., Kurihara, K., Suzuki, T., et al. (2023). Geological characterization and controlling factors of small-scale variations in the cobalt-rich ferromanganese crust deposits. Mar. Georesources Geotechnol. 42, 1063–1074. doi:10.1080/1064119X.2023.2249875
Hong, F., Feng, H., Huang, M., Wang, B., and Xia, J. (2019). China’s first demonstration of cobalt-rich manganese crust thickness measurement in the western pacific with a parametric acoustic probe. Sensors 19, 4300. doi:10.3390/s19194300
Hughes Clarke, J. (1994). Toward remote seafloor classification using the angular response of acoustic backscattering: a case study from multiple overlapping GLORIA data. IEEE J. Ocean. Eng. 19, 112–127. doi:10.1109/48.289456
Ingram, B., Hein, J., and Farmer, G. (1990). Age determinations and growth rates of Pacific ferromanganese deposits using strontium isotopes. Geochim. Cosmochim. Acta 54, 1709–1721. doi:10.1016/0016-7037(90)90402-7
Jackson, D. R., and Richardson, M. D. (2007). High-frequency seafloor acoustics. New York, NY: Springer New York. doi:10.1007/978-0-387-36945-7
Jackson, D. R., Winebrenner, D. P., and Ishimaru, A. (1986). Application of the composite roughness model to high-frequency bottom backscattering. J. Acoust. Soc. Am. 79, 1410–1422. doi:10.1121/1.393669
Joo, J., Kim, J., Ko, Y., Kim, S.-S., Son, J., Pak, S. J., et al. (2016). Characterizing geomorphological properties of western pacific seamounts for cobalt-rich ferromanganese crust resource assessment. Econ. Environ. Geol. 49, 121–134. doi:10.9719/EEG.2016.49.2.121
Joo, J., Kim, S. S., Choi, J. W., Pak, S. J., Ko, Y., Son, S. K., et al. (2020). Seabed mapping using shipboard multibeam acoustic data for assessing the spatial distribution of ferromanganese crusts on seamounts in the western pacific. Minerals 10, 155. doi:10.3390/min10020155
Josso, P., Hall, A., Williams, C., Le Bas, T., Lusty, P., and Murton, B. (2023). Application of random-forest machine learning algorithm for mineral predictive mapping of Fe-Mn crusts in the World Ocean. Ore Geol. Rev. 162, 105671. doi:10.1016/j.oregeorev.2023.105671
Kaji, T., Yono, O., Okada, K., Hino, H., and Morozumi, H. (2023). Acoustic estimation of ferromanganese crust exposure and sediment cover in a Northwest Pacific seamount using statistical analyses of shipboard multibeam acoustic data. Mar. Georesources Geotechnol. 0 42, 1210–1225. doi:10.1080/1064119X.2023.2261015
Kim, J., Ko, Y.-T., Hyeong, K., and Moon, J.-W. (2013). Geophysical and geological exploration of cobalt-rich ferromanganese crusts on a seamount in the western pacific. Econ. Environ. Geol. 46, 569–580. doi:10.9719/EEG.2013.46.6.569
Koppers, A. A. P., Staudigel, H., Wijbrans, J. R., and Pringle, M. S. (1998). The Magellan seamount trail: implications for Cretaceous hotspot volcanism and absolute Pacific plate motion. Earth Planet. Sci. Lett. 163, 53–68. doi:10.1016/S0012-821X(98)00175-7
Koschinsky, A., Hein, J. R., Kraemer, D., Foster, A. L., Kuhn, T., and Halbach, P. (2020). Platinum enrichment and phase associations in marine ferromanganese crusts and nodules based on a multi-method approach. Chem. Geol. 539, 119426. doi:10.1016/j.chemgeo.2019.119426
Ling, H. F., Burton, K. W., O’Nions, R. K., Kamber, B. S., von Blanckenburg, F., Gibb, A. J., et al. (1997). Evolution of Nd and Pb isotopes in Central Pacific seawater from ferromanganese crusts. Earth Planet. Sci. Lett. 146, 1–12. doi:10.1016/S0012-821X(96)00224-5
Lusty, P. A. J., Hein, J. R., and Josso, P. (2018). Formation and occurrence of ferromanganese crusts: earth’s storehouse for critical metals. Elements 14, 313–318. doi:10.2138/gselements.14.5.313
Nakanishi, M., Tamaki, K., and Kobayashi, K. (1992). Magnetic anomaly lineations from late jurassic to early cretaceous in the West-central pacific ocean. Geophys. J. Int. 109, 701–719. doi:10.1111/j.1365-246X.1992.tb00126.x
Neettiyath, U., Thornton, B., Sangekar, M., Nishida, Y., Ishii, K., Bodenmann, A., et al. (2021). Deep-Sea robotic survey and data processing methods for regional-scale estimation of manganese crust distribution. IEEE J. Ocean. Eng. 46, 102–114. doi:10.1109/JOE.2020.2978967
Nozaki, T., Tokumaru, A., Takaya, Y., Kato, Y., Suzuki, K., and Urabe, T. (2016). Major and trace element compositions and resource potential of ferromanganese crust at Takuyo Daigo Seamount, northwestern Pacific Ocean. Geochem. J. 50, 527–537. doi:10.2343/geochemj.2.0430
Okamoto, N., and Usui, A. (2014). Regional distribution of Co-rich ferromanganese crusts and evolution of the seamounts in the northwestern pacific. Mar. Georesources Geotechnol. 32, 187–206. doi:10.1080/1064119X.2013.877110
Pillai, R., Varghese, S., and Prasad, P. D. (2023). A multi-proxy approach for delineation of ferromanganese mineralization from the West Sewell Ridge, Andaman Sea. Mar. Georesources Geotechnol. 41, 1440–1464. doi:10.1080/1064119X.2022.2146552
Quinn, R., Dean, M., Lawrence, M., Liscoe, S., and Boland, D. (2005). Backscatter responses and resolution considerations in archaeological side-scan sonar surveys: a control experiment. J. Archaeol. Sci. 32, 1252–1264. doi:10.1016/j.jas.2005.03.010
Sakellariou, D., Georgiou, P., Mallios, A., Kapsimalis, V., Kourkoumelis, D., Micha, P., et al. (2007). Searching for ancient shipwrecks in the aegean sea: the discovery of chios and kythnos hellenistic wrecks with the use of marine geological-geophysical methods. Int. J. Naut. Archaeol. 36, 365–381. doi:10.1111/j.1095-9270.2006.00133.x
Segl, M., Mangini, A., Beer, J., Bonani, G., Suter, M., and Wölfli, W. (1989). Growth rate variations of manganese nodules and crusts induced by paleoceanographic events. Paleoceanography 4, 511–530. doi:10.1029/PA004i005p00511
Tang, L., Dong, Y., Chu, F., Chen, L., Ma, W., and Liu, Y. (2019). Geochemistry and age of seamounts in the West Pacific: mantle processes and petrogenetic implications. Acta Oceanol. Sin. 38, 71–77. doi:10.1007/s13131-019-1371-0
Thornton, B., Bodenmann, A., Asada, A., Ura, T., Sangekar, M., Ohira, K., et al. (2011). “Acoustic and visual survey of manganese crusts using an underwater vehicle at #5 Takuyo seamount,” in 2011 IEEE symposium on underwater technology and workshop on scientific use of submarine cables and related Technologies (IEEE), 1–9. doi:10.1109/UT.2011.5774098
Usui, A., and Okamoto, N. (2010). Geophysical and geological exploration of cobalt-rich ferromanganese crusts: an attempt of small-scale mapping on a Micronesian seamount. Mar. Georesources Geotechnol. 28, 192–206. doi:10.1080/10641190903521717
Usui, A., and Someya, M. (1997). Distribution and composition of marine hydrogenetic and hydrothermal manganese deposits in the northwest Pacific. Geol. Soc. Lond. Spec. Publ. 119, 177–198. doi:10.1144/GSL.SP.1997.119.01.12
Xie, C., Chen, M., Wang, L., Agee, C., Yao, S., Zheng, J., et al. (2022). A study on the performance modeling method for a deep-sea cobalt-rich crust mining vehicle. Minerals 12, 1521. doi:10.3390/min12121521
Yang, K., Ma, W., Zhang, W., Li, Z., He, G., Li, X., et al. (2023). Geological and geochemical characteristics of shallow-buried ferromanganese crusts from Weijia Guyot and their resource potential. Mar. Geol. 464, 107119. doi:10.1016/j.margeo.2023.107119
Yang, Y., He, G., Ma, J., Yu, Z., Yao, H., Deng, X., et al. (2020). Acoustic quantitative analysis of ferromanganese nodules and cobalt-rich crusts distribution areas using EM122 multibeam backscatter data from deep-sea basin to seamount in Western Pacific Ocean. Deep. Res. Part I Oceanogr. Res. Pap. 161, 103281. doi:10.1016/j.dsr.2020.103281
Yang, Y., He, G., Zhu, K., Yao, H., Ma, J., Yang, S., et al. (2016). Classification of seafloor geological types of Qianyu seamount from Mid-Pacific seamounts using multibeam backscatter intensity data. Diqiu Kexue - Zhongguo Dizhi Daxue Xuebao/Earth Sci. - J. China Univ. Geosci. 41, 718–728. doi:10.3799/dqkx.2016.061
Yao, H.-Q., Liu, Y. G., Yang, Y., Ma, J.-F., Zhang, H. D., Ren, J. B., et al. (2021). Assessment of acoustic backscatter intensity surveying on deep-sea ferromanganese crust: constraints from Weijia Guyot, western Pacific Ocean. China Geol. 4, 1–11. doi:10.31035/cg2020046
Yeo, I. A., Howarth, S. A., Spearman, J., Cooper, A., Crossouard, N., Taylor, J., et al. (2019). Distribution of and hydrographic controls on ferromanganese crusts: tropic Seamount, Atlantic. Ore Geol. Rev. 114, 103131. doi:10.1016/j.oregeorev.2019.103131
Keywords: cobalt-rich ferromanganese crusts, CFC thickness, resource abundance, deep-sea survey, West Pacific
Citation: Hwang G, Ko Y, Yang S and Kim W (2024) Resource abundance of cobalt-rich ferromanganese crusts in the KC-8 seamount, West Pacific. Front. Earth Sci. 12:1495673. doi: 10.3389/feart.2024.1495673
Received: 13 September 2024; Accepted: 21 October 2024;
Published: 30 October 2024.
Edited by:
Claudia Belviso, National Research Council (CNR), ItalyReviewed by:
Luigi Jovane, University of São Paulo, BrazilIuliu Bobos, University of Porto, Portugal
Copyright © 2024 Hwang, Ko, Yang and Kim. This is an open-access article distributed under the terms of the Creative Commons Attribution License (CC BY). The use, distribution or reproduction in other forums is permitted, provided the original author(s) and the copyright owner(s) are credited and that the original publication in this journal is cited, in accordance with accepted academic practice. No use, distribution or reproduction is permitted which does not comply with these terms.
*Correspondence: Wonnyon Kim, d2tpbUBraW9zdC5hYy5rcg==
 Gyuha Hwang
 Youngtak Ko1
 Wonnyon Kim