 Yang Li
 Xiaodong Cheng
- China National Logging Corporation, Beijing, China
Fractured carbonate reservoirs are significantly developed in the eastern area of the Amu Darya Right Bank. However, their types, distributions, and fracture characteristics remain unclear. This uncertainty complicates reservoir prediction and hampers exploration and development processes. Given the strong correlation between fracture development and productivity, analyzing fractures is crucial. Comprehensive evaluation and prediction methods for fractured reservoirs are essential for advancing the oil and gas industry. Based on core and geological data analyses, it finds that these reservoirs exhibit low porosity and low to ultra-low permeability. By employing conventional logging alongside specialized methods, such as electrical imaging, nuclear magnetic resonance, and far detection logging, fractures and their effectiveness can be identified and evaluated, clarifying the characteristics of reservoir spaces. Constrained by the results from core and logging analyses, seismic single attribute analysis techniques is applied to predict fractures in the HX block of Amu Darya. To mitigate the limitations of single-attribute analysis, utilize a well-supervised BP neural network method for comprehensive fracture prediction. This multi-attribute approach increases the fracture prediction probability from less than 70%–72.7%. By integrating geological understanding and well logging, and considering the influence of lithology and structure on the reservoir, synthesize the fracture prediction results to optimally select favorable areas.
1 Introduction
Increasing attention was gathered on the fractured reservoirs coming from advancements in tight reservoir exploration (Panza et al., 2016; Felici et al., 2016). In the eastern area of the Amu Darya Right Bank, fractured carbonate reservoirs represent a crucial type characterized by strong heterogeneity, causing significant challenges for reservoir studies. Fractures is enhancing permeability and playing a critical role in hydrocarbon migration, considered as primary reservoir spaces (Aydin, 2000). Improving fracture identification and evaluation, as well as achieving effective fracture prediction, is essential for comprehensive evaluation and optimal area selection.
Seismic analysis is the main method for fracture prediction in the petroleum industry, divided into post-stack and pre-stack techniques (Jian et al., 2024), such as pre-stack anisotropy and pre-stack elastic parameter inversion (Wang et al., 2014; Zhang et al., 2015), and post-stack seismic single attribute prediction of fractures (Zhang et al., 2024). Since pre-stack technology has not yet achieved large-scale, robust application effects, this paper’s prediction is based on post-stack seismic attributes analysis. Techniques like seismic coherence analysis, curvature analysis, ant tracking, and seismic texture interpretation are effective for detecting fractures (Blumentritt et al., 2006; Chopra and Marfurt, 2007; Ganguly et al., 2009; Chen et al., 2015; Zhang et al., 2023; Gui et al., 2023), showing practical applications in imaging carbonate fractured reservoirs, fault identification and description, and fluid detection. However, the fracture development is often complicated. The seismic analysis is controlled by the quality of seismic data, and the seismic recognition is limited for small-scale fractures. Single seismic attributes are being impacted by factors such as reservoir and fluid properties, and leading to reduction in prediction accuracy. To address these issues, we analyze core and well logging data and employ a BP neural network method to improve prediction accuracy through nonlinear modeling and its learning capabilities.
In this paper, using geological, well logging and seismic data analysis comprehensively, to recognize and identify the fracture effectiveness, as well as predict fracture distribution with higher probability. The systematic research methods can be applied in similar fractured carbonate reservoirs to help oil and gas exploration and production.
2 Geological background
The Amu Darya Basin is located in the southeastern Turan Platform, described as a Mesozoic superimposed basin consists of several large structural units, such as the Kopettag Depression, Central Karakam Rise, Chardju Terrace, and Beshkent Depression (Xu et al., 2009; Wang, 2019). It is surrounded by folded mountains, trending northwest, about 1,000 km long and 400–500 km wide. The southwest part of the study basin is steep and narrow, while the northeast part is a gentle structural terrace. The right bank of the Amu Darya locates in the northeastern part of the Amu Darya Basin, bounded by the Amu Darya River to the southwest and the borders of Turkmenistan and Uzbekistan to the northeast, belonging to the Lebap Province of Turkmenistan (Guo et al., 2019; Chai et al., 2024). The structural map of the study area is in the eastern area of Amu Darya Right Bank, showing in Figure 1.
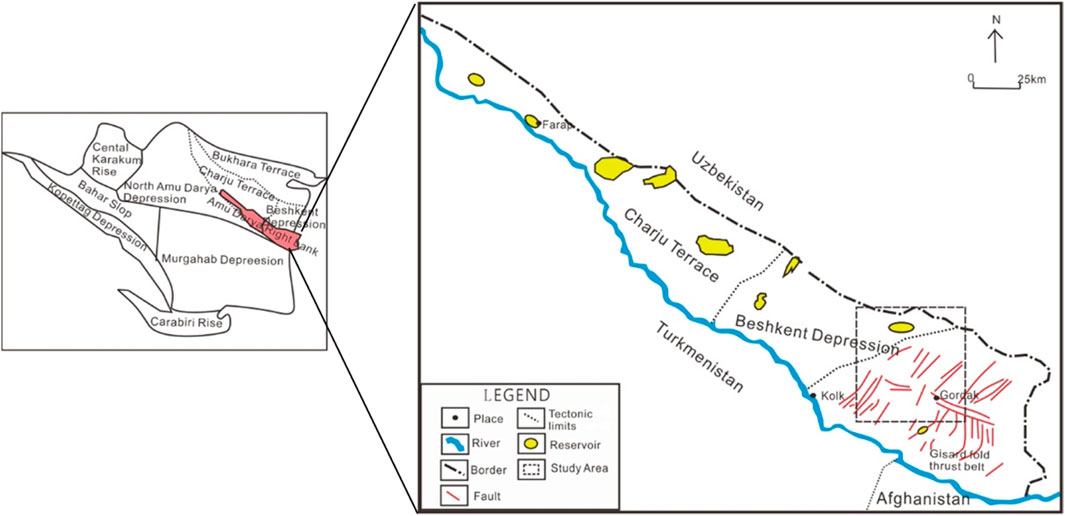
Figure 1. Structural map of eastern area of Amu Darya Right Bank.
The Amu Darya Basin has undergone four main tectonic movements: the Pre-Permian basement development, Permian-Triassic rifting, Jurassic-Paleogene Eocene post-rift depression, and Oligocene-Neogene compression uplift and reformation (Xu et al., 2009). Structural belts primarily exhibit a northeast-southwest trend, and the local structure is complex due to previous reverse faults and compressional folds. A thick gypsum rock layer from the Late Jurassic period serves as a sedimentary cap, dividing the area into upper and lower exploration series. Underneath this layer is the focused layer of this study, the Middle to Late Jurassic Callovian-Oxfordian carbonate rock. This set of strata develops five sets of layers from top to bottom: XVhp, XVa1, XVz, XVa2, and XVI (Xu et al., 2018), with the main gas-producing layer being XVhp, followed by XVa1 and XVa2, shown in Figure 2. Affected by the regional tectonic compression of the Himalayan orogeny, this area has been continuously subjected to reverse thrust compression from the Gissar direction in the southwest since the Neogene. Through that tectonic motion, a foreland thrust-fold belt is formed, as well as a series of gas-bearing thrust structures. The sub-salt fault system is mainly composed by some reverse faults and strike-slip faults, with the main directions being near northeast and near northwest.
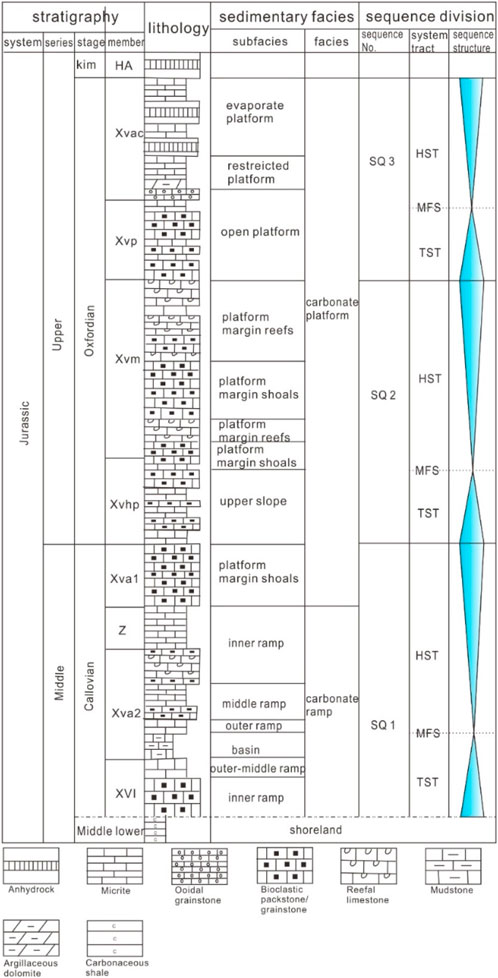
Figure 2. Lithology, stratigraphy and sequence structure map of Amu Darya formation.
3 Reservoir evaluation
3.1 Petrological characteristics
XRD analysis indicates that calcite is the predominant mineral in the Callovian-Oxfordian carbonate rocks, and the content range is 91%–99.5%, with an average content value of 97.2%. The content of clay is very low, with a maximum of 1.9%. Thin section analyses reveal diverse limestone types, including bioclastic sandy limestone, micritic bioclastic limestone, bioclastic sandy micritic limestone, algal clump-bearing bioclastic micritic limestone, bioclastic micritic limestone, etc. To analyze the influence of lithology on reservoir development systematically, nearly 300 thin slices were re-analyzed. Following Dunham’s classification, we categorize the limestones into grainstone, packstone, wackestone, and marlstone (Table 1a). The porosity value of reservoir ranges from 0.0% to 18.2%, averaging 1.86%. In the porosity distribution histogram (Table 1b), the main peak is <2.0%. The permeability value ranges from 0 to 3121.148mD, averaging 14.2 mD. In the permeability distribution histogram (Table 1c), the main peak is located at 0.001–0.01 mD, accounting for 46.5% of all samples. And samples with <0.1 mD account for 79.3% of all samples. Therefore, the reservoir porosity is low, and permeability is low to ultra-low.

Table 1. Petrological characteristics of study area.
3.2 Fracture identification and effectiveness evaluation
Both fractures and vugs are developed in the fractured carbonate reservoirs. Fractures serve as the main reservoir space, (Ma, 2020), while vugs are mainly residual pores. Therefore, how to identify fractures and evaluate the effectiveness has significant influence in the study of such reservoirs. Observing the thin slices and cores, it is found that the fractures mainly include diagenetic fractures and structural fractures (Figure 3), with structural fractures being predominant. Most of these are open fractures. Meanwhile, some fractures are completely or partially filled, through which the effectiveness of the fractures is reduced distinctly.
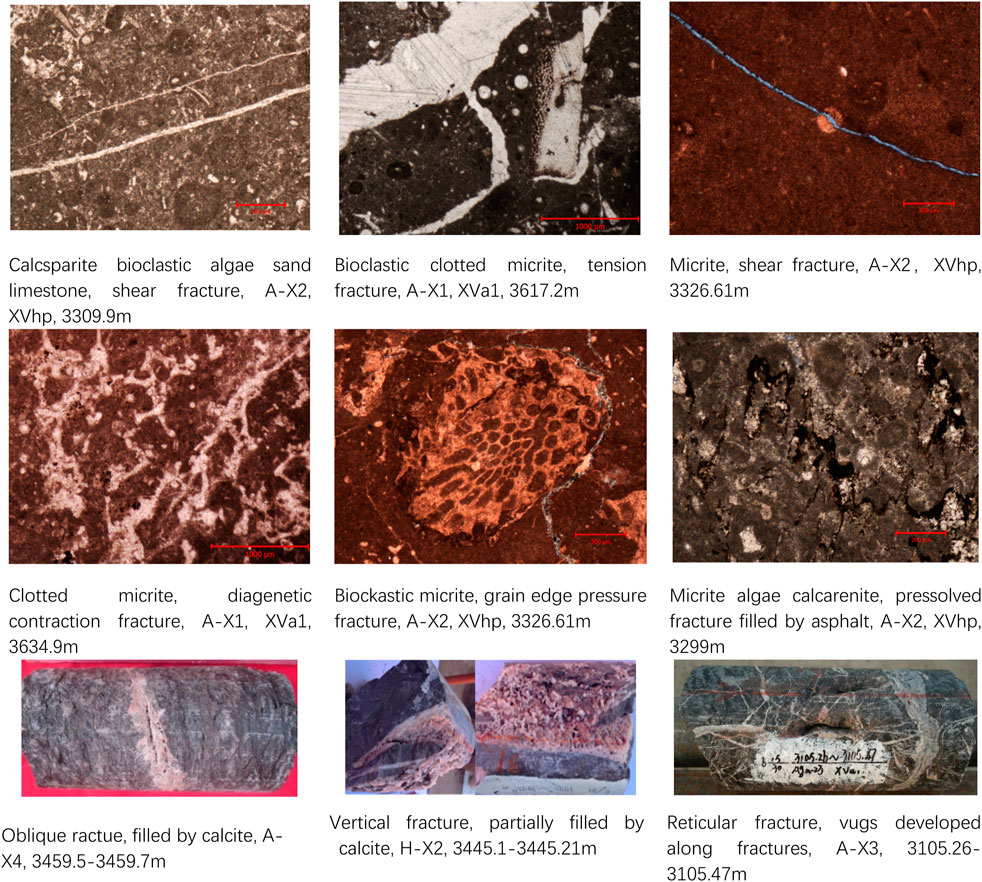
Figure 3. Thin slice and core analysis diagram.
Evaluating fracture effectiveness—openness, extension, and connectivity—is challenging. Currently, there are many methods for identifying fractures, but methods for evaluating fracture effectiveness are limited. Combining conventional logging with imaging data is effective for identifying fractures and vugs (Qi et al., 2018; Liao et al., 2023).
The fracture development degree and effectiveness can be determined by using the positive and negative differential characteristics and the difference magnitude between deep and shallow lateral resistivity logging.
In fractured reservoirs, different fracture angles produce varying logging responses, allowing us to distinguish fracture types using electrical imaging logging. When the fracture angle is 45°, the dual laterolog shows the maximum negative difference. When the fracture angle is 90°, it shows the maximum positive difference. By using electrical imaging logging analysis, the natural fractures and induced fractures can be directly distinguished. Natural fractures can be divided into vertical fractures, high angle fractures and horizontal fractures according to the fracture angle. The vertical open fracture is shown as a black near-vertical line, the high angle open fracture is shown as a thick dark sine curve, and the low angle open fracture is shown as a thin continuous dark sine curve. The induced fractures are generally dark in color and have clear features, but the continuity is poor, and they are often parallel to the secondary feathery fractures. The imaging data is used for fracture picking analysis, and the fracture parameters are calculated according to the fracture picking results. The secondary porosity can be evaluated by combining with the porosity spectrum characteristics. Through core calibration and comprehensive analysis, it is believed that the fracture openness and fracture porosity can be calculated through fracture picking, as well as the average porosity and standard deviation curves can be calculated through the porosity spectrum, which can be used as sensitive parameters or curves to analyze the permeability of fractured reservoirs. For nuclear magnetic resonance logging (CMR), the T2 spectrum has obvious response in fracture-developed sections, with the presence of back-end signals >960 ms, which can be used as an auxiliary means for reservoir fracture identification. The open fractures passing through the borehole have an impact on the propagation characteristics of stoneley waves and shear waves, which are reflected in array sonic logging and can be used for fracture identification. The above-discussed methods for determining fracture effectiveness are limited by detection depth and can only identify fracture development near the borehole. Therefor, it is difficult to study lateral changes in the reservoir or the outward extension and development of borehole fractures. By using electrical imaging characteristics, referring to array sonic waveform characteristics, dispersion characteristics, and the fracture development situation around the well provided by far detection imaging (Wei et al., 2021), the development and effectiveness of fractures and vugs within a 10 m range around the well can be comprehensively evaluated.
In Figure 4, it is the 3452–3454 m interval logging responses of well H-X2, which shows low gamma-ray values indicating pure lithology. The dual laterolog values decrease and the separation amplitude is large, and the porosity curve does not change significantly. In the static electrical logging imaging, the black color indicates large fracture aperture. The porosity spectrum is wide and shifted backward. The stoneley waves have interference stripes, and both the longitudinal wave and stoneley wave amplitudes are attenuated. The nuclear magnetic resonance T2 spectrum shows a spectrum display around 100ms. In the sonic far detection image, reflected waves are obvious and extend spatially.
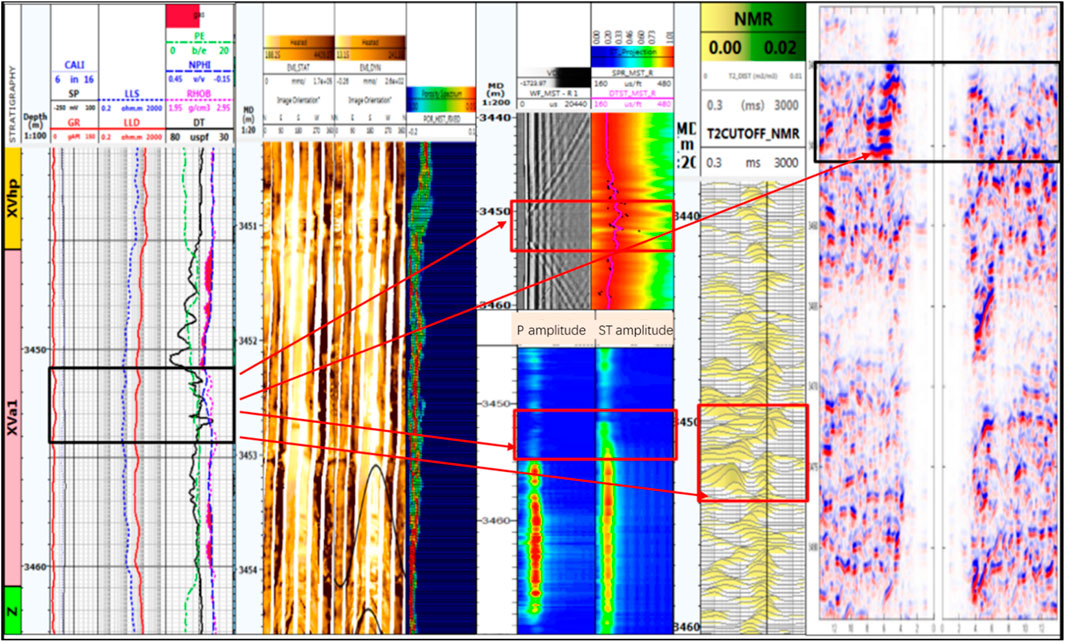
Figure 4. Integrated interpretation results map of H-X2 well (3452–3454 m).
3.3 Fracture characteristics
Through geological and multi-method logging identification analysis, it is concluded that fractures in the study area generally develop in an east-west direction, with some wells having a NE direction. Overall, they can be divided into two fracture sets: NW or NWW-trending and NE-trending sets (Figure 5). Combining the analysis of single well structural fracture orientation and the structural position, it is believed that the current maximum principal stress direction is near east-west, with slight variations in different areas, mainly NW-SE or NWW-SEE. The current maximum principal stress direction is basically consistent with the fracture orientation, indicating that the stress direction has not changed much since fracture formation, inheriting the regional compression direction since the Neogene. The open fractures interpreted from logging are basically consistent with or at an acute angle to the maximum principal stress direction, indicating that the current maximum principal stress direction is favorable for the preservation and opening of open fractures (Zhang, 2023).
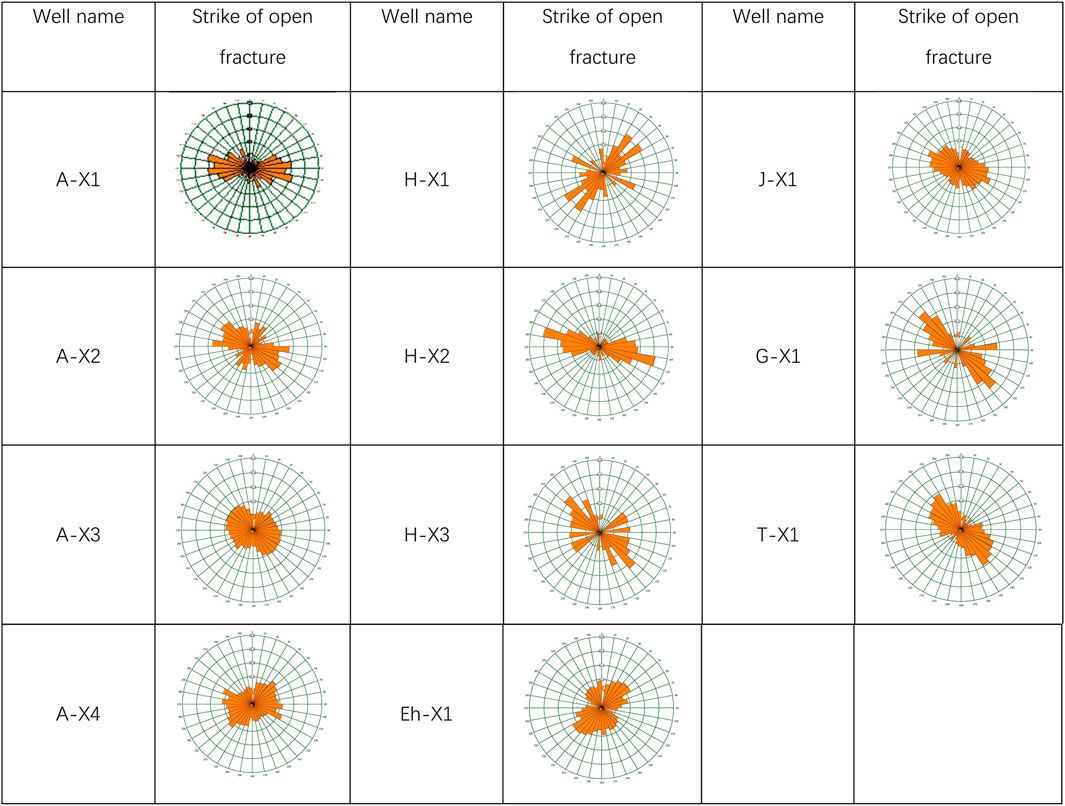
Figure 5. Fracture rose diagram of wells.
3.4 Controlling factors of fractures
3.4.1 Influence of lithology
Analysis of fracture width and length-area ratio (ratio of total fracture length to thin section area) in fractured thin slices reveals that grainstones have the smallest fracture length-area ratio and width, with averages of 196.2 m/m2 and 0.066 mm. Marlstones have a wider distribution range of fracture length-area ratio and width, but their length-area ratio and width are generally the largest among the four lithologies, with average length-area ratio and width of 675.8 m/m2 and 0.22 mm (Figure 6A). Among the thin slices analysis, structural fractures can account for 40% in wackestones and marlstones, while only about 20% or even less in grainstones and packstones (Figure 6B). This indicates that the fracture development intensity is generally lower in high-energy grainstones and packstones compared to low-energy wackestones and marlstones.
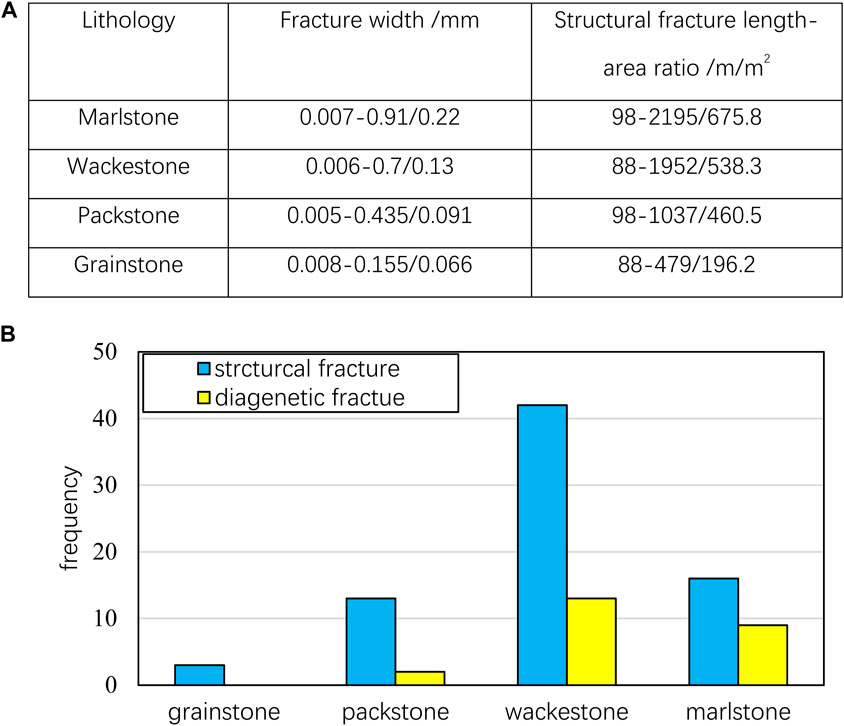
Figure 6. Characteristics of fractures in different rocks (A). Distribution range of structural fracture parameters of different types of limestone flakes. (B). Characteristics of fracture development in different types of limestones.
3.4.2 Influence of structure
The fractures development and distribution is influenced by structural situation and fold occurrence (Nelson, 2001; Mickael et al., 2012; Watkins et at., 2018). Through the analysis of fault activity intensity and well fracture density, it shows that the greater the fault displacement, indicating the stronger the fault activity, the greater the fracture development intensity or density (Figure 7A). Through the analysis of the relationship between the fracture density and distance of wells to the main fault, it shows that the closer to the main fault, the greater the fracture development density (Figure 7B). Therefore, the fault activity intensity significantly impacts fracture development—the stronger the fault activity and the closer to the fault, the higher the fracture intensity.
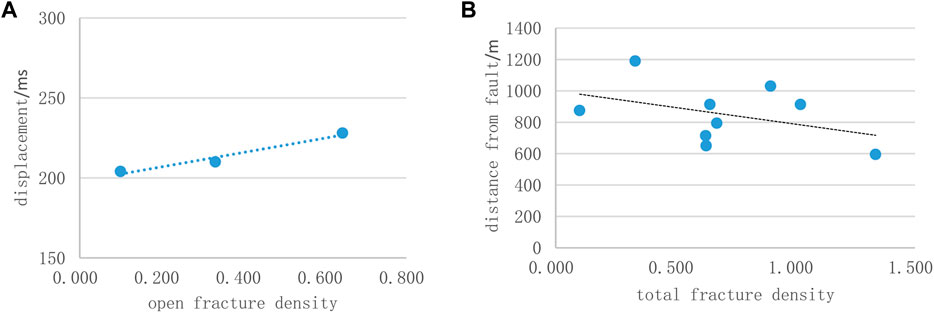
Figure 7. Relationship between fault characteristics and fracture density in HX block (A). Relationship between fault distance and fracture density in HX block (B). Relationship between fracture distance and fracture density.
In thrust-fold belt, fold occurrence controls fracture intensity and orientation (Price, 1966; Watkins et al., 2015). The HX block is a typical thrust-related anticline structure. Using 3D Move structural restoration and simulation software (Di et al., 2016), simulate and calculate the maximum principal strain of the top and bottom reflection layers of the carbonate rocks in the HX block (Figure 8). Simulations show greater fracture development in high-strain areas like fold hinges and forelimbs.
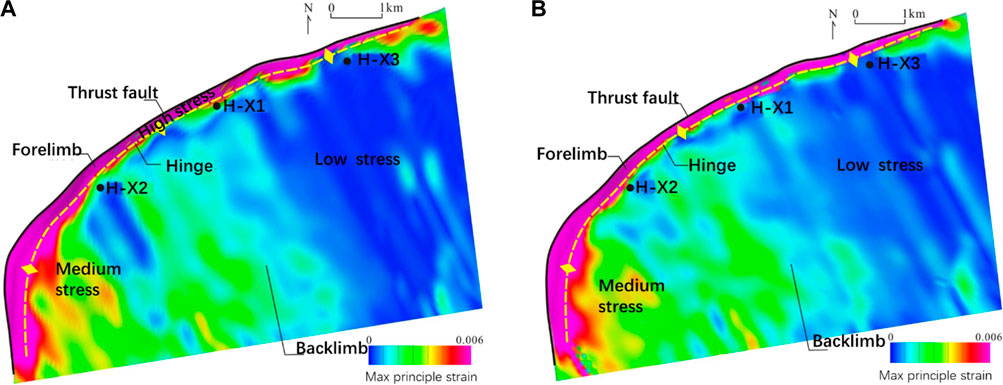
Figure 8. Simulation of the maximum principal strain of the top and bottom reflector of HX block (A). top horizon stress reflection (B). bottom horizon stress reflection.
4 Prediction of fracture areas
In fracture development zones, abnormal changes are caused in the amplitude, frequency, phase, and other characteristics of seismic wave reflection. Therefore, selecting sensitive mathematical methods, combining with analysis of anomaly of seismic wave amplitude, frequency, phase, and other attributes, can predict the fracture development situation. There are many commonly used seismic attributes, such as volume curvature, coherence, principal component analysis, seismic tensor, edge detection, texture, ant tracking, etc.
4.1 Single attribute prediction
Taking the HX block as an example, this paper summarizes a seismic multi-attribute fracture prediction method, which can be applied to the entire east part of the right bank of the Amu Darya. Based on seismic and well logging data, fractures can be recognized by seismic attributes study. Combined with logging interpretation of fractures, preferred seismic attributes of different scales are selected to comprehensively predict fracture distribution.
Curvature attribute is a common seismic attribute for predicting fractures. Curvature indicates the degree of structural deformation, as well as identifies the curvature characteristics caused by structural deformation such as folds and faults (Dun et al., 2013). There are many types of curvature attributes, such as maximum curvature, minimum curvature, positive curvature, average curvature, Gaussian curvature, etc. Because each curvature algorithm is different, curvature attribute can reflect certain geometric characteristics of the area seismic body from different aspects (Song, 2014; Saleh and Marfurt, 2006; Zhu, 2013).
Seismic coherence refers to the measurement of the similarity degree of waveform, amplitude, frequency, phase, and other seismic attributes between adjacent seismic traces. It is known that coherence technology is a useful method for discontinuity detection of seismic wave axis. Different coherence attributes reflect the interruption of coherent axis, which can identify large-scale faults in the study area. This method is quite useful when faults with clear fault displacement especially. Therefore, the extension morphology and distribution pattern of fractures and faults development areas can be clearly identified through coherence attribute analysis.
The ant body attribute initially sets the corresponding search range and direction, through which the ant signal will recognize the exist of faults or fractures. The ant signal has maximum deviation of 15% from the search direction when estimating faults. The principle of ant tracing such as search radius, search direction, step length, and stop search time is determined by different parameters.
The likelihood attribute is based on similarity algorithms. Discontinuities in seismic reflections usually correspond to the exist of faults. The stronger the discontinuity of reflection, the lower the similarity, and the more obvious the fault. The maximum fault probability attribute value can be calculated by scanning different fault dip angles and azimuths. Then the resulting fault probability body is refined in order to gain fault or fracture prediction results.
Figure 9 shows 4 kinds of seismic attribute profiles in HX block randomly selected from multiple attributes. Figure 9A is the strike curvature attribute profile. Different curvature attributes all can reflect the bending deformation of rock layers caused by structural activity, in which yellow and red indicates fracture development. The H-X4 well is located near a fault and is greatly affected by structural activity. Therefore, different curvatures identify high values of the strata near this well, reflecting strong deformation of formation around the well. Figure 9B shows the conventional coherence attribute profile of four wells. The large faults or fractures are reflected in the coherence attribute profile in dark color. In Figure 9C, the ant body attribute reflects faults as well as fractures near the wellbore in blue and black region, representing good prediction results. In Figure 9D, the likelihood attribute in colored areas shows reflections near the faults, while the reflections become more random away from faults.
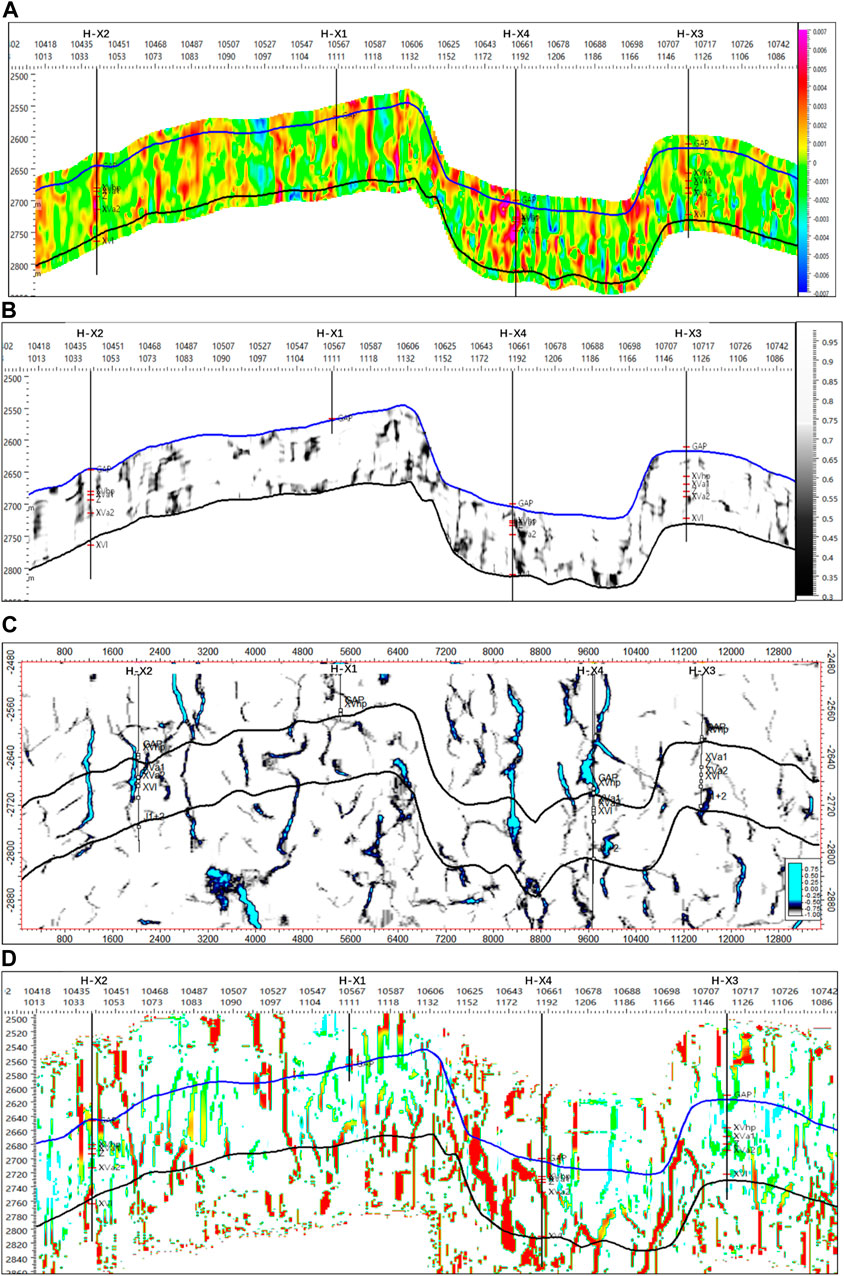
Figure 9. Fracture prediction profiles of seismic single attributes (A). Strike curvature attribute profile (B). Coherent attribute profile (C). Ant body attribute profile (D). likelihood attribute profile.
4.2 Multi-attributes prediction
Using single seismic attributes can predict fractures from a single perspective. Referring to the multi-solution and uncertainty of seismic data (Dong et al., 2004), the correlation and prediction accuracy between seismic attributes and fractures are different. In order to achieve better analysis of different attributes, a neural network method is used for multi-attribute analysis.
In this paper, a BP (Back-Propagation-Network) neural network method is applied for seismic multi-attribute fracture prediction. In BP network, each node is only connected with the adjacent layer nodes, and the nodes between the same layer are not connected. If the number of hidden layer nodes is large enough, it could approximate any complex nonlinear mapping. Through the iterative process of information forward propagation and error back propagation, the weights of each layer are constantly adjusted, and the neural network continues to learn and train until the network output error is reduced to an acceptable degree, or the pre-set learning times. In this paper, the neural network is trained by combining seismic attributes and well log fracture characteristics to establish a neural network training set. Then learning from the set, the connection weight coefficients between internal nodes, thresholds on the nodes, and their non-linear relationships within network can be determined. After that, combining the single attribute optimization results, use the existing seismic attributes as input data. The neural network calculates the input data based on the non-linear relationships obtained during training, and gain the fracture prediction results in the end.
After pre-processing of post-stack seismic data, training data and input attribute preparation are carried out, through the coherent and maximum positive curvature pickup binary pointsets of drilling calibration: Fractures and non-fractures include 9909 defined points for green fractures and 7972 defined points for pink non-fractures, accounting for 40% of the total test data (Figure 10A). In the process of network training, an intermediate layer (hidden layer) is set up. Through the quality control of training results, 49,100 iterations are made to determine the good prediction effect, as shown in Figure 10B. After neural network learning, highly correlated attributes are used as input data, such as curvature and ant body, to calculate and obtain the final fracture prediction attribute body. In the Figures 10C,D, it shows the top surface maps of 50%, and 90% fracture prediction probability bodies in yellow area. The higher the probability, the smaller the predicted fracture distribution area, and the higher the prediction accuracy. Fractures are most developed near faults. In the HX block, the fracture distribution is mainly parallel to the fault zone. What’s more, the existing well all in the fracture development zones.
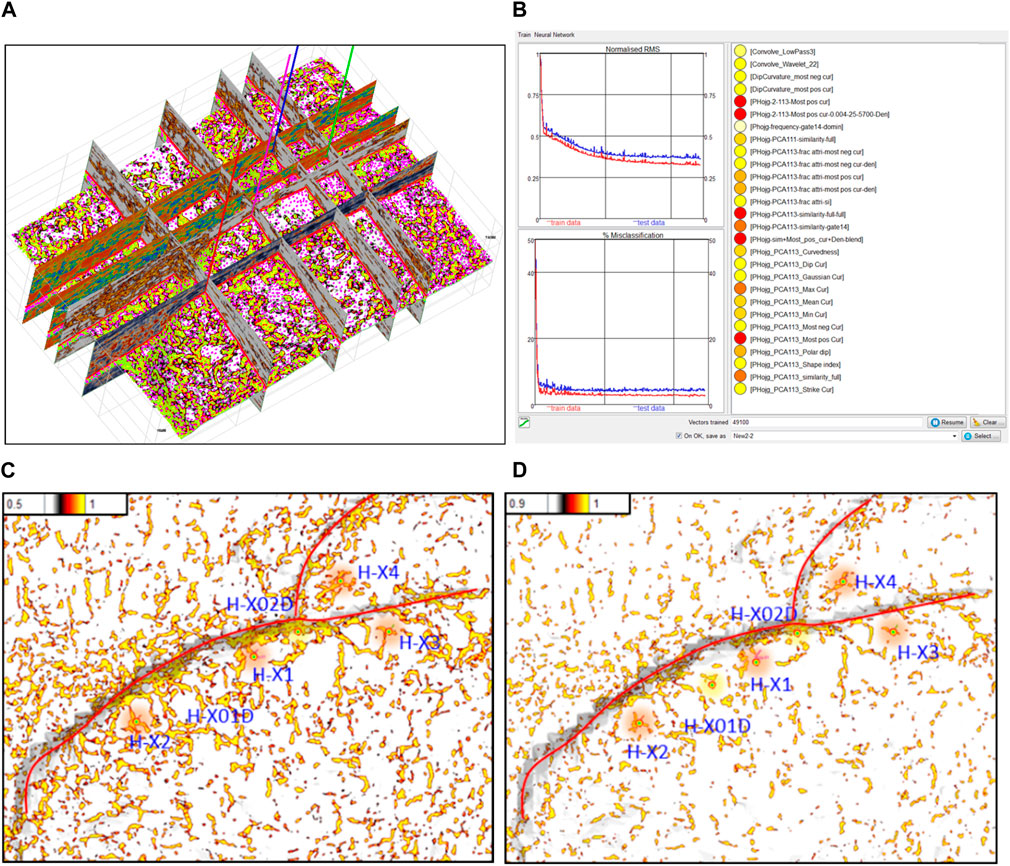
Figure 10. Calculation and prediction of fractures by neural network method (A). Training data define facture points (green) and non-fracture points (pink) (B). Quality control of training (C). 50% fracture prediction probability body (D). 90% fracture prediction probability body.
To reflect the effectiveness of seismic fracture prediction directly, and confirm the advantage of multi-attribute prediction, analyze the relationship of seismic attribute and logging fracture attribute. The accuracy of seismic fracture can be reflected by the above result semi-quantitatively. The correlation coefficient between relatively better seismic single attributes, such as maximum curvature, coherence, and frequency, and fracture density is less than70%. Figure 11A shows the intersection diagram of coherence attribute value and fracture density with the coherence coefficient is 68%. The intersection diagram of the BP neural network calculated attributes and the fracture density is shown in Figure 11B, and the correlation coefficient is 72.7%, which significantly improves the coincidence rate compared with the prediction of a single attribute.
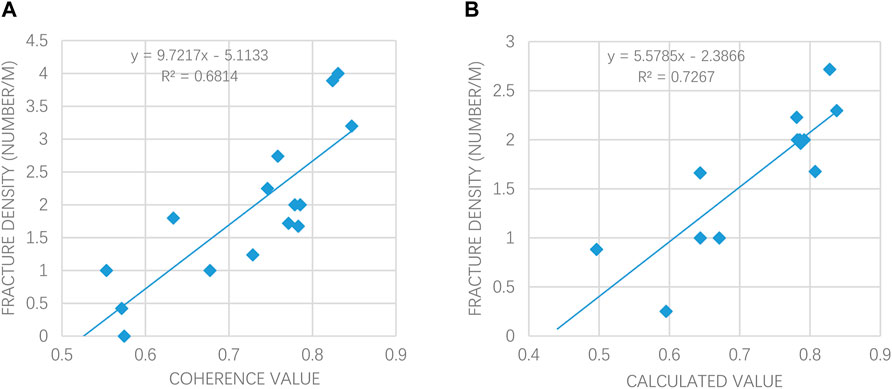
Figure 11. Correlation diagram between seismic attribute and fracture (A). Intersection diagram of coherence attribute and fracture density (B). Intersection diagram of BP calculated attribute and fracture density.
5 Discussion
5.1 Verification of prediction
Using the ant body attribute as an example (Figure 12A), the prediction results of fractures by seismic single attributes and well logging are compared. As shown in the figure, the H-X2 well imaging data identifies many fractures, and the well has good gas content and productivity. The ant body attribute detects high-angle fractures developed near this well in the target layer, which is consistent with production situation. Though the H-X1 well was only drilled to the top of XVhp formation, its good productivity indicates a high probability of fracture development. Meanwhile, the ant body predicts fractures developed at the top of this well. The H-X3 and H-X4 wells' imaging data recognize few fractures, with poor gas content and low productivity. The ant body attribute only identifies a few indistinct micro-fractures in the target formations of these wells. Through the compare of the four wells, it is known that he correlation between ant body fracture prediction and well logging identification is good, compounding prediction expectation.
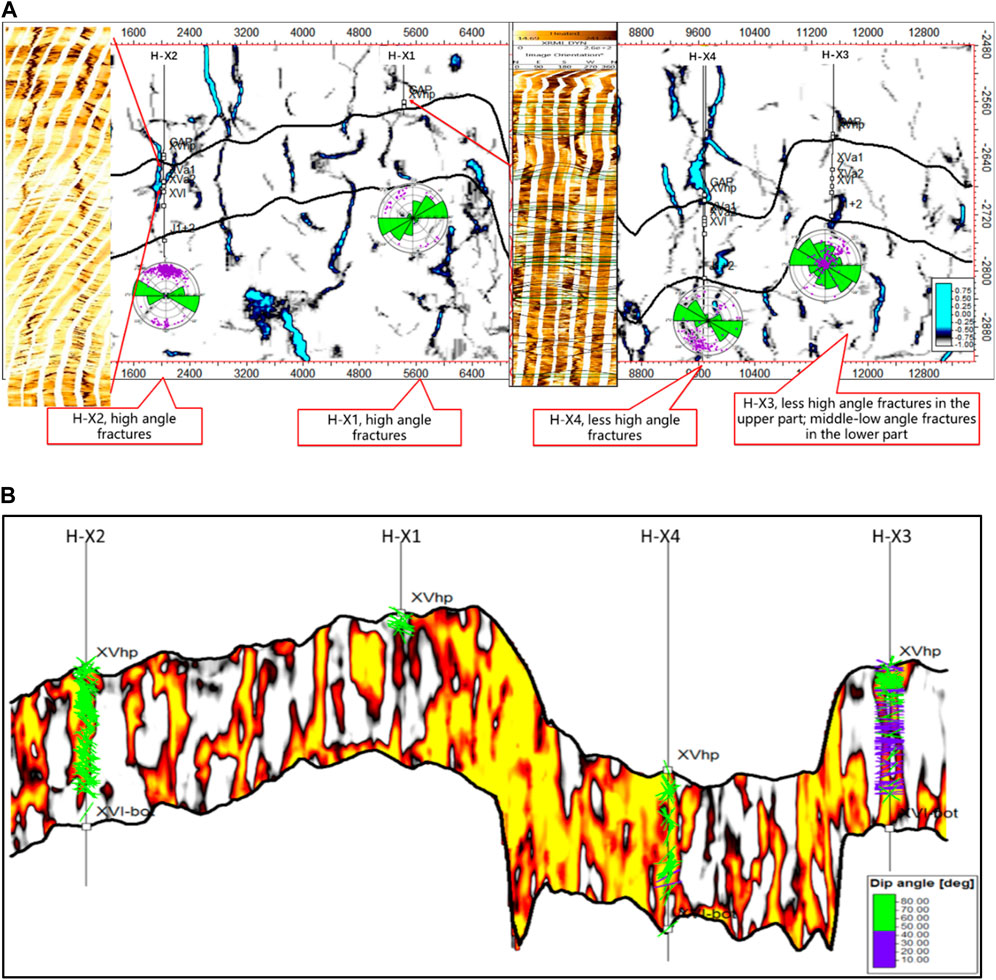
Figure 12. Verification diagram of well-combined-seismic prediction results of fractures (A). Well and seismic contrast analysis of fractures of HX block (B). Profile of wells predicted by supervised neural network fracture in HX block.
Figure 12B shows a cross-well neural network fracture prediction profile in the HX block, with well logging analysis fracture results (green and purple) and seismic prediction results (yellow). It shows consistency between seismic and well logging fracture development distribution for all four wells, directly demonstrating the reliability of well supervised neural network fracture prediction results. This method reduces the uncertainty of single attribute prediction, improves fracture prediction accuracy, and provides a basis for well site deployment and reservoir development analysis in the study area.
In addition, production data can reflect the effectiveness of the reservoir directly. Therefore, oil test or well test data is one important method to verify the fracture prediction results. The test data of HX area are shown in Table 2. H-X1 and H-X2 Wells are high gas production wells, with 74.71 × 10⁴m3/d and 96.04 × 10⁴m3/d. H-X3 and H-X4 Wells have low gas production and slight gas production after acidification. It is confirmed that gas production is positively correlated with the predicted fracture development degree in HX block.

Table 2. Well test data of HX block.
5.2 Prediction of favorable areas
The HX block is a typical structural gas reservoir with no obvious gas-water boundary. The reservoir gas content is controlled by the structure location, degree of reservoir development, especially fracture intensity. The gas saturation is high in higher structural locations, as well as low saturation in lower locations. Meanwhile, the reservoirs have high fracture intensity and high gas test production.
Combined analysis of geology, structure, well logging, and stress with the fracture prediction results, fracture development zones in the HX block are classified. It is shown that the high strain fracture development zone is the optimal area. Figure 13 shows the distribution map of favorable zones for fractured reservoirs in the HX block. The area near fault zones is the first-class (level I) area, the forelimb area is the second-class (level II) area, and the backlimb area is the third-class (level III) area. Oil and gas potential gradually decreases in three levels. Meanwhile, the new H-X01D and H-X02D wells are located in the first-class reservoir area. According to the well test result (Table 2), the two wells are both high-production, which is consistent with the predicted distribution of the favorable areas. Combined with the prediction conditions, it is useful to determine the next well drilling plan.
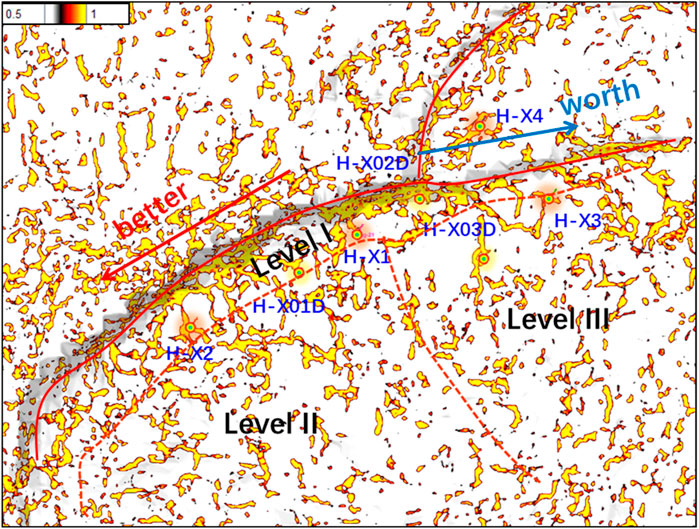
Figure 13. Distribution map of favorable zone for fracture prediction in HX block.
6 Conclusion
The lithology of fractured reservoirs in the eastern right bank of the Amu Darya Basin can be divided into four main categories: grainstone, wackestone, packstone, and marlstone. Fractured carbonate reservoirs in the eastern Amu Darya Right Bank are characterized by low porosity and permeability, with fractures serving as primary reservoir spaces. Using conventional logging combined with imaging, nuclear magnetic resonance, far detection logging, and other special logging techniques, the fracture identification and effectiveness evaluation can be achieved. Fracture development is influenced by lithology and structural factors. In high strain areas (such as hinge zones and forelimbs), structure is a significant influence in fracture development. While in low strain areas (such as backlimb), lithofacies dominates fracture development.
Using the discontinuity attributes of seismic can help recognize the geological features of many reservoir elements. Seismic single attributes such as curvature, coherence, ant body, and likelihood are selected for fracture prediction. Based on geological and well logging analysis of reservoir fractures, use well supervised BP artificial neural network algorithm to achieve fracture prediction. In this method, seismic single attributes are trained and learned to select advantageous attributes. Then use them as input data for calculation to obtain fracture prediction probability bodies. Meanwhile, through geological and well logging calibration of seismic prediction results, it is confirmed that well-seismic fracture development characteristics are consistent, and the fracture prediction results are reliable. This method provides valuable guidance for future well drilling plan and exploration in this area. According to the results of geology, structure, well logging, stress and fracture prediction, the favorable area is determined. The first-class area is near the fault zone, the second-class area in the forelimb of the reverse fault and the third-class area in the backlimb area. The oil and gas potential of the three regions is gradually reduced.
Data availability statement
The original contributions presented in the study are included in the article/supplementary material, further inquiries can be directed to the corresponding author.
Author contributions
YL: Formal Analysis, Investigation, Writing–original draft. XC: Writing–review and editing. LF: Writing–review and editing. LS: Writing–review and editing. JWu: Writing–review and editing. JWe: Software, Writing–review and editing.
Funding
The author(s) declare that financial support was received for the research, authorship, and/or publication of this article. Science and Technology Project of China National Logging Corporation (grant number CNLC 2022-10D02 and CNLC 2022-10D03).
Conflict of interest
Authors YL, XC, LF, LS, JWu, and JWe were employed by China National Logging Corporation.
Publisher’s note
All claims expressed in this article are solely those of the authors and do not necessarily represent those of their affiliated organizations, or those of the publisher, the editors and the reviewers. Any product that may be evaluated in this article, or claim that may be made by its manufacturer, is not guaranteed or endorsed by the publisher.
References
Aydin, A. (2000). Fractures, faults, and hydrocarbon entrapment, migration and flow. Mar. Petroleum Geol. 12, 797–814. doi:10.1016/s0264-8172(00)00020-9
Blumentritt, C. H., Marfurt, K. J., and Sullivan, E. C. (2006). Volume-based curvature computations illuminate fracture orientations — early to mid-Paleozoic, Central Basin Platform, west Texas. Geophysics 71 (5), 159–166. doi:10.1190/1.2335581
Chai, H., Wang, H., Guo, C., Zhang, L., Chen, P., Xing, Y., et al. (2024). Geological characteristics and developmental achievements of the large presalt carbonate gas fields in the Amu Darya Basin. Unconv. Resour. 4 (2024), 100089. doi:10.1016/j.uncres.2024.100089
Chen, M., Sheng, X. U., and Chunguang, W. E. I. (2015). Technique of fractured carbonate reservoir prediction and its application in oversea gas field exploration. Prog. Geophys. 30 (4), 1660–1665. doi:10.6038/pg20150419
Chopra, S., and Marfurt, K. J. (2007). Volumetric curvature attributes add value to 3D seismic data interpretation. Lead. Edge 26 (7), 856–867. doi:10.1190/1.2756864
DI, G., Sun, Z., Pang, X., and Liu, L. (2016). Comprehensive fracture prediction technology constrained by stress field simulation: a case study from ZG8 area of central Tarim Basin. Geophys. Prospect. Petroleum 55 (1), 150–156. doi:10.3969/j.issn.1000-1441.2016.01.019
Dong, L., Liu, S., Liu, Y., and Wang, C. (2004). Research and application of seismic attribute analysis technology. Geophys. Prospect. Petroleum (43), 17–21.
Dun, Z., Li, Q., and Liu, Q. (2013). Research of the volcanic rock oil reservoir predicting in the weibei sag. Sci. and Technol. Vis. (09), 137–138. doi:10.19694/j.cnki.issn2095-2457.2013.09.106
Felici, F., Alemanni, A., Bouacida, D., and de Montleau, P. (2016). Fractured reservoir modeling: from well data to dynamic flow. Methodology and application to a real case study in Illizi Basin (Algeria). Tectonophysics 690, 117–130. doi:10.1016/j.tecto.2016.06.020
Ganguly, N., Dearborn, D., Moore, M., Gordon, D., Horan, M., and Chopra, S. (2009). Application of seismic curvature attribute in the appraisal of the Tishrine-West field, North-East Syria. CSEG Rec. 34 (6), 29–43.
Gui, Z., Yang, X., and Wang, P. (2023). Fracture prediction method based on seismic texture attribute and its application. J. Yangtze Univ. Nat. Sci. Ed. 20 (3), 33–39. doi:10.16772/j.cnki.1673-1409.20220311.001
Guo, K., Fan, L., Yang, L. I., Zhang, M., Zhang, C., and Lirong, L. I. (2019). Comprehensive prediction of fracture of tight carbonate reservoir in the H block of Amu daray Right Bank, Turkmenistan. Geophys. Prospect. Petroluem 58 (1), 112–122. doi:10.3969/j.issn.1000-1441.2019.01.013
Jian, S., Fu, L., Duan, W., Peng, G., Cheng, S., Tang, Y., et al. (2024). Rock-physics modeling and pre-stack seismic inversion for the Cambrian superdeep dolomite reservoirs in Tarim Basin, Northwest China. Mar. Petroleum Geol. 167 (2024), 106973. doi:10.1016/j.marpetgeo.2024.106973
Liao, H., Liu, H., Cui, Y., Wang, R., Zhilin, L. I., Chen, D., et al. (2023). Research on fractures identification method of metamorphic rock based on conventional logging. Mar. Geol. and Quat. Geol. 43 (4), 189–198. doi:10.16562/j.cnki.0256-1492.2023021601
Ma, Y. (2020). Marine oil and gas exploration in China. Springer Science and Business Media LLC. ISSN: 9783662611456. doi:10.1007/978-3-662-61147-0
Mickael, B., Youri, H., Jean-Paul, C., Floquet, M., and Daniel, J. M. (2012). Sedimentary and diagenetic controls on the multiscale fracturing pattern of a carbonate reservoir: the Madison Formation (Sheep Mountain, Wyoming, USA). Mar. Petroleum Geol. 29, 50–67. doi:10.1016/j.marpetgeo.2011.08.009
Nelson, R. (2001). Geological analysis of naturally fractured carbonate reservoirs. second edition. United States: Gulf Professional Publishing. doi:10.2118/15627-PA
Panza, E., Agosta, F., Rustichelli, A., Zambrano, M., Tondi, E., Prosser, G., et al. (2016). Fracture stratigraphy and fluid flow properties of shallow-water, tight carbonates: the case study of the Murge Plateau (southern Italy). Mar. Petroleum Geol. 73, 350–370. doi:10.1016/j.marpetgeo.2016.03.022
Price, N. J. (1966). Fault and joint development in brittle and semi-brittle rocks. Commonw. Int. Libr. Geol. Div.
Qi, B., Luo, Li, Zhang, S., Luo, N., Ren, X., and Liu, H. (2018). Log interpretation method about fracture in east area of Amu draya Right Bank. Well Logging Technol. 42 (3), 287–293. doi:10.16489/j.issn.1004-1338.2018.03.008
Saleh, A., and Marfurt, K. J. (2006). 3D volumetric multispectral estimates of reflector curvature and rotation. Geophysics 71 (5), 41–51. doi:10.1190/1.2242449
Song, J. (2014). Application of seismic attributes in prediction of small fault and fracture developed zone. Min. Saf. and Environ. Prot. 41 (02), 32–34.
Wang, H., and Hongxi, L. I. (2019). Reservoir characteristics and main controlling factors of Karlov-Oxford-stage carbonate rocks in M gas field on the right bank of Amu River. China Petroleum Chem. Stand. Qual. 1, 185–187.
Wang, Y., Zheng, D., Li, X., Cui, Y., Sun, S., Wan, X., et al. (2014). The fracture-cavern system prediction method and its application in carbonate fractured-vuggy reservoirs. Geophys. Prospect. Petroleum 53 (6), 727–736. doi:10.3696/j.jissn.1000-1441.2014.06.014
Watkins, H., Butler, R. W., Bond, C. E., and Healy, D. (2015). Influence of structural position on fracture network s in the Torridon Group, Achnashellach fold and thrust belt, NW Scotland. J. Struct. Geol. 74, 64–80. doi:10.1016/J.JSG.2015.03.001
Wei, J., Li, J., Yang, X., Li, X., Wang, K., and Zhang, L. (2021). Quantitative evaluation for reservoir identification of vug-fractured reservoir in Right Bank of Amu draya basin. Well Logging Technol. 45 (2), 156–161. doi:10.16489/j.issn.1004-1338.2021.02.008
Xu, W., Liu, X., Yu, Z., Wang, J., Gao, B., and Chai, H. (2009). Geological structure of Amu-Darya Basin in Central Asia. Nat. Gas. Geosci. 20 (5), 744–748.
Xu, W., Wen, H., Zheng, R., Li, F., Huo, F., Hou, M., et al. (2018). The carbonate platform model and reservoirs' origins of the Callovian-Oxfordian stage in the Amu Darya Basin, Turkmenistan. Crystals 8, 84. doi:10.3390/cryst8020084
Zhang, D. (2023). “Comprehensive prediction of fractured carbonate reservoirs through logging-seismic integration,” in Proceedings of the international field exploration and development conference 2022, 1554–1566. doi:10.1007/978-981-99-1964-2_134
Zhang, G., Huang, X., Yungui, X. U., Tang, S., Kang, CHEN, and Peng, Da (2024). Deep carbonate gas reservoir sweet spot identification with seismic data based on dual-factor control of sedimentary facies and fault system. Front. Earth Sci. 12, 12–2024. doi:10.3389/feart.2024.1427426
Zhang, T., She, G., Li, M., Abudrahman, A., and Ye, S. (2015). Multi-disciplinary integration prediction of fractured carbonate reservoir in A Oilfield, Zagros Basin. Geophys. Prospect. Petroleum 54 (6), 770–779. doi:10.3969/j.issn.1000-1441.2015.06.016
Zhang, W., Zhangzhilin, X. U. L., and Weibing, H. E. J. (2023). Application of reservoir prediction technology on the structural tensor oriented in the LS area. Geophys. Prospect. PETROLEUM 62 (1), 110–117. doi:10.3969/ji.ssn.1000-1441.2023.S1.017
Keywords: fractured reservoir, fracture effectiveness, control factors, single attribute prediction, neural network, favorable area selection
Citation: Li Y, Cheng X, Fan L, Sun L, Wu J and Wei J (2024) Evaluation of fractured carbonate reservoir and prediction of favorable areas in the eastern area of Amu Darya Right Bank. Front. Earth Sci. 12:1495245. doi: 10.3389/feart.2024.1495245
Received: 12 September 2024; Accepted: 30 September 2024;
Published: 22 October 2024.
Edited by:
Peng Wu, Dalian University of Technology, ChinaReviewed by:
Baogang Li, China University of Petroleum (East China), ChinaFaqiang Zhang, Northeast Petroleum University, China
Copyright © 2024 Li, Cheng, Fan, Sun, Wu and Wei. This is an open-access article distributed under the terms of the Creative Commons Attribution License (CC BY). The use, distribution or reproduction in other forums is permitted, provided the original author(s) and the copyright owner(s) are credited and that the original publication in this journal is cited, in accordance with accepted academic practice. No use, distribution or reproduction is permitted which does not comply with these terms.
*Correspondence: Yang Li, bGl5YW5nLmNubGNAY25wYy5jb20uY24=