- 1Xinjiang Agro-Meteorological Observatory, Urumqi, China
- 2Institute of Desert Meteorology, China Meteorological Administration/National Observation and Research Station of Desert Meteorology, Taklimakan Desert of Xinjiang/Taklimakan Desert Meteorology Field Experiment Station of China Meteorological Administration/Xinjiang Key Laboratory of Desert Meteorology and Sandstorm/Key Laboratory of Tree-ring Physical and Chemical Research, China Meteorological Administration, Urumqi, China
- 3College of Resources and Environment, Shanxi Agricultural University, Jinzhong, Shanxi, China
- 4Xinjiang Branch of China Meteorological Administration Meteorological Cadre Training College, Urumqi, China
Obtaining high temporal and spatial resolution spectral data is the key to revealing the influencing factors, effects, and mechanisms of land-atmosphere interactions in deserts. This study, we used MODIS and Sentinel-2 data as data sources to calculate daily reflectance and Normalized Difference Vegetation Index (NDVI) data with a spatial resolution of 10 m, based on the Spatiotemporal Fusion Incorporating Spectral Autocorrelation (FIRST) model, across different climatic zones in the Hobq Desert, northern China, in March. Then, we evaluated the adaptability of the FIRST model in the Hobq Desert based on spatial and textural characteristics, as well as spatial-temporal distribution characteristics, using qualitative analysis, quantitative analysis, and geographic detectors. The results show that the correlation coefficients of First fused data and Sentinel-2 data in red, green, blue, near-infrared bands, and NDVI were 0.574 (p < 0.01), 0.448 (p < 0.01), 0.485 (p < 0.01), 0.573 (p < 0.01), and 0.625 (p < 0.01), and the scatter points were evenly distributed on both sides of y = x. Meanwhile, FIRST NDVI and Sentinel-2 NDVI maintained consistency in spatial texture and hue changes, with similar value ranges. The daily scale coefficient of variation (CV) of FIRST NDVI in different desert types were less than that of MODIS NDVI. Among them, the variability of FIRST NDVI in fixed dunes was significantly smaller than that of MODIS NDVI, with the former’s CV being 0.034 smaller than the latter’s. Besides, it was found that there were significant differences in First NDVI among different desert types based on risk detection, while MODIS NDVI showed insignificant differences between fixed dunes and semi-fixed dunes. This suggests that First model integrated effectively various types of remote sensing data and had strong applicability in the eastern part of Hobq Desert, which could distinguish between fixed dunes and semi-fixed dunes, providing a more accurate monitoring tool for environmental zoning management in desert areas.
1 Introduction
Vegetation is the main body of the terrestrial ecosystem, connecting the material cycle and energy flow of the atmosphere, water, and soil, and playing an important role in regulating the climate system and terrestrial carbon balance (Rahman et al., 2022; Cai et al., 2022). Normalized Difference Vegetation Index (NDVI) is the most commonly used index to represent vegetation conditions, comprehensively reflecting the changes of vegetation coverage and biomass (Zhang et al., 2022). Deeply understanding the mechanism of driving forces in the process of vegetation change and systematically evaluating the relative role of each driving factor in the process of vegetation change are the keys to effectively carrying out vegetation construction, especially in arid and semi-arid desert areas, where vegetation construction is an important measure to effectively prevent soil erosion and vegetation degradation (Rahman et al., 2022; Alam et al., 2021; Guerra et al., 2016; Zhao et al., 2024). With the development of remote sensing technology, the use of remote sensing methods to monitor vegetation growth has become the mainstream approach in current research (Hasan et al., 2024; Vélez et al., 2023). Remote sensing can quickly obtain NDVI for continuously distributed areas, providing a good monitoring effect for large-scale surface vegetation information (Lyapustin et al., 2023). However, desert areas often exhibit complex surface features, such as dunes, rocky surfaces, and saline-alkali land (Wang et al., 2022), which can lead to reduced accuracy in traditional remote sensing (Abdullah et al., 2024). Additionally, changes in desert environments tend to be gradual (Vogelmann et al., 2016), and existing high spatial resolution data lack sufficient time series for continuous monitoring over time, limiting the analysis of change trends and significantly reducing their applicability for long-term monitoring (Peirce et al., 2024). Single remote sensing data may be affected by atmospheric conditions and variations in surface reflectance characteristics, leading to deficiencies in temporal or spatial resolution and making it difficult to capture small-scale dynamic changes in desert environments (Andrew and Warrener, 2017).
The spatiotemporal fusion method of multi-source remote sensing data is an effective way to resolve the conflict between temporal and spatial resolution, enabling the acquisition of temporal phase information from high temporal resolution remote sensing data and spatial texture information from high spatial resolution data simultaneously (He et al., 2023b; He et al., 2023a). The spatiotemporal fusion of data involves the integration of known “time-dense” low spatial resolution image sequences with “time-sparse” high spatial resolution image sequences corresponding to some time points, generating “time-dense” higher spatial resolution image sequences corresponding to the low spatial resolution image sequences (Ghassemian, 2016). Currently, spatiotemporal fusion models can be broadly classified into three categories: transformation-based fusion models (Agarwal et al., 2020), machine learning-based fusion models (Hilal et al., 2022), and fusion models based on reconstruction (Jarihani et al., 2014). The advantage of transformation-based fusion models is that detailed spectrum information is preserved, but the disadvantage is the unsolvable problem of mixed pixels and low fusion accuracy (Malenovský et al., 2007). The machine learning-based fusion models use a two-layer spatio-temporal fusion model, which accounts for differences in data resolution and can capture changing surface reflectance in images. However, they have high data requirements and poor efficiency, so they are not suitable for large-scale studies (Niu et al., 2022). Fusion models based on reconstruction not only consider spatial heterogeneity but also account for the nonlinear characteristics of pixel reflectance changes, making them widely applicable in areas with high heterogeneity. Typical models include the spatial and temporal adaptive reflectance fusion model (STARFM) (Dhillon et al., 2023), the enhanced spatial and temporal adaptive reflectance fusion model (ESTARFM) (Knauer et al., 2016), the flexible spatiotemporal data fusion (FSADF) (Zhu et al., 2016), and the spatial and temporal non-local Filter-based fusion model (STNLFFM) (Dong et al., 2020). These methods predict individual bands separately, generating predictions for a single band by inputting a single spectrally similar band, overlooking the valuable spectral autocorrelation between multiple bands. The latest proposed spatiotemporal fusion method incorporating spectral autocorrelation (FIRST) utilizes a many-to-many framework, maximizing the information extracted from all available spectral bands and mitigating the impact of concatenation, resulting in more accurate multi-band fused images (Liu et al., 2022). FIRST can consistently produce better predictions, even for complex temporal change patterns with distinct spatial details. Additionally, this method can resist some noise caused by haze and thin clouds while achieving good fusion accuracy and spatiotemporal detail performance. The FIRST model can more effectively integrate various types of remote sensing data, such as optical, radar, and LiDAR, enhancing the comprehensiveness and accuracy of the information (Liu et al., 2022). The ESTARFM model mainly focuses on time series interpolation of optical imagery and lacks integration of multi-source data (Knauer et al., 2016). The FSDAF and STNLFFM models also have limitations in data fusion, often relying on a single data source (Zhu et al., 2016; Dong et al., 2020). The FIRST model employs more advanced noise suppression techniques, effectively reducing atmospheric and environmental interference, thereby improving data accuracy (Liu et al., 2022). The ESTARFM model is relatively sensitive when handling noise, which may affect the reliability of the results (Knauer et al., 2016). Similarly, the FSDAF and STNLFFM models have relatively weak capabilities in noise handling (Zhu et al., 2016; Dong et al., 2020). The FIRST model demonstrates strong capabilities in processing complex terrain and surface features, allowing for more accurate reflection of changes in specific environments like deserts (Liu et al., 2022). In contrast, the ESTARFM model faces certain challenges in processing complex terrains (Knauer et al., 2016), while the FSDAF and STNLFFM models have poorer adaptability to complex surface features (Zhu et al., 2016; Dong et al., 2020). However, due to its short history and lack of extensive validation in various sample areas, its applicability to different surface types still needs to be determined.
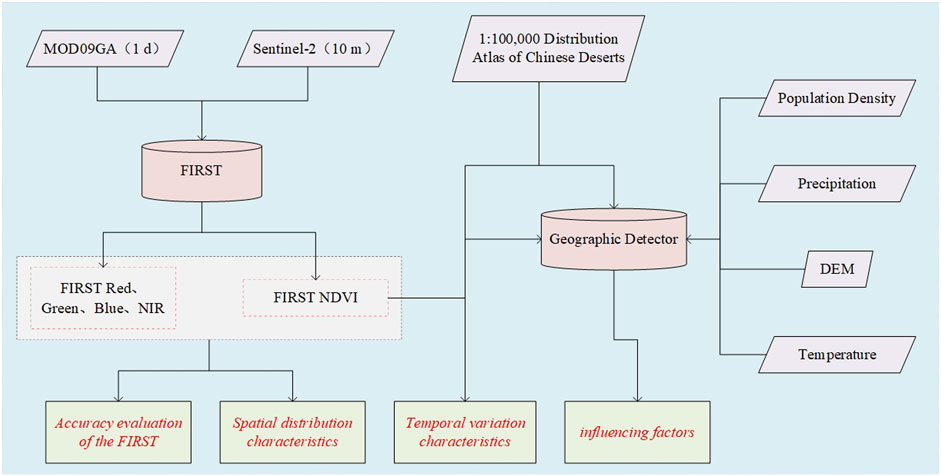
The Hobq Desert is located at the northwest edge of the East Asian summer monsoon region, where wind direction undergoes significant seasonal changes, and it is classified as a typical arid and semi-arid area in northern China (Kubo et al., 2013; Ao et al., 2023). Hobq Desert is also the nearest large desert to Beijing, and its special geographic location determines that it has an important impact on the ecological environment of North China (Zhang et al., 2024). Obtaining high spatial and temporal resolution remote sensing data is of great value for monitoring vegetation degradation and desertification control in the Hobq Desert. Thus, we utilized Sentinel-2 and MODIS data as the primary data sources, studying the adaptability of FIRST model in the Hobq Desert, northern China. The major objectives of the study included (a) to analyze the applicability of the FIRST model for red, green, blue, near-infrared band data, and NDVI in the Hobq Desert by correlation analysis; (b) to analyzed the spatial and temporal distribution characteristic of FIRST NDVI in March by qualitative analyses and quantitative analyses, compared with MODIS data; (c) to evaluate the performance and reliability of the FIRST model through geographic detector analysis.
2 Study area and dataset
2.1 Study area
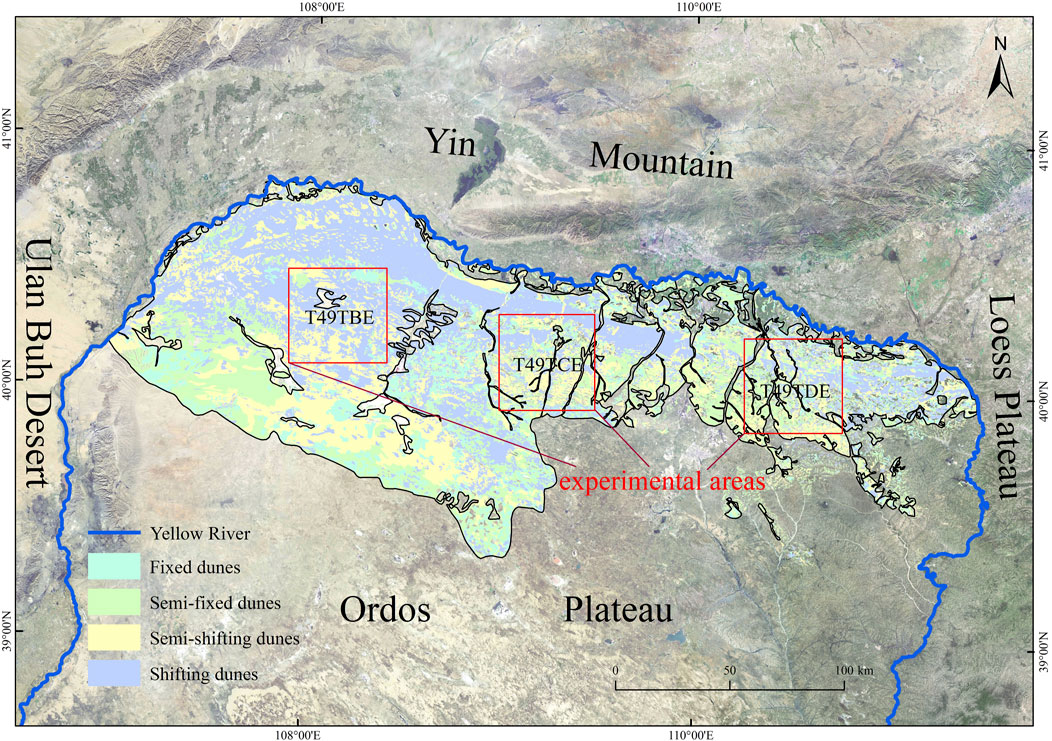
Hobq Desert is located in Ordos City, Inner Mongolia Autonomous Region, China (106°55′ ∼ 111°25′E, 39°21′ ∼ 40°52′N) (Zhang et al., 2024), situated to the north of the Ordos Plateau ridgeline and to the south bank of the Yellow River in the Hetao Plain, covering a total area of about 13,900 km2 (Figure 1). The region spans three climate zones, including the middle temperate zone of Menggan region, the middle temperate zone of Mengzhong region, and the middle temperate zone of Mengdong region (Zheng et al., 2013). The rainfall in the east is relatively high, while the west is rich in heat. The average annual precipitation in the desert ranges from 150 to 400 mm, while the average annual evaporation reaches 2,162 mm. The average annual temperature is relatively low, ranging from 7°C to 8°C (Ao et al., 2023). Shifting dunes account for about 61%, with a height of 10–60 m in the desert. Fixed dunes are concentrated in the middle temperate zone of the eastern Mengdong region. The number of gale days per year is 25–35, with an average wind speed of about 10 m per second, and the wind speed during the wind erosion period can reach 30 m/s, resulting in a serious problem of land desertification (Zhang et al., 2024; Alherbawi et al., 2022).
2.2 Data source
Sentinel-2 is a high-resolution multispectral imaging satellite carrying a multispectral imager (MSI) for land monitoring, providing images of vegetation, soil and water cover, inland waterways, coastal areas, etc. Sentinel-2 data from March 2023 was downloaded from the European Space Agency (https://scihub.copernicus.eu/dhus/#/home). The orbit numbers are T49TBE (20230307, 20230317), T49TCE (20230314, 20230319), and T49TDE (20230329). Through the Sentinel Application Platform (SNAP), resampling and projection transformation were performed, selecting the red band (Red), green band (Green), blue band (Blue), and near-infrared band (NIR). The Sentinel-2 NDVI with a spatial resolution of 10 m was calculated using red band (Red) and near-infrared band (NIR).
The Moderate-resolution Imaging Spectroradiometer (MODIS) is a large-scale space remote sensing instrument developed by NASA to understand global climate change and the impact of human activities on climate. MODIS reflectance products MOD09GA of H26V04 and H26V05 orbits were obtained from the National Aeronautics and Space Administration (https://ladsweb.modaps.eosdis.nasa.gov/). These products have a spatial resolution of 500 m and a temporal resolution of 1 day. MOD09GA data was used for projection conversion and image mosaicking through the MRT program and batch processing tools to obtain the red, green, blue, and near-infrared bands of MODIS data at the daily scale in March 2023. The NDVI was calculated based on these bands. However, due to the influence of cloudy and rainy weather, the quality of MODIS data on 3 March 2023 was poor and could not be used for fusing corresponding time data.
The data of desert types is derived from 1:100,000 Distribution Atlas of Chinese Deserts provided by the Western China Environment and Ecological Science Data Center (http://westdc.westgis.ac.cn). The main desert types in Hobq Desert include shifting dunes, semi-shifting dunes, semi-fixed dunes, and fixed dunes, accounting for 37.37%, 28.04%, 24.12%, and 10.47% respectively. Monthly meteorological data of 1 km temperature and precipitation comes from the National Tibetan Plateau Data Center (https://data.tpdc.ac.cn/zh-hans/data/). In addition, the ASTER GDEM digital elevation model (30 m) for the corresponding area was obtained from the Geospatial Data Cloud; population density data (100 m) comes from the Seventh National Population Census (2020) (https://figshare.com/).
2.3 Methodology
2.3.1 FIRST model
In most existing spatial-temporal fusion processes, there is often a significant difference in spatial resolution between coarse and fine images, which can lead to the introduction of new errors through spatial interpolation residuals from coarse to fine resolution. Even with similar pixel filtering, spatial textures may become smoothed (Liu et al., 2022). The FIRST model revises these errors through adaptive combination of residual compensation, resulting in a more robust final fusion result (Formula 1):
where
where R(x, y, b) is the residual value of the coarse pixel at the position of b band (x, y); C(x, y, b) is a thick pixel in the b band (x, y) position;
2.3.2 GeoDetector
GeoDetector is a spatial statistical method for detecting spatial divergence and explaining its driving factors. It is used to explore the spatial heterogeneity between dependent and independent variables and measure the explanatory power (i.e., q value) of independent variables with respect to dependent variables. It is calculated as follows (Formula 3):
where PD is the explanatory power of NDVI with a value range of 0–1; the larger the value, the stronger the explanatory power of NDVI; h (1, 2, . . . ,L) is the variable classification or partition; Nh and N are the number of layers, h, and regional units, respectively; σh2 and σ2 are the variance of the Y value in the h layer and region, respectively. Based on the calculation of the PD value of a single factor, PD (x1), PD (x2) and PD (x1 ∩ x2) are calculated to determine and explain the explanatory power of the combined (increasing or weakening) and independent effects of meteorological factors on NDVI.
where F is the F statistic (Equation 4), which is used to compare whether there are significant differences in the influence of the two factors x1 and x2 on the spatial distribution of NDVI. Nx1 and Nx2 were the sample sizes of two factors, respectively. L1 and L2 are the number of tiers x1 and x2, respectively.
where t is the risk detection statistic (Equation 5), which is used to determine whether there is a significant difference in the mean NDVI between the two desert type subregions.
3 Results and analysis
3.1 Accuracy evaluation of the FIRST model
The FIRST model was utilized to obtain the red, green, blue, and near-infrared band data of the Hobq Desert experimental area with a spatial resolution of 10 m and a temporal resolution of 1d. The correlation coefficients between the fusion results and the corresponding Sentinel-2 data were calculated, as shown in Table 1. The scatter plots of different band data were relatively evenly distributed on both sides of y = x. The correlation coefficients of the FIRST data and Sentinel-2 data in the red, green, blue, and near-infrared bands were 0.574, 0.448, 0.485, and 0.573, respectively. The maximum bias was 0.035, and the minimum was 0.013. The root mean square error (RMSE) ranged from 430.130 to 558.904. Due to the influence of the quantity and quality of Sentinel-2 data with higher spatial resolution, the fusion accuracy of different bands for T49TBE and T49TCE was significantly higher than that of T49TDE. The correlation coefficients of the former were all above 0.7, while the latter’s correlation coefficients were only larger than 0.6 in the near-infrared band, and the bias was larger than 0.1. Among them, the correlation coefficients of the red, green, blue, and near-infrared bands of T49TBE on March 7th and T49TCE on March 14th were all larger than those of the corresponding bands on March 17th and March 19th, and the single-band correlation coefficients were all larger than 0.91, indicating that T49TBE and T49TCE had better single-band fusion effects on March 7th and March 14th, respectively.

Table 1. R, BIAS, and RMSE between First data and Sentinel-2 data in red, Green, Blue, and Nir wave segments.
Further, the correlation coefficient, bias, and root mean square error (RMSE) between the First NDVI and Sentinel-2 NDVI in different experimental areas were calculated using the red and near-infrared bands, as shown in Figure 3. The scatter plot of First NDVI and Sentinel-2 NDVI was mainly concentrated near the y = x line, and most NDVI values were concentrated in the range of [0.05–0.1], with R, Bias, and RMSE values of 0.625, 0.054, and 0.016, respectively, indicating a low degree of dispersion in the fused images and good overall fusion results. Comparing the fusion accuracy at different times, we found that the correlation coefficients between First NDVI and Sentinel-2 NDVI on March 7, March 14, March 17, March 19, and March 29 were 0.836, 0.752, 0.852, 0.771, and 0.223, respectively. The Bias ranged from −0.118 to 0.194, and the root mean square error (RMSE) was less than 0.025. Except for March 29, the First NDVI and Sentinel-2 NDVI had good correlation and high simulation accuracy at other times, which can be used for subsequent research.
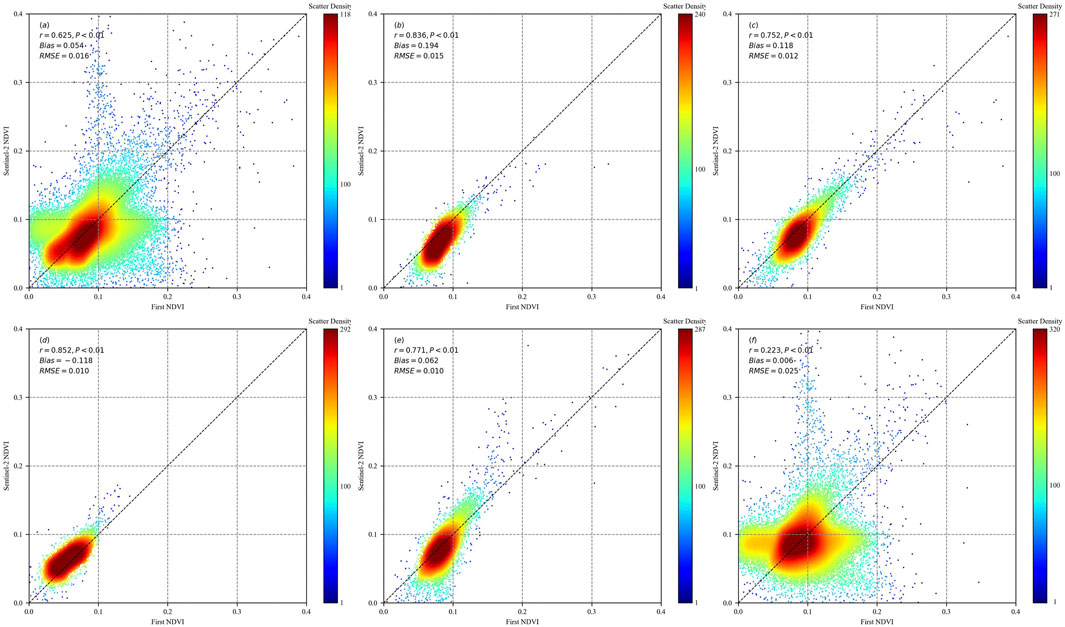
Figure 3. Scatter plots of First NDVI and Sentinel-2 NDVI in Hobq Desert for different periods ((A–F) represent different times for all experimental areas, T49TBE20230307, T49TCE20230314, T49TBE20230317, T49TCE20230319, T49TDE20230329).
A comparative analysis of the spatial characteristics of FIRST NDVI with Sentinel-2 NDVI and MODIS NDVI for corresponding time periods (Figure 4) revealed that FIRST NDVI, compared to MODIS NDVI, possesses excellent spatial detail information, enabling it to accurately represent spatial differences between smaller ground objects. Meanwhile, due to the low spatial resolution of MODIS NDVI, there were many mixed pixels, making it difficult to accurately represent the changing trends of NDVI within the sample area, manifesting as a narrower range of NDVI values. Further comparison of FIRST NDVI with Sentinel-2 NDVI showed that on March 29th in the T49TDE region, there were significant differences in the spatial distribution characteristics between MODIS NDVI and Sentinel-2 NDVI, resulting in poor fitting between FIRST NDVI and Sentinel-2 NDVI. However, in other regions, FIRST NDVI and Sentinel-2 NDVI remained consistent in spatial texture and tonal changes, with similar value ranges and good simulation effects. Therefore, we believe that the FIRST fusion model has strong applicability and good simulation accuracy for simulating NDVI in the Hobq Desert.
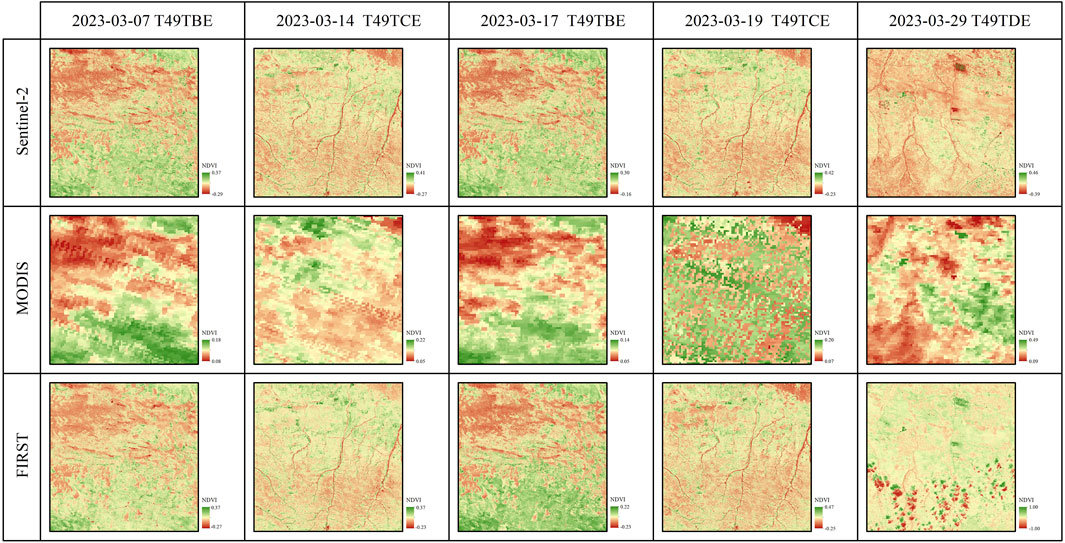
Figure 4. Comparative Analysis of FIRST NDVI with the concurrent NDVI from Sentinel-2 and MODIS in Hobq Desert in March.
3.2 Spatial distribution characteristics of different bands and NDVI in Hobq Desert
The mean values of the Red, Green, Blue, NIR, and NDVI bands in the T49TBE, T49TCE, and T49TDE regions in March were calculated separately, as shown in Figure 5. The DN values of different bands in T49TBE, T49TCE, and T49TDE showed a decreasing trend, with the most significant decrease in the Blue and NIR bands. T49TBE was located in the western part of the desert, mainly composed of arid areas, with 56.28% shifting dunes and 35.16% semi-shifting dunes, while fixed and semi-fixed dunes only accounted for 8.56%. The peak values of the Red, Green, Blue, and NIR bands in the shifting dunes (10895.5, 10302.4, 9256.58, 11084.3) were significantly higher than those in the semi-shifting dunes (7083.31, 6871.28, 6692.1, 7429.93), while the lower limits of both remained consistent, indicating that the variation range of DN values in different bands was higher in shifting dunes than in semi-shifting dunes. In T49TCE, the proportions of shifting, semi-shifting, and semi-fixed dunes were 33.72%, 35.33%, and 24.27%, respectively. Among them, the variation range of DN values in different bands decreased sequentially from shifting dunes, semi-shifting dunes, to semi-fixed dunes. The eastern part of Hobq Desert (TDE) belongs to a semi-arid area with higher precipitation than the central and western parts of the desert. Semi-fixed dunes had replaced semi-shifting and shifting dunes as the main desert type in this region, accounting for 34.62%. The range of DN values in different bands of semi-fixed dunes were [1095.18, 6944.6], [1335.83, 7028.41], [1269.35, 7863.48], and [898.506, 8812.24]. The variation range was significantly greater than that of fixed dunes ([1003.77, 6130.91], [1177.27, 6051.86], [1092.35, 6809.35], [958.875, 7593.71]). In summary, the variation range of DN values in different bands of different desert types showed a trend of shifting dunes > semi-shifting dunes > semi-fixed dunes > fixed dunes. The NDVI values in different regions were highly correlated with the desert types. The NDVI values in the shifting dunes in the northwest of T49TBE were significantly lower than those in the semi-shifting dunes in the southeast. The NDVI values in the contiguous shifting dunes in the northeast of T49TCE were significantly lower than those of other desert types in the region. The dunes types in T49TDE were cross-distributed, coupled with poor fusion accuracy, leading to insignificant differences in NDVI values among different dunes types.
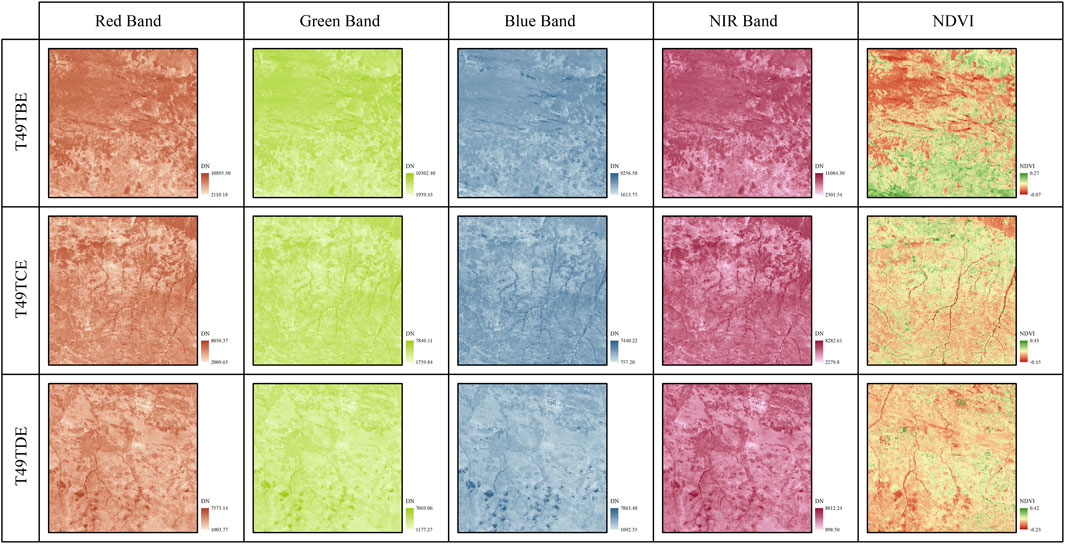
Figure 5. Spatial distribution characteristics of different bands and NDVI in T49TBE, T49TCE, and T49TDE of Hobq Desert in March.
3.3 Temporal variation characteristics of NDVI in different desert types
The NDVI of Hobq Desert in March was classified and statistically extracted according to different desert types (Figure 6). The NDVI of different desert types changed relatively synchronously in March, with the mean and median values maintaining a relatively stable and consistent trend. Among them, the NDVI of fixed and semi-fixed dunes were concentrated in the range of [0.67, 0.71], while the NDVI of shifting and semi-shifting dunes were concentrated in the range of [0.60, 0.65]. Meanwhile, the coefficients of variation of NDVI in March for fixed, semi-fixed, semi-shifting, and shifting dunes were 0.251, 0.257, 0.287, and 0.320, respectively. The variability of NDVI in shifting and semi-shifting dunes were greater than that in semi-fixed and fixed dunes. In the late March, the degree of variation in NDVI for different desert types was significantly higher than in the early March, which was influenced by only one Sentinel-2 NDVI data in the late March and the poor image quality of the corresponding MODIS NDVI due to cloudy and rainy weather.
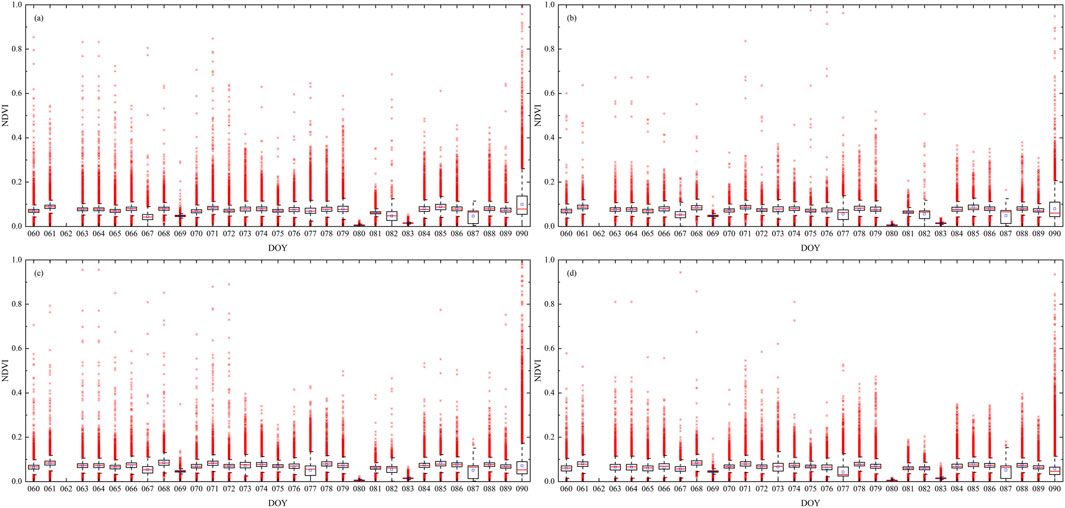
Figure 6. Temporal Variation Characteristics of NDVI in March for semi-fixed (A), fixed (B), semi-shifting (C), and shifting (D) dunes in Hobq Desert.
A further comparative analysis of the variation trends of the daily-scale First NDVI and MODIS NDVI coefficients of variation (CV) was presented in Figure 7. The CVs of daily-scale MODIS NDVI were higher than those of First NDVI, and the differences were more prominent on Julian days 67, 73, 80, 83, and 87, indicating that the stability of MODIS NDVI was poorer than First NDVI. Among them, the differences in daily-scale NDVI CVs between First NDVI and MODIS NDVI were relatively small in shifting dunes, semi-shifting dunes, and semi-fixed deserts, with the mean difference in March’s CV not exceeding 0.01. Due to the relatively small area of fixed dunes, the number of mixed pixels in MODIS NDVI increased, leading to greater variability. As a result, the daily-scale MODIS NDVI variability was significantly greater than First NDVI, with the CV of the former being 0.034 higher than the latter. This suggested that First NDVI exhibits stronger stability and better adaptability in smaller areas of fixed dunes.
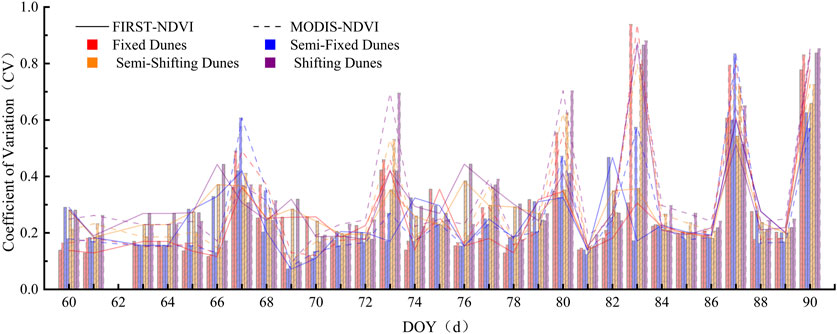
Figure 7. Temporal variation trends of the CV between First NDVI and MODIS NDVI for different desert types in Hobq Desert.
3.4 Detection of NDVI influencing factors in Hobq Desert
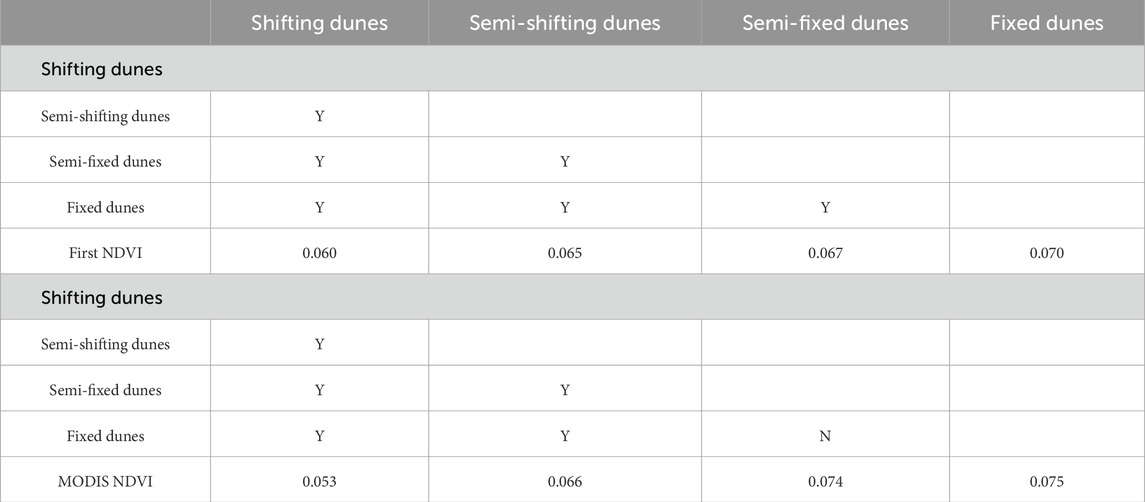
The mean values of First NDVI, MODIS NDVI, DEM, and population density data in March were resampled to 1 km. Using the Geographic Detector, the q-values of desert type, DEM, precipitation, temperature, and population density for the mean values of First NDVI and MODIS NDVI in March were calculated, and the results were shown in Table 2. Compared to MODIS NDVI, the q-values of different factors for First NDVI showed an increasing trend, indicating that the fused First NDVI had an enhanced response to different factors. Among them, the q-value of desert type increased the most significantly, suggesting that First NDVI had good applicability in Hobq Desert. The explanatory power of other factors on First NDVI from high to low was precipitation (q = 0.452), temperature (q = 0.352), DEM (q = 0.270), and population density (q = 0.052). Among them, precipitation and temperature factors reached extremely significant levels, indicating that precipitation and temperature were the main factors limiting the First NDVI in Hobq Desert in March, while population density had a poor explanatory power for First NDVI. Further calculations of the risk detection of NDVI in different desert types were shown in Table 3. There were significant differences in First NDVI among different desert types, while the differences in MODIS NDVI between fixed dunes and semi-fixed dunes were not significant. In summary, we believe that the adaptability of First NDVI in Hobq Desert is higher than MODIS NDVI, and this adaptability is most significant in fixed dunes.

Table 2. PD values of desert type, DEM, precipitation, temperature, and population density for First NDVI and MODIS NDVI.
4 Discussion
The spectral values of multiple bands in optical remote sensing data change in a certain pattern, interrelated and not independent. The First spatiotemporal fusion model fully utilizes the multi-band spectral autocorrelation, obtaining more information by using multiple bands in the regression rather than a single band, thereby establishing a more accurate model to capture complex temporal variation patterns (Liu et al., 2022). Compared to traditional spatiotemporal fusion models based on a one-to-one framework, the First spatiotemporal fusion model achieves higher fusion accuracy. Sentinel-2 (10 m) boasts a higher spatial resolution compared to Landsat (30 m), which is crucial for monitoring low vegetation coverage and its trends in deserts (Hill and Guerschman, 2022). The First spatiotemporal fusion model can incorporate the high spatial texture details of Sentinel-2 data at corresponding times, addressing the issue of mixed pixels in MODIS (500 m) data and effectively adjusting inaccurate information on NDVI changes in different desert types in the region. It also resolves the discreteness issue of Sentinel-2 data in the time series, better reflecting the changing characteristics of NDVI in Hobq Desert on a continuous timescale. Moreover, compared to MODIS NDVI, First NDVI has improved stability across different desert types, and can better distinguish between semi-fixed dunes and fixed dunes within small areas in the eastern part of the desert (He et al., 2022). Therefore, we believe that the First spatiotemporal fusion model has good adaptability in Hobq Desert, and the fused data with high spatiotemporal resolution can provide guidance for future ecological restoration and sand control efforts in Hobq Desert.
Related studies (Alherbawi et al., 2022; Afuye et al., 2021; He et al., 2021) have found that precipitation and temperature were the main meteorological factors that affect vegetation changes in desert areas. In March, the precipitation in Hobq Desert is relatively low, and the lack of water becomes the main limiting factor for NDVI, which is reflected in the low NDVI value. The experimental areas T49TBE, T49TCE, and T49TDE belong to the temperate zone of Menggan area, the temperate zone of Mengzhong area, and the temperate zone of Mengdong area respectively (Zheng et al., 2013). The precipitation in Hobq Desert shows a significant increase trend from west to east (Kidron, 2024). There is a significant positive correlation between NDVI and precipitation, and the trend is increasing from west to east. Precipitation, as a limiting factor, is crucial for vegetation growth. The positive correlation between FIRST NDVI and precipitation indicates that vegetation in desert areas can grow better with sufficient precipitation, which is positive for maintaining the health and diversity of desert ecosystems. This is consistent with the research results of Yang et al. (2022) and Zhang et al. (2018). At the same time, the increase of precipitation will improve soil moisture, making the physical characteristics of the soil surface smoother and more uniform, reducing light scattering and reflection, resulting in significantly lower band values in the desert experimental areas T49TCE and T49TDE than in T49TBE (Bahddou et al., 2023). The change of temperature is not the main limiting factor for vegetation growth. However, as the temperature rises, the process of surface evaporation accelerates. This indirectly leads to a lack of soil moisture, which significantly inhibits vegetation growth (He et al., 2021). Warmer temperatures may lead to a reduction in soil moisture and inhibit vegetation growth. This phenomenon is a reminder of the vulnerability of desert ecosystems in the context of climate change. In addition, the evaporation in Hobq Desert is large in spring, and the relative humidity is small, which is easy to form sandstorms. The frequency of windy weather (wind speed ≥ 8 m/s) begins to increase. The dust source is mainly shifting dunes, and the sand particles are relatively coarse and contain a large number of quartz particles with high transparency and high reflectivity, resulting in a greater degree of deviation of the reflectivity to the high-value range (He et al., 2022). At the same time, March is the germination stage of fixed dunes vegetation, and the appearance of vegetation will cause the reflectivity to cluster at low values. The shifting and semi-shifting dunes are prone to direct reflection of light sources, with a high proportion of medium and high reflectivity (Wang et al., 2015), resulting in significantly lower peak values in different bands of fixed dunes than in the shifting and semi-shifting dunes. Vegetation on fixed dunes corresponds to low albedo, indicating that these areas have relatively high vegetation cover, which contributes to the stability and resistance of fixed dunes to wind erosion. The high albedo of mobile and semi-mobile dunes, on the other hand, may imply that these areas have low vegetation cover and are ecologically fragile and vulnerable to environmental change.
Data analysis based on FIRST NDVI can provide a more accurate monitoring tool for environmental management in desert areas, helping to identify drivers of vegetation change so that conservation and restoration measures can be developed accordingly. Although the FIRST model combines MODIS and Sentinel-2 data, the temporal and spatial consistency of different sensors may affect the accuracy of the final results. Understanding the effects of precipitation on vegetation growth can help to advance management measures during the dry season to protect existing vegetation and increase its resilience to adversity. During the analysis, precipitation was assumed to be the only limiting factor and other potential factors (e.g., soil type, vegetation type, etc.) were ignored, which may lead to a one-sided understanding of ecological relationships. Based on the reflectance characteristics and vegetation cover of different dune types, land use planning can be carried out more rationally to avoid overdevelopment of ecologically sensitive areas. The results of the study are mainly based on localized data, which may not fully reflect the effects of global climate change, and need to be combined with larger-scale studies to verify these findings.
5 Conclusion
The FIRST spatiotemporal fusion model was used to obtain data of different wavebands with a spatial resolution of 10 m and a temporal resolution of 1 day. This data could not only better retain the temporal variation information of MODIS data, but also reflect the spatial texture characteristics of Sentinel-2 data. At the same time, the FIRST NDVI calculated based on the waveband data in March had significant differences in shifting dunes, semi-shifting dunes, semi-fixed dunes and fixed dunes. Compared with MODIS NDVI, FIRST NDVI could better distinguish semi-fixed and fixed desert, and had strong applicability in the eastern part of Hobq Desert.
The emergence of vegetation in fixed dunes would cause the reflectivity to converge to low values in March. Shifting and semi-shifting dunes are prone to direct reflection of light sources, resulting in a higher proportion of medium and high reflectivity values. The peak values of different wavebands in fixed dunes are significantly lower than those in shifting and semi-shifting dunes.
Precipitation was the main limiting factor for the FIRST NDVI in the spring of Hobq Desert. The FIRST NDVI in Hobq Desert had a significant positive correlation with precipitation, both showing an increasing trend from west to east. The change in temperature was not the main limiting factor for vegetation growth, but as the temperature rised, it accelerated the process of surface evaporation, which indirectly led to a lack of soil moisture and had a significant inhibitory effect on vegetation growth.
Data availability statement
The datasets presented in this article are not readily available because internal data. Requests to access the datasets should be directed to eWFuZ2ZhbjMwOUB5ZWFoLm5ldA==.
Author contributions
XZ: Resources, Validation, Writing–review and editing. FY: Data curation, Writing–original draft. JW: Investigation, Software, Writing–review and editing. LX: Conceptualization, Writing–review and editing. SA: Project administration, Writing–review and editing. MM: Writing–review and editing, Investigation, Software. YS: Writing–review and editing, Formal Analysis, Validation.
Funding
The author(s) declare that financial support was received for the research, authorship, and/or publication of this article. This work was jointly supported by Desert Meteorological Science Research Foundation of China (Sqj2020011), the National Natural Science Foundation of China (U2242209), the Youth Innovation Team of China Meteorological Administration (CMA2024QN13), the Scientific and Technological Innovation Team (Tianshan Innovation Team) project (2022TSYCTD0007), and Innovation Think Tank Construction Research Project of Shanxi Provincial Association for Science and Technology (KXKT202418).
Conflict of interest
The authors declare that the research was conducted in the absence of any commercial or financial relationships that could be construed as a potential conflict of interest.
Publisher’s note
All claims expressed in this article are solely those of the authors and do not necessarily represent those of their affiliated organizations, or those of the publisher, the editors and the reviewers. Any product that may be evaluated in this article, or claim that may be made by its manufacturer, is not guaranteed or endorsed by the publisher.
References
Abdullah, M. M., Al-Ali, Z. M., Blanton, A., Charabi, Y., Abulibdeh, A., Al-Awadhi, T., et al. (2024). UAVs for improving seasonal vegetation assessment in arid environments. Front. Environ. Sci. 12, 1366712. doi:10.3389/fenvs.2024.1366712
Afuye, G. A., Kalumba, A. M., and Orimoloye, I. R. (2021). Characterisation of vegetation response to climate change: a review. Sustainability 13 (13), 7265. doi:10.3390/su13137265
Agarwal, A., Singh, R., Vatsa, M., and Ratha, N. (2020). Image transformation-based defense against adversarial perturbation on deep learning models. IEEE T Depend. Secure 18 (5), 1–2121. doi:10.1109/TDSC.2020.3027183
Alam, S., Manzur, T., Borquist, E., Williams, J., Rogers, C., Hall, D., et al. (2021). In-situ assessment of soil-root bonding strength to aid in preventing soil erosion. Soil Till Res. 213, 105140. doi:10.1016/j.still.2021.105140
Alherbawi, M., McKay, G., Govindan, R., Haji, M., and Al-Ansari, T. (2022). A novel approach on the delineation of a multipurpose energy-greenbelt to produce biofuel and combat desertification in arid regions. J. Environ. Manage 323, 116223. doi:10.1016/j.jenvman.2022.116223
Andrew, M. E., and Warrener, H. (2017). Detecting microrefugia in semi-arid landscapes from remotely sensed vegetation dynamics. Remote Sens. Environ. 200, 114–124. doi:10.1016/j.rse.2017.08.005
Ao, H., Rohling, E. J., Li, X., Song, Y., Roberts, A. P., Han, Y., et al. (2023). Northern hemisphere ice sheet expansion intensified Asian aridification and the winter monsoon across the mid-Pleistocene transition. Commun. Earth Environ. 4 (1), 36. doi:10.1038/s43247-023-00686-9
Bahddou, S., Otten, W., Whalley, W. R., Shin, H. C., El Gharous, M., and Rickson, R. J. (2023). Changes in soil surface properties under simulated rainfall and the effect of surface roughness on runoff, infiltration and soil loss. Geoderma 431, 116341. doi:10.1016/j.geoderma.2023.116341
Cai, Y., Zhang, F., Duan, P., Jim, C. Y., Chan, N. W., Shi, J., et al. (2022). Vegetation cover changes in China induced by ecological restoration-protection projects and land-use changes from 2000 to 2020. CATENA 217, 106530. doi:10.1016/j.catena.2022.106530
Dhillon, M. S., Dahms, T., Kübert-Flock, C., Liepa, A., Rummler, T., Arnault, J., et al. (2023). Impact of STARFM on crop yield predictions: fusing MODIS with Landsat 5, 7, and 8 NDVIs in Bavaria Germany. Remote Sens. 15 (6), 1651. doi:10.3390/rs15061651
Dong, S., Zhang, W., Xu, J., and Ma, J. (2020). Study of the improved similar pixel selection method on ESTARFM. Remote Sens. Technol. Appl. 35 (1), 185–193. doi:10.11873/j.issn.1004-0323.2020.1.0185
Ghassemian, H. (2016). A review of remote sensing image fusion methods. Inf. Fusion 32, 75–89. doi:10.1016/j.inffus.2016.03.003
Guerra, C. A., Maes, J., Geijzendorffer, I., and Metzger, M. J. (2016). An assessment of soil erosion prevention by vegetation in Mediterranean Europe: current trends of ecosystem service provision. Ecol. Indic. 60, 213–222. doi:10.1016/j.ecolind.2015.06.043
Hasan, S. S., Alharbi, O. A., Alqurashi, A. F., and Fahil, A. S. (2024). Assessment of desertification dynamics in arid coastal areas by integrating remote sensing data and statistical techniques. Sustainability 16 (11), 4527. doi:10.3390/su16114527
He, P., Bi, R., Xu, L., Liu, Z., Yang, F., Wang, W., et al. (2023a). Evapotranspiration of winter wheat in the semi-arid southeastern loess plateau based on multi-source satellite data. Remote Sens. 15 (8), 2095. doi:10.3390/rs15082095
He, P., Bi, R., Xu, L., Yang, F., Wang, J., and Cao, C. (2022). Study on spatial and temporal characteristics of surface albedo at the northern edge of the badain jaran Desert based on C+ STNLFFM model. Sensors 22 (17), 6494. doi:10.3390/s22176494
He, P., Xu, L., Bi, R., Yang, F., and Zhen, Z. (2021). Spatial and temporal characteristics of surface albedo in Badain Jaran Desert, China. Earth Sci. Inf. 14, 429–440. doi:10.1007/s12145-020-00565-3
He, P., Yang, F., Bi, R., Xu, L., Wang, J., Zheng, X., et al. (2023b). Adaptability evaluation of the spatiotemporal fusion model in the summer maize planting area of the southeast loess plateau. Agronomy 13 (10), 2608. doi:10.3390/agronomy13102608
Hilal, A. M., Al-Wesabi, F. N., Alzahrani, K. J., Al Duhayyim, M., Ahmed Hamza, M., Rizwanullah, M., et al. (2022). Deep transfer learning based fusion model for environmental remote sensing image classification model. Eur. J. Remote Sens. 55 (Suppl. 1), 12–23. doi:10.1080/22797254.2021.2017799
Hill, M. J., and Guerschman, J. P. (2022). Global trends in vegetation fractional cover: hotspots for change in bare soil and non-photosynthetic vegetation. Agr Ecosyst. Environ. 324, 107719. doi:10.1016/j.agee.2021.107719
Jarihani, A. A., McVicar, T. R., Van Niel, T. G., Emelyanova, I. V., Callow, J. N., and Johansen, K. (2014). Blending Landsat and MODIS data to generate multispectral indices: a comparison of “Index-then-Blend” and “Blend-then-Index” approaches. Remote Sens. 6 (10), 9213–9238. doi:10.3390/rs6109213
Kidron, G. J. (2024). Is nonrainfall water a likely water source for arid and semiarid biocrusts? A critical perspective. Ecohydrology 17, e2647. doi:10.1002/eco.2647
Knauer, K., Gessner, U., Fensholt, R., and Kuenzer, C. (2016). An ESTARFM fusion framework for the generation of large-scale time series in cloud-prone and heterogeneous landscapes. Remote Sens. 8 (5), 425. doi:10.3390/rs8050425
Kubo, S., Hashida, K., Makino, R., Magara, K., Kenzo, T., Kato, A., et al. (2013). Chemical composition of desert willow (Salix psammophila) grown in the Kubuqi Desert, Inner Mongolia, China: bark extracts associated with environmental adaptability. J. Agric. Food Chem. 61 (50), 12226–12231. doi:10.1021/jf4038634
Liu, S., Zhou, J., Qiu, Y., Chen, J., Zhu, X., and Chen, H. (2022). The FIRST model: spatiotemporal fusion incorrporting spectral autocorrelation. Remote Sens. Environ. 279, 113111. doi:10.1016/j.rse.2022.113111
Lyapustin, A., Wang, Y., Choi, M., Xiong, X., Angal, A., Wu, A., et al. (2023). Calibration of the SNPP and NOAA 20 VIIRS sensors for continuity of the MODIS climate data records. Remote Sens. Environ. 295, 113717. doi:10.1016/j.rse.2023.113717
Malenovský, Z., Bartholomeus, H. M., Acerbi-Junior, F. W., Schopfer, J. T., Painter, T. H., Epema, G. F., et al. (2007). Scaling dimensions in spectroscopy of soil and vegetation. Int. J. Appl. Earth Obs. Geoinf. 9 (2), 137–164. doi:10.1016/j.jag.2006.08.003
Niu, A., Zhu, Y., Zhang, C., Sun, J., Wang, P., Kweon, I. S., et al. (2022). MS2Net: multi-scale and multi-stage feature fusion for blurred image super-resolution. IEEE T Circ. Syst. Vid. 32 (8), 5137–5150. doi:10.1109/TCSVT.2022.3153390
Peirce, E. S., Kearney, S. P., Santamaria, N., Augustine, D. J., and Porensky, L. M. (2024). Predictions of aboveground herbaceous production from satellite-derived APAR are more sensitive to ecosite than grazing management strategy in shortgrass steppe. Remote Sens. 16 (15), 2780. doi:10.3390/rs16152780
Rahman, A., Farrok, O., and Haque, M. M. (2022). Environmental impact of renewable energy source based electrical power plants: solar, wind, hydroelectric, biomass, geothermal, tidal, ocean, and osmotic. Renew. Sust. Energy Rev. 161, 112279. doi:10.1016/j.rser.2022.112279
Vélez, S., Martínez-Peña, R., and Castrillo, D. (2023). Beyond vegetation: a review unveiling additional insights into agriculture and forestry through the application of vegetation indices. J 6 (3), 421–436. doi:10.3390/j6030028
Vogelmann, J. E., Gallant, A. L., Shi, H., and Zhu, Z. (2016). Perspectives on monitoring gradual change across the continuity of Landsat sensors using time-series data. Remote Sens. Environ. 185, 258–270. doi:10.1016/j.rse.2016.02.060
Wang, M., Dong, Z., Luo, W., Lu, J., and Li, J. (2015). Spatial variability of vegetation characteristics, soil properties and their relationships in and around China’s Badain Jaran Desert. Environ. Earth Sci. 74, 6847–6858. doi:10.1007/s12665-015-4685-z
Wang, X., Geng, X., Liu, B., Cai, D., Li, D., Xiao, F., et al. (2022). Desert ecosystems in China: past, present, and future. Earth-Science Rev. 234, 104206. doi:10.1016/j.earscirev.2022.104206
Yang, X., Li, X., Wang, X., Ding, F., Chen, F., Wang, J., et al. (2022). Meta-analysis of the correlation between vegetation and precipitation in the temperate deserts of the Northern Hemisphere over the last 40 years. Ecological Indicators. doi:10.1016/j.ecolind.2022.109269
Zhang, C., Li, W., Cui, J., Wang, P., Tian, X., Dai, Y., et al. (2024). The windbreak effects of organic fence made from branches of Salix psammophila in Hobq Desert. Land Degrad. Dev. 35 (11), 3653–3662. doi:10.1002/ldr.5158
Zhang, C., Shen, Y., Li, Q., Jia, W., Li, J., and Wang, X. (2018). Sediment grain-size characteristics and relevant correlations to the aeolian environment in China's eastern desert region. Sci. Total Environ. 627, 586–599. doi:10.1016/j.scitotenv.2018.01.270
Zhang, X., Wang, G., Xue, B., Wang, Y., and Wang, L. (2022). Spatiotemporal variation of evapotranspiration on different land use/cover in the inner Mongolia reach of the Yellow River Basin. Remote Sens. 14 (18), 4499. doi:10.3390/rs14184499
Zhao, K., Zhong, Q., Chen, S., Wu, H., Shan, Y., Qian, B., et al. (2024). Experimental study on overtopping failure of concrete face rockfill dam. Case Stud. Constr. Mater. 21, e03640. doi:10.1016/j.cscm.2024.e03640
Zheng, J., Bian, J., Ge, Q., Hao, Z., Yin, Y., and Liao, Y. (2013). The climate regionalization in China for 1981-2010. Chin. Sci. Bull. 58 (30), 3088–3099. doi:10.1360/972012-1491
Keywords: Hobq Desert, NDVI, First model, geographical detector model, desert type
Citation: Zheng X, Yang F, Wang J, Xu L, Abudukade S, Ma M and Sun Y (2024) Adaptability evaluation of the FIRST model in Hobq Desert, northern China. Front. Earth Sci. 12:1493726. doi: 10.3389/feart.2024.1493726
Received: 09 September 2024; Accepted: 06 December 2024;
Published: 23 December 2024.
Edited by:
Venkata Ravibabu Mandla, National Institute of Rural Development and Panchayati Raj, IndiaReviewed by:
Yahui Guo, Central China Normal University, ChinaVishakha Sood, Indian Institute of Technology Ropar, India
Kunpeng Zhao, Nanjing Hydraulic Research Institute, China
Copyright © 2024 Zheng, Yang, Wang, Xu, Abudukade, Ma and Sun. This is an open-access article distributed under the terms of the Creative Commons Attribution License (CC BY). The use, distribution or reproduction in other forums is permitted, provided the original author(s) and the copyright owner(s) are credited and that the original publication in this journal is cited, in accordance with accepted academic practice. No use, distribution or reproduction is permitted which does not comply with these terms.
*Correspondence: Fan Yang, eWFuZ2ZhbjMwOUB5ZWFoLm5ldA==
 Xinqian Zheng1
 Fan Yang