- 1Department of Earthquake Risk Prevention and Control, Shanxi Earthquake Agency, Taiyuan, China
- 2National Continental Rift Valley Dynamic Observatory of Taiyuan, Taiyuan, China
- 3Department of Earth Sciences and Engineering, Taiyuan University of Technology, Taiyuan, China
Assessing the stability of loess landslides under seismic action scientifically and reasonably is crucial for reducing earthquake disasters and ensuring the safety of people’s lives and property. To study this issue, we chose the southern part of Fushan County, Shanxi Province as the research area, where loess slopes develop and earthquake impacts are strong. Based on the high-precision DEM images of the study area obtained from the unmanned aerial vehicle photogrammetry, we selected 32 representative profiles by sampling according to our principles, and used the simplified Bishop method popular in engineering for modeling and calculation to evaluate the stability of the entire slopes in the area. The calculation results were then statistically analyzed, and the stability and impact range of the slopes were evaluated by means of the graphical form. The results show that in the study area the value of slope safety coefficient (Fs) is mostly within a range of 0.7–1.35 and the value of the avoidance distance is mostly within a range of 5–20 m under a seismic force of 0.20 g, and the slope safety coefficient is mainly determined by the slope angle, and the avoidance distance is mainly determined by the slope height, which is in line with the conclusions of previous research conclusions. In the paper we make a useful attempt for quantitative evaluation of regional seismic loess landslides, and the fact proves that the approach is feasible and efficient, and it can provide quantitative data for major construction projects to avoid landslide disasters.
1 Introduction
Landslides are worldwide natural disasters widely distributed (Wei et al., 2024; An et al., 2016; Qiu et al., 2022), with extremely strong destructive power and enormous harm to human beings. In recent years, triggering factors such as human activities, climate changes, and earthquakes have intensified the occurrence of landslide disasters, seriously damaging the safety of people’s lives and assets (Zhu et al., 2024; Qiu et al., 2024; Froude and Petley, 2018). Therefore, analyzing and evaluating the stability of slopes under various triggering factors has always been an important topic for experts and scholars, which is also a reliable way to control and reduce landslide disasters.
Loess, which is widely distributed in the northern part of China, is a kind of loose sediment formed under arid climate conditions due to wind accumulation since the Quaternary period. Compared with other soils, the stability of loess slopes should be given more attention due to its origin and the special nature of the soil. Loess’s own unique porous and weakly cemented structure easily makes it disastrous under dynamics (Wang, 2003). The Loess Plateau is the main area of loess distribution in China, with criss-cross ravines and complex topography (Zhang, 1999), where the development of geologic hazards, especially landslide hazards, is remarkable. Meanwhile this area is also characterized by the development of large active faults, strong neotectonic activity and frequent earthquakes. A large number of field surveys indicate that earthquakes of ML ≥ 4.0 can trigger landslides (Keeper, 1984). Therefore, earthquake action is often one of the main triggering factors of loess landslides. Not only that, the earthquakes of the neighboring regions, such as the 2008 M 8.0 Wenchuan earthquake in China, also triggered severe landslide disasters in the Loess Plateau area far from the epicenter. Landslides triggered by earthquakes are one of the major seismic hazards in the loess region, and the loss caused by landslides triggered by previous large earthquakes in history were often larger than the losses directly caused by the earthquakes (Zhang, 2011). According to the “Zoning Map of Ground Motion Parameter in China” (GB18306-2015), in the ground motion parameter zoning map for 10-percent probability of exceedance in 50 years, the ground shaking intensity of about half of the loess area exceeds 0.20 g, and nearly 80% of the area exceeds 0.15 g (Wang et al., 2023). Reducing loess landslide disasters in highest measure depends on our scientific analysis and evaluation of this issue, as well as the reasonable measures taken on this basis.
Stability evaluation of loess slopes is an important aspect in the study of landslides in the field of geotechnical engineering. So far, a large number of experts and scholars at all times and in all countries have carried out many fruitful in-depth research through a variety of means around this scientific problem, achieved a series of important understanding on the mechanism of generation of loess landslides caused by earthquakes, and developed a great many methods of landslide stability analysis, such as the quasi-static method, the slider method, the finite element method and the statistics method and so on (Chang et al., 2020; Chang et al., 2022; Chen et al., 2005; Hu et al., 2021; LI et al., 2021; Li, 2019; Liu et al., 2007; Qi, 2002; Wu et al., 2023; Wu et al., 2013; Xia and Li, 2002; Xian and Chen, 2013; Yang et al., 2022; Yin, 2020; Zhao, 2016). Each of these methods has its own characteristics in performing seismic loess landslide evaluation. For the risk evaluation of regional seismic landslide hazard, the regional statistics method based on GIS is mainly utilized at present (Zhou et al., 2023). However, the final result given by this method is mostly the extent of the hazard, which is far from the evaluation standard commonly used in current engineering. The quasi-static method, as a method based on the theory of limit equilibrium, has its own unique advantages (Liu et al., 2007; Bo et al., 2019; Meko et al., 2023; Ye and Zhang, 2023; Baker et al., 2006), and is most widely used in the engineering field. This method assumes that the instantaneous load of ground shaking action is stressed in the center of the potential landslide body, and according to the limit equilibrium theory, we analyze all the forces exerted on the landslide body along the sliding surface, and then solve the moment equilibrium equations. In this method the stability of the landslide body is evaluated by the slope safety coefficient (Fs). The larger the coefficient, the more stable the landslide, while the smaller the coefficient, the less the stability of the slope. This method is easy to use and most of the calculations on landslides of various technical specifications are based on this type of method.
Due to hydraulic erosion, loess distribution areas have many gullies and valleys, forming a geomorphologic pattern dominated by loess platform lands, loess ridges and loess hills, which lead to the scarcity of land, and provide natural topographic conditions for the formation of seismic loess landslides meanwhile. Seismic loess landslides are often densely spread in the form of lines, clusters and bands on the sides of loess platform lands, single thin ridges and hills, gullies and water systems (Wang et al., 2023). But these areas of loess platform land margins, are usually the places with frequent human activities, such as towns and cities, factories, mines and engineering facilities. In this paper, the loess slopes in the south of Fushan County, Shanxi Province, are selected as the study area, and based on the high-precision aerial photogrammetric data, the quasi-static method commonly used in engineering is introduced to calculate and evaluate the stability and the influence range of the seismic loess landslides in the study area, so that we can provide a more specific and reasonable scientific basis for the seismic loess landslides risk assessment and prevention. It is of great value to the improvement of reducing the loess landslide risk and rationally planning of engineering sites.
2 Study area
Fushan County, Linfen City, as the study area, is well representative. In terms of climate, Fushan County has a temperate continental climate, characterized by frequent winds and less rainfall, with an average annual evaporation exceeding three times the average annual rainfall (Guan et al., 2015; Dai et al., 2017). In terms of neotectonic background (Figure 1), the study area is located in the Shanxi rift zone at the eastern edge of the Ordos block, which is characterized by strong neotectonic movements and the development of several faults at the basins’ boundary, which have been continuously active since the Holocene and have produced a number of strong earthquakes of magnitude 7 or higher in history (The Research Groupon Active Fault System around Ordos Massif, 1988; Ren et al., 2002; Zhang et al., 2021; Xu et al., 2018; Sun et al., 2023). In the Linfen Basin, where the study area is located, two major earthquakes of magnitude 8 in 1,303 in Hongtong and magnitude 7¾ in 1,695 in Linfen occurred. The study area has a very significant seismic tectonic background and seismic conditions (Li et al., 2014). The Zoning Map of Ground Motion Parameter in China (GB18306-2015) (ZMGMPC) classifies Fushan County as the 0.20 g zone. This implies that seismic action is an important triggering factor among the natural factors for slope instability in this area.
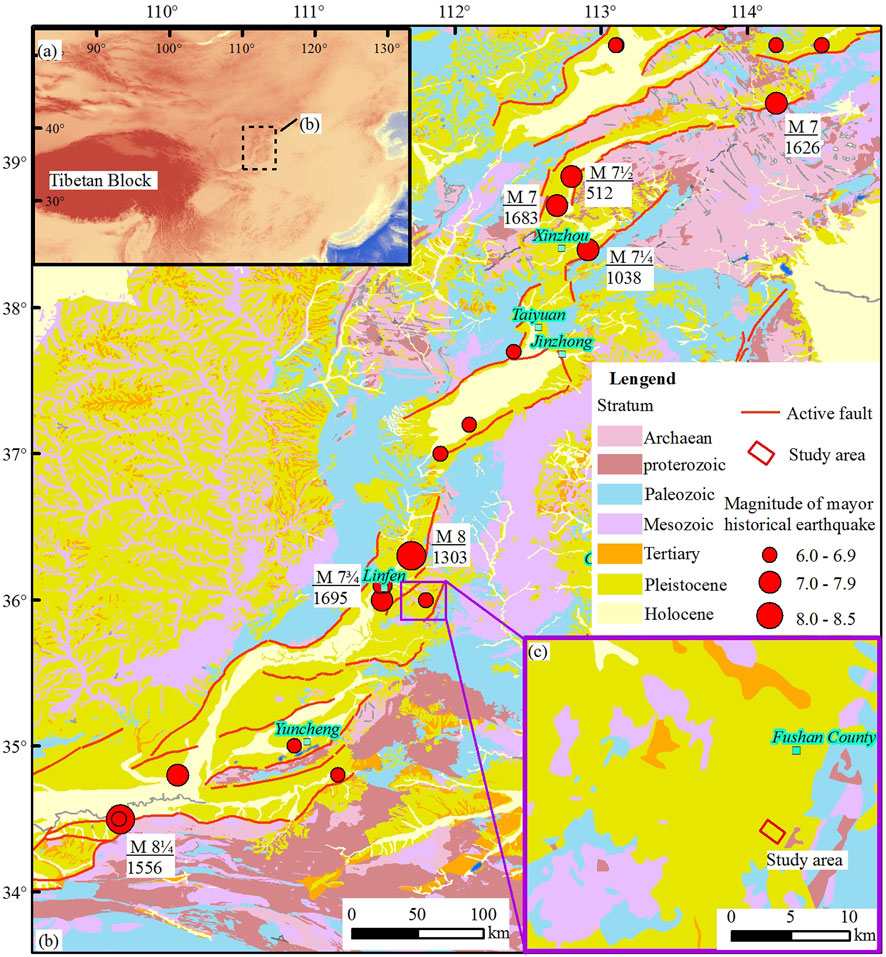
Figure 1. Seismotectonic background map of the study area. (A) Map showing the location of the Shanxi rift zone, which lies at the eastern edge of the Ordos block. (B) Geological map showing the tectonic units of the Shanxi rift zone, which consists of several basins controlled by active faults. Historic earthquakes are labeled as red points by size. (C) Map of the study area in Fushan Basin of Linfen Basin, at the southern part of the Shanxi rift zone.
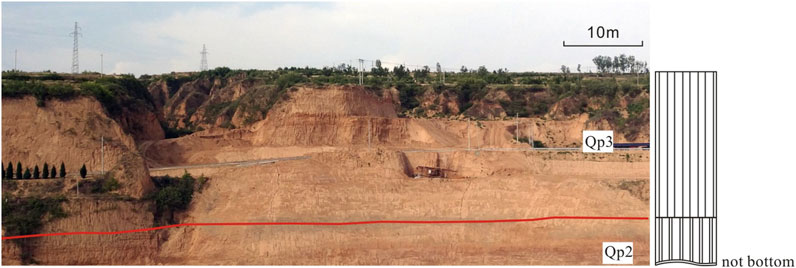
In terms of stratigraphic and geomorphologic features, the study area is located at the east of the Loess Plateau, and in the secondary Fushan Basin at the eastern part of the Linfen Basin. Fushan Basin is characterized by long gullies, undulating hills and complex topography, with the terrain high in the east and low in the west. The loess platform area accounts for about 24.9% of the total area, while the rest is mostly loess hilly area. The loess platform area is deeply divided into smaller sub-platforms by the “V”-shaped gullies of several north-west rivers in the eastern mountains, and the walls of the loess gullies along the platforms are steep and straight, with serious erosion and collapse, and the depth of the gullies varies from 40 to 100 m. The stratum of this area is mainly loess, with uniform soil quality and stable distribution. According to the profile of the gully (Figure 2), the upper part of the stratum develops Malan loess of Late Pleistocene (Qp3), which is mainly composed of light-yellow silt with large pores, relatively loose structure, and plant roots are often seen; the lower part of the stratum is Lishi loess of Middle Pleistocene (Qp2), which is mainly composed of brownish-red powdery clay in the state of hard-plasticization and rigidity, and sand and gravel Lenticular bodies are occasionally seen. These edge zones are usually the zones with frequent human activities and the main places where loess landslides generate under seismic effects. We select a representative alluvial gully around Fushan County as the study area for this seismic loess landslide evaluation.
3 Methods
3.1 The simplified bishop method
As a kind of method based on the theory of limit equilibrium, the quasi-static method includes the Swedish method, simplified Bishop method, Janbu method, Morgenstern and Price method, Spencer method and so on, among which the simplified Bishop method is more commonly used. The simplified Bishop method usually represents the correct solution. In general, for the slopes without structural surfaces or weak soil layers, the simplified Bishop method calculations using circular slip-fracture surfaces can often be obtained with sufficient accuracy (Zhu, 2008; Ji et al., 2020; Ramadhani et al., 2022; Wright et al., 1973). The method is effective for loess slopes in the study area.
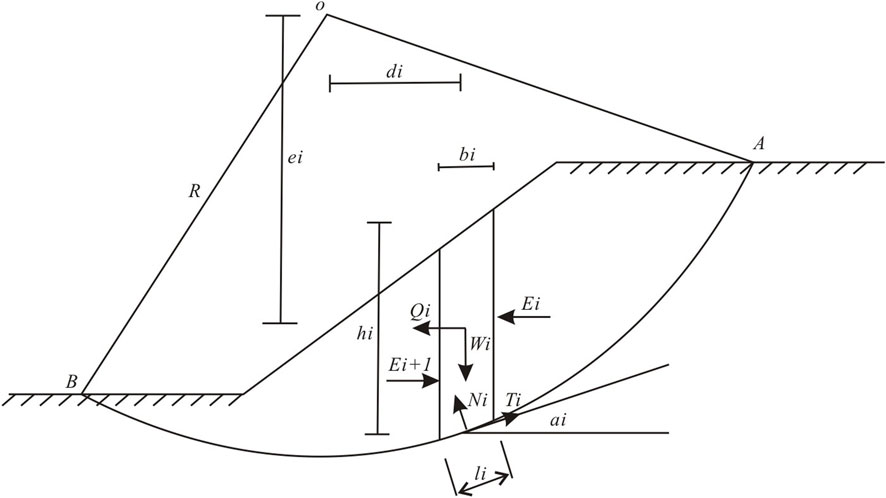
Simplified Bishop method is a two-dimensional calculation method (Figure 3), which considers the landslide surface as a circular arc and divides the landslide body into a number of appropriately spaced soil strips. This method considers the horizontal force between soil strips, and considers that the tangential forces in the up and down directions on each soil strip cancel each other, i.e., it does not consider the tangential force between soil strips. As shown in the figure, we assume one possible sliding landslides, whose sliding surface is the arc AB, and then select one of the soil bar arbitrarily for force analysis, and all the forces acting on the soil bar and their moments have been labeled on the diagram, of which the horizontal force Qi is the seismic force. If the soil bar is in static equilibrium, according to the vertical force equilibrium condition, the relationship shown in Equation 1 should be satisfied:
According to the limit equilibrium condition when the safety factor of Fs is satisfied (Equation 2):
where
Where
Considering the overall moment equilibrium condition of the whole sliding body, we hold the opinion that the sum of all the soil bars’ force moments on the center of the circle is zero. The forces between the bars, equal in size and opposite in direction, appear in pairs, so the moments they produce are zero on the center of the circle. The pressure Ni on the sliding surface, which points to the center of the circle, does not produce moment either. So only gravity Wi and the tangential force Ti on the sliding surface produce moment on the center of the circle, so we get the relationship shown in Equation 4:
Combining with the upper formulas we finally get:
Equation 5 is the general formula of simplified Bishop method (Li et al., 2013; Barnes, 2017; Verruijt, 2001; Zou, 2002; Bishop, 1955). In this study, the seismic force is the horizontal force Qi, acting at the center of each soil bar. The equation needs to be solved by an iterative method, and usually 3-4 iterations are sufficient to meet the requirements of engineering accuracy and the iterations always converge (Li et al., 2013). In order to find the minimum factor of safety Fs, a number of possible sliding surfaces are assumed to calculate and the minimum value is picked out at the end.
3.2 Acquisition of terrain data
Topographic mapping data of loess slopes is the basis for profile stability calculation and key for landslide evaluation. Remote sensing images, although covering a large area, have a low spatial resolution (Bi et al., 2017), and are weakly targeted for a small study area. Traditional surveying methods are able to collect high-precision topographic data, but they are time-consuming, labor-intensive, and have a large workload (Ouédraogo et al., 2014). With the development of low-altitude and low-speed small unmanned aircraft industry, photogrammetry based on unmanned aerial vehicle (UAV) is widely used in geological surveys (Jia et al., 2018). The new aerial photogrammetry SfM (Structure from Motion) technique has become a widely used method to obtain high-precision DEM data because of its advantages such as low cost, high flexibility, and the ability to quickly obtain high-precision 3D terrain data (Klinger et al., 2011; Xu et al., 2024; Liu et al., 2021). It can fully meet the requirements of terrain accuracy in this slope hazard assessment.
For this measurement, we used a small quadcopter UAV (brand model Dji Phantom 4Pro) for data collection. This model of UAV has powerful aerial photography function, equipped with inertial navigation system and GPS measurement system, which can provide meter-level positioning accuracy for the aerial survey data, and at the same time, it is equipped with 8.8 mm focal length wide-angle autofocus high-definition lenses, which can obtain 20-megapixel images. The flight altitude of this aerial survey is 100 m, and the overlap rate of the aerial images in the heading and side direction is 85% and 67% respectively, and the images are stored in JPG format, covering a total of about 2,500 m in length and 1,000 m in width of the study area.
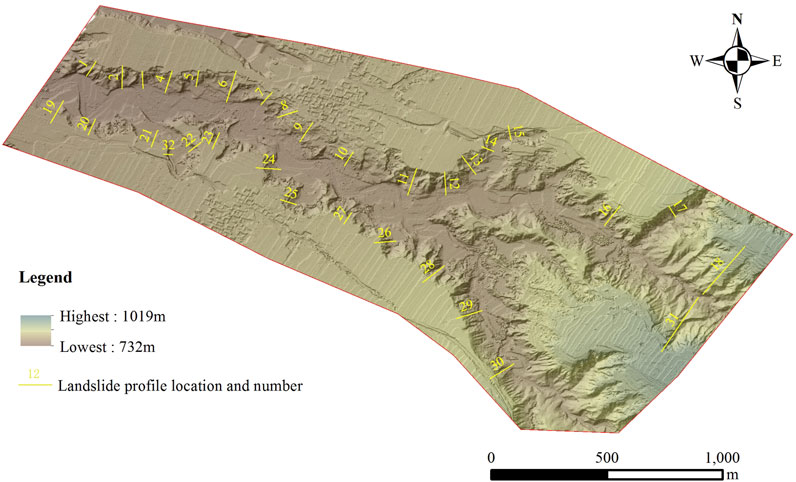
Subsequently, Agisoft Photoscan is used to process the aerial survey data, a total of 2,386 photos. The process is based on the principle of “Stereo-scopic photogrammetry”, i.e., extracting the digital 3D model of the target object from the overlapping 2D image sequences. Specifically, the processing software is used to obtain high-density terrain point cloud data, and the processing process refers to the empirical methods of previous researchers to ensure the accuracy and reliability of the processing results. The results show that the average density of the terrain point cloud is 89 per square meter; the image overlapping density is not less than 6 images, which indicates that the aerial survey process is carried out from different angles to observe the landforms, which ensures the accuracy of the three-dimensional features of the landforms. Then we used the natural neighbor interpolation method to interpolate the point cloud data to generate the grid data DEM (Figure 4), the resolution of which can reach 0.1 m. The result data accuracy is far enough to meet the need of slope stability calculation.
3.3 Selection of calculation profiles
Generally, considering that the slope section under examination is part of a longitudinally extended slope, it is feasible to evaluate the stability of the slope in a two-dimensional profile (Hoek and Bray, 1981; Kumar et al., 2024). In the slope section within a certain longitudinal length, the geological strata, slope height, gradient, and slope shape of the slope are similar, and the two-dimensional profile is representative. Therefore, the evaluating results of representative profiles selected at intervals on the gully slopes can reflect the stability of the entire slopes in the area. Of course, the more the representative profiles, the higher the final evaluation accuracy. Previous researchers have made beneficial attempts using this sampling method to evaluate regional landslides in loess areas, and have achieved good results (Zeng and Chen, 2015; Gu et al., 2014).
The gully in the study area is north-west and is about 2.5 km long, with steep slopes of varying heights and gradients on both sides of the gully. Our purpose is to select a number of typical profiles in the steep slopes of the gully to calculate the safety coefficient (Fs) to reflect the landslide hazard of the whole gully slope, so it is very important to select representative profiles reasonably. Therefore, for the selection of calculation profiles, the following principles are followed: ① The locations selected to cover the study area as uniformly as possible; ② Traverse the entire study area, set up representative profiles for sections with similar heights and gradients, bounded by a significant change in height or gradient; ③ Steep slopes with similar heights and gradients at different slope sections are considered to have the same calculation results if there is not much difference in the slope shapes; ④ Slope sections with gradient of less than 15° or height of less than 10 m are not selected for calculation.
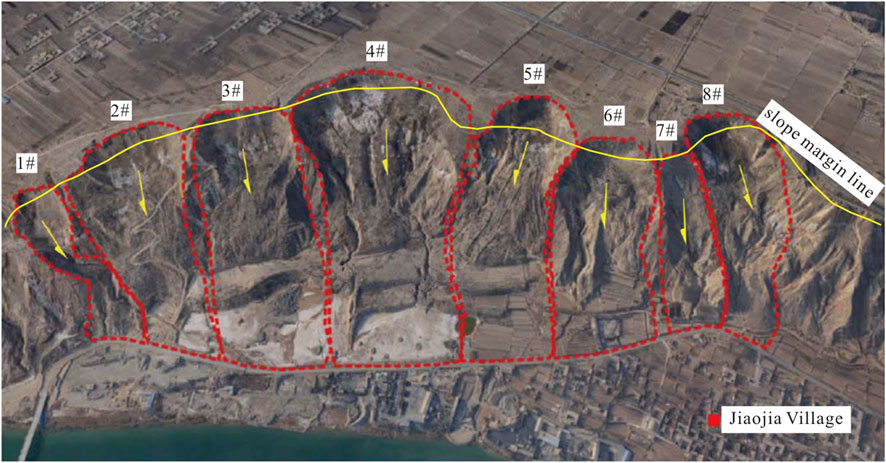
Meanwhile another important issue is the direction of the potential landslide, which determines the tendency of the chosen profile for calculation. Obviously, at the same location, the profiles are different with different directions, but the most probable, or the most dangerous potential sliding surface is unique. In order to solve this problem, we looked through the photos and data of previous loess landslides, and after rough counting, we found that the sliding direction of landslides is usually orthogonal or nearly orthogonal to the slope margin line (Figure 5, modified from (Li and Mo, 2019)). As a matter of fact, this is in line with our empirical knowledge and physical laws. Therefore, the selection of all profiles in this study follows this principle, i.e., the profile direction perpendicular to the edge line at the slope margin and pointing toward the center of the gully.
Following the above principles, we select 32 slope profiles from the study area, which roughly include all the characteristics of slopes in the study area, and the distribution of profiles is shown in Figure 4.
3.4 Determination of calculation parameters
Whether qualitative evaluation or quantitative calculation, seismic loess landslides involve a variety of influencing factors, such as stratigraphy, geomorphology, slope height, slope angle, groundwater and external dynamic conditions. In the actual evaluation, the researchers often take several of the main controlling factors for operation and calculation according to the actual situation. It is feasible that seismic force, stratigraphy, slope angle and other factors should be considered when seismic landslide and avalanche evaluation is carried out in the Loess Plateau region (Wang, 2003). In this paper, the parameters involved in the calculation of landslide safety factors based on the simplified Bishop method are slope shape, stratigraphic division, groundwater level, loess gravity γ, angle of internal friction φ, and cohesion c and so on. In this paper, we study the stability of landslides under the action of seismic forces, and of course, seismic force Q.
As mentioned in the previous subsection, we select 32 typical profiles in the study area, and basing on the DEM image, it is possible to obtain the slope shape data of the selected profiles, including the slope heights, overall slope angles, and so on.
According to the geological and geomorphological survey and drilling data along the study area, Malan loess (Qp3) and Lishi (Qp2) loess are widely distributed in the study area, of which the thickness of Malan loess in the upper part is about 15–20 m, and the maximum thickness of Lishi loess in the lower part is nearly 100 m, and in the study area we do not find the bottom boundary of Lishi loess. The distribution of strata is relatively homogeneous horizontally, and for the sake of creating a model, the thickness of the upper Malan loess is taken to be the median of 18 m. The depth of groundwater in the study area is more than 100 m, so groundwater is not involved in the modeling process.
In the model analysis, simplified Bishop method is based on the theory of limiting equilibrium. When the shear stress at a point on any plane in the soil is equal to the shear strength of the soil, the point is in a critical state on the verge of destruction. The soil body is set as an ideal elastic-plastic material, and the Mohr-Coulomb principle is adopted. Mohr-Coulomb model’s parameters needed to be input are: loess heaviness γ, angle of internal friction φ, cohesion c. In this calculation the empirical values (Yu et al., 2014; Ji and Sui, 2012) of these geotechnical parameters of Linfen area are adopted, As Table 1 shows.
The seismic force in the calculation is embodied as a static force in the form of integrated horizontal seismic coefficient of the slope. According to the provision of 5.2.6 of “China’s Technical Specification for Building Slope Engineering” (GB50330-2013) (Chongqing Urbanand Rural Construction Commission, 2013), when the stability of the slope is calculated by the limit equilibrium method or the quasi-static method, the seismic effect of the sliding body, block or unit can be simplified as a horizontal static force acting on the center of gravity of the sliding body, block or unit, pointing to the outside of the slope (in the direction of sliding), and the value should be calculated according to the formula: Q = αwG. In the formula, Q is the seismic force of the soil bar or the block; G is the self-weight of the soil bar or the block; αw is the integrated horizontal seismic coefficient of the slope, which is determined by the following (Table 2):
The study area is located in the 0.20 g zone of the zoning map, and the corresponding integrated horizontal seismic coefficient (αw) is taken as 0.05.
3.5 Model building and calculation
The profile elevation is read from the DEM image, and the profile is established. The upper 18 m of the profile is Malan loess, and the lower part of the profile is Lishi loess. According to the above parameterization method, different geotechnical parameters are assigned to the two strata, and the horizontal seismic coefficient is taken as 0.05, and the model is constructed for calculation. Take the 11th profile as an example, the profile is about 35 m high, the overall slope angle is about 43°, according to the simplified bishop method, the safety factor Fs of the profile is 0.990 under the action of 0.20 g horizontal seismic force, and the influence distance from the back edge of potential landslide to the edge of the slope (which is called the avoidance distance) is about 14 m, as shown in Figure 6.
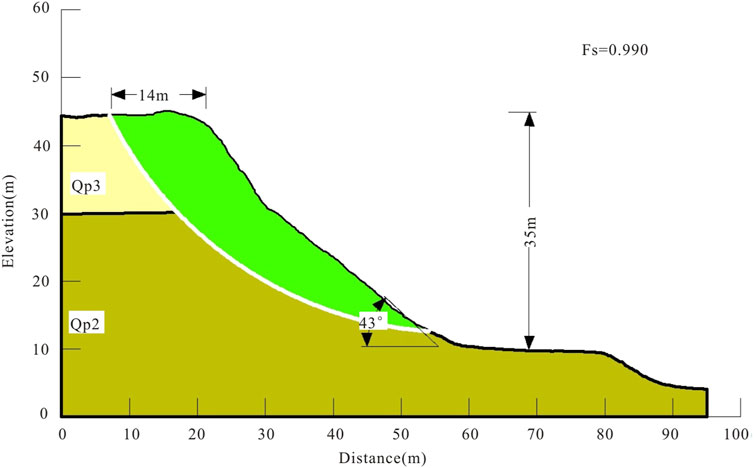
Figure 6. Diagram of model building and calculation results of profile 11. The white arc in the diagram represents the most dangerous sliding surface. The diagram also marks out that the slope height is 35 m, the slope angle is 43°, the avoidance distance is 14 m, and the safety coefficient is 0.99.
4 Results
4.1 Statistical analysis
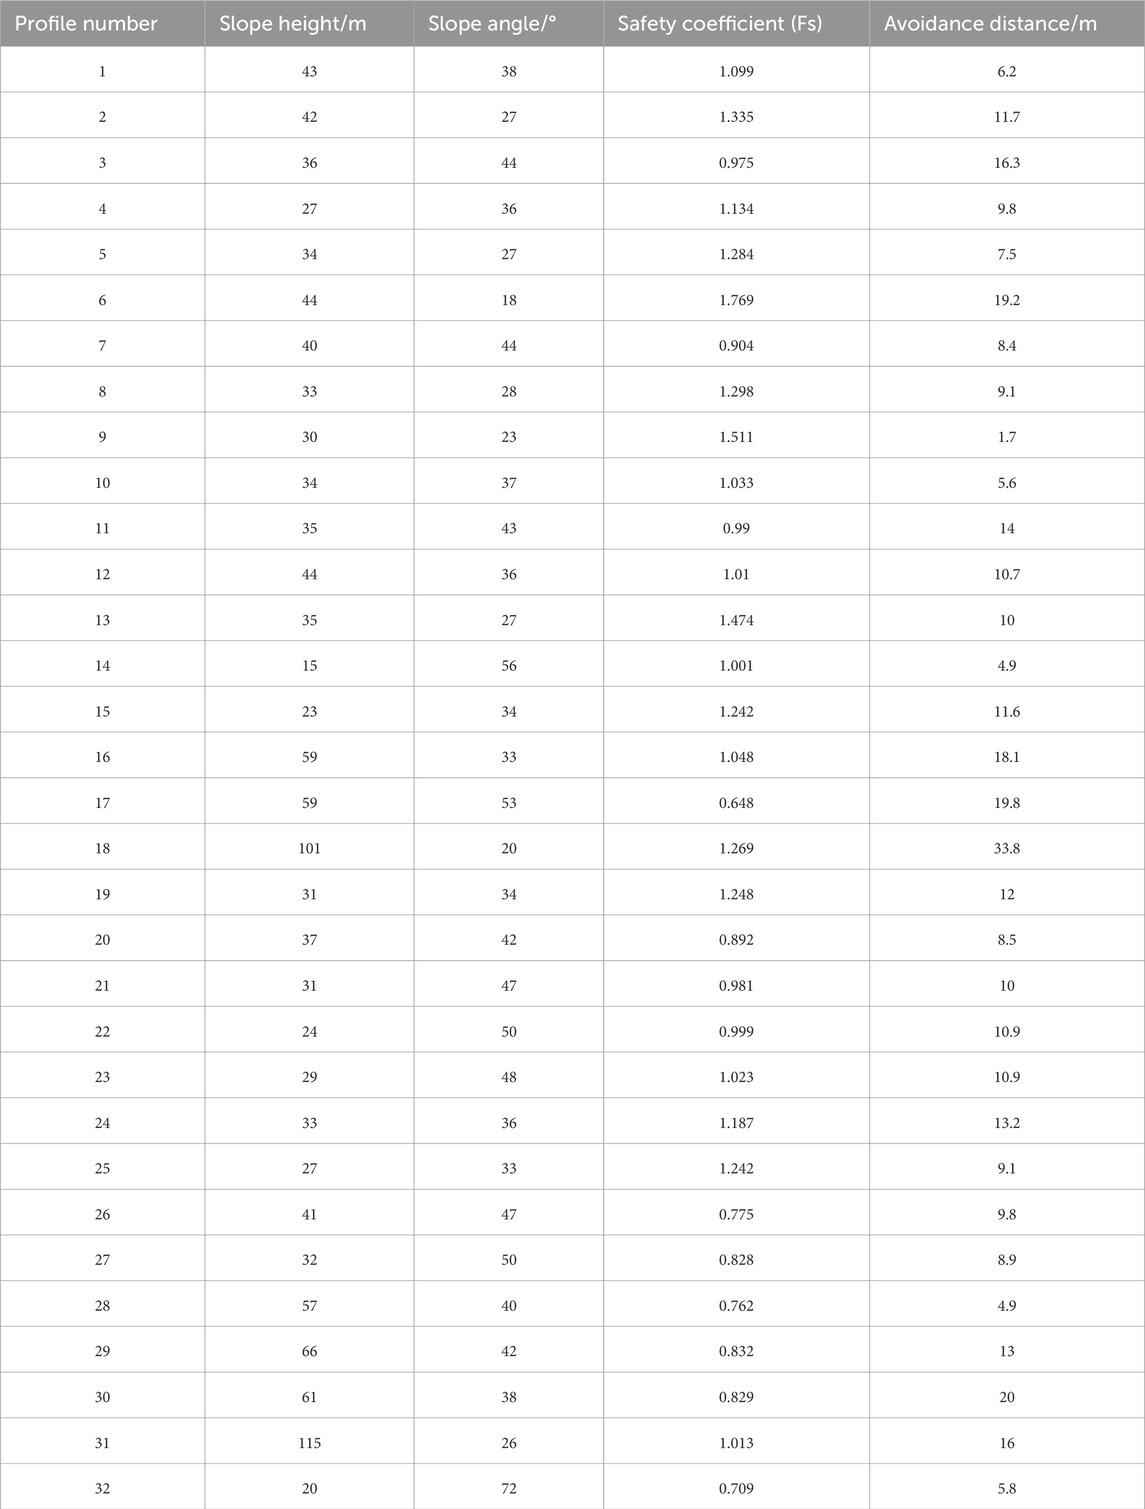
Following the method above to build slope models, and using the simplified Bishop method, we sequentially calculate the safety coefficient and avoidance distance of 32 profiles in the study area. We use four indicators, i.e., slope height, slope angle, safety coefficient and avoidance distance, to characterize the feature and calculation results of each profile, and then carry out further statistical analysis. As is shown in Table 3 and Figure 7.
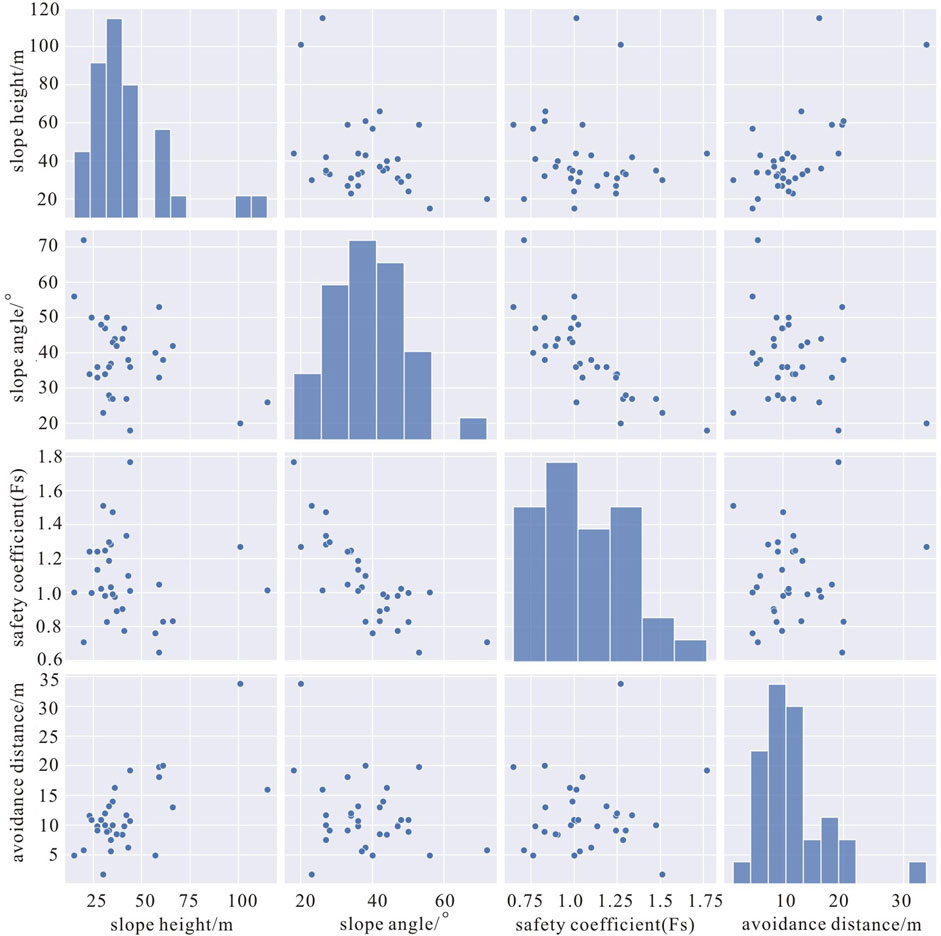
Figure 7. Plot of the two-by-two relationship between the indicators of the profiles. We plot the relationships between two indicators based on slope height, slope angle, and calculated avoidance distance and safety coefficient, and form the diagram. The bar charts at the diagonal positions represent the relative distributions of data amount of each indicator within a certain data interval, and the vertical axis is invalid in this case.
As can be seen from Table 3 and Figure 7, among the 32 slope profiles, the highest slope height is 115 m, the lowest is 15 m, and the average value is 42 m, and the values are mostly concentrated between 25 and 60 m, only 2 profiles’ slope heights above 100 m, and the null zone is between 60 and 100 m; the slope angle is the maximum of 72°, the minimum of 18°, and the average value is 38°, and the values are mostly concentrated between 25° and 56°, and only 1 profile has a slope angle of 72°, which is far away from the dense distribution of data; the maximum value of the safety coefficient calculated of each profile is 1.769, the minimum value is 0.648, and the average value is 1.073, which is mostly concentrated in the range of 0.7–1.35, and there are only 4 values outside the range; the maximum value of the avoidance distance of profiles is 33.8 m, the minimum value is 1.7 m, and the average value is 11.6 m, and the data is mostly concentrated in the range of 5–20 m, with only one value that exceeds 20 m, that is, the maximum value, which is far away from the interval of data concentration.
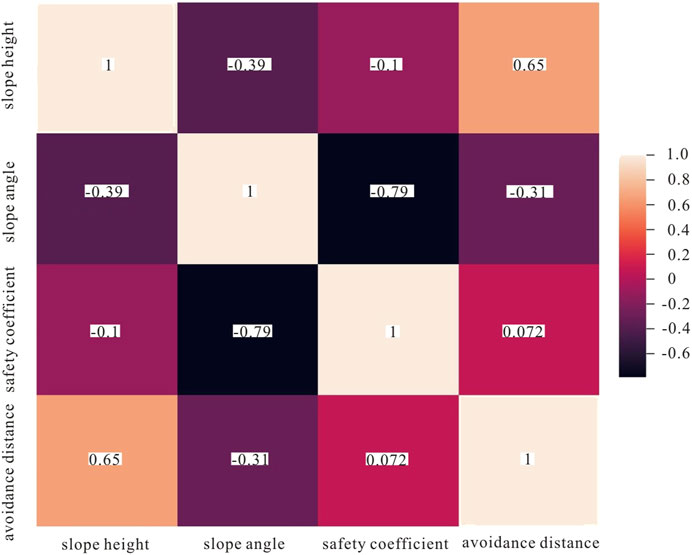
Next we analyze the correlation of the indicators. We characterize this with the Pearson correlation coefficient (Cui, 2020; Song et al., 2016) r. The value of r is a number between −1 and 1. The closer the value is to 1, the stronger the positive correlation is; the closer it is to −1, the stronger the negative correlation is; the closer it is to 0, the weaker the correlation between the two indicators. We show the correlation between the indicators of the above four indicators through a graph, as shown in Figure 8. From this figure, we can see that the correlation between the slope angle and the safety coefficient is the strongest, which are negatively correlated, with r=−0.79, indicating that the stability of the slope in the study area depends on the slope angle, and the larger the slope angle is, the more unstable the slope is. For example, when the slope angle is 18°, the safety coefficient Fs is 1.769, and when the slope angle is 72°, the safety factor Fs is only 0.709. The most severe damage from landslides occurs at steep slopes and cliffs (Parise and Jibson, 2000). Slope angle is one of the main controlling factors for co-seismic landslide susceptibility (Zou et al., 2022). So in this respect, the conclusion is consistent with previous research findings. The indicators in secondary correlation are slope height and avoidance distance, which are positively correlated, with the value of r 0.65, indicating that the scope of the impact of landslides in the study area depends on the slope height, i.e., the higher the slope is, the farther you have to be from the edge of the slope for safe. It is clear that the impacting scope of a 100 m-high landslide is much greater than that of a landslide with a height of 15 m. In fact, according to the calculations of the study, this is also true. The avoidance distance of a 15 m slope is 4.9 m, and the avoidance distance of 101 m slope is 33.8 m, which is bigger than that of the slope with 15 m height by far. The slope height and slope angle also have some negative correlation, and the r value of the two indicators is −0.39, which is also in line with the law of evolution the natural state of loess slopes. The higher the loess slopes are, the worse the self-stabilizing ability is. The slope surfaces are subjected to weathering and erosion as well as gravity to produce constant washing and collapse, leading to a gradual slowing down of the slope angle to maintain self-stabilization. The Culnann formula (Carson and Kirkby, 1984) also proves that the critical height is negatively correlated with the slope angle in general. Meanwhile, we also notice that the correlation between the safety coefficient and the slope height, and between the avoidance distance and the slope angle, is very weak, with r-values of −0.1 and −0.31 respectively, and the safety coefficient and the avoidance distance are basically uncorrelated with the r-value of 0.072. This can also be seen from the plot (Figure 7) of the relationships above. Therefore, under a certain seismic force, the slope safety coefficient is mainly determined by the slope angle, and the avoidance distance is mainly determined by the slope height.
4.2 Evaluation results
It is now a common practice in the engineering community to define the safety status of slopes by selecting an appropriate cut-off value for the safety coefficient. Regarding the selection of the threshold value, experts and scholars have accumulated a large amount of engineering experience through research and practice, which has been incorporated into the relevant codes of slope designing. In this study, based on the provisions of China’s Technical Code for Building Slope Engineering (GB50330-2013) (Chongqing Urbanand Rural Construction Commission, 2013), Fs = 1 and Fs = 1.05 are selected as the boundary values, Fs < 1 for unstable state, 1 ≤ Fs < 1.05 for less stable state, and Fs ≥ 1.05 for stable state. The avoidance distance was also graded with 5 m as the interval. According to the principles of selecting profiles mentioned before, the profile is representative in certain length range with similar slope height and slope angle, and the calculation of the profile can also be used as the representative value of the slope in this section. We finally produce the stability evaluation map of seismic loess landslides in the study area based on the simplified Bishop method under the seismic action of 0.20 g (Figure 9), which shows the distribution of the safety coefficient, as well as the distribution of the avoidance distance. As can be seen from the figure, there are 13 stable slope sections, most of which are distributed in the north bank of the gully, accounting for about 38% of the total, and the others are unstable and less stable, of which there are 13 unstable slope sections, most of which are distributed in the south bank of the gully. For the unstable and less stable slopes, the slopes with avoidance distance more than 5 m accounts for 90% of the total slopes, and the maximum of avoidance distance is not more than 20 m. Therefore, when planning and selecting the site for the project in the study area, we can pay attention to the potential landslide impacts of the slopes on the south bank. Combining with the correlation between the safety coefficient (Fs) and the slope angle in Figure 7 farther, the corresponding slope angle is more than 36°–38° when the Fs < 1.05, i.e., the sections with the slope angle of 36°–38° and above are the focus of attention. The avoidance distance from the edge line of the slopes can take the value given in the figure, or the maximum value of 20 m more conservatively.
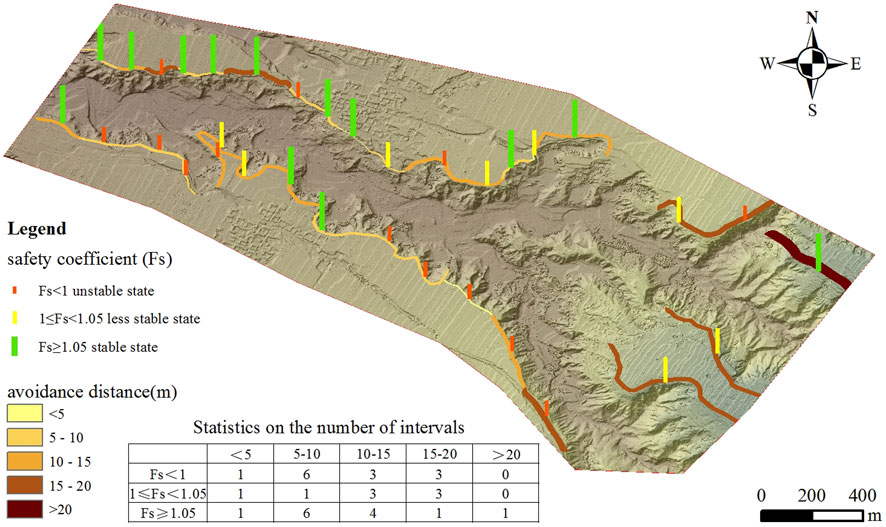
Figure 9. Stability evaluation map of loess landslide under 0.20 g seismic action in the study area. Generally, the midpoint of every two representative profiles is used as the boundary point for the slope segments represented by these two profiles, unless there is a particularly clear boundary between these two profiles. In this figure, using the color and length of the bar chart, we divide the value of Fs into three intervals, corresponding to three different stable states. The value of avoidance distance is also divided based on the color and width of the stripes. It is worth noting that there are a total of 34 profiles in the data statistics table in the figure, it is because we analogize the slopes at another two positions based on the existing calculation results according to the profile selection rules above.
5 Conclusions and discussion
(1) In the paper we have quantitatively calculated, analyzed and evaluated the stability of seismic loess landslides based on UAV Photogrammetry and the simplified Bishop method using the area in Fushan County, Shanxi Province as an example, and finally given the slope stability evaluation map of the study area. We believe that quantitative evaluation of seismic loess landslides based on this method is feasible, and the result can provide quantitative data for the selection of sites for major engineering projects and avoidance of landslide hazards, and provide a scientific reference basis for use of limited land resources more safely and more rationally.
(2) Similar to the simplified Bishop method, this kind of quasi-static method is simple and practical, which is most widely used in the seismic stability analysis of slopes, and has accumulated a large number of engineering experience and incorporated into the relevant codes (Liu et al., 2007). The reasonableness and practicability of the simplified Bishop strip method proposed by Bishop on the basis of the strip method have been verified in the engineering practice (Hu et al., 2021). The application of this type of method in engineering practice can greatly improve the efficiency of work while ensuring a certain degree of evaluation accuracy. But theoretically there are some shortcomings. This type of method does not accurately characterize inertial forces such as seismic forces. The size and direction of seismic forces are rapidly changing (Qi, 2002), and the ground shaking characteristics are described using the three elements of peak, spectrum, and time-holding, and the fundamental flaw of the quasi-static method like simplified Bishop method is that it fails to take into account the spectral characteristics of the ground shaking and the effect of time-holding (Shen and Lu, 1997). It is not applicable to the geotechnical slopes in the situation that large loss of strength under liquefaction and repeated shear need to be considered when suffering from seismic force with large magnitude (Xian and Chen, 2013). The direction of actual ground shaking forces on slopes may be variable and not necessarily pointing off-slope, whereas the bishop method simply assumes them to be off-slope and ignores the change in direction. In fact, slopes have significant topographic amplification and slope-direction effects on seismic waves (Parise and Jibson, 2000; Davis, 1972; elebi, 1987; Sato et al., 2007; Owen et al., 2008). To a certain extent, this may make the calculation results conservative. In addition, the bishop method generally only considers the unidirectional horizontal force, and does not take into account the effect of the vertical component force. In fact, when the horizontal acceleration is large the vertical acceleration has a significant effect on the stability and displacement (Ling et al., 2015). These will all make the simulation results deviate from the actual results. Therefore, if the actual seismic records of the area can be obtained and used as input for simulation calculations, and the results can be analyzed and adjusted in comparison with the quasi-static method, the results of such kind of methods such as the simplified bishop method will be greatly improved. However, in general, the simplified Bishop method basically meets the engineering needs and have withstood the test of geotechnical engineering practice (Bo et al., 2019).
(3) As a two-dimensional profile calculation method, the Simplified Bishop method is a useful attempt for regional slope evaluation in this study. Our approach in this paper is to select representative profiles for modeling and calculation, and assume that the slope feature is continuous within a certain range for analogy. Of course, in this process, the high-precision topographic image obtained by the UAV photogrammetry method provides accurate data for modeling and calculations. The location and sparseness of the representative profiles will also affect the accuracy of the calculation results to a greater or lesser extent. But finally, we also analyze the calculation results in detail, and the value of slope safety coefficient (Fs) is mostly within a range of 0.7–1.35 and the value of the avoidance distance is mostly within a range of 5–20 m under a seismic force of 0.20 g. Meanwhile we think that the safety coefficient has a strong correlation with the slope angle, but has a weak correlation with the slope height. The slopes with slope angle of 36°–38° or more need to be paid attention to, it is because it is statistically considered that safety coefficients correspond to the slope angles in this range are less than 1.05, a value which is the lower limit of the steady state. The avoidance distance has a relatively strong correlation with the slope height, but it has a weak correlation with the slope angle. The avoidance distance in the study area can take the calculation values in this paper, or the maximum value of 20 m more conservatively. The loess slopes in other areas of Fushan County suffer from the analogous size of seismic effects and have similar stratigraphic and geomorphological features, and the results of this paper’s calculations and analyses are of certain significance for the stability evaluation.
Data availability statement
The raw data supporting the conclusions of this article will be made available by the authors, without undue reservation.
Author contributions
GH: Conceptualization, Data curation, Formal Analysis, Funding acquisition, Methodology, Software, Visualization, Writing–original draft. BL: Conceptualization, Formal Analysis, Funding acquisition, Methodology, Project administration, Supervision, Writing–review and editing. XY: Investigation, Resources, Writing–review and editing. RR: Investigation, Resources, Software, Visualization, Writing–review and editing. JZ: Funding acquisition, Supervision, Validation, Writing–review and editing.
Funding
The author(s) declare that financial support was received for the research, authorship, and/or publication of this article. This research was funded by Natural Science Research Program of The Shanxi Science and Technology Department, grant No. 20210302123361 and 202303021211037, National Natural Science Foundation of China (NSFC), grant number 41504051, Key Project of Shanxi Earthquake Agency of Shanxi Province, grant numbers SBK-2423 and SBK-2421, and Project of National Observation and Research Station, grant number NORSTY2023-05.
Acknowledgments
We thank the reviewers and editors for their help in improving the manuscript.
Conflict of interest
The authors declare that the research was conducted in the absence of any commercial or financial relationships that could be construed as a potential conflict of interest.
Publisher’s note
All claims expressed in this article are solely those of the authors and do not necessarily represent those of their affiliated organizations, or those of the publisher, the editors and the reviewers. Any product that may be evaluated in this article, or claim that may be made by its manufacturer, is not guaranteed or endorsed by the publisher.
Supplementary material
The Supplementary Material for this article can be found online at: https://www.frontiersin.org/articles/10.3389/feart.2024.490558/full#supplementary-material
References
An, H., Viet, T. T., Lee, G., Kim, Y., Kim, M., Noh, S., et al. (2016). Development of time-variant landslide-prediction software considering three-dimensional subsurface unsaturated flow. Environ. Model. and Softw. 85, 172–183. doi:10.1016/j.envsoft.2016.08.009
Baker, R., Shukha, R., Operstein, V., and Frydman, S. (2006). Stability charts for pseudo-static slope stability analysis. Soil Dyn. Earthq. Eng. 26 (9), 813–823. doi:10.1016/j.soildyn.2006.01.023
Bi, H. Y., Zheng, W. J., Zeng, J. Y., Yu, J. X., and Ren, Z. K. (2017). Application of SFM photogrammetry method to the quantitative study of active tectonics. Seismol. Geol. 39 (4), 656–674. doi:10.3969/j.issn.0253-4967.2017.04.003
Bishop, A. W. (1955). The use of the slip circle in the stability analysis of slopes. Geotechnique 5 (1), 7–17. doi:10.1680/geot.1955.5.1.7
Bo, J. S., Duan, Y. S., chang, C. Y., Li, X. B., Peng, D., and Yan, D. H. (2019). Some problems of study on slope stability under earthquake. J. Nat. Disasters (1), 1–8. doi:10.13577/j.jnd.2019.0101
Chang, C. Y., Bo, J. S., Li, X. B., Qiao, f., and Yan, D. H. (2020). A BP neural network model for forecasting sliding distance of seismic loess landslides. China Earthq. Eng. J. 2020 (006), 1609–1614. doi:10.3969/j.issn.1000-0844.2020.06.1609
Chang, C. Y., Shan, B. J., Qiao, f., Duan, Y. S., and Zhang, Y. Y. (2022). Influence of seismic intensity on the shape of loess landslide scarp. J. Nat. Disasters (003), 106–115. doi:10.13577/j.jnd.2022.0310
Chen, Y. M., Shi, Y. C., Liu, H. M., and Lu, Y. X. (2005). Distribution characteristics and influencing factors analysis of seismic loess landslides. Earthq. Res. China 21 (2), 235–243. doi:10.3969/j.issn.1001-4683.2005.02.011
Chongqing Urban and Rural Construction Commission (2013). Technical code for building slope engineering. Beijing: China Construction Industry Press, 23–26.
Cui, W. (2020). Quantitative research of fault distance effect on landslides in longnan mountainous area. Lanzhou: Lanzhou University.
Dai, L., Zuo, H., Chen, B., Miao, W., and Yang, B. (2017). Pan evaporation variation characteristics and influencing factors in linfen for 37 years. Chin. Agric. Sci. Bulletin.
Davis, J. M. (1972). Velocity analysis: an application of deterministic estimation to reflection seismology. Comput. IEEE Trans.C-21 (7), 730–738. doi:10.1109/t-c.1972.223575
elebi, M. (1987). Topographical and geological amplifications determined from strong-motion and aftershock records of the 3 March 1985 Chile earthquake. Bull. Seismol. Soc. Am. 77 (4), 1147–1167. doi:10.1785/bssa0770041147
Froude, M. J., and Petley, D. N. (2018). Global fatal landslide occurrence from 2004 to 2016. Nat. Hazards Earth Syst. Sci. 18 (8), 2161–2181. doi:10.5194/nhess-18-2161-2018
Gu, T., Wang, J., Fu, X., and Liu, Y. (2014). GIS and limit equilibrium in the assessment of regional slope stability and mapping of landslide susceptibility. Bull. Eng. Geol. Environ. 74 (4), 1105–1115. doi:10.1007/s10064-014-0689-2
Guan, X., Wei, J., and Wei, T. (2015). Effect of summer fallow period precipitation on wheat yield in fushan and the countermeasures. Chin. Agric. Sci. Bulletin.
Hu, J. J., Xu, M., Liu, X. S., and Luo, B. (2021). A simplified Bishop method based on the upper bound limit theory. J. Lanzhou Univ. Sci. (057-005), 622–626. doi:10.13885/j.issn.0455-2059.2021.05.007
Ji, J., Zhang, W., Zhang, F., Gao, Y., and Lü, Q. (2020). Reliability analysis on permanent displacement of earth slopes using the simplified bishop method. Comput. Geotechnics 117, 103286. doi:10.1016/j.compgeo.2019.103286
Ji, Y. Q., and Sui, L. C. (2012). Study on selection methods of highway slope strength parameters of shanxi loess areas. J. Shandong Univ. Technol. Sci. Ed. 26 (6), 53–57. doi:10.3969/j.issn.1672-6197.2012.06.013
Jia, S. G., Jin, A. B., and Zhao, Y. Q. (2018). Application of UAV oblique photogrammetry in the field of geology survey at the high and steep slope. Rock Soil Mech. 39 (3), 1130–1136. doi:10.16285/j.rsm.2017.1474
Keeper, D. K. (1984). Landslides caused by earthquakes. Geol. Soc. Am. Bull. 95 (4), 406. doi:10.1130/0016-7606(1984)95<406:lcbe>2.0.co;2
Klinger, Y., Etchebes, M., Tapponnier, P., and Narteau, C. (2011). Characteristic slip for five great earthquakes along the Fuyun fault in China. Nat. Geosci. 4 (6), 389–392. doi:10.1038/ngeo1158
Kumar, S., Kumar, A., Rao, B., Choudhary, S. S., and Burman, A. (2024). Analysis of 2D and 3D slope stability using the bishop simplified method. IOP Conf. Ser. Earth Environ. Sci. 1326 (1), 012117. doi:10.1088/1755-1315/1326/1/012117
Li, Y., and Mo, P. (2019). A unified landslide classification system for loess slopes: a critical review. Geomorphology 340, 67–83. doi:10.1016/j.geomorph.2019.04.020
Li, Z. H., Liu, B. J., Yuan, H. K., Feng, S. Y., Chen, W., Li, W., et al. (2014). Fine crustal structure and tectonics of Linfen Basin——from the results of seismic reflection profile. Chin. J. Geophys. 57 (5), 1487–1497. doi:10.6038/cjg20140513
Li, Z. T. (2019). A study on hazard assessment and optimization of regional loess landslide based on statistical models. Beijing: China University of Geosciences.
Li, L., Xu, C., Zhang, Z. J., and Huang, Y. D. (2021). A review of researches on landslide disasters on Loess Plateau. J. Inst. Disaster Prev. 23 (4), 1–11. doi:10.3969/j.issn.1673-8047.2021.04.001
Ling, H. I., Leshchinsky, D., and Mohri, Y. (2015). Soil slopes under combined horizontal and vertical seismic accelerations. Earthq. Eng. and Struct. Dyn. 26 (12), 1231–1241. doi:10.1002/(sici)1096-9845(199712)26:12<1231::aid-eqe707>3.0.co;2-z
Liu, H., Bo, J., and Liu, D. (2007). Development on study of seismic stability evaluation methods of rock-soil slopes. J. Inst. Disaster Prev. 9 (3), 20–27. doi:10.3969/j.issn.1673-8047.2007.03.006
Liu, Q., Li, Y., Xiong, J., Zhang, H., Ge, W., Zhao, X., et al. (2021). Late quaternary steady deformation of the minle fault in the north qilian Shan, NE tibet. Tectonophysics 807, 228775. doi:10.1016/j.tecto.2021.228775
Meko, L., Chemeda, Y. C., and Meko, B. (2023). Road cut slope stability analysis for static and dynamic (pseudo-static analysis) loading conditions. Open Geosci. 15 (1), 20220561. doi:10.1515/geo-2022-0561
Ouédraogo, M. M., Degré, A., Debouche, C., and Lisein, J. (2014). The evaluation of unmanned aerial system-based photogrammetry and terrestrial laser scanning to generate DEMs of agricultural watersheds. Geomorphology 214, 339–355. doi:10.1016/j.geomorph.2014.02.016
Owen, L. A., Kamp, U., Khattak, G. A., Harp, E. L., Keefer, D. K., and Bauer, M. A. (2008). Landslides triggered by the 8 october 2005 kashmir earthquake. Geomorphology 94 (1-2), 1–9. doi:10.1016/j.geomorph.2007.04.007
Parise, M., and Jibson, R. W. (2000). A seismic landslide susceptibility rating of geologic units based on analysis of characteristics of landslides triggered by the 17 January, 1994 Northridge, California earthquake. Eng. Geol. 58 (3), 251–270. doi:10.1016/s0013-7952(00)00038-7
Qi, S. W. (2002). Study on dynamic responses of slopes and its application. Beijing: Institute of Geology and Geophysics.
Qiu, H., Su, L., Tang, B., Yang, D., Ullah, M., Zhu, Y., et al. (2024). The effect of location and geometric properties of landslides caused by rainstorms and earthquakes. Earth Surf. Process. Landforms 49 (7), 2067–2079. doi:10.1002/esp.5816
Qiu, H., Zhu, Y., Zhou, W., Sun, H., He, J., and Liu, Z. (2022). Influence of DEM resolution on landslide simulation performance based on the Scoops3D model. Geomatics, Nat. Hazards Risk 13 (1), 1663–1681. doi:10.1080/19475705.2022.2097451
S. Ramadhani, K. Chauf, A. Dwijaka, M. Bierhofa, and Y. Gagaramusu (2022). “Slope stability using Simplified Bishop method in Kebun Kopi area Donggala regency, central Sulawesi province,” IOP conference series: earth and environmental science (Banda Aceh, Indonesia: IOP Publishing).
Ren, J., Tamaki, K., Li, S., and Junxia, Z. (2002). Late Mesozoic and Cenozoic rifting and its dynamic setting in Eastern China and adjacent areas. Tectonophysics 344 (3-4), 175–205. doi:10.1016/s0040-1951(01)00271-2
Sato, H. P., Hasegawa, H., Fujiwara, S., Tobita, M., Koarai, M., Une, H., et al. (2007). Interpretation of landslide distribution triggered by the 2005 Northern Pakistan earthquake using SPOT 5 imagery. Landslides 4 (2), 113–122. doi:10.1007/s10346-006-0069-5
Shen, Z. J., and Lu, P. Y. (1997). Commenting on the conservative tendency in current geotechnical engineering practice. Chin. J. Geotechnical Eng. (4), 115–118.
Song, S., Qian, Y. J., and Wu, G. (2016). Correlation and distance analysis of ground motion measures. Earthq. Eng. Eng. Dyn. (4), 170–176. doi:10.13197/j.eeev.2016.04.170.songs.020
Sun, W., He, H., Shi, F., Wei, Z., Sun, H., and Su, P. (2023). Late-Quaternary paleoearthquakes along the liulengshan fault on the northern Shanxi rift system. Front. Earth Sci. 10. doi:10.3389/feart.2022.954335
The Research Groupon Active Fault System around Ordos Massif (1988). Active Fault system around Ordos massif. Beijing: Seismological Press.
Wang, L. M., Chai, S. F., Bo, J. S., Wang, P., Xu, S. Y., Li, X. B., et al. (2023). Triggering types, characteristics and disaster mechanism of seismic loess landslides. Chin. J. Geotechnical Eng. 45 (08), 1543–1554. doi:10.11779/CJGE20220531
Wei, Y., Qiu, H., Liu, Z., Huangfu, W., Zhu, Y., Liu, Y., et al. (2024). Refined and dynamic susceptibility assessment of landslides using InSAR and machine learning models. Geosci. Front. 15 (6), 101890. doi:10.1016/j.gsf.2024.101890
Wright, S. G., Kulhawy, F. H., and Duncan, J. M. (1973). Accuracy of equilibrium slope stability analysis. J. Soil Mech. Found. Div. 99 (10), 783–791. doi:10.1061/jsfeaq.0001933
Wu, Y. W., Li, X. B., Zhou, X. h., and Duan, J. J. (2023). Research methods of seismic stability of loess slope. J. Inst. Disaster Prev. 25 (2), 63–71. doi:10.3969/j.issn.1673-8047.2023.02.007
Wu, Z. J., Wang, L. M., Wang, P., Chen, T., Shi, H., and Yang, X. P. (2013). Influence of site conditions on ground motion at far field loess sites during strong earthquake. J. Central South Univ. 20 (8), 2333–2341. doi:10.1007/s11771-013-1741-2
Xia, Y. Y., and Li, M. (2002). Evaluation method research of slope stability and its developing trend. Chin. J. Rock Mech. Eng. 21 (007), 1087–1091. doi:10.3321/j.issn:1000-6915.2002.07.031
Xian, Y. J., and Chen, X. J. (2013). Review on study of safety evaluation methods of rock-soil slopes seismic stability. Geotech. Eng. Tech. (5), 242–247. doi:10.3969/j.issn.1007-2993.2013.05.007
Xu, W., Wang, J., and Yin, J. (2024). Late quaternary faulted landforms and recent activity of the eastern segment of the Nanbei River–Boli Fault. J. Struct. Geol. 183, 105128. doi:10.1016/j.jsg.2024.105128
Xu, Y. R., He, H. L., Deng, Q. D., Allen, M. B., Sun, H. Y., and Bi, L. S. (2018). The CE 1303 Hongkong earthquake and the huoshan piedmont fault, shanxi graben: implications for magnitude limits of normal fault earthquakes. J. Geophys. Res. Solid Earth 123, 3098–3121. doi:10.1002/2017jb014928
Yang, S., Chang, C., Yu, S., Wang, Y., and Liu, C. (2022). A comprehensive method for rapid assessment of seismic stability of loess slopes:a case study of Xiji County in Ningxia. China Earthq. Eng. J. 2022 (044-001), 54–61. doi:10.20000/j.1000-0844.20200831001
Ye, S., and Zhang, R. (2023). Stability analysis of multistage loess slope under earthquake action based on the pseudo-static method. Soil Mech. Found. Eng. 60 (4), 304–313. doi:10.1007/s11204-023-09896-x
Yin, X. J. (2020). Study on stability of loess slope under the coupling effect of rainfall and earthquake: Institute of engineering mechanics. Harbin, China: China Earthquake Administration.
Yu, H. L., Long, J. H., Liu, H. S., Ji, Y. Q., and Zhang, Z. (2014). Engineering geology division of loess slope and its strength parameter selection in L(U)-Liang mountainous area. J. Eng. Geol. 22 (1), 152–159. doi:10.3969/j.issn.1004-9665.2014.01.021
Zeng, J., and Chen, W. (2015). Application of numerical simulation in the landslide hazard assessment of seismic micro-zonation. Technol. Earthq. Disaster Prev. 3 (11), 1–10. doi:10.11899/zzfy20150213
Zhang, H., He, Z. T., Xu, H. G., Li, L. M., Wang, J. Y., Jiang, X., et al. (2021). Kinematic characteristics of the jiangsu segment of the anqiu–juxian fault in the tanlu fault zone, eastern China. Lithosphere 2021 (Special 2). doi:10.2113/2021/6691692
Zhang, L. R. (2011). Stability analysis of loess slope under strong ground motion: lanzhou Institute of seismology. Lanzhou, China: CEA.
Zhao, W. C. (2016). Dynamic response characteristics and stability analysis of loess slope under strong earthquake: lanzhou Institute of Seismology. Lanzhou, China: CEA.
Zhou, H. F., Fang, T., and Wei, Y. T. (2023). Research situations and suggestions on earthquake-induced landslides. Sediment. Geol. Tethyan Geol. 43 (3), 615–628. doi:10.19826/j.cnki.1009-3850.2021.11011
Zhu, D. (2008). “Investigations on the accuracy of the simplified Bishop method,” in Landslides and engineered slopes from the past to the future, two Volumes+ CD-ROM (AK Leiden, Netherlands: CRC Press), 1077–1080.
Zhu, Y., Qiu, H., Liu, Z., Ye, B., Tang, B., Li, Y., et al. (2024). Rainfall and water level fluctuations dominated the landslide deformation at Baihetan Reservoir, China. J. Hydrology 642, 131871. doi:10.1016/j.jhydrol.2024.131871
Zou, G. D. (2002). A global optimization method of the slice method for slope stability analysis. Chin. J. Geotech. Eng. 24 (3), 309–312. doi:10.3321/j.issn:1000-4548.2002.03.009
Keywords: seismic loess landslide, unmanned aircraft system, simplified bishop method, safety coefficient, seismic hazard evaluation
Citation: Hu G, Li B, Yan X, Ren R and Zeng J (2024) Research on the stability of loess landslides under seismic action based on simplified bishop method. Front. Earth Sci. 12:1490558. doi: 10.3389/feart.2024.1490558
Received: 03 September 2024; Accepted: 11 November 2024;
Published: 27 November 2024.
Edited by:
Manoj Khandelwal, Federation University Australia, AustraliaReviewed by:
Antonio Minervino Amodio, National Research Council (CNR), ItalyHaijun Qiu, Northwest University, China
Copyright © 2024 Hu, Li, Yan, Ren and Zeng. This is an open-access article distributed under the terms of the Creative Commons Attribution License (CC BY). The use, distribution or reproduction in other forums is permitted, provided the original author(s) and the copyright owner(s) are credited and that the original publication in this journal is cited, in accordance with accepted academic practice. No use, distribution or reproduction is permitted which does not comply with these terms.
*Correspondence: Bin Li, am9obi5ibGlAaG90bWFpbC5jb20=
 Guirang Hu
 Bin Li3,2*