 Yi Chen1
 Jiaozhong Chen
 Chengyu Xie
- 1Wuzhou Waterway Maintenance Centre, Guangxi Zhuang Autonomous Region, Wuzhou, Guangxi, China
- 2School of Resource Environment and Material Engineering, Guangxi University, Nanning, Guangxi, China
- 3Guangxi Guida Demolition Engineering Co., Ltd., Nanning, Guangxi, China
- 4School of Environment and Resources, Xiangtan University, Xiangtan, Hunan, China
Introduction: Yongxing Tunnel No.1’s complex geology near a buried oil pipeline on the Guizhou-Nanning high-speed route poses blasting risks. Prioritizing pipeline safety, efforts focus on minimizing vibration impacts.
Methods: Research uses numerical simulations and field tests to analyze three delay times and three spacing charge materials for vibration reduction.
Results: Optimal delay is 30 ms, yielding a 0.52 cm/s vibration velocity, 20%-29% lower than 28 ms and 32 ms. Soil is the most effective spacer, achieving 0.46 cm/s, 30.30%-22.03% lower than water and air. Field tests align with simulations.
Discussion: Findings provide a reference for optimal vibration reduction and safe construction under similar conditions.
1 Introduction
In order to maintain the stability of the mountain and avoid reclamation after the project, it has become a common practice in China to connect roads or railways with tunnels. Tunnel construction will inevitably cause disturbance to the existing buried pipeline, especially the blasting project near the oil pipeline. In the tunnel construction method, the drilling and blasting method is widely used in the construction of the hard rock area of the subway tunnel because of its low material cost, simple operation and excellent performance in the hard rock environment (Li et al., 2017; Han et al., 2022; Yang C. et al., 2023). When the drilling and blasting method is applied, a strong shock wave will be generated to cause a strong impact on the existing buried pipeline, which will cause strong vibration of the oil and gas pipeline (Koopialipoor et al., 2019). If it is not controlled, it may cause damage and cracking of the oil and gas pipeline, which may lead to fire, even explosive detonation and other devastating disasters, causing incalculable losses and potential safety hazards to the adjacent areas. The problem of tunnel blasting excavation near buried oil pipeline, because of its special protection object, should not only ensure the safe operation of oil pipeline, but also ensure the progress of tunnel construction (Chen et al., 2023; Chengyu et al., 2023; Xie et al., 2023), As a result, finding effective ways to minimize the vibration effects of tunnel blasting on underground oil pipelines has become a pressing issue and an important area of research (Jiang et al., 2018; Shi et al., 2019).
For the vibration effect in pipeline and tunnel blasting, in the study of safety thresholds. Qin et al. (2023) studied the force, the vector sum of the vibration velocity and the axial tensile strain peak of the front and back blasting surfaces by using the pipe-soil coupling numerical model of different pipeline sizes and buried pipelines. Through the finite element analysis of the numerical model of rock mass-gas pipeline, Yang et al. (2022) created numerical models that were validated using on-site monitoring data to examine the dynamic behavior of underground gas pipelines during the blasting and excavation of the connecting channel. Jiang et al. (2021), Qin et al. (2023) have done a more in-depth study on the effect of blasting vibration, confirmed that the amplitude of blasting seismic wave is related to the amount of explosive, millisecond blasting time interval, geological properties and other factors. The blasting center distance and geological properties will also affect the frequency of blasting seismic wave. Based on tunnel blasting construction, Li et al. (2024) streamlined the analysis of blasting seismic waves and established a mathematical connection between the primary frequency of blasting seismic wave vibrations and the stress concentration coefficient of the surrounding rock in tunnels. They found that this concentration coefficient is significantly influenced by factors such as Poisson’s ratio and lining thickness. Regarding the study of vibration in tunnel blasting, Xue et al. (2019) comprehensively studied the impact of tunnel blasting excavation on adjacent tunnel lining structure for Xinling Highway Tunnel Project, and proposed and determined the safety threshold of blasting vibration. In their research on pipeline safety, Zhu et al. (2023a), Zhu et al. (2023b) proposed a pattern recognition scheme that combines image coding with the Shift Window Transformer (SwinT) model in computer vision, and conducted pilot experiments to verify the superiority of the method. Feng et al. (2018), Biondi et al. (2022) employed distributed fiber optic sensors to track the changes in bending strain and temperature over time and space in underground pipelines, the monitoring data were then used to assess the structural performance of the pipeline in combination with the pipeline parameters and internal pressure. This study has important implications for the prevention of tunnel accidents caused by pipe rupture. Zhao et al. (2016) examined the effects of blasting vibrations on nearby tunnels through both simulation and experimental approaches, and their findings can serve as a guide for enhancing blasting plans.
The behavior and mechanism of blasting vibration in underground tunnels have been thoroughly researched internationally. Sharafat et al. (2019) incorporated the critical particle velocity into the vibration attenuation model and adopted an innovative blasting model, which was successfully applied to the removal of tunnel plugs in the Neelum Jhelum Hydroelectric Project. Shin et al. (2011) examined how blast-induced vibrations affect tunnels by analyzing particle velocity, displacement, and lining stresses. They also provided initial recommendations for evaluating blast vibration protection zones. Kong, Oh et al. (2023), Wang et al. (2024); Xue et al. (2024) highlighted the significance of considering the depth of tunnel drilling and the soil conditions when choosing where to place vibration measurements, as well as the necessity for smart approaches in tunnel boring. He et al. (2024) provided a review of articles dedicated to blasting vibration, rock damage and vibration energy in tunnels from 2000 to 2023 and suggested directions for future research for reference.
Software analysis is one of the important research methods used by researchers to simulate the process of tunnel blasting and predict the effect of blasting. Guo et al. (2022), Zhao et al. (2024) studied the behavior of tunnel blasting vibration waves in mountain tunnels using ABAQUS finite element software, finding that their results closely matched the actual values recorded during on-site monitoring. Meanwhile, Liu et al. (2022) examined the dynamic properties of a tunnel with pipes subjected to blasting vibrations, utilizing FLAC3D for their analysis. Qin and Zhang (2020), Wang et al. (2022) used a combined ANSYS/LS-DYNA method for numerical modelling and found that the ground blasting vibration velocity shows an exponential decay trend with the increase of tunnel burial depth.
In conclusion, the analysis of blasting vibration propagation in tunnels from a dynamics perspective is quite thorough. However, there is limited research on using a combination of on-site monitoring and numerical simulations to mitigate vibrations caused by blasting near oil pipeline tunnels under various conditions. To address the pressing issue of vibration hazards from tunnel blasting on existing buried oil pipelines, this study introduces an innovative research approach that combines numerical simulations with field tests. The goal is to identify the best vibration reduction strategies by thoroughly analyzing the factors that influence pipeline vibrations. This research specifically examines two critical factors: delay time and spacer charge material, and it highlights their individual impacts on vibration reduction through detailed comparative analyses. A key advancement of this method is its holistic approach, which not only investigates single factors in isolation but also considers the interactions among multiple factors, allowing for a more precise identification of the optimal balance for reducing vibrations.
To enhance the theory and application of vibration reduction in blasting engineering, a comparative analysis of blasting simulations and on-site vibration reduction tests for nearby oil pipelines is conducted, using the Yongxing No.1 Tunnel Project as a backdrop. This study aids in evaluating the safety of existing buried pipelines during tunnel blasting operations and serves as a reference for the project’s actual construction.
2 Engineering and geological survey
2.1 Overview of Yongxing No.1 tunnel project
Yongxing No. 1 tunnel project inlet to outlet in turn, 5940 m of 5‰ uphill, 3695.67 m of 18.7‰ downhill, 494.33 m of 6‰ downhill. Maximum depth of 480 m. 18.7‰ downhill of 3695.67 m, and 6‰ downhill of 494.33 m. The maximum buried depth is 480 m. The entrance of Yongxing No.1 Tunnel adopts pile-column portal. In order to ensure the stability of the end wall of the portal, four artificial excavation pre-reinforcement piles are set at the entrance. The pile length is 24 m and the pile diameter is 2.0 × 2.5 m. A 30 m cutting-type reinforced open cut tunnel is set up at the entrance, and two deformation joints are set up from the entrance to the light-dark boundary. The exit adopts the reinforced double-ear wall open-cut tunnel door, DK287 + 775 ∼ + 790 adopts the reinforced double-ear wall lining, DK287 + 760 ∼ + 775 adopts the reinforced single-pressure lining, DK287 + 750 ∼ + 760 adopts the reinforced cutting open-cut tunnel lining. Three deformation joints are set up at the lining boundary and the light-dark boundary of the entrance section of the tunnel. The C35 concrete retaining wall is set on the right side of the DK287 + 760 line, with a top width of 0.8 m, a chest slope of 5: 1, and a wall height of 3 m. The C35 concrete retaining wall is set on the left side of the DK287 + 775 line, with a top width of 1 m, a chest slope of 5: 1, and a wall height of 11 m. he terrain of the entrance and exit is high and steep, and the dangerous rockfall on the slope of the tunnel top is developed. Before the construction, the dangerous rockfall is cleaned first. In order to meet the needs of construction period, ventilation and disaster prevention and rescue in operation, the tunnel is organized and constructed by the auxiliary tunnel construction scheme of ' 2 horizontal +1 discharge tunnel', Figure 1 presents a summary of the project along with a schematic diagram of the auxiliary tunnel entrances.
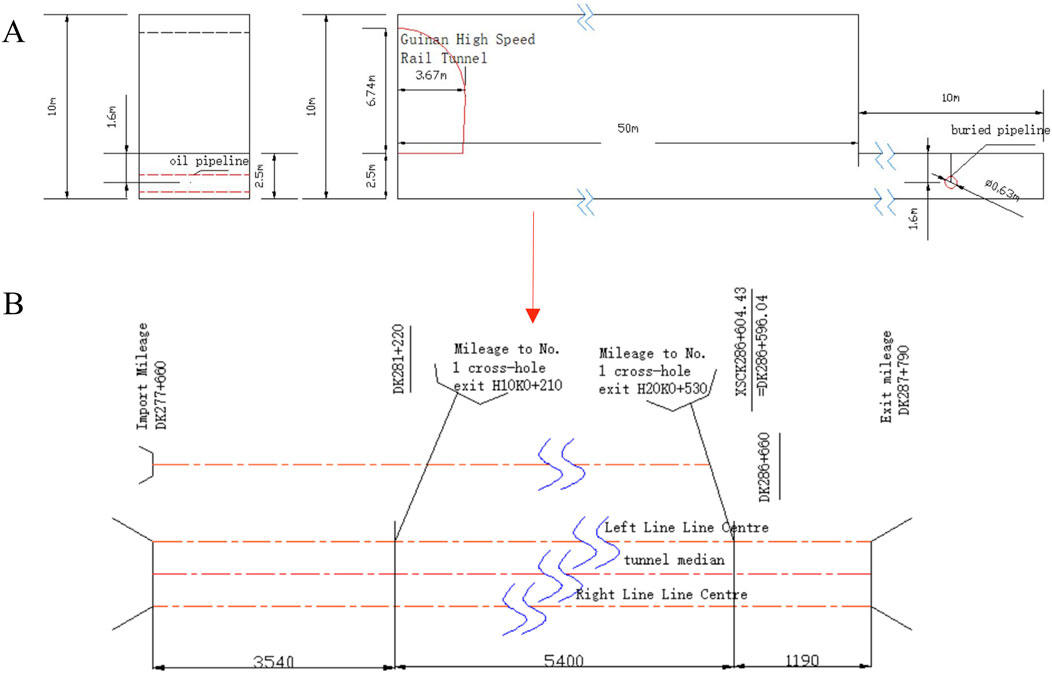
Figure 1. Overview of Yongxing No. 1 project (A), tunnel auxiliary pit layout (B).
2.2 Engineering geology
The tunnel entrance is located on a slope, with a natural slope of about 36° and a slope direction of about 25°. The overburden on the slope surface is the Quaternary colluvial gravel soil, and the underlying bedrock is the upper Carboniferous moderately weathered limestone. The attitude of the rock stratum is 44° < 27°, and three groups of joints are mainly developed: L1,76° < 74°; l2,268° < 56°; l3,180° < 64°. The slope direction is the same as the inclination of the rock stratum, which is a consequent slope and belongs to an unstable structure. The inclination of L1 and L2 is obliquely intersected with the slope inclination at a large angle, which is a relatively stable structure. The inclination of L3 is opposite to the inclination of the slope, which is a stable structure. The intersection point of the rock layer with L1 and L2 is located outside the projection arc of the slope, which is an unstable structure. The intersection point of the rock layer and L3 is located on the other side of the slope projection arc, which is a stable structure. The intersection point of L1 and L2 is located outside the projection arc of the slope, which is an unstable structure. The intersection of L1 and L3, L2 and L3 is located on the other side of the slope projection arc, which is a stable structure. In summary, after the excavation of the tunnel entrance, there are unstable structural planes.
Tunnel exit: The tunnel exit is located on a slope with a natural slope of about 45° and a slope direction of about 210°. The overburden on the slope is the Quaternary residual gravel soil, and the underlying bedrock is the upper Devonian weathered limestone. The attitude of the rock stratum is 44'< 27′, and three groups of joints are mainly developed: L1,110° < 62°; l2,170° < 68°; l3,310° < 87°, and the slope direction is opposite to the dip direction of the rock stratum, which belongs to the stable structure. The inclination of L1, L2 and L3 intersects with the slope inclination at a large angle, and the inclination angle is large, which is a relatively stable structure. The intersection of rock strata and L1, L2 and L3 is located on the other side of the slope projection arc, which is a stable structure. The intersection of crack L1 and L2 is located on the other side of the slope projection arc, which belongs to the stable structure. The intersection of L1 and L3, L2 and L3 is located on the other side of the slope projection arc, which is a stable structure. In summary, after the excavation of the tunnel exit, there are unstable structural planes.
3 Results and discussion
Different vibration reduction measures were studied by means of field test and numerical simulation. According to the results of three different delay times and three interval charging materials obtained by using finite element software, field tests were carried out at the same time. The results of numerical simulation and test results were comprehensively analyzed, and the vibration reduction measures (optimal delay time) to meet this geological environment were found out to ensure the progress and safety of tunnel blasting excavation (Thai et al., 2021; Zhang et al., 2024).
3.1 Establishment of finite element model of buried pipeline under blasting vibration
Using the finite element software LS-DYNA, the three-dimensional dynamic finite element modeling of buried pipelines under blasting vibration is carried out. It is not only necessary to consider the boundary conditions, material models, physical models, but also to consider the contact settings and meshing and other related parameter factors.
3.1.1 Unit type
In the finite element software LS-DYNA, the main unit types are rear shell unit, seat belt unit, mass unit, body unit, inertial unit, spring damping unit, thin shell unit, SPH unit and so on. According to the set shape of the model, the corresponding unit type is selected. In addition, it is necessary to analyze the loading conditions, methods and analysis purposes. Finally, it is necessary to consider the economic cost of the calculation and the length of the calculation. By considering the above factors, the best unit type is selected.
3.1.2 Meshing and physical model
The Yongxing No.1 tunnel of Guinan high-speed railway is excavated by drilling and blasting method. Because in the process of tunnel excavation, the influence of cutting hole, surrounding hole and auxiliary hole on blasting vibration effect is the strongest. Therefore, in the process of LS-DYNA modeling, only the model of cutting hole needs to be constructed. The finite element model is established by taking half of the upper step from the symmetry relationship, which can improve the calculation efficiency and shorten the calculation time. In order to make the simulation results have higher accuracy, the SOLID164 unit in this paper needs to use Lagrange grid to divide. In the interface between oil and pipeline, the interface between pipeline and soil, the interface between explosive and rock mass and the grid around the tunnel face, the density should be increased to ensure the calculation accuracy. The model grid pattern is shown in Figure 2.
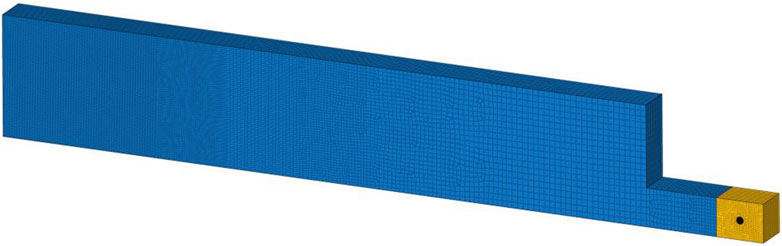
Figure 2. Finite element mesh diagram.
3.1.3 Boundary conditions
In order to ensure the accuracy of the simulation results, the boundary conditions must be strictly selected in the simulation. The vibration caused by blasting excavation is essentially a process of energy propagation (Hassan and Oudah, 2024). Theoretically, when the blasting seismic wave caused by the explosive source generated by the explosive propagates to infinity in the propagation medium, its energy will gradually decay to zero. Therefore, in the process of modeling, it is necessary to set an infinite boundary to make it conform to the actual situation, and also make the model and the simulation results more convincing. However, this infinite boundary model is not practical in the process of finite element software modeling, so the reflection-free boundary is used to replace the infinite boundary in the modeling process (Yang H. C. et al., 2023).
This model employs a non-reflective boundary condition. It takes into account the various materials present between the backfilled soil surrounding the buried pipeline and the mountain rock, without considering the presence of karst caves or the differing rock characteristics in the mountains. Consequently, aside from the backfill soil around the buried pipeline, which is treated as a transmission boundary, all other boundaries are regarded as non-reflective.
3.1.4 Contact settings
There are three commonly used algorithms for dealing with contact problems in finite element software, namely, symmetric penalty function, dynamic constraint and distribution parameter (Xu and Neumann, 2020).
There are more than forty kinds of contact types in the finite element software LS-DYNA, mainly including five categories: single-sided, one-way, fixed connection, two-way and solid. Whether it is unidirectional or bidirectional contact, there is a difference between non-AUTOMATIC and AUTOMATIC. Natural contact occurs on both sides of the shell element, while non-automatic contact occurs in the normal direction of the shell element. Usually the default preferred is automatic contact. In the modeling process of this paper, the soil and rock mass are arranged into a common node, the automatic surface contact between the pipeline and the soil, the sliding friction between the rock mass and the explosive, and the three contact settings are appealed, which can more realistically reflect the actual working conditions.
3.1.5 Selection of element parameters and material model
3.1.5.1 Material parameters and modelling
The material of the oil pipeline near the blasting excavation of Yongxing No.1 Tunnel of Guinan High-speed Railway is X70 steel pipe, and MAT_PLASTIC_KINEMATIC is selected for numerical simulation of X70 steel pipe in this modelling process (Jia et al., 2023). Selection of MAT_NULL material for oil transported in buried pipelines (Rostami and Mahdavy Moghaddam, 2024). The MAT_PLASTIC_KINEMATIC material model was chosen for rock to effectively represent isotropic hardening and the follow-hardening plasticity model. This allows for precise simulation of the material’s plastic deformation behavior under complex stress conditions for X70 steel pipes and rock (Shen et al., 2024). The material model of the soil body is MAT_DRUCKER_PRAGER, which can improve the efficiency of the calculation while guaranteeing a certain degree of accuracy (Briassoulis and Mistriotis, 2018). The specific parameters are shown in Table 1.
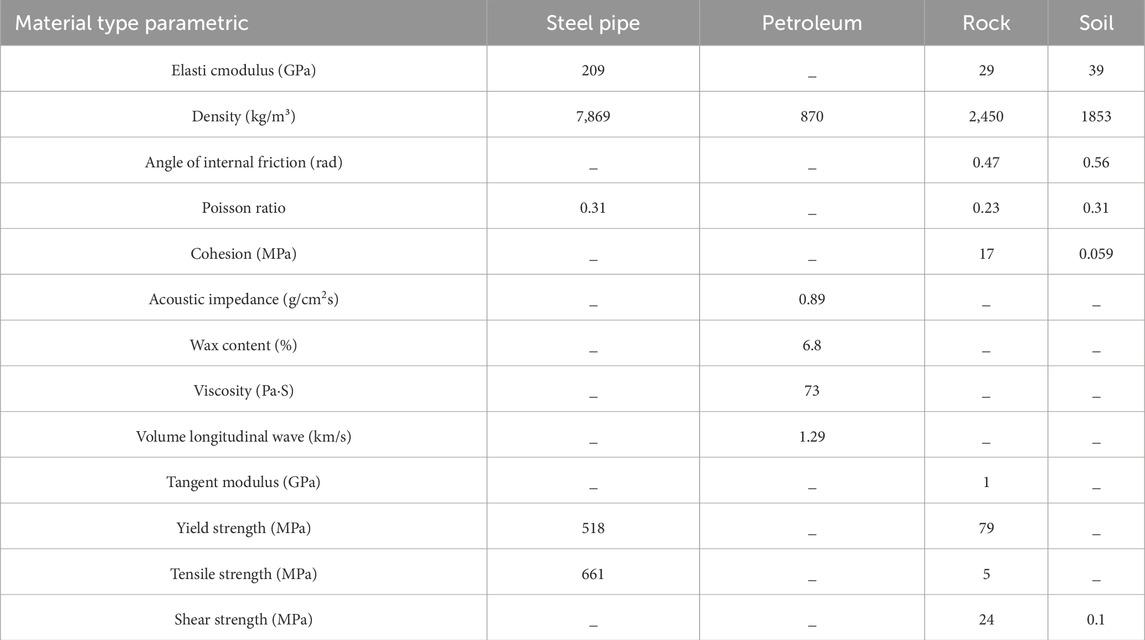
Table 1. Parameter values for each material.
3.1.5.2 Explosive parameters and material model
The JWL equation is used to calculate the pressure of the explosive unit, and the MAT _ HIGH _ EXPLOSIVE _ BURN and EOS _ JWL equations are selected as the explosive materials for the blasting excavation of Yongxing No.1 Tunnel of Guinan High-speed Railway. The specific parameters are as follows Table 2 (Rybakov, 2016; Mao et al., 2022).
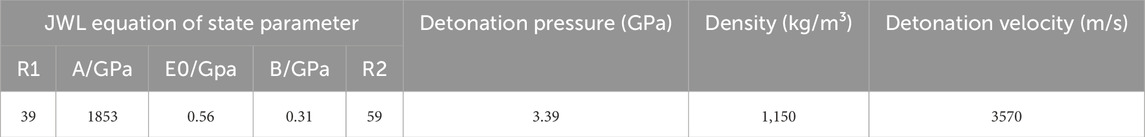
Table 2. Parameters and state equation parameters.
3.1.6 Selection of element parameters and material model
The numerical simulation of the model is based on the premise of accuracy. Only in this way can the calculation and research results be accurate and feasible. Therefore, it is necessary to test the accuracy of the model before numerical simulation.
The monitoring points are placed on the surface of 1.6 m above the buried oil pipeline, and then the blasting vibration data of the surface above the pipeline are collected by the vibrometer TC-4850. At the same time, the measured data are analyzed and the waveform diagram is derived by the computer to open the corresponding analysis software (Blasting vibration analysis) of the vibrometer. Finally, the variation trend of the waveform diagram and its maximum vibration velocity are compared with the waveform diagram obtained by simulating the surface, and the error between the two is used as the basis for judging the accuracy of the model (Pohl et al., 2022; Ma et al., 2024).
A graph of the time course of the vibration velocity at the field measurement point and the simulation is shown in Figure 3:
Figure 3. Time-course plot of field vibration velocity (A), versus simulated vibration velocity (B).
The data of the measuring points are measured by the vibrometer, and the waveform diagram is derived. It can be seen that the maximum vibration velocity of the blasting vibration of the measuring points is 0.31 cm/s. The maximum vibration velocity simulated by the model is 0.29 cm/s, the relative error is 6.45%, and the relative error value is less than 12%. It shows that the accuracy of the model is acceptable and adopted, which is enough to be applied to the engineering example in this paper.
3.2 Simulation of vibration reduction research
Based on the model in the above section, three kinds of interval charge materials, air, soil and water, are added, and the filler and explosive are set as fluid-solid coupling. ANSYS/LS-DYNA was used to analyze the blasting vibration waveform diagram and the maximum stress of the combined vibration velocity under different working conditions under the action of three delay times and three interval charging materials. Finally, the optimal delay time and charging filling material under this geological condition were obtained (Zheng et al., 2023).
3.2.1 Delay time simulation effect
According to the simulation results of the delay time of 28 ms, 30 ms and 32 ms respectively, the maximum peak and maximum stress are compared between the field test and the simulation results with the setting of three sets of delay time.
3.2.1.1 Maximum vibration velocity analysis
The measuring points directly above the buried pipeline are analyzed, and the vibration waveform diagram of the combined vibration velocity blasting is derived. The corresponding resonance velocities for the three different delay times are shown in Figure 4.
Figure 4. Maximum combined vibration velocity time scale at 28 ms (A), 30 ms (B) and 32 ms (C) delay time.
It can be seen from Table 3 that the maximum resultant velocity corresponding to the delay time of 30 ms is the smallest compared with the other two, which is 20% and 29% lower than the maximum resultant velocity corresponding to 28 ms and 32 ms, respectively.

Table 3. Combined vibration speed statistics.
3.2.1.2 Stress analysis
The stress maps at the measurement points corresponding to different delay times are shown in Figure 5.
Figure 5. Strain diagram of 28 ms time difference measurement point (A) strain diagram of 30 ms time difference measurement point (B) Strain diagram of 32 ms time difference measurement point (C).
It can be seen from Figure 5 that when the delay time reaches 30 ms, the maximum stress on the pipeline reaches the minimum value, that is, when the delay time is 30 ms, the blasting effect on the pipeline is the smallest. At this time, the maximum stress value is 26.4 MPa, and the maximum value appears at the 12,569 node of the pipeline model, and it can be seen that the stress will not cause damage to the pipeline.
3.2.2 Simulation effect of interval charge material
This part introduces the influence of different interval charge materials on vibration reduction. In the axial direction, the interval charge is changed by changing the way of filling soil, water and air. The delay time selects the optimal time difference of 30 ms for blasting, and the maximum stress diagram and the maximum vibration velocity are obtained through simulation analysis, so as to determine the charge material with the best vibration reduction effect (Yu et al., 2024).
The model is built by sequentially altering the interval charge material. To make it easier to observe, this model exclusively displays the hole structure created using the particle diagram Figure 6. The schematic diagram of the interval charge is shown below (Wang et al., 2024). The material on the right side is a blockage (usually a mixture of clay, sand and water), and the material on the left side is an explosive. The middle part of the explosive is three kinds of interval charge materials: soil, air and water, which are replaced by different colors on the particle diagram.
Figure 6. Model hole particles of soil (A), air (B) and water (C).
3.2.2.1 Maximum vibration velocity analysis
Through the simulation model, the waveforms of the combined vibration velocity of the ground surface directly above the pipe at different intervals of loading material are obtained as shown in Figure 7, and the maximum vibration velocity is obtained.
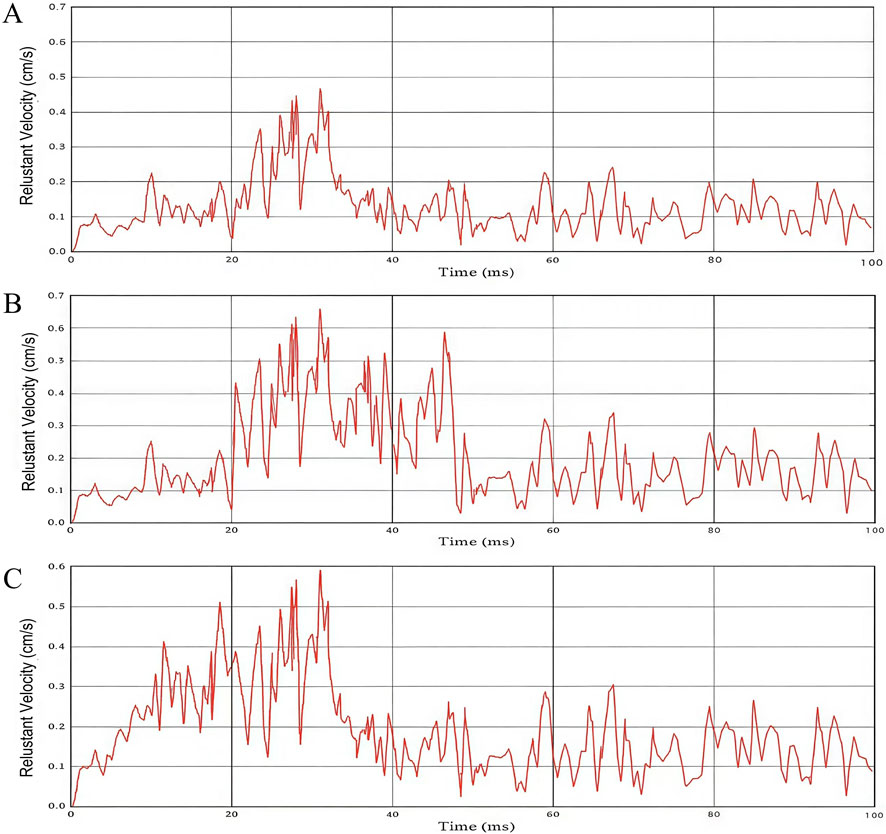
Figure 7. Combined vibration velocity waveforms for soil (A), air (B), and water (C) interval loading.
Get the maximum vibration resultant velocity from the diagram and draw the following chart statistics Table 4.

Table 4. Maximum vibration velocities of different charging materials.
It can be seen from Table 4 that the material with the lowest maximum combined vibration velocity corresponding to the three different interval charge material models is soil, and its vibration velocity is 0.46 cm/s. The maximum resultant velocity of the soil spacing model is 30.30% and 22.03% lower than that of the water and air spacing model, respectively. The simulation results under the delay time of 30 ms are 0.52 cm/s, and the maximum closing speed is reduced by 11.53%. The soil material with the least influence of the interval charge material can be obtained.
3.2.2.2 Stress analysis
Three kinds of interval charge material models were simulated and analyzed to obtain the stress state of the surface directly above the pipeline, and the stress analysis was carried out to find the optimal interval charge material. The stress cloud associated with the surface directly above the pipeline is shown in Figure 8.
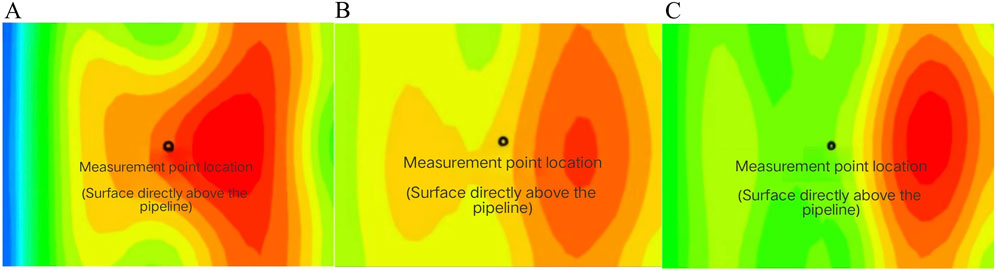
Figure 8. Stress cloud diagram of soil interval charging (A) Soil interval charging stress cloud diagram (B) Soil interval charging stress cloud diagram (C).
3.3 Field vibration reduction test
In this paper, the field vibration reduction test was carried out by setting different delay time and changing the interval charge material. In order to reduce the convenience and efficiency of the field vibration reduction research, the field vibration reduction effect is measured by the parameter of the maximum vibration velocity, and the maximum single-stage dosage value is controlled as much as possible to reduce the difference between the vibration velocities caused by the inconsistency of the dosage.
The maximum vibration velocity is influenced not only by the highest single-stage charge but also by factors like the difference in height and the distance from the explosion center. Due to ongoing tunnel excavation, the distance between the blasting center and the measurement point for each blasting operation is continuously decreasing. The measuring point of this field vibration reduction test is located on the surface directly above the oil pipeline. Because the tunnel length is long and basically in the same level of excavation, the excavation length of each blasting excavation in the process of this test is negligible compared with the tunnel length and the horizontal height does not change, so the distance between the blasting center and the elevation difference can be considered unchanged.
Taking into account the geological conditions and various other factors, the measuring point is positioned directly above the oil pipeline on the surface. The distance from the measuring point to the blasting area is reasonable, and since the surface is made of concrete, it helps minimize errors that could arise from slight variations in distance between the blasting center and elevation differences.
3.3.1 Delay time field test
The delay time field test is carried out. The test is divided into three groups, that is, the single delay time is 28 ms, 30 ms and 32 ms respectively. The waveform diagram of the test is obtained at the measuring point, and it is analyzed and compared with the simulation. The statistics of the maximum vibration velocity and the combined velocity measured by the measuring point for different delay time are as follows Table 5.
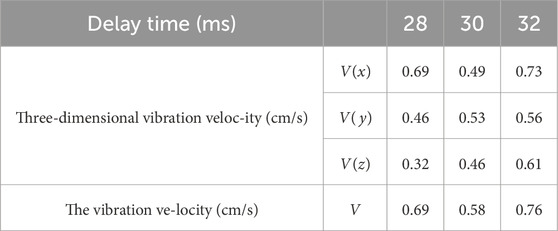
Table 5. Statistical table of vibration velocity at different delay times.
From Table 5, it can be seen that in the case of a delay time of 30 ms, there is a minimum value of the vibration velocity, and the maximum vibration velocity is 0.58 cm/s. Therefore, for this geological condition, the vibration reduction effect of a single delay time of 30 ms is the best. The results of field test and simulation are consistent, so it can be confirmed that the simulation is credible. The established pipeline model of tunnel excavation has guiding significance in engineering.
3.3.2 Field test of interval charge
Based on the field test of different delay time, the field test of interval charge is continued. In the field test of interval charge, PNJ-A clay gun is used to produce soil charge materials. The specific production process is to manually stir the soil medium evenly and put it into the feed bin. The start button can be put into production. The length of the soil interval produced is between 20 and 30 cm. The KPS-60 plastic bag filling and sealing machine is used to produce water bags in the field test of interval charge. The specific process of producing water bags is to open the switch first, then the machine runs twice, let the pump discharge the air and fill the water, and then close the main switch. The plastic bag is sheathed into the outlet pipe mouth and the switch button is started by hand to complete the filling and sealing of the water medium Figure 9.
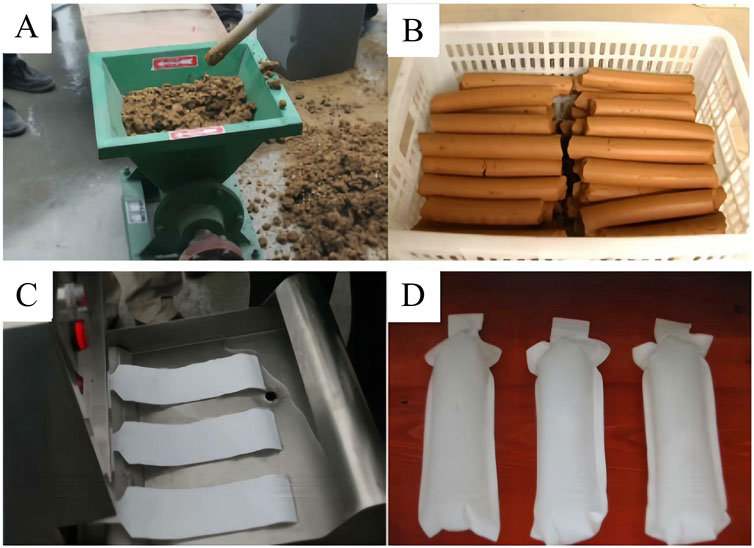
Figure 9. Site preparation of soil (A, B) and water (C, D) spacer charge materials.
In the field interval charge test, in order to achieve the blasting effect, after the interval of different materials is filled, the length of the blockage section of the blast hole is measured with a bamboo rod, and then the remaining finished product of the soil interval or the rock powder formed during the drilling process is used as the blockage, and the uncrushed block object cannot be used for filling, so as to avoid the generation of flying stones during the blasting process. In the final filling process, the filling material needs to be compacted with a wooden stick to improve the utilization rate of explosives.
The field test for delay time is conducted and categorized into three groups based on the interval charging materials: soil, water, and air. A waveform diagram is recorded at the measurement point, which is then analyzed and compared with the simulation results. Below is Table 6. Which presents the statistical data on the maximum vibration velocity and the combined velocity recorded at the measurement point for the various charging materials.
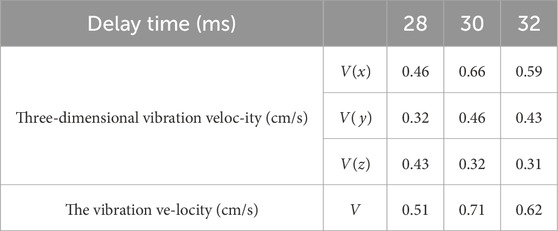
Table 6. Statistical table of interval vibration velocity of different charging materials.
It can be seen from Table 6 that the maximum vibration velocity is 0.51 cm/s when the soil is spaced. In the case of charging at water intervals, the maximum combined vibration velocity is 0.71 cm/s; in the case of air interval charge, the maximum combined vibration velocity is 0.62 cm/s, so for this geological condition, the vibration reduction effect of soil interval charge material is the best. The results of field test and simulation are consistent, so it can be sure that the simulation is credible. The established pipeline model of tunnel excavation has guiding significance in engineering.
4 Conclusion
In this paper, taking the Yongxing No.1 tunnel adjacent to the buried oil pipeline in the high-speed railway section from Guizhou to Nanning as an example, ANSYS/LS-DYNA is used to analyze the blasting vibration waveform and maximum stress of the combined vibration velocity under different working conditions under the action of three kinds of delay time and three kinds of interval charge materials. Finally, the optimal delay time and charge filling material under this geological condition are obtained. The conclusions are as follows.
(1) By simulating delay times of 28 ms, 30 ms, and 32 ms, along with different spacer materials (soil, water, air), it was observed that the lowest maximum vibration speed occurred at a 30 ms delay time, measuring 0.52 cm/s. This represents a reduction in vibration of 20% compared to 28 ms and 29% compared to 32 ms, with the maximum stress recorded at 26.4 MPa. Additionally, when using soil as the spacer material at a 30 ms delay, the vibration further decreased to 0.46 cm/s, which is 30.30% lower than with water and 22.03% lower than with air spacers, while the maximum stress point was 22.4 MPa.
(2) The field monitoring experiments showed that the lowest maximum vibration velocity occurred at a delay of 30 ms, measuring 0.52 cm/s, which is 15.9% and 23.7% less than the velocities recorded at 28 ms and 32 ms, respectively. Additionally, the earth spacer material exhibited the lowest maximum vibration velocity at 0.51 cm/s, which is 28.2% and 17.7% lower than the velocities of the water and air spacers, respectively.
(3) Comparison via field tests and simulations: The optimal performance for vibration reduction is achieved with a delay time of 30 ms and the use of soil spacer materials. The results from field experiments align closely with those from numerical simulations. Implementing an appropriate delay time along with soil spacer charges can lead to improved vibration reduction outcomes.
Data availability statement
The original contributions presented in the study are included in the article/supplementary material, further inquiries can be directed to the corresponding authors.
Author contributions
YC: Writing–original draft, Formal Analysis, Investigation, Software, Visualization. RZ: Funding acquisition, Investigation, Methodology, Validation, Writing–review and editing. LL: Software, Writing–original draft. YW: Data curation, Formal Analysis, Writing–review and editing. JC: Formal Analysis, Investigation, Methodology, Resources, Software, Visualization, Writing–original draft. CX: Conceptualization, Data curation, Project administration, Supervision, Writing–review and editing, Resources.
Funding
The author(s) declare that no financial support was received for the research, authorship, and/or publication of this article.
Conflict of interest
Author YW was employed by Guangxi Guida Demolition Engineering Co., Ltd.
The remaining authors declare that the research was conducted in the absence of any commercial or financial relationships that could be construed as a potential conflict of interest.
Publisher’s note
All claims expressed in this article are solely those of the authors and do not necessarily represent those of their affiliated organizations, or those of the publisher, the editors and the reviewers. Any product that may be evaluated in this article, or claim that may be made by its manufacturer, is not guaranteed or endorsed by the publisher.
References
Biondi, A. M., Zhou, J., Guo, X., Wu, R., Tang, Q., Gandhi, H., et al. (2022). Pipeline structural health monitoring using distributed fiber optic sensing textile. Opt. Fiber Technol. 70, 102876. doi:10.1016/j.yofte.2022.102876
Briassoulis, D., and Mistriotis, A. (2018). Key parameters in testing biodegradation of bio-based materials in soil. Chemosphere 207, 18–26. doi:10.1016/j.chemosphere.2018.05.024
Chen, Z., Xie, C., Xiong, G., Shen, J., and Yang, B. (2023). Using the morgenstern-price method and cloud theory to invert the shear strength index of tailings dams and reveal the coupling deformation and failure law under extreme rainfall. Sustainability 15, 6106. doi:10.3390/su15076106
Chengyu, X., Weihang, L., Ziwei, C., and Yabin, W. (2023). Study on the infrared dynamic evolution characteristics of different joint inclination phyllite under uniaxial compression. Sci. Rep. 13, 9867. doi:10.1038/s41598-023-37098-w
Feng, X., Han, Y., Wang, Z., and Liu, H. (2018). Structural performance monitoring of buried pipelines using distributed fiber optic sensors. J. Civ. Struct. Health Monit. 8, 509–516. doi:10.1007/s13349-018-0286-3
Guo, D., Xiao, W., Guo, D., and Lu, Y. (2022). Numerical simulation of surface vibration propagation in tunnel blasting. Math. Probl. Eng. 2022, 1–10. doi:10.1155/2022/3748802
Han, F., Li, J., Cai, Y., Wang, Q., and Qiu, J. (2022). Application of energy-concentrated hydraulic blasting Technology in tunnel construction in China. Shock Vib. 2022, 1–17. doi:10.1155/2022/4724343
Hassan, A., and Oudah, F. (2024). RF-DYNA - software for optimized random finite element simulation using LS-DYNA. Adv. Eng. Softw. 196, 103724. doi:10.1016/j.advengsoft.2024.103724
He, B., Armaghani, D. J., Lai, S. H., He, X., Asteris, P. G., and Sheng, D. (2024). A deep dive into tunnel blasting studies between 2000 and 2023-A systematic review. Tunn. Undergr. Space Technol. 147, 105727. doi:10.1016/j.tust.2024.105727
Jia, P., Guan, Y., Lu, B., Zhao, W., Bai, Q., and Du, X. (2023). Flexural performance of steel tube roof slab and parameter optimization. Case Stud. Constr. Mat. 18, e01726. doi:10.1016/j.cscm.2022.e01726
Jiang, N., Gao, T., Zhou, C., and Luo, X. (2018). Effect of excavation blasting vibration on adjacent buried gas pipeline in a metro tunnel. Tunn. Undergr. Space Technol. 81, 590–601. doi:10.1016/j.tust.2018.08.022
Jiang, N., Zhu, B., Zhou, C., Li, H., Wu, B., Yao, Y., et al. (2021). Blasting vibration effect on the buried pipeline: a brief overview. Eng. Fail. Anal. 129, 105709. doi:10.1016/j.engfailanal.2021.105709
Koopialipoor, M., Nikouei, S. S., Marto, A., Fahimifar, A., Armaghani, D. J., and Mohamad, E. T. (2019). Predicting tunnel boring machine performance through a new model based on the group method of data handling. Bull. Eng. Geol. Environ. 78, 3799–3813. doi:10.1007/s10064-018-1349-8
Li, S., Liu, B., Xu, X., Nie, L., Liu, Z., Song, J., et al. (2017). An overview of ahead geological prospecting in tunneling. Tunn. Undergr. Space Technol. 63, 69–94. doi:10.1016/j.tust.2016.12.011
Li, X., Liu, K., Sha, Y., Yang, J., and Hong, Z. (2024). Experimental and numerical investigation on rock fracturing in tunnel contour blasting under initial stress. Int. J. Impact Eng. 185, 104844. doi:10.1016/j.ijimpeng.2023.104844
Liu, X., Jiang, A., Guo, X., and Hai, L. (2022). Effect of excavation blasting in the arch cover method on adjacent existing pipelines in a subway station. Appl. Sci.-Basel 12, 1529. doi:10.3390/app12031529
Ma, J., Li, R., Li, C., Chen, J., Lin, Y., and Huang, L. (2024). Further development of gdem for the modeling of multi-scale dynamic response of rock subjected to blasting and impact. Int. J. Multiscale Comput. Eng. 22, 49–65. doi:10.1615/intjmultcompeng.2023049685
Mao, X., Zheng, Y., Shen, F., Wang, Y., Wang, X., and Li, Y. (2022). A method for calculating the JWL equation of state parameters for the detonation products of CL-20-based aluminized explosives. J. Energy Mat. 40, 182–205. doi:10.1080/07370652.2020.1854370
Oh, D.-W., Kong, S.-M., Kim, S.-B., and Lee, Y.-J. (2023). Prediction and analysis of axial stress of piles for piled raft due to adjacent tunneling using explainable AI. Appl. Sci.-Basel 13, 6074. doi:10.3390/app13106074
Pohl, C., Toenjes, M., Liebold, C., Ploeckl, M., Koerber, H., Avila Gray, L., et al. (2022). Numerical prediction of composite damage behavior: a modeling approach including the strain-rate-dependent material response. Compos. Struct. 292, 115628. doi:10.1016/j.compstruct.2022.115628
Qin, Q., and Zhang, J. (2020). Vibration control of blasting excavation of large cross-section highway tunnel over metro line. Arab. J. Geosci. 13, 868. doi:10.1007/s12517-020-05836-3
Qin, T., Wu, M., Jia, L., Xie, L., and Wu, L. (2023). Effects of vibration on adjacent pipelines under blasting excavation. Appl. Sci.-Basel 13, 121. doi:10.3390/app13010121
Rostami, E., and Mahdavy Moghaddam, H. (2024). Distribution function and atomization parameters of petroleum fuels sprays: an experimental and numerical study. Results Eng. 21, 101692. doi:10.1016/j.rineng.2023.101692
Rybakov, A. P. (2016). Mixed explosives and determination of their detonation parameters. Propellants Explos. Pyrotech. 41, 371–376. doi:10.1002/prep.201500217
Sharafat, A., Tanoli, W. A., Raptis, G., and Seo, J. W. (2019). Controlled blasting in underground construction: a case study of a tunnel plug demolition in the Neelum Jhelum hydroelectric project. Tunn. Undergr. Space Technol. 93, 103098. doi:10.1016/j.tust.2019.103098
Shen, S., Gao, Y., and Jia, L. (2024). A Comparison of the relationship between dynamic and static rock mechanical parameters. Appl. Sci.-Basel 14, 4487. doi:10.3390/app14114487
Shi, C., Zhao, Q., Lei, M., and Peng, M. (2019). Vibration velocity control standard of buried pipeline under blast loading of adjacent tunnel. Soils Found. 59, 2195–2205. doi:10.1016/j.sandf.2019.12.003
Shin, J.-H., Moon, H.-G., and Chae, S.-E. (2011). Effect of blast-induced vibration on existing tunnels in soft rocks. Tunn. Undergr. Space Technol. 26, 51–61. doi:10.1016/j.tust.2010.05.004
Thai, D.-K., Tran, M.-T., Phan, Q.-M., and Pham, T.-H. (2021). Local damage of the RC tunnels under ballistic missile impact investigated by finite element simulations. Structures 31, 316–329. doi:10.1016/j.istruc.2021.01.092
Wang, H., Zhao, Y., Shan, R., Tong, X., and Liu, D. (2022). Analysis of blasting vibration effect of railway tunnel and determination of reasonable burial depth. Geofluids 2022, 1–8. doi:10.1155/2022/7151294
Wang, S., Gong, M., Wu, H., Wu, X., and Liu, X. (2024). Optimization study of water interval charge structure based on the evaluation of rock damage effect in smooth blasting. Appl. Sci.-Basel 14, 2868. doi:10.3390/app14072868
Xie, C., Chen, Z., Xiong, G., Yang, B., and Shen, J. (2023). Study on the evolutionary mechanisms driving deformation damage of dry tailing stack earth-rock dam under short-term extreme rainfall conditions. Nat. Hazards 119, 1913–1939. doi:10.1007/s11069-023-06190-9
Xu, W., and Neumann, I. (2020). Finite element analysis based on A parametric model by approximating point clouds. Remote Sens. 12, 518. doi:10.3390/rs12030518
Xue, F., Xia, C., Li, G., Jin, B., He, Y., and Fu, Y. (2019). Safety threshold determination for blasting vibration of the lining in existing tunnels under adjacent tunnel blasting. Adv. Civ. Eng. 2019, 8303420. doi:10.1155/2019/8303420
Xue, Y., Wang, J., and Xiao, J. (2024). Bibliometric analysis and review of mine ventilation literature published between 2010 and 2023. Heliyon 10, e26133. doi:10.1016/j.heliyon.2024.e26133
Yang, C., Zhang, R., Liu, D., Tang, Y., Huang, R., and Qiu, W. (2023a). Evaluation of excavation ergonomics of drill and blast method based on game theory G2-EW-TOPSIS model. Appl. Sci.-Basel 13, 7205. doi:10.3390/app13127205
Yang, H.-C., Chou, H.-C., Hsu, S.-Y., and Chang, W.-K. (2023b). The influence of boundary conditions on nonlinear time domain site response analysis using LS-DYNA. Comput. Geotech. 159, 105477. doi:10.1016/j.compgeo.2023.105477
Yang, Y., Cai, Z., Jiang, N., Zhou, C., and Li, H. (2022). Safety evaluation of underground gas pipe under blasting of subway connected aisle: a case study. KSCE J. Civ. Eng. 26, 921–932. doi:10.1007/s12205-021-0399-9
Yu, C., Wu, J., Li, H., Ma, Y., and Wang, C. (2024). Study on the equivalence transformation between blasting vibration velocity and acceleration. Sensors 24, 1727. doi:10.3390/s24061727
Zhang, J., Chen, Z., and Shao, K. (2024). Numerical investigation on optimal blasting parameters of tunnel face in granite rock. Simul. Model. Pract. Theory 130, 102854. doi:10.1016/j.simpat.2023.102854
Zhao, H., Long, Y., Li, X., and Lu, L. (2016). Experimental and numerical investigation of the effect of blast-induced vibration from adjacent tunnel on existing tunnel. KSCE J. Civ. Eng. 20, 431–439. doi:10.1007/s12205-015-0130-9
Zhao, Y., Feng, S., Zhang, X., Zheng, Q., and Cao, B. (2024). Numerical analysis of the impact of drill-and-blast tunneling on an overlying landfill. Comput. Geotech. 170, 106296. doi:10.1016/j.compgeo.2024.106296
Zheng, Y., Lan, X., Pan, T., Cui, D., Li, G., Shen, L., et al. (2023). Field testing and numerical simulation of the effectiveness of trench isolation for reducing vibration due to dynamic compaction. Appl. Sci.-Basel 13, 9744. doi:10.3390/app13179744
Zhu, C., Pu, Y., Yang, K., Yang, Q., and Chen, C. L. P. (2023a). Distributed optical fiber intrusion detection by image encoding and SwinT in multi-interference environment of long-distance pipeline. IEEE Trans. Instrum. Meas. 72, 1–12. doi:10.1109/TIM.2023.3277937
Keywords: near the oil pipeline, pipeline vibration effect, vibration reduction experiment, tunnel blasting, numerical simulation
Citation: Chen Y, Zhang R, Liang L, Wang Y, Chen J and Xie C (2025) Comparative study on blasting simulation vibration reduction and field vibration reduction experiment of adjacent oil pipeline. Front. Earth Sci. 12:1489468. doi: 10.3389/feart.2024.1489468
Received: 01 September 2024; Accepted: 12 December 2024;
Published: 09 January 2025.
Edited by:
Kaixiang Yang, South China University of Technology, ChinaReviewed by:
Yifan Shi, South China University of Technology, ChinaChengyuan Zhu, Zhejiang University, China
Copyright © 2025 Chen, Zhang, Liang, Wang, Chen and Xie. This is an open-access article distributed under the terms of the Creative Commons Attribution License (CC BY). The use, distribution or reproduction in other forums is permitted, provided the original author(s) and the copyright owner(s) are credited and that the original publication in this journal is cited, in accordance with accepted academic practice. No use, distribution or reproduction is permitted which does not comply with these terms.
*Correspondence: Ruichong Zhang, emhhbmdydWljaG9uZzIwMDJAMTYzLmNvbQ==; Jiaozhong Chen, MjAyMzIxNjEyMTE2QHNtYWlsLnh0dS5lZHUuY24=; Chengyu Xie, eGllY2hlbmd5dTQyQHh0dS5lZHUuY24=