- 1Jiangsu Earthquake Risk Prevention Center, Earthquake Administration of Jiangsu Province, Nanjing, China
- 2Institute of Geotechnical Engineering, Nanjing Tech University, Nanjing, China
This study uses a fully coupled dynamic effective stress analysis method to evaluate the seismic response of a site containing silty sand which is a liquefiable interlayer. A generalized plasticity model is employed to describe the liquefaction behavior of silty sand under seismic action, and a nonlinear constitutive model is used to account for the nonlinear and hysteretic characteristics of non-liquefiable soils. The parameters of constitutive model were calibrated from the shear wave velocity and results of resonant column tests on different soils in a borehole. The results indicated that (1) A new spike with a period of approximately 1 s was observed at the top of the liquefiable interlayer compared to that at the bottom of the interlayer, reflecting a common seismic response characteristic induced by the rise in the excess pore water pressure (EPWP); (2) The low-frequency input motion caused higher EPWP within the liquefiable interlayer and more ground settlement at the consolidation stage; (3) The increase in either peak horizontal acceleration or peak vertical acceleration of input motions resulted in higher increase in the EPWP and ground surface settlement. Moreover, the vertical seismic component in near-field earthquakes has much more significant effect on the ground settlement in liquefiable sites than that in far-field earthquakes.
1 Introduction
Earthquakes, as a powerful dynamic force of nature, pose a significant threat to human society and engineering structures, especially at liquefiable sites, where earthquake-induced ground damage is particularly severe (Fan et al., 2023; Sui et al., 2024). The destruction of soil structure and the sharp rise in excess pore water pressure EPWP lead to soil liquefaction during earthquakes, which in turn causes significant ground settlement and lateral spreading, severely damaging buildings, bridges, roads, and other infrastructure. Therefore, it is of great theoretical and practical importance to conduct in-depth analysis on the liquefaction effects of sites induced by earthquakes.
The seismic response characteristics of liquefiable sites are a well-established yet challenging topic in geotechnical earthquake engineering. Scholars have extensively investigated seismic response characteristics of liquefiable sites through physical model tests, theoretical analysis, numerical simulation, and field seismic record analysis. Jia and Wang (2013) showed that interlayer thickness significantly affects liquefaction resistance of layered sand. Ecemis (2021) found that the thickness of the silt seam plays a crucial role in determining the liquefaction resistance of stratified sand deposits located beneath it. Cubrinovski et al. (2019) emphasizes the necessity of considering the system response of liquefying soils when assessing the occurrence and severity of liquefaction-induced damage. Xiu et al. (2020) noted that the powdery sand interlayer can effectively impede the transmission of pore water pressure within layered sand. Adampira and Derakhshandi (2020) experimentally found that site liquefaction is more severe when the liquefiable interlayer is thicker and shallower, leading to more attenuation of peak ground motion and greater ground settlement. Shen et al. (2022) discovered that the dilatancy of liquefied soil can significantly amplify the peak horizontal acceleration in liquefiable layers. Yao and Lin (2023) conducted numerical studies revealing that the location of liquefiable interlayers significantly impacts the internal force response of subway station structures. Youd and Carter (2005) recorded accelerations at liquefiable sites and found that soil softening or liquefaction has little effect on short-period response spectral accelerations but can significantly amplify long-period spectral accelerations. Sun and Yuan (2004) demonstrated that liquefaction can extend the predominant period of acceleration response spectra, amplifying long-period spectral accelerations while slightly suppressing short-period spectral accelerations. Therefore, site liquefaction may have more severe adverse effects on long-period and highly flexible structures (Sun et al., 2014). However, most existing studies focus on unidirectional seismic excitation, with relatively few studies on the response of liquefiable sites under both vertical and horizontal seismic excitations.
Horizontal seismic motions are often accompanied by vertical seismic motions during actual earthquakes. Considering combined effects of vertical and horizontal input motions can help provide a more comprehensive understanding of the seismic response of liquefiable sites, offering a more scientific basis for seismic risk assessment of engineering structures. Yang et al. (2002) found that the peak horizontal ground acceleration and frequency content of spectral accelerations depend on the intensity of the input motions and the nonlinearity of soils, while the input motion intensity has minimal effect on the amplification factor of vertical ground motions. Tsai and Liu (2017) proposed a method for equivalent nonlinear analysis of soil considering vertical seismic motion, emphasizing the importance of soil nonlinearity on vertical seismic wave propagation. Song et al. (2024) found that vertical seismic components greatly increase the influence of the approach bridge on the lateral displacement and internal forces of piles in liquefiable sites. Chen et al. (2018) investigated the impact of vertical seismic motion on the transient liquefaction of the seabed, finding that increasing the hydraulic coefficient of the surface soil can effectively inhibit seabed liquefaction. Xu et al. (2021a) numerically investigated the effect of vertical seismic motion on the settlement of pile groups, showing that vertical seismic motion significantly increases the settlement of pile groups in liquefied sites. Tsaparli et al. (2016) found that vertical input motion could increase liquefaction depth and post-liquefaction ground settlement. Thus, the dynamic response of liquefiable sites under combined horizontal and vertical input motions is more complex than that under unidirectional horizontal input motion alone. However, existing research has rarely considered the impact of the frequency of horizontal and vertical input motions on the dynamic response of liquefiable sites, particularly under conditions where liquefiable interlayers are present.
To address these issues, we thoroughly investigated a typical borehole with a liquefiable interlayer in the Yangtze River Delta Plain region of China. A fully coupled dynamic effective stress analysis method was adopted to evaluate the seismic response of a site containing a liquefiable interlayer. A generalized plasticity model is employed to describe the liquefaction behavior of silty sand under seismic action, and a nonlinear constitutive model is used to account for the nonlinear and hysteretic characteristics of non-liquefiable soils. The parameters of constitutive model were calibrated from the shear wave velocity and results of resonant column tests on different soils in the borehole. The effect of peak horizontal acceleration, frequency content, and peak vertical acceleration of input motions on the seismic response of the liquefiable site was discussed.
2 Finite element model
2.1 Site conditions
Figure 1 shows the borehole WX-03 with the distribution of shear wave velocity of different soils. In the finite element model, the total thickness of soil layers is taken as 73 m. In this study, the instrument employed in the field test was the ZD16 hole excitation wave tester, which utilizes a single-hole method to measure the wave velocity of the soil layers. This approach allows for the direct determination of the shear wave velocity in various soil layers. Following the” GB50011-2010 Code for Seismic Design of Buildings”, the equivalent shear wave velocity (Vse) was confirmed as 185 m/s by averaging the values obtained from five measurements. Accordingly, this site is classified as a type III. According to the site investigation, the averaged actual standard penetration test (SPT) blow count is 7, which is below the critical SPT blow count range of 11–13, as calculated according to GB50011-2010. Therefore, the silty sand (i.e., third layer) located between the silty clay layers is deemed to be potentially liquefiable. The borehole is located near Jiangyin City in the Yangtze River Delta Plain region of China, and its representativeness and uniqueness lie in the presence of a liquefiable silt interlayer, as shown in Figure 1.
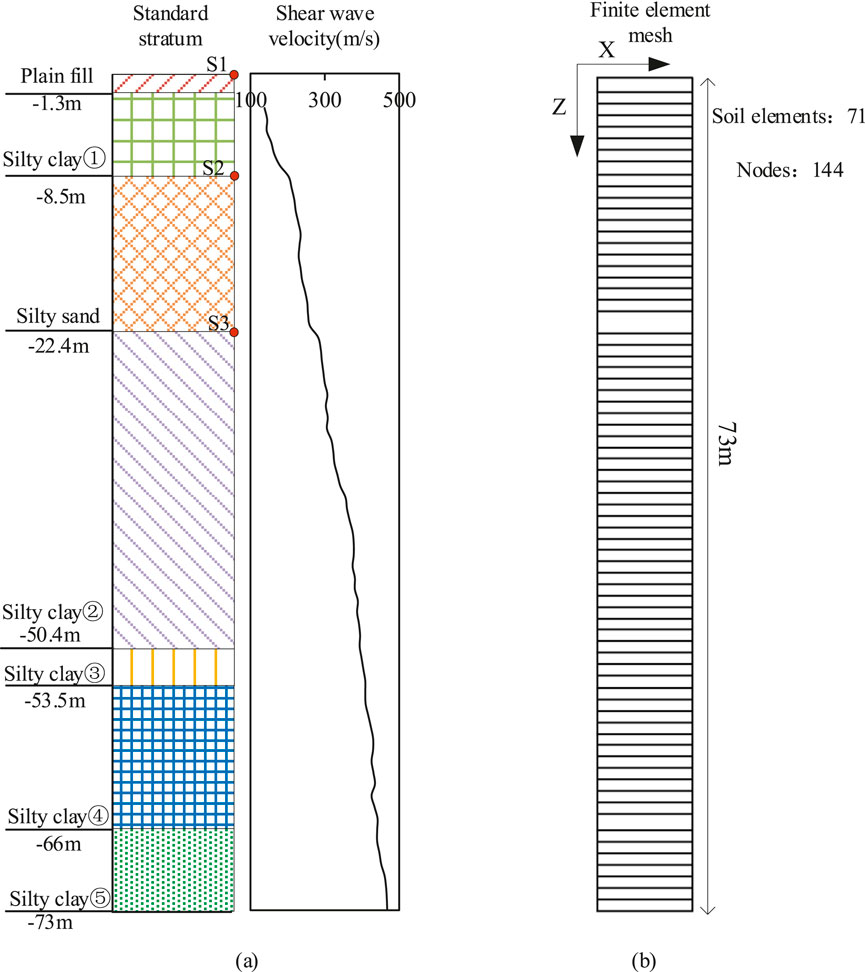
Figure 1. WX-03 borehole: (A) distribution of the shear velocity of soil layers and (B) finite element mesh.
2.2 Governing equation
In the seismic analysis, the solid and fluid phases of the soil are modeled using Biot’s theory with the u-p formulation (Biot, 1956; Zienkiewicz et al., 1999) and the governing equations are given by Equations 1, 2, respectively:
where M is the mass matrix, u, is the displacement vertor, C is Rayleigh damping matrix, K is the stiffness matrix, Q is the coupled matrix, p is the pore water pressure vector, H is the seepage matrix, S is the compression matrix, and fu and fp are the external load vectors. Note that a single dot and two dots above a variable represents the first and second derivative of that variable with respect to time, respectively. The u-p formulation is solved by the UWLC program, a fully coupled dynamic effective stress finite element analysis software, which is adopted in this study (Forum 8 Co. Ltd, 2005; Xu et al., 2013; Xu et al., 2019; Xue et al., 2023).
Soil damping plays a critical role in the dissipation of seismic energy and significantly affects the seismic response of the ground. In the study, soil damping was modeled by incorporating Rayleigh damping at small-strain level and by material damping characterized by constitutive models at large-strain level.
2.3 Constitutive modeling of soils
2.3.1 Generalized plasticity model for silty sand interlayer
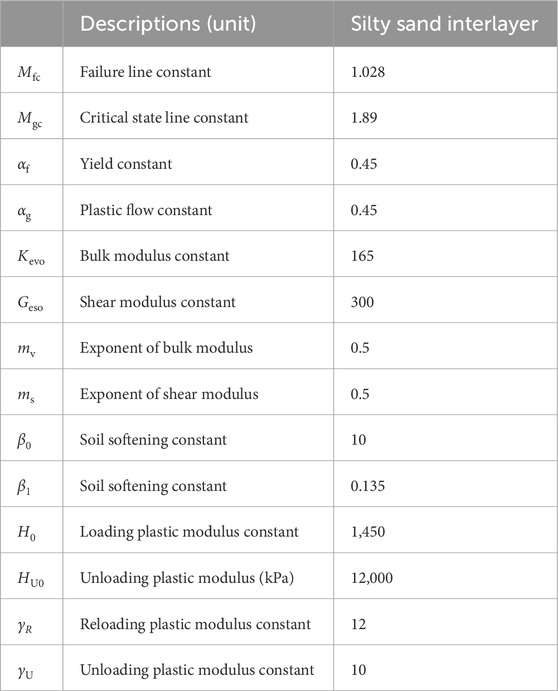
To simulate earthquake-induced liquefaction of the silty sand interlayer in the WX-03 borehole, this study employed a modified generalized plasticity model, Pastor-Zienkiewicz III (PZ III) model, to represent the silty sand interlayer. The generalized plasticity model used in the study was specifically chosen because it can handle complex behaviors, such as cyclic loading and liquefaction in silty soils. This model accounts for the plastic strain accumulation during seismic events, which is crucial in accurately capturing the buildup of EPWP (Pastor et al., 1990; Xue et al., 2023; Xu et al., 2023). The generalized plasticity model is originally proposed by Zienkiewic et al. (1999) and modified by Cai et al. (2002) and calculates the stress increment (dσ) using strain increment (dε) through an elasto-plastic matrix Dep. The dε and Dep are given by Equations 3, 4, respectively:
where De is the elastic matrix, HL/U is the plastic modulus, n is the loading direction vectors, and ngL/U is the plastic flow direction vector. The subscripts L and U indicate loading and unloading, respectively. Detailed information about the model is referred to the literature (Cai et al., 2002; Xu et al., 2023).
The parameters of the PZ III model were calibrated using the liquefaction resistance (RL), which is estimated based on the shear wave velocity (Amoly et al., 2016):
where
Vs and
The generation and dissipation of EPWP were modeled using a fully coupled dynamic effective stress approach together with the generalized plasticity constitutive model, which simultaneously solves the equations of motion and fluid flow in the soil. The numerical model has been validated through various laboratory tests and model tests in the literature (Pastor et al., 1990; Xu et al., 2023).
2.3.2 Nonlinear constitutive model for non-liquefiable soils
The Wakai and Ugai (2004) model was employed to model dynamic characteristics of non-liquefiable soils in this study. The backbone and hysteresis curves of the model are given by Equations 7, 8 respectively:
where τ and γ represent shear stress and shear strain, respectively, G0 is the initial shear modulus and was calculated from the shear wave velocity, b and n are two model constants, a is the internal variable, G0 and τf were given by Equations 9, 10, respectively:
where p′ is the mean effective stress, Pa is the standard atmospheric pressure, Θ is Lode angle, and
To accurately calibrate the parameters of the Wakai and Ugai (2004) model, this study used the GZZ-50 type resonant column apparatus to conduct element tests on different soils at WX-03 borehole, obtaining the shear modulus and damping curves of soils. Resonant column tests were conducted on samples with diameter of 5.0 cm and height of 10.0 cm. The test procedure is detailed in (ASTM, 2015). The Wakai and Ugai (2004) model parameters were then inversely determined using the UWLC model parameter calibration program. As shown in Figure 2, the model’s simulation results corresponded well with the measurements. Table 2 gives model parameters of non-liquefiable soils at WX-03 borehole.
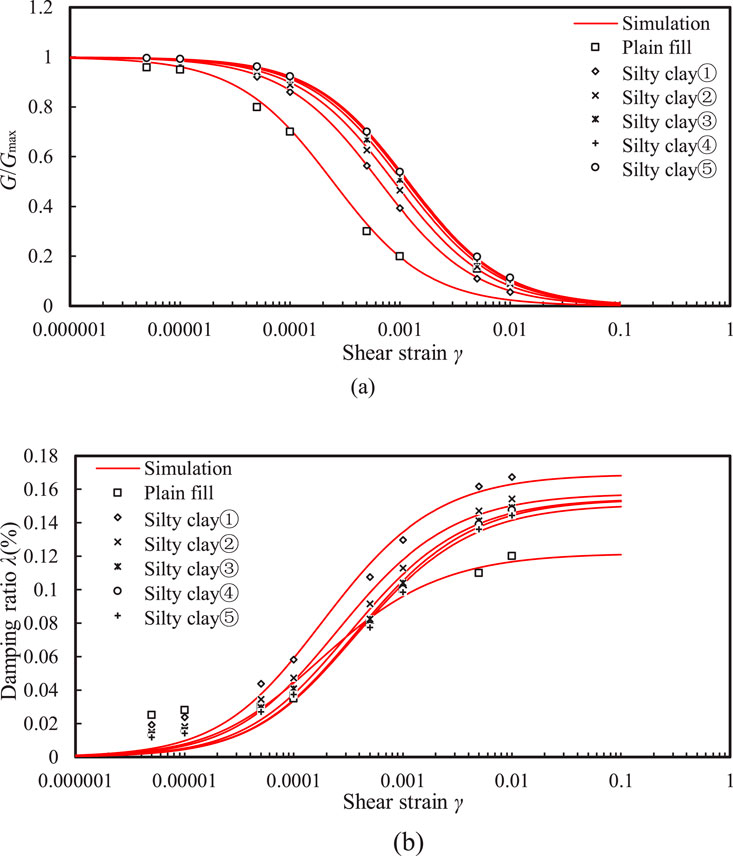
Figure 2. Comparison between the measurements and model simulations: (A) the G/Gmax ∼ γ relationship and (B) λ ∼ γ relationship.
Note that P-wave velocity is indeed a crucial parameter in seismic analysis, especially when vertical ground shaking is involved. However, the calculation process typically focuses on the seismic effects of vertically propagating S-waves, and P-wave testing is generally more challenging than S-wave testing (Zhubayev and Ghose, 2012). Thus, only the shear wave velocity was measured in this study. In the finite element analysis, the soil was assumed to be isotropic, so the shear modulus derived from shear wave velocity results and Poisson’s ratio, were used to calculate Young’s modulus in the constitutive model for dynamic analysis under vertical seismic loading.
2.4 Boundary conditions
Static analysis is required before the dynamic analysis. The initial displacement and strain from the static analysis are reset to zero before starting the dynamic analysis. The purpose of the static analysis is to provide the initial stress for the dynamic analysis. In the static analysis, the lateral boundaries are fixed in the horizontal direction but are free to move in the vertical direction. In the dynamic analysis, the two lateral boundaries use the Multi-Point Constraints (MPC) boundary condition. The bottom boundary of the model is fixed in both static and dynamic analyses.
3 Results and discussions
To consider the impact of the spectral characteristics of input ground motions on site seismic response, this study selected three (i.e., Liu’an, Kobe, and Nahanni) seismic input ground motions with distinct spectral differences. Figure 3 shows the horizontal accelerations and Fourier amplitude for these three input motions with peak horizontal acceleration (PHA) of 0.5 g. It can be observed that the Kobe input motion has a uniform frequency distribution, indicating that its energy is evenly distributed across different frequency components. The Nahanni input motion is rich in high-frequency components, suggesting that it has stronger energy in the higher frequency range, which may significantly impact on the short-period response of structures. The Liu’an input motion is richer in low frequencies, which may have a greater impact on the long-period response of structures. The predominant frequencies (fd) corresponding to the Liu’an, Kobe, and Nahanni input motions are 0.34 Hz, 1.45 Hz, and 4.02 Hz, respectively. Liuan wave is considered far-field seismic input motion, whereas Kobe and Nahanni waves are classified as near-field seismic input motions.
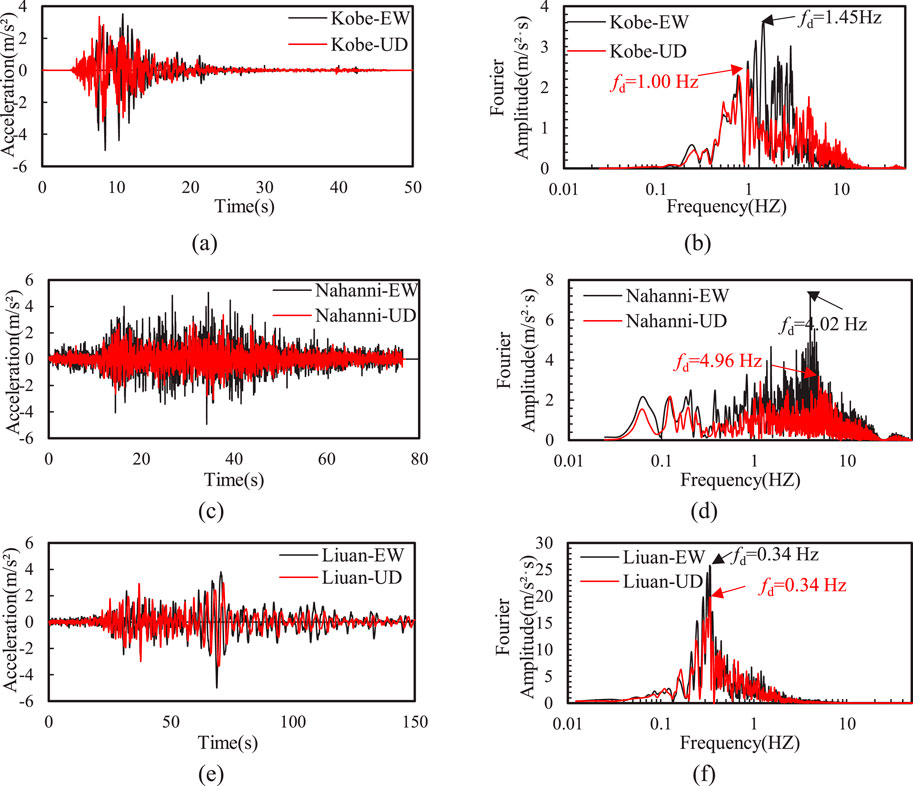
Figure 3. Time history of Fourier amplitude of the horizontal (EW) and vertical (UD) input motions: (A) Kobe, (C) Nahanni, and (E) Liuan input motions; (B) Kobe (D) Nahanni (F) Liuan Fourier amplitudes.
This study also considers the variation of PHA and peak vertical acceleration (PVA), with PHA ranging from 0.3g to 0.5 g. According to GB 50011-2010, 2016 and American Society of Civil Engineers, 2017, the general peak vertical ground motion is approximately 2/3 of the peak horizontal ground motion, thus, the ratio of PVA to PHA varies from 0 to 0.67. The vertical accelerations and corresponding Fourier amplitude of for PVA/PHA = 0.67 are also plotted in Figure 3. This study focuses on investigating the effects of the input motion frequency, PHA, and PVA on the site response at typical points, including the horizontal acceleration and acceleration response spectra, excess pore water pressure, and ground settlement.
In Sections 3.1, 3.2, we focus solely on the impact of horizontal ground excitation, setting PVA = 0. In Section 3.3, we examined the effects of vertical ground excitation, considering scenarios where both horizontal and vertical ground shaking occur simultaneously, with peak acceleration ratios of PVA/PHA = 0, 0.37, and 0.67. Table 3 gives the key influence factors considered in parametric studies.
3.1 Effect of PHA
Figure 4A shows the effect of PHA on the distribution of EPWP in the silty sand interlayer after the Kobe input motion. It can be seen that when PHA = 0.3g, the EPWP ratio in the entire silt interlayer was less than unity, indicating that liquefaction did not occur. Note that the EPWP ratio was defined as the ratio of EPWP to the initial effective vertical stress. Additionally, the peak value of the EPWP ratio in the silty sand interlayer also increased as the PHA increases. Particularly, when PHA = 0.4g, the EPWP ratio at the top of the silty sand interlayer reached unity, indicating that liquefaction has occurred (see Figure 4B). Moreover, when PHA increases from 0.4 g to 0.5 g, the liquefaction depth increased by approximately 7.4% in the silty sand interlayer.
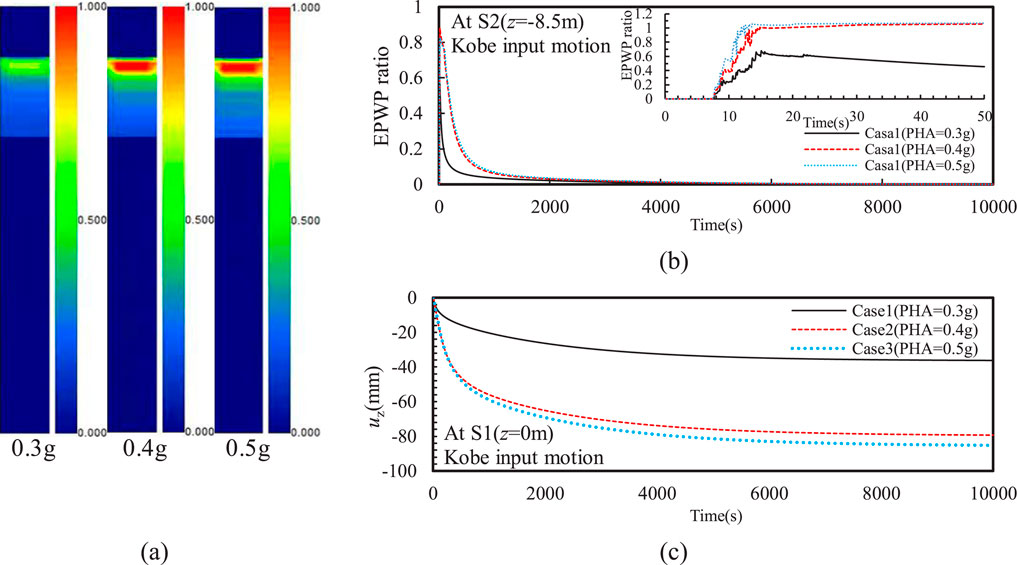
Figure 4. Effect of PHA on the (A) distribution of EPWP ratio after earthquake, (B) time history of EPWP ratio (C) and vertical displacement (uz).
A consolidation analysis was performed on the liquefiable site after earthquake, showing that the EPWP ratio decreased gradually with the time due to pore pressure dissipation under various PHAs (see Figure 4B). In the consolidation phase, the dissipation of EPWP relies on the magnitude of the EPWP following the earthquake; therefore, the settlement during this phase is mainly affected by the residual EPWP. The results indicate that the EPWP in the silty sand interlayer can completely dissipate after 10,000 s. Furthermore, PHA significantly affected the dissipation rate of the EPWP. In the case that liquefaction did not occur (PHA = 0.3 g), the EPWP ratio dropped to around 0.1 after approximately 212 s. In contrast, the EPWP ratio took about 667 s to decrease to 0.1 when liquefaction occurred. Additionally, the PHA did not significantly impact the pore pressure dissipation rate after the silty sand interlayer liquefied. Moreover, the ground settlement induced by the earthquake increases with the peak ground motion (see Figure 4C). When the liquefaction did not occur at silty sand interlayer (PHA = 0.3 g), the maximum ground settlement was about 36.2 mm. However, the ground settlement increased by 119% at PHA = 0.4g and 135% at PHA = 0.5g, indicating that the EPWP associated to the liquefaction greatly affected the ground settlement. Thus, the residual EPWP, particularly after seismic events, can result in prolonged settlement due to the slow dissipation of excess pressures. This may lead to ongoing ground subsidence long after the earthquake, which poses a risk to long-term stability of underground structures.
Figure 5 shows the effect of PHA on the acceleration time histories and Fourier amplitude at typical points, including S1, S2, and S3 representing the point at the ground surface, the top and bottom of the silty sand interlayer, respectively. Overall, the peak horizontal acceleration at the top of the silty sand interlayer was greater than that at the bottom, indicating that even though the EPWP in the silty sand interlayer developed during the earthquake, the peak horizontal acceleration was still significantly amplified for various PHAs. As the PHA increased, the ratio of the peak horizontal acceleration at the top of the silty sand interlayer to that at the ground surface gradually increased. Especially, the peak horizontal acceleration at the top of the silty sand interlayer was much greater that that at the ground surface when PHA = 0.5 g. This is primarily because the silty sand interlayer exhibited significant cyclic mobility after liquefaction, which in turn leads to larger peak horizontal acceleration at this point. Moreover, the acceleration at the top of the silty sand interlayer becomes very small after liquefaction, at 14.7 s when PHA = 0.4 g and after 14.1 s at PHA = 0.5 g.
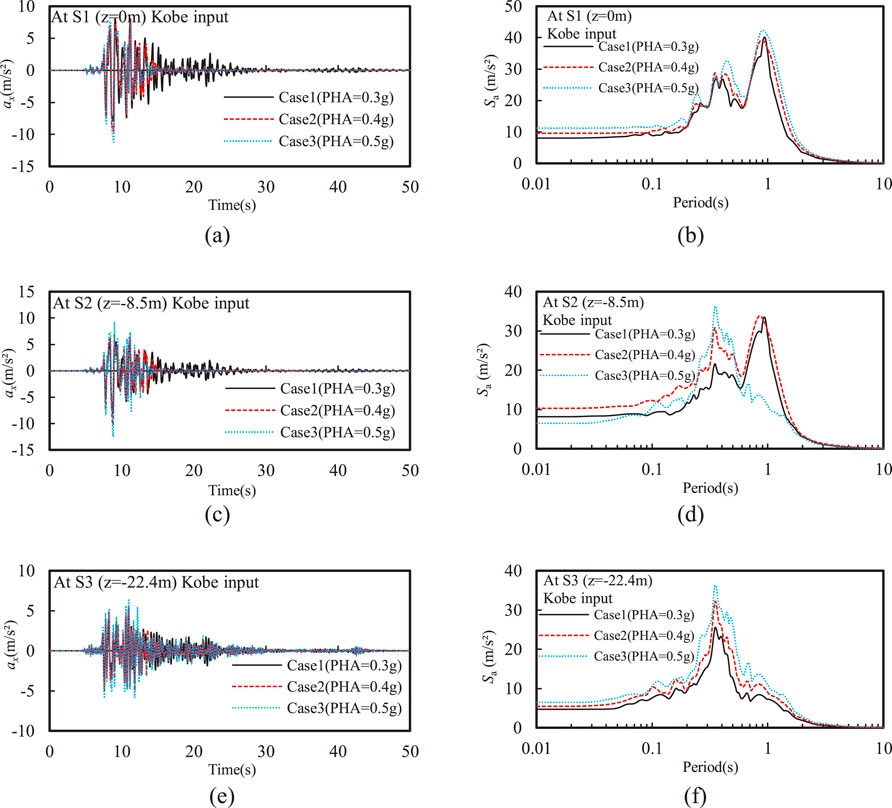
Figure 5. Effect of PHA on the time history of horizontal acceleration and spectral acceleration at different depths: (A) ax and (B) Sa at z = 0 m; (C) ax and (D) Sa at z = −8.5 m; (E) ax and (F) Sa at z = −22.4 m.
Figure 5 further illustrates that the spectral acceleration peak generally increased as PHA increased. Notably, the spectral acceleration the top of the silty sand interlayer and the ground surface exhibited largest spikes centered around a 1-s period, indicating that the rise in EPWP decreases high-frequency components of seismic input motions while amplifying the low-frequency components. The Fourier amplitude also shows the largest spike at 1 Hz, and the Fourier amplitudes surrounding this spike gradually increased as the PHA increased (see Figure 6).
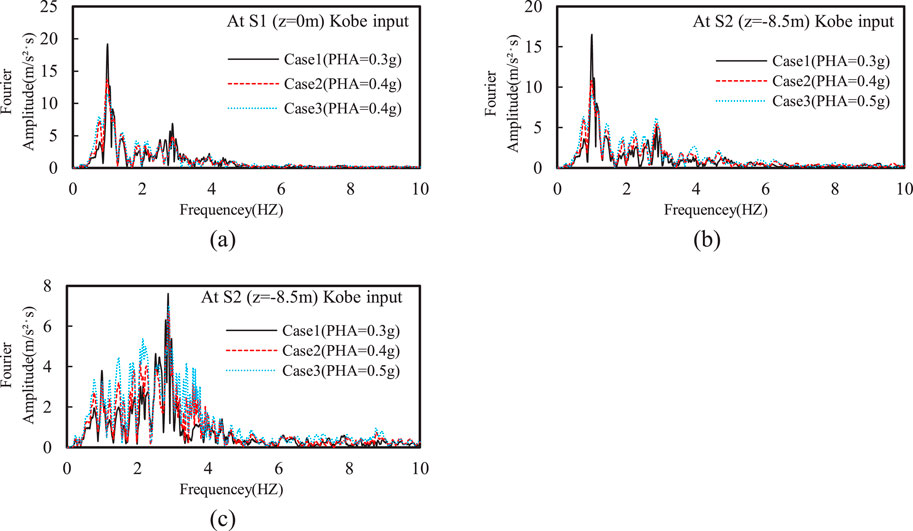
Figure 6. Effect of PHA on Fourier amplitude of horizontal acceleration at different depths: (A) z = 0 m; (B) z = −8.5 m; (C) z = −22.4 m.
It is concluded that the increase in PHA results in a rise in EPWP within the silty sand interlayer, an increase in ground surface settlement, and a significant acceleration amplification at the top of the silty sand interlayer. These results demonstrate that PHA significantly impacts dynamic responses of ground containing liquefiable interlayers, and the presence of liquefiable interlayers may amplify the propagation effect of seismic input motions, resulting in more intense responses at the ground surface and in structures. These findings are important for understanding seismic liquefaction phenomena, assessing earthquake risks, and designing seismic mitigation measures in the case of the ground containing liquefiable interlayer.
3.2 Effect of input motion frequency
Figure 7 shows that liquefaction occurred in the silty sand interlayer under different input motions with identical PHA of 0.5 g. Moreover, the liquefaction depth was significantly greater under Nahanni and Liuan input motions compared to that under Kobe input motion. This is because the former two motions have richer low-frequency components; as shown in Figure 3, the Fourier amplitude within 1 Hz for these two motions is significantly greater than that of the latter. Additionally, the liquefaction depth caused by the Nahanni input motion was about 9.1% greater than that under the Liuan input motion. This was mainly due to the richer high-frequency components of the Nahanni motion, which can generate higher oscillatory EPWP in deeper soil layers. However, the Liuan input motion, which is rich in lower frequencies, resulted in higher residual EPWP in the silty sand interlayer. This further caused the slowest dissipation rate of EPWP at the top of the silty sand interlayer and the greatest ground settlement at the consolidation stage. Moreover, the maximum ground settlement under the Kobe input motion is only about 29.9% of that under Liuan input motion, primarily because the overall EPWP was lowest in the silty sand interlayer under Kobe input motion.
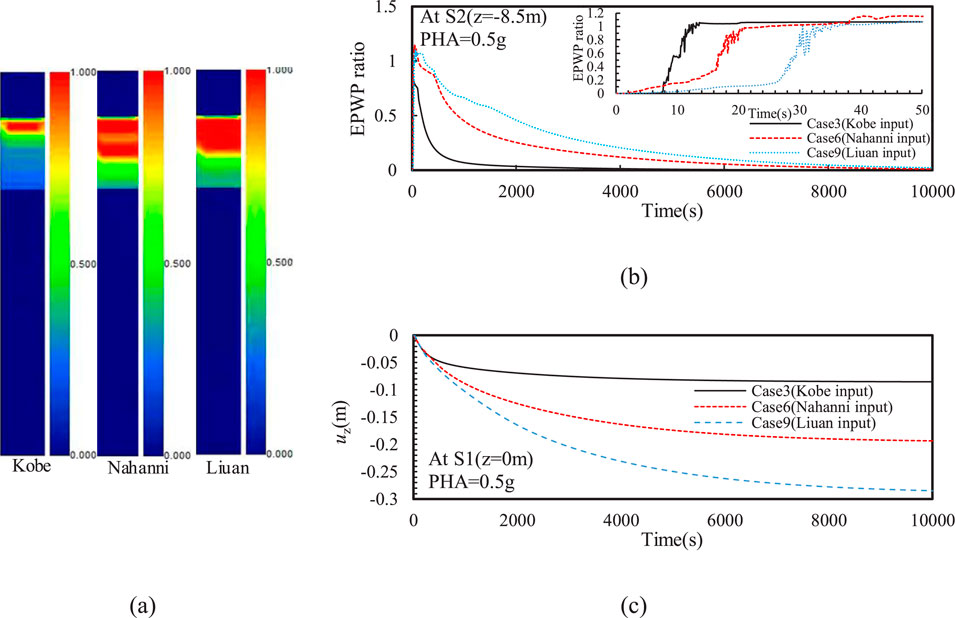
Figure 7. Effect of input motion frequency on the (A) distribution of EPWP ratio after earthquake, (B) time history of EPWP ratio (C) and vertical displacement (uz)
Figure 8 shows that the frequency content of input motions had a minimal impact on the peak horizontal acceleration at the bottom of the silty sand interlayer. However, the peak horizontal accelerations at the ground surface and the top of the silty sand interlayer under Kobe input motion were significantly higher than those under Nahanni and Liuan input motions. This is mainly because the liquefaction of the silty sand interlayer occurred after the peak of Kobe input motions, but the liquefaction occurred before the peak of Nahanni and Liuan ground motions. Moreover, a new spike with a period of approximately 1 s was observed at the top of the silty sand interlayer compared to that at the bottom of the silty sand interlayer (see Figures 8D–F). This reflects a common seismic response characteristic induced by the rise in EPWP within the silty sand interlayer. Moreover, a spike was observed at around 3 s in the spectral acceleration at both top and bottom of the silty sand interlayer, and the spectral acceleration with T > 2 s is not affected by the generation of EPWP in the silty sand interlayer.
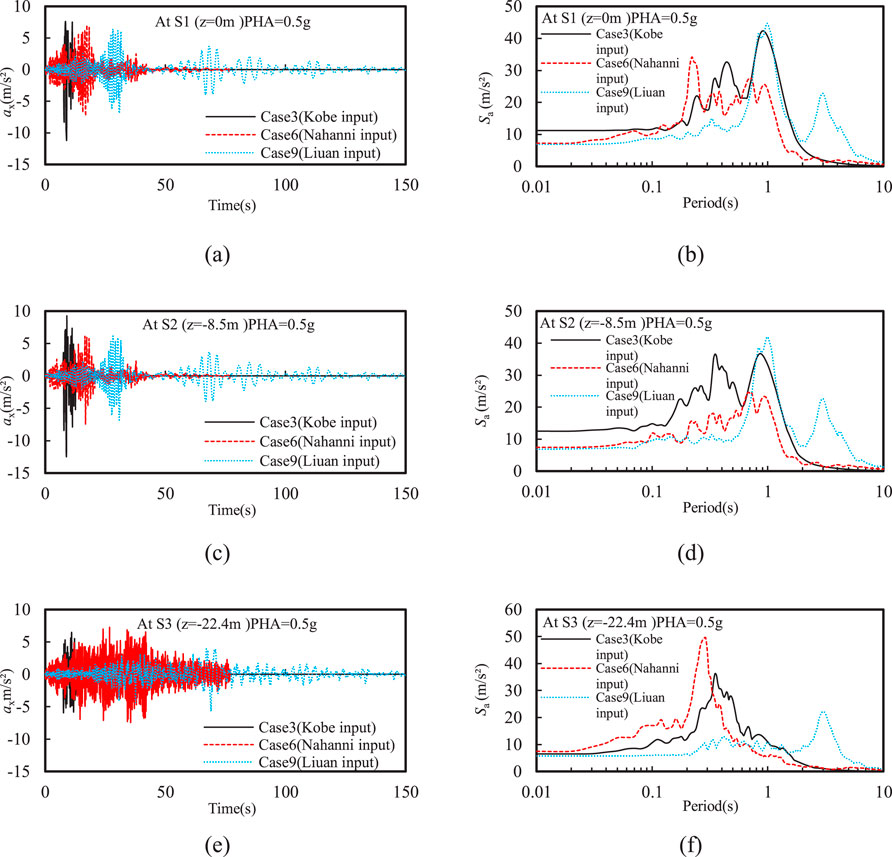
Figure 8. Effect of input motion frequency on the time history of horizontal acceleration and spectral acceleration at different depths: (A) ax and (B) Sa at z = 0 m; (C) ax and (D) Sa at z = −8.5 m; (E) ax and (F) Sa at z = −22.4 m.
Figure 9 further shows that Fourier amplitude of the high-frequency components (i.e., frequency larger than 3 Hz) significantly decreased after the Nahanni input motion passed through the silty sand interlayer. In contrast, there was a notable increase in the amplitude around 1 Hz at the top of the silty sand interlayer, which corresponds to the peak spectral acceleration observed at T = 1 s.
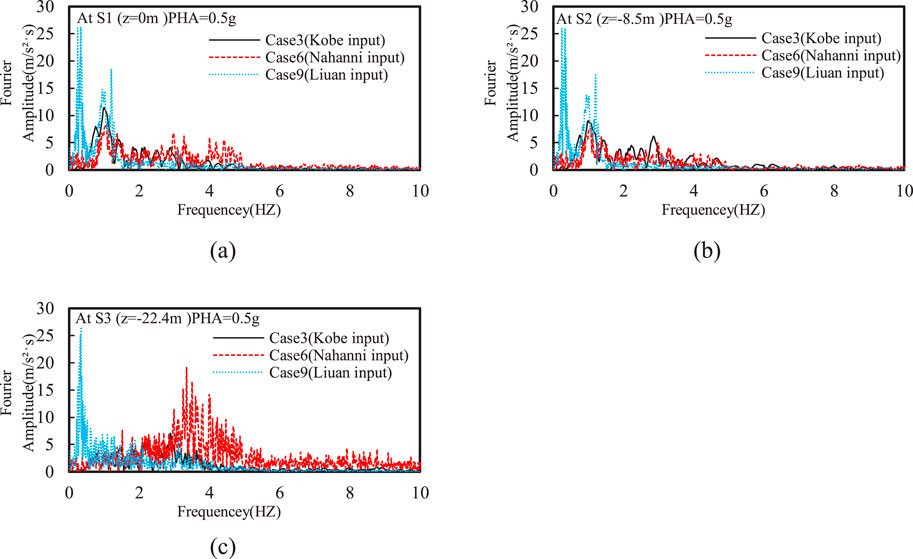
Figure 9. Effect of input motion frequency on Fourier amplitude of horizontal acceleration at different depths: (A) z = 0 m; (B) z = −8.5 m; (C) z = −22.4 m.
3.3 Effect of PVA
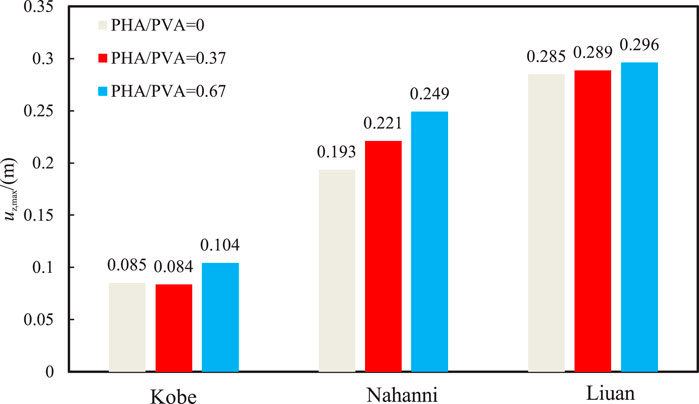
Figure 10A shows the effect of PVA on the distribution of EPWP ratio after earthquake. In this comparison, the PVA/PHA varies from 0 to 0.67. It can be observed that the liquefaction depth increased as PVA increased. This is because the increase in PVA resulted in higher EPWP within the silty sand interlayer, especially causing significant oscillations of EPWP (see Figure 10B), which is consistent with results reported in the existing literature (Xu et al., 2021b). Additionally, the lowest dissipation rate of EPWP was observed at PVA/PHA = 0.67, further indicating that higher PVA induces greater residual EPWP in the silty sand interlayer. The numerical results also confirms that the ground settlement increased with increasing PVA, as also reported by Tsaparli et al. (2016). This study further investigated the impact of input motion frequency on the maximum ground settlement under both horizontal and vertical input motions. As the PVA/PHA increased from 0 to 0.67, the maximum ground settlement under Nahanni input motion increased by 28%, followed by 22% under Kobe input motion, and 4% under Liuan input motion (see Figure 10C). This indicates that the vertical seismic component in near-field earthquakes has much more significant effect on the ground settlement in liquefiable sites than that in far-field earthquakes. Thus, the adverse effect of vertical seismic motion with combination of the input motion frequency should be carefully considered in practical engineering. As shown in Figure 12, the vertical seismic motion had minimal effect on the horizontal seismic response of liquefiable sites, including the acceleration time history and spectral acceleration. A new spike with a period of approximately 1 s was observed at the top of the silty sand interlayer compared to that at the bottom of the silty sand interlayer, reflecting a common seismic response characteristic induced by the rise in EPWP within the silty sand interlayer. Moreover, a spike was observed at around 3 s in the spectral acceleration at both top and bottom of the silty sand interlayer, and the spectral acceleration with T > 2 s is not affected by the generation of EPWP in the silty sand interlayer.
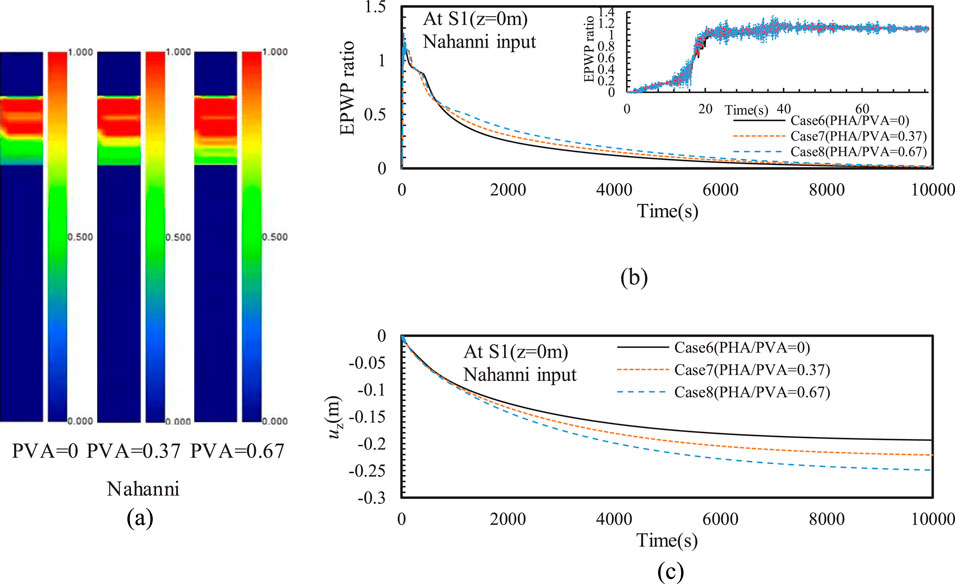
Figure 10. Effect of PVA on the (A) distribution of EPWP ratio after earthquake, (B) time history of EPWP ratio (C) and vertical displacement (uz).
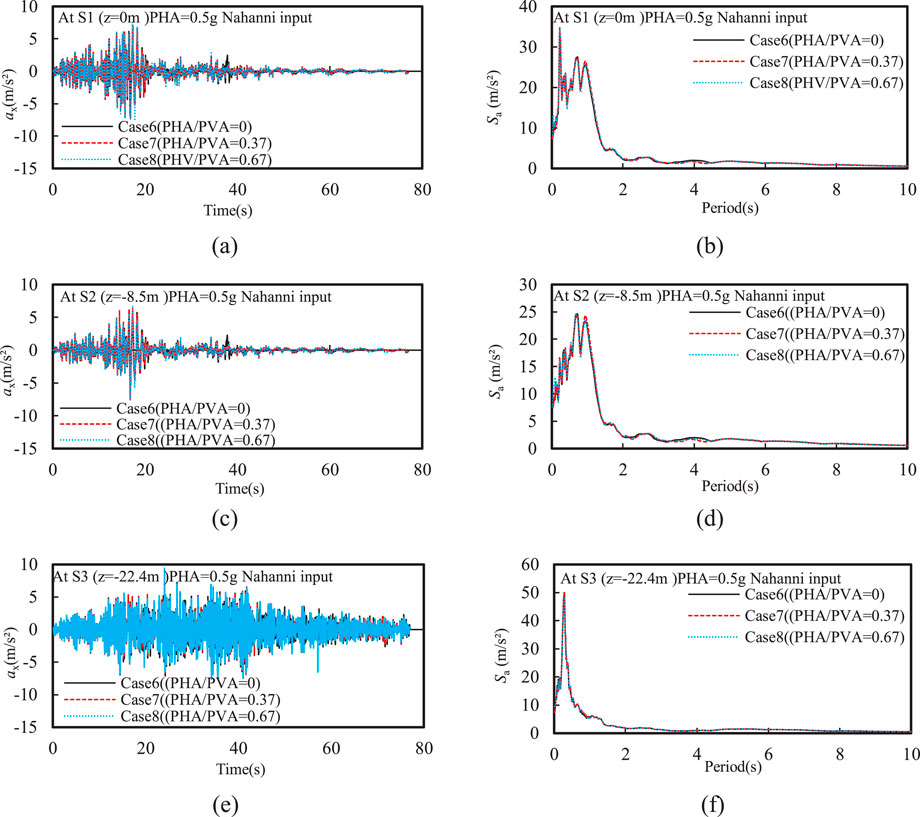
Figure 12. Effect of PVA on the time history of horizontal acceleration and spectral acceleration at different depths: (A) ax and (B) Sa at z = 0 m; (C) ax and (D) Sa at z = −8.5 m; (E) ax and (F) Sa at z = −22.4.
In summary, the interaction between vertical and horizontal ground motions can significantly affect the seismic response of liquefiable soils. In our study, the vertical ground motion influences the generation of excess pore water pressure, while the horizontal motion contributes to shearing and displacement of the soil layers. The interaction is particularly important in near-field seismic events where vertical acceleration can amplify the liquefaction potential. Moreover, we recommend that engineers consider both horizontal and vertical seismic components when designing foundations for structures in liquefiable areas. In particular, structures in regions with rich low-frequency seismic input, such as near-field earthquake zones, should be designed to accommodate increased ground settlement and the potential for deeper liquefaction. Additionally, the use of ground improvement techniques, such as soil compaction or drainage systems, may be necessary to reduce the risk of long-term settlement.
4 Conclusion
A typical borehole with a liquefiable interlayer in the Yangtze River Delta Plain region of China was thoroughly and numerically investigated in this study, the following conclusions were obtained.
• The increase in PHA leads to a rise in EPWP within the silty sand interlayer, an increase in ground settlement, and a significant acceleration amplification at the top of the silty sand interlayer. The acceleration at the ground surface becomes very small after liquefaction of the silty sand interlayer.
• The liquefaction depth was significantly greater under Nahanni and Liuan input motions compared to that under Kobe input motion. This is because the former two motions have richer low-frequency components.
• The Liuan input motion, which is rich in lower frequencies, resulted in higher residual EPWP in the silty sand interlayer. This further caused the slowest dissipation rate of EPWP at the top of the silty sand interlayer and the greatest ground settlement at the consolidation stage.
• The ground settlement generally increased with increasing PVA. As the PVA/PHA increased from 0 to 0.67, the maximum ground settlement under Nahanni input motion increased by 28%, followed by 22% under Kobe input motion, and 4% under Liuan input motion. This indicates that the vertical seismic component in near-field earthquakes has much more significant effect on the ground settlement in liquefiable sites than that in far-field earthquakes.
The findings are particularly relevant for sites with similar soil compositions, such as those with liquefiable interlayers. However, the methodology, including the fully coupled dynamic analysis and the use of generalized plasticity models, can be applied to other regions with different soil conditions by recalibrating the model parameters based on local soil characteristics.
Data availability statement
The raw data supporting the conclusions of this article will be made available by the authors, without undue reservation.
Author contributions
X-BP: Conceptualization, Funding acquisition, Writing–original draft. YG: Software, Writing–original draft. Y-YX: Data curation, Writing–original draft. X-ST: Methodology, Writing–review and editing. L-YX: Funding acquisition, Methodology, Writing–original draft.
Funding
The author(s) declare that financial support was received for the research, authorship, and/or publication of this article. This work was supported by Jiangsu Earthquake Administration Scenario Earthquake Construction and Application Innovation Team (Grant No. 2022-03) and the National Natural Science Foundation of China (Grant No. 52378345).
Conflict of interest
The authors declare that the research was conducted in the absence of any commercial or financial relationships that could be construed as a potential conflict of interest.
Publisher’s note
All claims expressed in this article are solely those of the authors and do not necessarily represent those of their affiliated organizations, or those of the publisher, the editors and the reviewers. Any product that may be evaluated in this article, or claim that may be made by its manufacturer, is not guaranteed or endorsed by the publisher.
References
Adampira, M., and Derakhshandi, M. (2020). Influence of a layered liquefiable soil on seismic site response using physical modeling and numerical simulation. Eng. Geol. 266, 105462. doi:10.1016/j.enggeo.2019.105462
American Society of Civil Engineers (2017). Minimum design loads and associated criteria for buildings and other structures. Am. Soc. Civ. Eng. doi:10.1061/9780784414248
Amoly, R. S., Ishihara, K., and Bilsel, H. (2016). The relation between liquefaction resistance and shear wave velocity for new and old deposits. Soils Found. 56 (3), 506–519. doi:10.1016/j.sandf.2016.04.016
Andrus, R. D., and Stokoe, K. H. (2000). Liquefaction resistance of soils from shear-wave velocity. J. geotechnical geoenvironmental Eng. 126 (11), 1015–1025. doi:10.1061/(asce)1090-0241(2000)126:11(1015)
Astm, A. (2015). D4015–15: standard test methods for modulus and damping of soils by fixed-base resonant column devices. West Conshohocken: ASTM international.
Biot, M. A. (1956). Theory of propagation of elastic waves in a fluid-saturated porous solid. II. Higher frequency range. J. Acoust. Soc. Am. 28 (2), 179–191. doi:10.1121/1.1908241
Cai, F., Hagiwara, T., Imamura, S., and Ugai, K. (2002). “2D Fully coupled liquefaction analysis of sand ground under tank,” in Proceedings of the 11th Japan earthquake engineering symposium, 819–824. doi:10.1093/treephys/22.12.819
Chen, W. Y., Wang, Z. H., Chen, G. X., Jeng, D. S., Wu, M., and Zhao, H. Y. (2018). Effect of vertical seismic motion on the dynamic response and instantaneous liquefaction in a two-layer porous seabed. Comput. Geotechnics 99, 165–176. doi:10.1016/j.compgeo.2018.03.005
Cubrinovski, M., Rhodes, A., Ntritsos, N., and Van Ballegooy, S. (2019). System response of liquefiable deposits. Soil Dyn. Earthq. Eng. 124, 212–229. doi:10.1016/j.soildyn.2018.05.013
Ecemis, N. (2021). Experimental and numerical modeling on the liquefaction potential and ground settlement of silt-interlayered stratified sands. Soil Dyn. Earthq. Eng. 144, 106691. doi:10.1016/j.soildyn.2021.106691
Fan, H. F., Wang, Y. Z., Chen, G. X., Chen, W. Y., Zhao, K., and Zhu, S. D. (2023). Nonlinear seismic response analysis of layered seabed considering seawater-seabed coupling effects. Front. Mar. Sci. 10, 1270721. doi:10.3389/fmars.2023.1270721
Forum 8 Co Ltd (2005). “Finite element fully coupled dynamic effective stress analysis program (UWLC),” in Electrical manual 2005. Product Info: dynamic effective stress analysis for ground(UWLC). forum8.co.jp).
GB 50011-2010 (2016). Code for seismic Design of buildings. Beijing: China Architecture and Building Press.
Jia, M. C., and Wang, B. Y. (2013). Liquefaction testing of stratified sands interlayered with silt. Appl. Mech. Mater. 256, 116–119. doi:10.4028/www.scientific.net/amm.256-259.116
Pastor, M., Zienkiewicz, O. C., and Chan, A. (1990). Generalized plasticity and the modelling of soil behaviour. Int. J. Numer. Anal. Methods Geomech. 14 (3), 151–190. doi:10.1002/nag.1610140302
Shen, Y., Zhong, Z., Li, L., Du, X., and El Naggar, M. H. (2022). Seismic response of shield tunnel structure embedded in soil deposit with liquefiable interlayer. Comput. Geotechnics 152, 105015. doi:10.1016/j.compgeo.2022.105015
Song, C. X., Tang, X. W., Zhang, C. P., and Wang, K. (2024). Investigating the influence of an approach bridge on a pile-supported wharf at a liquefiable site under horizontal and vertical seismic excitations. Soil Dyn. Earthq. Eng. 185, 108872. doi:10.1016/j.soildyn.2024.108872
Sui, T., Yang, M., Peng, L., Chen, J., Zhang, C., and Zheng, J. (2024). Wave-induced residual response and liquefaction of a nonhomogeneous layered seabed. Front. Mar. Sci. 11, 1360641. doi:10.3389/fmars.2024.1360641
Sun, R., and Yuan, X. M. (2004). Effect of soil liquefaction on response spectrum of surface acceleration. World Earthq. Eng. 20 (3), 33–38.
Sun, R., Zhao, Q., and Yuan, X. (2014). Comparison between acceleration response spectra on liquefaction and non-liquefaction sites. Rock Soil Mech. 35, 299–305. doi:10.16285/j.rsm.2014.s1.021
Tsai, C. C., and Liu, H. W. (2017). Site response analysis of vertical ground motion in consideration of soil nonlinearity. Soil Dyn. Earthq. Eng. 102, 124–136. doi:10.1016/j.soildyn.2017.08.024
Tsaparli, V., Kontoe, S., Taborda, D. M., and Potts, D. M. (2016). Vertical ground motion and its effects on liquefaction resistance of fully saturated sand deposits. Proc. R. Soc. A Math. Phys. Eng. Sci. 472 (2192), 20160434. doi:10.1098/rspa.2016.0434
Wakai, A., and Ugai, K. (2004). A simple constitutive model for the seismic analysis of slopes and its applications. Soils found. 44 (4), 83–97
Xiu, Z., Wang, S., Ji, Y., Wang, F., and Ren, F. (2020). Experimental investigation on liquefaction and post-liquefaction deformation of stratified saturated sand under cyclic loading. Bull. Eng. Geol. Environ. 79, 2313–2324. doi:10.1007/s10064-019-01696-8
Xu, L. Y., Cai, F., Wang, G. X., Ugai, K., Wakai, A., Yang, Q. Q., et al. (2013). Numerical assessment of liquefaction mitigation effects on residential houses: case histories of the 2007 Niigata Chuetsu-offshore earthquake. Soil dynam. Earthq. Eng. 53, 196–209. doi:10.1016/j.soildyn.2013.07.008
Xu, L. Y., Cai, F., Zhang, J. Z., Pan, D. D., Wu, Q., and Chen, G. X. (2021b). Evaluation of grain size and content of nonplastic fines on undrained behavior of sandy soils. Mar. Georesources and Geotechnol. 39 (10), 1215–1229. doi:10.1080/1064119X.2020.1821847
Xu, L. Y., Chen, W. Y., Cai, F., Song, Z., Pan, J. M., and Chen, G. X. (2023). Response of soil–pile–superstructure–quay wall system to lateral displacement under horizontal and vertical earthquake excitations. Bull. Earthq. Eng. 21 (2), 1173–1202. doi:10.1007/s10518-022-01572-z
Xu, L. Y., Song, C. X., Chen, W. Y., Cai, F., Li, Y. Y., and Chen, G. X. (2021a). Liquefaction-induced settlement of the pile group under vertical and horizontal ground motions. Soil Dyn. Earthq. Eng. 144, 106709. doi:10.1016/j.soildyn.2021.106709
Xu, L. Y., Zhang, J. Z., Cai, F., Chen, W. Y., and Xue, Y. Y. (2019). Constitutive modeling the undrained behaviors of sands with non-plastic fines under monotonic and cyclic loading. Soil dynam. Earthq. Eng. 123, 413–424. doi:10.1016/j.soildyn.2019.05.021
Xue, Y. Y., Wang, X. G., and Cai, F. (2023). Effect of inclined pile on seismic response of bridge abutments undergoing liquefaction—induced lateral displacement: case study of Nishikawa bridge in the 2011 Great East Japan earthquake. Front. Mater. 10, 1185210. doi:10.3389/fmats.2023.1185210
Yang, J., Sato, T., Savidis, S., and Li, X. S. (2002). Horizontal and vertical components of earthquake ground motions at liquefiable sites. Soil Dyn. Earthq. Eng. 22 (3), 229–240. doi:10.1016/S0267-7261(02)00010-6
Yao, J., and Lin, Y. (2023). Influence analysis of liquefiable interlayer on seismic response of underground station structure. Appl. Sci. 13 (16), 9210. doi:10.3390/app13169210
Youd, T. L., and Carter, B. L. (2005). Influence of soil softening and liquefaction on spectral acceleration. J. Geotechnical Geoenvironmental Eng. 131 (7), 811–825. doi:10.1061/(ASCE)1090-0241(2005)131:7(811)
Zienkiewic, Z. O. C., Chan, A. H. C., Pastor, M., Schrefler, B. A., and Shiomi, T. (1999). Computational geotechnics with special reference to earthquake engineering. Sussex, United Kingdom: John Wiley & Sons Ltd.
Zienkiewicz, O. C., Chan, A. H. C., Pastor, M., Schreffer, B. A., and Shiomi, T. (1999). Computational geomechanics with special reference to earthquake engineering. Chichester, England: Wiley
Keywords: biot theory, liquefaction, nonlinear constitutive model, resonant column tests, spectral acceleration
Citation: Peng X-B, Gao Y, Xue Y-Y, Tao X-S and Xu L-Y (2024) Dynamic effective stress analysis of a site with liquefiable interlayer: considering vertical and horizontal ground motion. Front. Earth Sci. 12:1489096. doi: 10.3389/feart.2024.1489096
Received: 03 September 2024; Accepted: 07 November 2024;
Published: 22 November 2024.
Edited by:
Wentao Yang, University of Leeds, United KingdomReviewed by:
Nurhan Ecemis, Izmir Institute of Technology, TürkiyeLongwei Chen, Institute of Engineering Mechanics, China Earthquake Administration, China
Jinhang Liang, Beijing Forestry University, China
Copyright © 2024 Peng, Gao, Xue, Tao and Xu. This is an open-access article distributed under the terms of the Creative Commons Attribution License (CC BY). The use, distribution or reproduction in other forums is permitted, provided the original author(s) and the copyright owner(s) are credited and that the original publication in this journal is cited, in accordance with accepted academic practice. No use, distribution or reproduction is permitted which does not comply with these terms.
*Correspondence: Xiao-Bo Peng, eGlhb2JvX3BlbmdAMTYzLmNvbQ==; Ling-Yu Xu, bHl4dUBuanRlY2guZWR1LmNu
 Xiao-Bo Peng
 Yuan Gao
 Ying-Ying Xue
 Xiao-San Tao1