 Simona Gabrielli
 Aybige Akinci
 Edoardo Del Pezzo
- 1Sezione Roma 1, Istituto Nazionale di Geofisica e Vulcanologia, Rome, Italy
- 2Osservatorio Vesuviano, Istituto Nazionale di Geofisica e Vulcanologia, Napoli, Italy
- 3Istituto Andaluz de Geofisica, Universidad de Granada, Granada, Spain
The central Apennines are notoriously subject to important seismic sequences, such as the 2009 and 2016–2017, L’Aquila, Amatrice-Visso-Norcia (AVN) sequences, respectively. Here, we examine the temporal and spatial variation of the S-wave attenuation in Central Italy over a period from 2011 to 2017, including the AVN sequence. First, we computed the S-wave attenuation (Qβ) as a function of frequency Q(f) using the coda normalization method. Then, to visualize the spatial variation of the attenuation over time, we calculated the attenuation of coda waves using a novel 2D kernel-based function over the study area. Our results showed a 13% variation in S-wave attenuation between the pre-sequence (2011–2016) and the sequence phase, with a significant 37% decrease in Q (increase in attenuation) detected during the Visso period. Spatially, a high attenuation anomaly aligns with the Monti Sibillini thrust formation, while in time, we observed a northward migration of this high attenuation during the Norcia phase. Temporal variation in the crustal S-wave attenuation and its frequency dependence may be linked to fluid movement and fracturing developed during the AVN sequence. Coda-Q mapping confirmed an increase in attenuation during the sequence within the fault plane zones. Additionally, the broader area of interest reveals a northward extension of high attenuation, following the NS direction of the Monti Sibillini thrust.
1 Introduction
Seismic waves experience energy loss as they propagate through the Earth’s crust (Sato et al., 2012). This loss of energy, known as seismic attenuation, leads to a reduction in the amplitude of waves over both space and time, and its comprehension is crucial for modeling the propagation of seismic waves at different scales (Cormier, 2011; Muller et al., 2010; Sato et al., 2012). The total quality factor Q measures the overall anelastic attenuation, quantifying the fractional energy loss per cycle and influencing how the energy density spectrum decays over time from the earthquake’s origin (Cormier, 2011):
where, in Equation 1,
Q values have been used to investigate fluid storage and waveforms propagation in subduction zones (Schurr et al., 2003), volcanic areas (Prudencio et al., 2015a; Prudencio et al., 2015b), and fault settings (Sketsiou et al., 2021; Talone et al., 2023). However, it is crucial to quantify both the attenuation of seismic waves and their frequency dependence to predict earthquake-induced ground motions in the area accurately. This characterization is essential for assessing seismic hazards effectively. Estimating the frequency dependence is particularly important for engineering purposes, as buildings respond differently at various frequencies.
One of the most used methods in measuring seismic wave attenuation is the t* method (Romanowicz, 1998; Lanza et al., 2020), which quantifies cumulative attenuation along the ray path. The t* method is applicable in scenarios with heterogeneity variations; however, it does not allow the reconstruction of frequency-dependent structures properly.
Another commonly used method for measuring the crustal attenuation of body waves is the coda normalization method, introduced by Aki and Chouet (1975). The technique involves normalizing the amplitudes of the direct S waves using the coda amplitude measured at a fixed time tc. This approach effectively removes effects from the site, source, and instruments, providing a clearer measure of attenuation. However, radiation pattern effects cannot be removed when using the full dataset with mixed fault plane solutions.
The coda normalization method has become widely adopted for quantifying (Akinci and Eyidogan, 1996; Sedaghati and Pezeshk, 2016) and characterizing (in 3D, e.g., Prudencio et al., 2015a; Prudencio et al., 2015b; Sketsiou et al., 2021; Talone et al., 2023) average attenuation properties within the crust. This method is valuable as seismic attenuation measurements can provide important insights into crustal properties and structure, including features such as fractures and fluids. Studying this parameter in active tectonic zones can be valuable for several reasons. It allows for comparison with geological interpretations from other techniques, such as velocity tomography, and contributes to seismic hazard and source evaluations. Additionally, it provides critical input for seismic wave propagation modeling and ground motion simulations (Pischiutta et al., 2021; Akinci et al., 2022). Therefore, applying the coda normalization method in regions like the Central Apennines can be particularly useful for earthquake hazard assessment. Through coda normalization, we can obtain a quality factor that is frequency-dependent and defined by a power-law equation at specific frequencies:
where, in Equation 2, Q0 is the quality factor Q at f0=1 Hz, f is the frequency, and n is a constant, which is the exponent that indicates how the quality factor varies with the frequency (and so its frequency dependence) (Sato et al., 2012).
Other researchers have performed attenuation studies in the Central Apennines using various methodologies and different seismic sequences. Table 1 summarizes the findings from some of these studies.
Akinci et al. (2022) utilized a regression model through the random vibration theory (RVT) to determine Q(f). Their findings (Table 1) reveal that seismic attenuation was significantly impacted by the primary events of the Amatrice-Visso-Norcia sequence during the year-long period between 2016 and 2017. The Q-factor exhibited significant variations, with Q₀ values ranging from 55 during the Visso phase to 115 during the Amatrice phase, demonstrating its frequency-dependent nature. Specifically, the lower Q₀ value of 55 is associated with a high-frequency dependence (n = 0.8), while the higher Q₀ value of 115 corresponds to a lower frequency dependence (n = 0.45). Despite these differences, the attenuation parameter Q(f) remained relatively consistent across the spectrum. These small fluctuations in Q(f) have minimal impact on ground motions and seismic hazard, likely reflecting the inherent randomness of natural processes. However, continuous monitoring of these variations could provide valuable insights for identifying potential precursory signals of seismic activity. Morasca et al. (2023) employed the non-parametric GIT approach (Generalized Inversion Technique) and found a high Q value of 247 but a lower n value of 0.38. Their spatial distribution of the residuals between the source-to-site quality factor (Qp) shows influence from the Monti Sibillini thrust system, consistent with findings from (Gabrielli et al., 2022; Gabrielli et al., 2023).
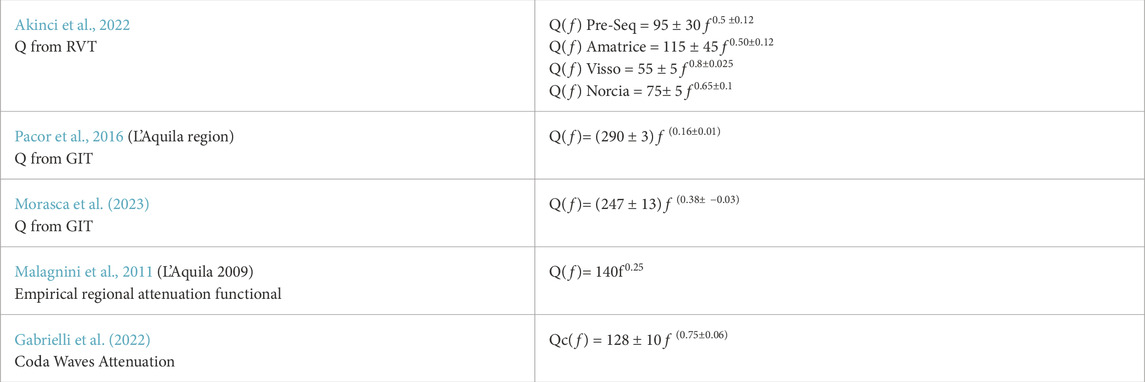
Table 1. Frequency dependence of attenuation of the area from other published studies.
For the L’Aquila 2009 seismic sequence in Central Italy, different attenuation values were reported by Malagnini et al. (2011), as Q(f)=140f0.25 and by Pacor et al. (2016), as Q(f)=290f0.16. The main difference between these studies is observed at low frequencies and at hypocentral distances greater than 20 km, where Pacor et al. (2016) found that seismic waves attenuate more rapidly.
The Central Apennines have been extensively studied with a focus on the different seismic sequences from recent decades, and only a few studies have specifically addressed seismic waves’ attenuation variation of those seismic events (Chiarabba et al., 2009; Gabrielli et al., 2022; Gabrielli et al., 2023; Talone et al., 2023). Although comprehensive studies on the spatial variation of attenuation across the entire Central Apennines region, including areas outside the mountain belt such as the Tyrrhenian and Adriatic coasts, are still lacking, Talone et al. (2023) conducted a 3D attenuation tomography in the Central-Southern Apennines. Their work revealed a high-attenuation volume aligned with the Apennine Chain, providing valuable insights for this specific area. Gabrielli et al. (2022), Gabrielli et al. (2023) focused on the north area of Talone et al.’s study, examining the 2016-2017 Amatrice-Visso-Norcia seismic sequence. Their research confirmed the presence and migration of fluids between mainshocks and noted variations in fracturing during the seismic activity.
Seismic wave attenuation is a crucial component of the ground motion prediction equation—the cornerstone of seismic hazard evaluation—and should be thoroughly examined to optimize ground motion models (GMMs). Boore et al. (2014) analyzed and adjusted anelastic attenuation for the NGA-West2 (Next-Generation Attenuation Relationships for Western US) model, starting from a constrained attenuation value and adapting it for regions with high attenuation, such as Italy and Japan, and low attenuation, like China. Kuehn et al. (2019) later applied a nonergodic approach to update the Californian GMPE model by replacing the anelastic attenuation with a regionally varying term, highlighting the importance of accounting for attenuation uncertainty in predictive modeling. Sgobba et al. (2021) investigated ground motion characteristics and attenuation properties in the Central Apennines, with a focus on their spatial and frequency-dependent variability. Using data from a dense seismic network, they analyzed observed ground motions and attenuation trends, comparing them with predictions from GMMs. They emphasized that the attenuation term, being regionally dependent, must be explicitly considered in the development of non-ergodic, region-specific GMMs, especially for short periods. Their findings demonstrated that even small variations in attenuation could significantly influence ground motion model sensitivity, underscoring the importance of accurately capturing these parameters. In this study, we expand on previous research (Gabrielli et al., 2022; Gabrielli et al., 2023) that investigated seismic scattering and absorption during the Central Italy seismic sequence of 2016-2017 (Amatrice-Visso-Norcia, AVN) and the pre-sequence period (2011–2016). Earlier work focused on calculating Qc (quality factor for coda waves) and peak delay to assess intrinsic and scattering absorption. The distinguishing feature of this study is the application of the coda-normalization method. This approach enables us to examine temporal variations in total attenuation (Qβ), providing a more detailed analysis of both frequency and spatial variability of seismic attenuation over a wider region compared to the one of (Gabrielli et al., 2022; Gabrielli et al., 2023). In particular, we focus on the relationship between Qβ (total attenuation, commonly used in seismic hazard and ground motion simulations) and Qc (attenuation derived from coda waves). By comparing these two metrics, we aim to reveal deeper insights that could enhance the accuracy of Ground Motion Prediction Models (GMMs) in the Central Apennines.
An additional innovative aspect of this study is the use of a new kernel function approach (Del Pezzo and Ibáñez, 2020; Castro-Melgar et al., 2021) to map Qc values. While kernel functions have traditionally been applied in volcanic settings, we have adapted this method for a tectonic environment, enabling more effective mapping of attenuation across the region. This technique provides a clearer understanding of the spatial distribution of attenuation.
Furthermore, by expanding the geographical coverage of the dataset, we improve our ability to analyze the spatial variation of seismic attenuation. Unlike previous studies focused on fluid movements during the seismic sequence, our broader coverage allows us to capture regional attenuation variability more effectively, offering a comprehensive view of how attenuation influences seismic hazard and ground motion simulations across the Central Apennines from 2011 to 2017.
In summary, this study introduces a new methodology for mapping seismic attenuation, expands the area of analysis, and aims to refine tools for seismic hazard assessment by incorporating Qβ into ground motion models, offering new insights into its spatial variability.
2 Geological and seismological background
The Central Apennines zone is characterized by an east-verging stack of thrust sheets involving the sedimentary successions of two main paleogeographic domains: the Umbria-Marche pelagic basin (Late Triassic to Late Miocene) and the Lazio-Abruzzi carbonate platform (Late Triassic to Miocene) (Cosentino et al., 2010). The area’s main tectonic structures are distributed with a principal N-S and NE-SW orientation and are the thrusts of the Monti Sibillini, the Gran Sasso, and the eastern Acquasanta system (Billi and Tiberti, 2009) (Figure 1A, red lines). The structural setting also includes high-angle normal faults resulting from Meso-Cenozoic and Quaternary tectonic phases (Buttinelli et al., 2021) (Figure 1A, black lines). Central Apennines has witnessed several seismic sequences in the last decades, as the 1997 Mw 6.0 of Umbria–Marche (Chiaraluce et al., 2004), the 2009 Mw 6.1 of L’Aquila (Valoroso et al., 2013), and the 2016-2017 AVN (Chiaraluce et al., 2017). The AVN sequence started on 24 August 2016, with the Mw6.0 of Amatrice, followed after 2 months by Visso (Mw 5.9, 26 October 2016) and Norcia (Mw 6.5, 30 October 2016). The AVN sequence developed on the NNW-SSE trending fault of the Central Apennines, and while it generally assessed the activity of normal faulting in the area (Chiaraluce et al., 2017; Brozzetti et al., 2019), the involvement of thrusts in the development of the seismic sequence is still under debate. The role of fluids and the thrust has been assessed by several studies regarding geology (Buttinelli et al., 2021), geochemistry (Chiodini et al., 2020), seismicity (Sugan et al., 2023), and its velocity changes (Chiarabba et al., 2018; Chiarabba et al., 2020; Soldati et al., 2019; Pastori et al., 2019; 2023; De Gori et al., 2023), and attenuation (Malagnini et al., 2022; Gabrielli et al., 2022; Gabrielli et al., 2023).
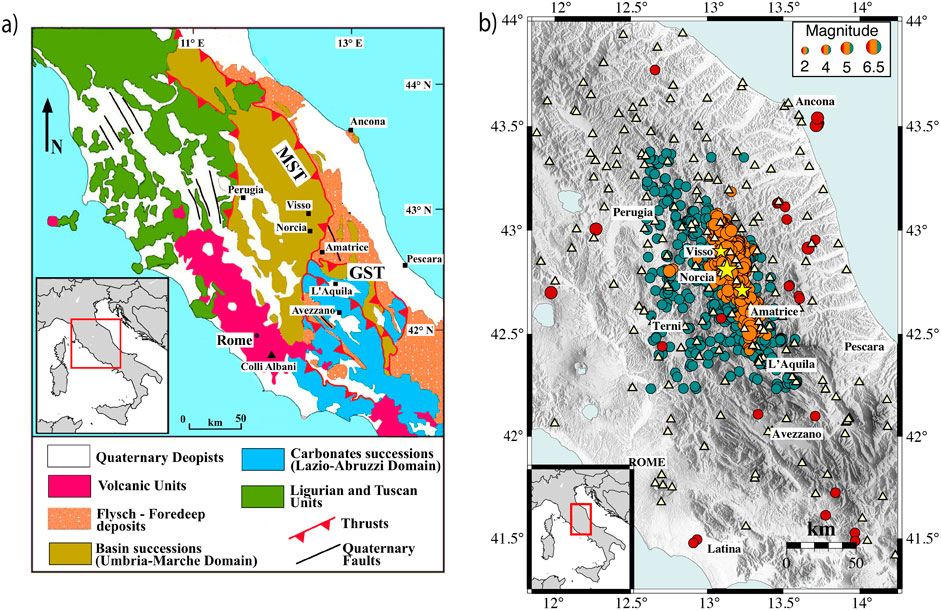
Figure 1. (A) Geological and Structural Map of the Central Apennines, modified after Vignaroli et al. (2020); MST and GST represent the Monti Sibillini and the Gran Sasso Thrusts, respectively. (B) Map showing the pre-sequence (green dots), the AVN seismic sequence (orange dots), and the stations (yellow triangles) used for the coda normalization and the Qc mapping. Yellow stars are the mainshock of Amatrice, Visso, and Norcia. The events added to this dataset respect to the Gabrielli et al. (2022) are represented with red dots.
3 Dataset
The dataset is composed of strong ground motion data registered by the accelerometric stations of the Italian strong motion network (RAN). Seismic stations (broadband weak motion) are part of the Digital Seismic Network run by the Istituto Nazionale di Geofisica e Vulcanologia (INGV). The weak- and strong-motion accelerograms were downloaded from the ITalian ACcelerometric Archive (ITACA) website, the European Integrated Data Archive (EIDA) repository, and the European Strong Motion (ESM) database. The strong ground motion network consists of a three-component Kinemetrics EpiSensor (FBA-3200 Hz) with a full-scale range of 1 or 2 g, in combination with ETNA 18 bits or K2-Makalu 24 bits digitizers. The seismograms are corrected for instrument response.
The waveforms collected for the AVN sequence span from the Amatrice mainshock on 24 August 2016, to 18 January 2017. Compared to the dataset used by Gabrielli et al. (2022); Gabrielli et al. (2023), we have included additional events located along the Adriatic coast (onshore and offshore) and the Tyrrhenian coast/west of the Central Apennines between 1 January 2011, and 1 January 2017. This expansion allowed us to incorporate stations located in coastal regions and the volcanic province of the Tyrrhenian area. The portion of the dataset covering 1 January 2011, to 24 August 2016 (before the first Amatrice mainshock) is referred to as the pre-sequence phase (Table 2). We selected earthquakes with depths of up to 20 km and hypocentral distances not exceeding 100 km for all the sequences. The lower depth limit was set to prevent the tail from being too close to the S-wave, thereby avoiding contamination by direct phases in the coda. The upper distance limit was chosen to avoid interactions with the Moho in this region (located at 35–40 km depth) and to maintain adequate source-station coverage while minimizing leakage effects.

Table 2. Time-periods of the datasets used in this work.
The geographic area considered spans from 10.45° to 15.25° longitude and from 41° to 44.1° latitude. All the seismograms were manually picked for the P- and S-wave arrivals. We excluded stations that recorded only a single waveform and discarded waveforms with P-wave travel times exceeding 35s to ensure propagation was confined within the crust. The selection process was based on signal-to-noise ratio (SNR), keeping only those waveforms with an SNR greater than 3. The SNR has been calculated for a 3 s time window before the P-wave arrival, as applied in other studies (Napolitano et al., 2020; Akinci et al., 2020; Gabrielli et al., 2022). We considered for the analysis the E component, following Gabrielli et al. (2022), where no extreme changes in attenuation behavior were found between the different components. The final dataset consists of approximately 7,400 waveforms for the pre-sequence, recorded at 62 seismic stations, and about 20,500 waveforms recorded at 174 seismic stations for the AVN sequence (Figure 1B).
To analyze variations in attenuation over time, we divided the sequence dataset into three sub-sequences based on the mainshocks (Table 2):
• Amatrice: 148 stations and 5,170 waveforms recorded between 24 August and 25 October 2016;
•Visso: 137 stations and 2,463 waveforms recorded between 26 October and 29 October 2016.
•Norcia: 153 stations and 5,485 waveforms recorded between 30 October 2016, and 18 January 2017
4 Methodology
In this study, we employed two distinct methodologies. The first method is the Coda Normalization Method (Section 4.1), which quantifies the total attenuation of the S-waves (Qβ). Using this technique, we aim to investigate the variation of Qβ and its frequency dependence over time. To assess spatial and temporal variations in attenuation, we calculated the coda wave attenuation (Qc−1) (Section 4.2) and applied an innovative regionalization technique based on kernel functions to map these variations effectively. By combining the pre-sequence and the sequence datasets, we examined the variation of Qc−1 from 2011 to 2017 across the entire Central Apennines. This analysis extends beyond the scope of previous studies by Gabrielli et al. (2022); Gabrielli et al. (2023) and provides a boarder perspective.
4.1 Coda normalization method
The Coda Normalization Method, introduced by Aki (1980), is a technique used to calculate the attenuation of the S-wave from waveforms recorded at multiple seismic stations. This method has been widely applied in both volcanic (De Siena et al., 2014; Castro-Melgar et al., 2021; Bala et al., 2024 and references therein) and tectonic zones (Sedaghti and Pezeshk, 2016; Sketsiou et al., 2021; Toker and Şahin, 2022; Talone et al., 2023, and references therein). Moreover, defining the attenuation characteristics of an area turns out to be fundamental in the seismic hazard assessment (Lombardi et al., 2005; Akinci et al., 2010). This method consists of the ratio between the direct S-wave amplitude and the amplitude of the coda waves, effectively removing the site, source intensity and instrumental effects. By using this technique, we can also retrieve the total quality factor and its frequency dependence, Q(f), in the area. The attenuation of the S wave can then be calculated as
where As(f, r) is the S wave spectral amplitude, Ac(f, tc) is the coda wave spectral amplitude, f is the frequency, r is the source-receiver distance, Rθφ is the source radiation pattern (θ and φ the azimuth and take-off angle for a source–receive ray), γ the geometrical spreading exponent, tc is the coda wave lapse time, s is a function of the source of S and coda waves, and site effect at the receiver, Qβ is the S-wave quality factor and VS the average S-wave velocity in the medium (here, 3.5 km/s). The slope of the least-squares fit of this equation to the corresponding observational data then determines the total attenuation Qβ. The starting lapse time for the coda window is set at 75 s, which is more than twice the S wave arrival, while the body window length is set at 10 s (Figure 2). This extended lapse time and body window are chosen to accommodate the large hypocentral distances (up to 100 km) in our dataset, ensuring that the energy peak is captured within the body window and preventing contamination of the coda window with the S wave energy. For source-receiver distances up to 100 km, the S-wave phase arrives around 28 s from the origin, with the coda starting at 42 s, providing over 30 s of signal time for the transition from single scattering to a diffusion regime.
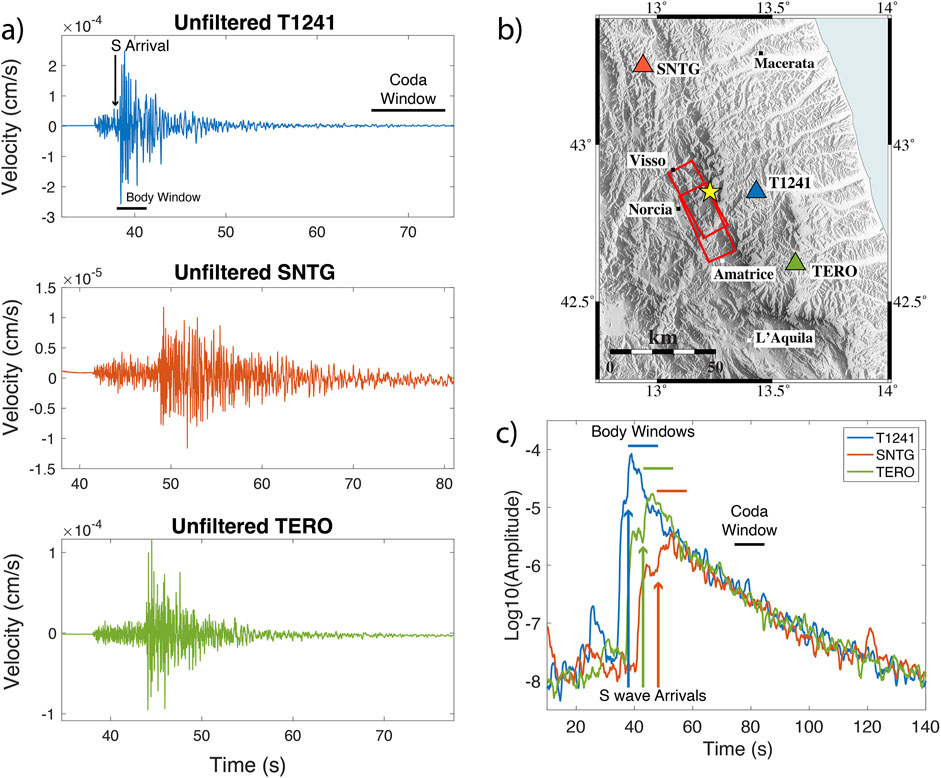
Figure 2. (A) Example of the recorded unfiltered seismogram at stations T1241, SNTG, and TERO for the event of 01/09/2016 (M3.1). The Coda window refers to the one used for the Qc Analysis (Section 4.2); (B) Location of the event and station for the unfiltered seismograms; (C) the Logarithm of the amplitude of the same event and stations of (A). The Body and Coda Windows are the ones used for the Coda Normalization Method (Section 4.1); colored arrows refer to the S wave arrival for each waveform.
We applied a fourth-order band-pass Butterworth filter, forward and backward, in four frequency bands (1–2 Hz, 2–4 Hz, 4–8 Hz, and 8–16 Hz), centered at frequencies of 1.5, 3, 6, and 12 Hz (Gabrielli et al., 2022). Figure 3 presents an example of the pre-sequence phase coda normalization analysis across these four frequency bands. To compute the envelopes, we used a Hilbert transform and then smoothed them with a moving window of duration equal to the inverse of eight times the central frequency. This widely used procedure, applied in many studies on similar topics, facilitates useful comparisons across comparable results worldwide (Calvet et al., 2013; Borleanu et al., 2017; Sketsiou et al., 2021).
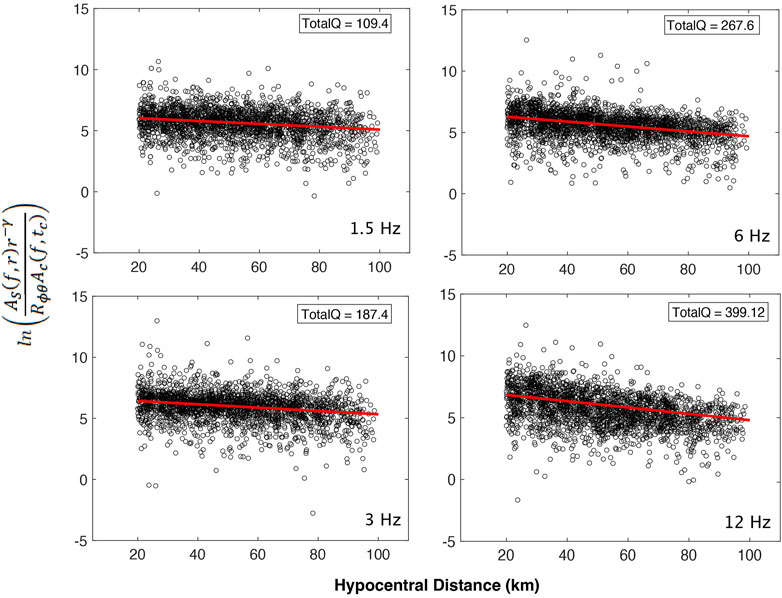
Figure 3. Plot of the logarithm of the Amplitude of the S waves against the Amplitude of the Coda for the frequencies of 1.5-3-6-12 Hz for the Pre-Sequence Dataset.
An initial analysis of the entire dataset, including near-source waveforms, highlighted a notable effect within a hypocentral distance of 0–20 km, where a significant increase in the energy ratio caused a bias in the calculation of Qβ at lower frequencies (1.5 and 3 Hz) (Figure 4). This behavior at close distances (0–20 km) may be influenced by factors such as scattering due to complex heterogeneities and an azimuthal component of geometrical spreading. Given the difficulty in discerning the dominant effect within this 0–20 km range, we chose to exclude waveforms within the first 20 km. Consequently, for the Qβ estimation, we considered only seismic waves with hypocentral distance between 20 and 100 km. We also adjusted the geometrical spreading values, as displayed in Table 3. This adjustment helped reduce the impact of unusually high energy values at a low (0–30 km) hypocentral distance.
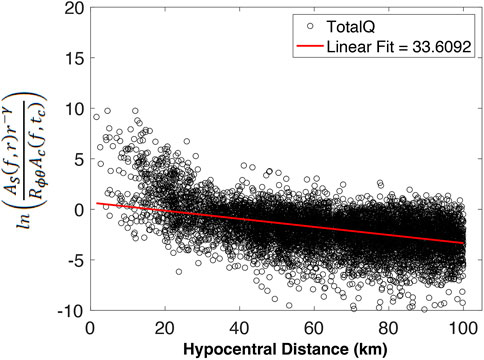
Figure 4. Plot of the logarithm of the Amplitude of the S waves against the Amplitude of the Coda for the frequency of 1.5 Hz, without geometrical spreading correction.
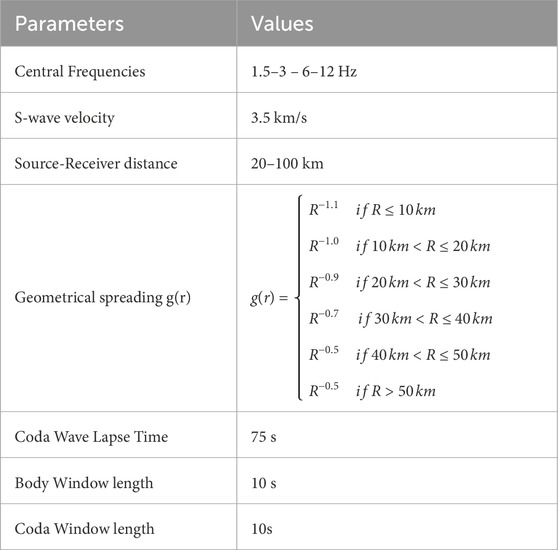
Table 3. Parameters used for the coda normalization analysis.
4.2 Coda wave attenuation and its spatial variation
Because the coda normalization method provides a single value of total attenuation for each dataset, it does not facilitate 2D mapping. To visualize spatial variations, we used the coda quality factor (Qc) as a proxy for intrinsic attenuation.
Coda waves, which appear as the tail end of a seismogram after the S-wave arrival, result from the complexities seismic waves encounter while traveling through the Earth’s crust (Aki and Chouet, 1975). A key characteristic of coda waves is their attenuation, where the wave envelope diminishes over time from the event’s origin (Zhang et al., 2021).
Various factors influence coda wave behavior, including single scattering, multiple scattering, and diffusion, depending on frequency and time-lapse (Sato et al., 2012). Shapiro et al. (2000) focused on the diffusion approximation of multiple scattering models and demonstrated that late coda radiation tends to be a diffusive process. In their work, they analyzed how coda waves transition into a diffusive regime. In this context, diffusion represents the complete redistribution of wave energy throughout the medium. In the case of small intrinsic dissipation (high intrinsic-Q), the radiation emitted by the source is not affected by a substantial loss of energy.
Calvet and Margerin (2013) expanded on the understanding of coda waves by studying the energy decay and scattering in seismology, focusing on both diffusion and absorption phenomena. They highlighted how coda waves can be dominated by single scattering in the early coda, and then exhibit a diffusive behavior in the late coda. They also made comparisons between scattering-induced energy losses and intrinsic absorption, emphasizing the different physical processes governing each phenomenon.
In extreme synthesis, for late coda, the coda energy decay (Q-coda coefficient, Qc, as explained in the following) tends to the value of intrinsic Q, Qi.
The decay rate of the coda envelope is quantified by the inverse coda quality factor Q−1c (Aki and Chouet, 1975), and it is expressed by the equation:
Where E (t, f) represents the power spectral density, S(f) the frequency-dependent source-site term, t the time-lapse from the origin, and α is equal to 3/2 when propagation occurs in a single layer defined by a multiple scattering regime (Paasschens, 1997; Calvet et al., 2013).
Q−1c is derived by linearizing Equation 4 through straight-line fitting, as in Equation 5:
For Q−1c analysis, the coda window starts at 2 times the S wave arrival and has a length of 20 s, following the tests done by Gabrielli et al. (2022) (Figure 2).
After determining the inverse quality factor Q−1c at each central frequency (1.5–3–6–12 Hz) for all station-source pairs, we mapped the spatial variations in Q−1c using kernel functions applicable to the diffusive regime (Del Pezzo et al., 2016). These kernels, related to the diffusive processes, provide higher spatial sensitivity in heterogeneous media, enhancing the illumination around the seismic path. This approach has been applied in both volcanic (De Siena et al., 2017; Gabrielli et al., 2020) and tectonic (Napolitano et al., 2020; Borleanu et al., 2023) settings.
After applying the kernels, we mapped the Q−1c using a regionalization approach, which involves calculating a weighted average of Qc from all the rays passing through each block. Although this regionalization method cannot include a resolution test, like a checkerboard pattern, due to its non-inversion nature, we evaluated the validity of the results using a hit count map (Calvet et al., 2013; Gabrielli et al., 2022). This approach, widely used in attenuation studies, serves as a proxy for resolution testing (Takahashi et al., 2007; Calvet et al., 2013; Gabrielli et al., 2022; Gabrielli et al., 2023; Napolitano et al., 2023). In Section 5.2, we are going to present the hit count map alongside the results, incorporating only cells crossed by more than 10 rays, in accordance with the approach outlined by Calvet et al. (2013).
To present the robustness and reliability of the spatial variation of attenuation, we employed the technique developed by Del Pezzo and Ibáñez (2020) to show the spatial distribution of the normalized standard deviation σ associated with the single Q values. This new approach involves defining “Resolution” as the inverse of the normalized standard deviation of the weighted average computed for each grid cell. The weights are determined by the numerical value of the kernel function at the center of each cell. High values of resolution are associated with the more reliable estimates in each cell, and vice versa. Del Pezzo and Ibáñez (2020) and Castro-Melgar et al. (2021) applied this new representation of uncertainty in the volcanic area of the Aeolian Islands. This kind of test can be considered the most suitable for the projection mapping of the weighting function of Qc that we performed. Here, for the first time, we applied this technique in tectonic regions with kernels having longer distances than the one used for volcanic zones (>20 km). We furthermore tested the applicability of these kernels, as presented in Supplementary Figure S1 provided in Supplementary Material.
5 Results–discussion
5.1 Total attenuation using the coda normalization method
We performed a study of Coda Normalization for the two main sequences (the pre-sequence and the 2016-2017 sequence) as well as for the three sub-sequences of Amatrice, Visso, and Norcia (Figure 5). In Figure 5, we plotted the distribution of the Energy ratios derived from Equation 3 against the hypocentral distance for each sequence, and at the central frequency of 1.5 Hz. Considering that the coda normalization has been performed also for the frequencies of 3, 6, and 12 Hz, we are able to obtain the quality factor Q and its frequency dependence, following
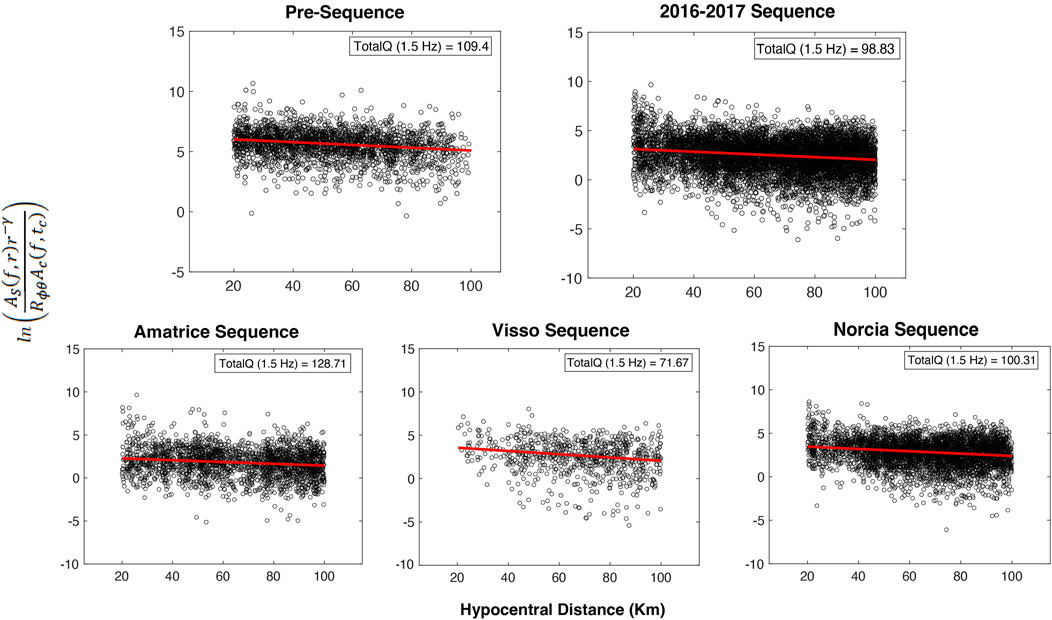
Figure 5. Plot of the logarithm of the Amplitude of the S waves vs. the Amplitude of the Coda for 1.5 Hz and for the Pre-sequence, 2016–2017 Sequence, and Amatrice, Visso, and Norcia sequences.
The frequency dependence of attenuation for the pre-sequence is described by Qβ(f) = 93 ± 25 f0.58±0.11, while during the sequence, it is Qβ(f) = 80 ± 22 f0.66±0.15. For specific sequences of Amatrice, Visso, and Norcia, the frequency dependences are: Amatrice: Qβ(f) =98 ± 25 f0.56±0.14; Visso: Qβ(f) =58 ± 21f0.8±0.16; Norcia: Qβ(f) =74 ± 20f0.7±0.15. These results are summarized in Table 4.
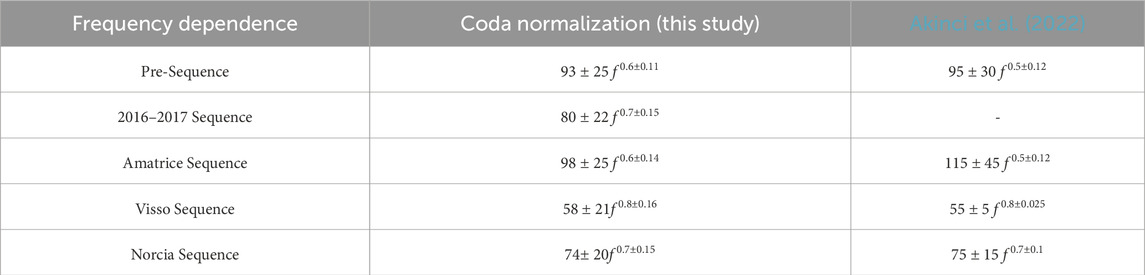
Table 4. Frequency dependence of Total Attenuation for this study, compared with Akinci et al., 2022.
These results suggest that the crustal S-wave attenuation and its frequency dependence varied significantly during the main events of the AVN sequence. Between the pre-sequence and the sequence, Q0 values decreased by 14%, indicating an increase in attenuation during this period. Throughout the sequence, particularly during the Visso phase (where Q0 = 58, from Qβ(f) = Q0fn), there is an apparent decrease in Qβ, with a 27% decrease compared to the sequence and a 37% decrease compared to the pre-sequence. This decrease may be associated with changes in fluid distribution during the sequence, as observed in other attenuation studies (Gabrielli et al., 2022; Castro et al., 2022; Akinci et al., 2022). Gabrielli et al. (2022) observed, in their Figure 9, possible fluid migration during the Visso phase by analyzing the plot of the average Qc−1 at two different stations. At the northernmost station located in the Visso area, we detected a 40% increase in attenuation just after the pre-sequence and during the Visso and Norcia phases, comparable to the 37% variation we found with the coda normalization. It is important to note that the attenuation represented by Gabrielli et al. (2022) is Qc, not the Qβ, even if both can be influenced by the fluid content. This fluid migration towards the Visso area was also identified by Malagnini et al. (2022), who calculated fluid flow patterns and suggested a northward fluid movement after the Amatrice mainshock.
Alongside Qβ, there is a corresponding variation in the frequency parameter, n, which increases as Q0 decreases and vice versa. The observed variations in Qβ values are comparable with those reported by Akinci et al. (2022) using the random vibration theory (RVT) technique (Tables 1, 4). In comparison to other studies (Table 1), the Q values from the GIT (Generalized Inversion Technique) analysis by Morasca et al. (2023 - Q = 247) and Pacor et al. (2016 - Q = 290) are higher than those obtained using the coda normalization used in this work (see Tables 1, 4). However, their n values are way lower than those reported in this study.
5.2 Spatial variation of attenuation of the central Apennines
In this section, we present the spatial variation of coda waves’ attenuation in the study area. Figures 6A, 7 represent areas of high attenuation Qc−1 in dark orange and areas of low attenuation Qc−1 in blue. The results are plotted after selecting cells based on the ray count per cell, considering only those crossed by more than 10 rays (hit count map, Figure 6B). The interpretation is further supported by the standard deviation σ map, which presents the relative cell resolution on calculated attenuation values (Figure 6). As described in the Methodology section, we combined the pre-sequence and sequence datasets to examine coda wave attenuation variation across the entire Central Apennines area rather than focusing solely on the 2016–2017 seismic sequence (Figure 6A). Additionally, we provide maps for the individual sequences of Amatrice, Visso, and Norcia (Figure 7). We focus on 1.5 Hz as it allows us to observe the primary structures and dynamics of the tectonic setting, enabling us to visualize structures with a linear dimension on the order of 2-3 km. The results at the higher frequency of 12 Hz are shown in Supplementary Figure S2 provided in Supplementary Material.
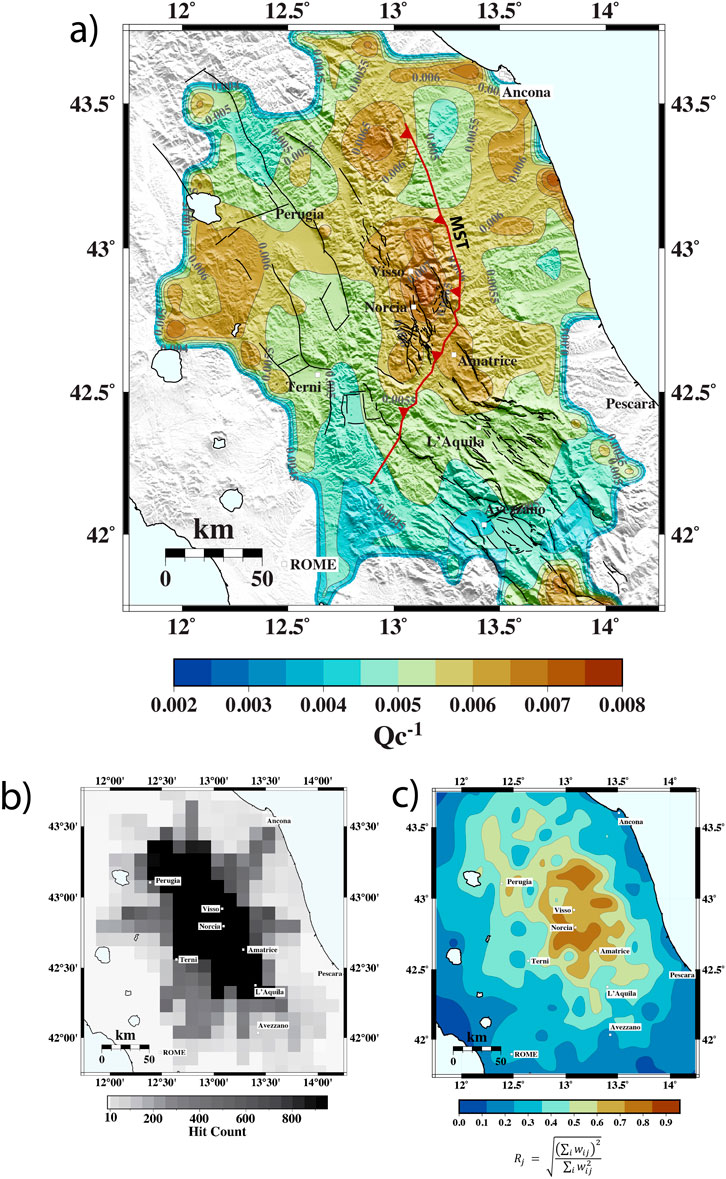
Figure 6. (A) Spatial and temporal variation of Qc−1 at fc = 1.5 Hz for the 2011–2017 time period (pre-sequence+sequence dataset). Black lines are the faults from the ITHACA catalog. Red Line is the Monti Sibillini Thrust (MST). (B) On the left, the hit count maps show the cells crossed by at least 10 rays; on the right, the resolution test of the spatial distribution of the standard deviation σ.
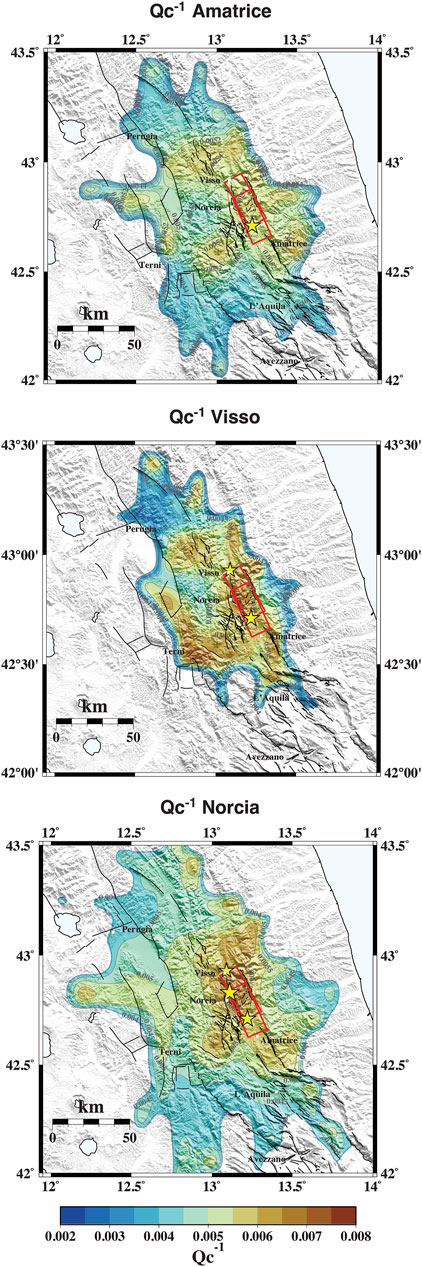
Figure 7. Spatial and temporal variation of Qc−1 at fc = 1.5 Hz for the sequences of Amatrice, Visso, and Norcia. Black lines are the faults from the ITHACA catalog. Red boxes are the fault plane for the Amatrice and Norcia earthquakes. The stars indicate the mainshocks of each 2016–2017 sequence.
In the center of the map (Figure 6A), we observe that high attenuation anomalies are located in the same regions identified in previous studies on coda attenuation (Gabrielli et al., 2022). The expanded study area, the introduction of new data, and the regionalization approach have also revealed significant attenuation along the Adriatic coast, likely due to the presence of foredeep deposits in the area. Additionally, the high attenuation anomaly extends along the thrust front of the Monti Sibillini (MST, Figure 1), consistent with findings from other attenuation studies (Gabrielli et al., 2022; Colavitti et al., 2022; Morasca et al., 2023). We identify a similar trend at a higher frequency of 12 Hz (Supplementary Figure S2). The Monti Sibillini thrust is considered an important element in the origin of the AVN seismic sequence, as seen also by the fieldwork studies of Curzi et al. (2024), where they suggest that this thrust may represent a barrier for the deep fluid migration at the hypocentral depth of the present-day earthquake. The involvement of this thrust in the seismic sequence starting with the Amatrice mainshock, has been recognized also by the aftershock distribution during the seismic sequence, as seen by Bonini et al. (2019) and Del Ventisette et al. (2021). This high attenuation trend also extends northward and westward to the Perugia region, an area that has been subject to a seismic sequence in 1997–1998 (Chiaraluce et al., 2004).
Moreover, the high attenuation anomaly extending northward, partially visible during the Norcia phase (Figure 7), aligns with observations of crustal velocity variations during the 2016-2017 Amatrice-Visso-Norcia (AVN) sequence reported by Soldati et al. (2019). Using noise cross-correlation techniques, Soldati et al. identified a sudden drop in seismic velocity following each mainshock, with the most significant fluctuations occurring along the NE direction. These variations extended toward and along the Adriatic coast, particularly in sandstone-rich foredeep deposits. This phenomenon is likely driven by the porous and hydrated nature of these sediments, which respond to seismic wave propagation by increasing pore pressure. Elevated pore pressure reduces the effective stress within the sediments, causing a decrease in seismic velocity. Such processes underscore the dynamic role of fluid-saturated geological formations in modulating seismic wave behavior during an active sequence. Our findings are consistent with these results, as demonstrated by the observed increase in attenuation during the AVN sequence. Specifically, coda normalization analysis reveals a 24% decrease in Q (indicating an increase in attenuation) between the Amatrice and Norcia mainshocks (Table 4). This change points to a rise in fluid content in the area between the Visso and Norcia events, further supporting the hypothesis of fluid-driven processes. The Qc⁻1 mapping (Figures 6A, 7) also highlights spatially correlated attenuation anomalies, emphasizing the impact of fluid redistribution and sediment properties on seismic wave propagation.
In southern Central Italy, we observe a low attenuation zone extending east of Rome. This low Qc−1 zone is likely associated with changes from high to medium CO2 flux and high to low conductive heat flow, as noted by Di Luccio et al. (2022), Figures 3A, B. It is interesting to see that the decrease in attenuation aligns with the variations in CO2 and conductive heat seen by Di Luccio et al. (2022), following an almost NE-SW direction. These variations are influenced by the Apennines structure, which separates the western Tyrrhenian side, characterized by diffusive mantle-source CO2 release, degassing, and volcanic activity, from the Adriatic foredeep to the east, where no CO2 emission is observed (Chiodini et al., 2020; Di Luccio et al., 2022). The lower attenuation area in Figure 6A aligns with the edge of these variations, marking the transition between volcanic gas emissions and the sedimentary domain of the Apennine chain.
The high attenuation anomaly in Figure 6A, observed in the foredeep of the Adriatic Coast (south of Ancona), corresponds with findings from Carannante et al. (2013), who identified a high Vp/Vs ratio in the same area between the depths of 0 and 4 km, suggesting the presence of highly hydrated Plio-Pleistocene sediments (Scrocca et al., 2007). At a greater depth of 12 km, Carannante et al. (2013) detected a contrast in Vp/Vs ratios, indicating the separation of two different flexing portions of the Adria lithosphere caused by a raised area of the basement. It is important to mention that while Carannante et al. (2013) conducted a 3D tomography, our study is based on 2D imaging, so we cannot determine which possible interpretation among those features can be the cause of our high attenuation anomaly.
To examine the attenuation changes from 2011 to 2017, we calculated the percentage difference (Qc−1 variation) between the Qc−1 of the 2016 sequence and the pre-sequence phase (Figure 8). Imaging of the individual Pre-Sequence and Sequence phases is provided in Supplementary Figure S3. It is important to note that the coverage between the two sequences is similar, but not equal, as the Adriatic coast is partially more covered during the pre-sequence phase, due to the new events added in the dataset.
The main variations are observed to the west of the AVN mainshocks and of the Monti Sibillini thrust, with changes in Qc−1 of approximately 20–30%. These differences are comparable with the variation in coda-wave attenuation and scattering reported by Gabrielli et al. (2022); Gabrielli et al. (2023), though the additional seismicity in our dataset reveals further differences. Indeed, these variations are located where the seismic events of 2016 occurred, recording an increment of attenuation with respect to the pre-sequence. These variations appear as blue anomalies along the foredeep and Adriatic Coast, indicating visible negative variation (−40%), as well as changes in the northern part of the study area.
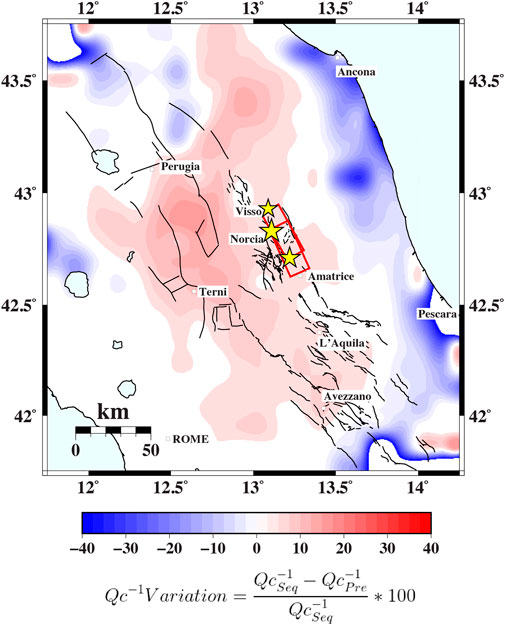
Figure 8. Percentage difference of Qc−1 between the pre-sequence and sequence phases. Black lines are the faults from the ITHACA catalog. Red Line is the Monti Sibillini Thrust (MST).
We also calculated an average of Qc and its frequency dependence based on the spatial distribution (Table 5) (

Table 5. Frequency dependence of Total Attenuation and Regionalized Qc for this study.
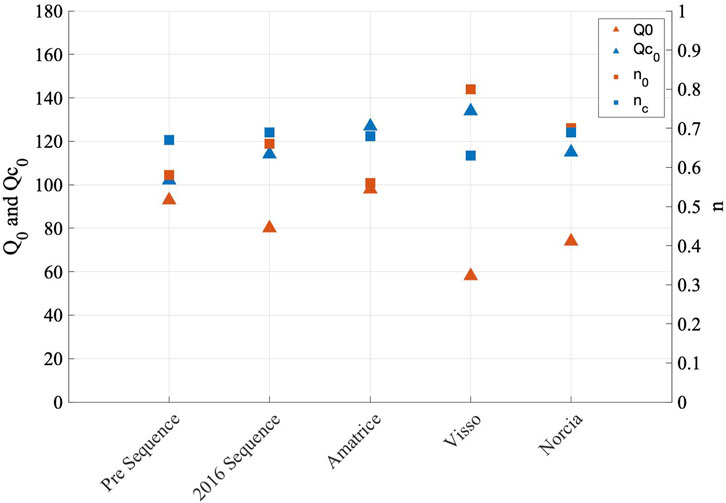
Figure 9. Frequency dependent Q0 (orange triangles) and Qc0 (blue triangles) and their frequency dependence n0 (orange squares) and nc (blue squares) as a function of time (Pre-sequence, Sequence and the singular sequences of Amatrice, Visso, and Norcia.
6 Conclusion
In this study, we investigated the seismic attenuation of the Central Apennines using two different techniques: the Coda Normalization method and a novelty regionalization approach to analyze the spatial variation of coda waves’ attenuation. This research provides a comprehensive view of the attenuation behavior in Central Italy over the past 15 years, focusing on the period from January 2011 to January 2017, with particular attention to the seismic sequence of Amatrice, Visso, and Norcia (AVN).
Our key findings can be summarized as follows:
•Using the Coda-Normalization method, we analyzed temporal variations in attenuation across the study area. A key innovation of our work is the use of a novel kernel function approach for mapping Qc, which sets this study apart from previous attenuation research in the region. This improved regionalization method allowed us to map attenuation over a broader area, offering a more detailed and comprehensive view of its spatial distribution. At low hypocentral distances (0–20 km), we observed significant energy variations using the Coda Normalization method. Although this technique is designed to normalize and eliminate site and source related effects, it does not entirely remove the influence of the source radiation pattern. These effects near the source could be caused by the interaction between strong scattering and irregular geometrical spreading behavior.
•Our analysis of crustal S-wave attenuation and its frequency dependence revealed substantial variations during the AVN sequence. Attenuation in seismic waves increased by 14% overall during the AVN seismic sequence compared to the values from the pre-sequence. Particularly, during the Visso phase, we observed a larger increase in attenuation—27% relative to the sequence average and 37% compared to the pre-sequence—in the earthquake faulting region. This variation is linked to fluid migration throughout the sequence, as supported by findings in other studies.
•Our Qc−1 regionalization analysis highlighted a high attenuation anomaly in the 2016-2017 mainshock zone, consistent with previous studies. By expanding the study area, we detected an increase in attenuation that aligns with the NS trend of the Monti Sibillini thrust, emphasizing the structural significance of this feature in the Central Italy seismogenic framework. The increment in attenuation observed during the Visso and Norcia phases correlates with values observed during the same periods from coda normalization. Our expanded dataset revealed a previously undetected high attenuation anomaly in the Adriatic foredeep, likely associated with fluid-saturated deposits. We also noted a distinction between the Tyrrhenic volcanic zone and the Apennines sedimentary domain.
Our findings contribute valuable insights into the physical parameters that influence ground motion amplitudes for Central Italy, aiding in seismic hazard assessment. This research offers the potential to improve Ground Motion Prediction Models (GMMs) in the highly seismic region of the Central Apennines.
Data availability statement
The datasets presented in this study can be found in online repositories. The names of the repository/repositories and accession number(s) can be found below: http://www.orfeus-eu.org/data/eida http://itaca.mi.ingv.it/ItacaNet_30.
Author contributions
SG: Conceptualization, Data curation, Methodology, Software, Writing–original draft, Writing–review and editing. AA: Conceptualization, Data curation, Funding acquisition, Investigation, Resources, Supervision, Writing–original draft, Writing–review and editing. ED: Methodology, Software, Supervision, Writing–review and editing.
Funding
The author(s) declare that financial support was received for the research, authorship, and/or publication of this article. This work has been carried out in the framework of the project SECURE Pianeta Dinamico/2023–2025 supported by Ministero dell’Istruzione, dell’Università e della Ricerca (MIUR).
Acknowledgments
Many of the plots were generated using the Generic Mapping Tools, version 4.2.1 (http://www.soest.hawaii.edu/gmt; Wessel and Smith, 1998) and using the Scientific Color Maps (Crameri 2018; http://doi.org/10.5281/zenodo.1243862). We would like to thank the reviewers for their thoughtful comments and efforts towards improving our manuscript.
Conflict of interest
The authors declare that the research was conducted in the absence of any commercial or financial relationships that could be construed as a potential conflict of interest.
Publisher’s note
All claims expressed in this article are solely those of the authors and do not necessarily represent those of their affiliated organizations, or those of the publisher, the editors and the reviewers. Any product that may be evaluated in this article, or claim that may be made by its manufacturer, is not guaranteed or endorsed by the publisher.
Supplementary material
The Supplementary Material for this article can be found online at: https://www.frontiersin.org/articles/10.3389/feart.2024.1487797/full#supplementary-material
References
Aki, K. (1980). Attenuation of shear-waves in the lithosphere for frequencies from 0.05 to 25 Hz. Phys. Earth Planet. Interiors 21 (1), 50–60. doi:10.1016/0031-9201(80)90019-9
Aki, K., and Chouet, B. (1975). Origin of coda waves: source, attenuation, and scattering effects. J. Geophys. Res. 80, 3322–3342. doi:10.1029/JB080i023p03322
Akinci, A., and Eyidogan, H. (1996). Frequency-dependent attenuation of S and coda waves in Erzincan region (Turkey). Phys. earth Planet. Inter. 97, 109–119. doi:10.1016/0031-9201(96)03155-X
Akinci, A., Munafò, I., and Malagnini, L. (2022). S-wave attenuation variation and its impact on ground motion amplitudes during 2016–2017 Central Italy earthquake sequence. Front. Earth Sci. 10, 903955. doi:10.3389/feart.2022.903955
Akinci, A., Perkins, D., Lombardi, A. M., and Basili, R. (2010). Uncertainties in probability of occurrence of strong earthquakes for fault sources in the Central Apennines, Italy. J. Seismol. 14, 95–117. doi:10.1007/s10950-008-9142-y
Akinci, A., Del Pezzo, E., and Malagnini, L. (2020). Intrinsic and scattering seismic wave attenuation in the Central Apennines (Italy). Physi. Earth. Plane. Inter. 303, 106498.
Bala, I., Kumar, S., Sandhu, M., Chopra, S., and Kumar, D. (2024). Estimation of geometrical spreading factor and coda-wave attenuation characteristics for the Saurashtra horst in western deccan volcanic province, Gujarat, India. Bull. Seismol. Soc. Am. 114, 2559–2575. doi:10.1785/0120230221
Billi, A., and Tiberti, M. M. (2009). Possible causes of arc development in the Apennines, central Italy. Bull. Geol. Soc. Am. 121, 1409–1420. doi:10.1130/B26335.1
Bonini, L., Basili, R., Burrato, P., Cannelli, V., Fracassi, U., Maesano, F. E., et al. (2019). Testing different tectonic models for the source of the Mw 6.5, 30 October 2016, Norcia earthquake (central Italy): a youthful normal fault, or negative inversion of an old thrust? Tectonics 38 (3), 990–1017. doi:10.1029/2018tc005185
Boore, D. M., Stewart, J. P., Seyhan, E., and Atkinson, G. M. (2014). NGA-West2 equations for predicting PGA, PGV, and 5% damped PSA for shallow crustal earthquakes. Earthq. Spectra 30 (3), 1057–1085. doi:10.1193/070113eqs184m
Borleanu, F., De Siena, L., Thomas, C., Popa, M., and Radulian, M. (2017). Seismic scattering and absorption mapping from intermediate-depth earthquakes reveals complex tectonic interactions acting in the Vrancea region and surroundings (Romania). Tectonophysics 706, 129–142. doi:10.1016/j.tecto.2017.04.013
Borleanu, F., Petrescu, L., Seghedi, I., Thomas, C., and De Siena, L. (2023). The seismic attenuation signature of collisional orogens and sedimentary basins within the Carpathian Orogen. Glob. Planet. Change 223, 104093. doi:10.1016/j.gloplacha.2023.104093
Brozzetti, F., Boncio, P., Cirillo, D., Ferrarini, F., De Nardis, R., Testa, A., et al. (2019). High-resolution field mapping and analysis of the August–October 2016 coseismic surface faulting (central Italy earthquakes): slip distribution, parameterization, and comparison with global earthquakes. Tectonics 38 (2), 417–439. doi:10.1029/2018tc005305
Buttinelli, M., Petracchini, L., Maesano, F. E., D'Ambrogi, C., Scrocca, D., Marino, M., et al. (2021). The impact of structural complexity, fault segmentation, and reactivation on seismotectonics: constraints from the upper crust of the 2016–2017 Central Italy seismic sequence area. Tectonophysics 810, 228861. doi:10.1016/j.tecto.2021.228861
Calvet, M., and Margerin, L. (2013). Lapse-time dependence of coda Q: anisotropic multiple-scattering models and application to the Pyrenees. Bull. Seismol. Soc. Am. 103 (3), 1993–2010. doi:10.1785/0120120239
Calvet, M., Sylvander, M., Margerin, L., and Villaseñor, A. (2013). Spatial variations of seismic attenuation and heterogeneity in the Pyrenees: coda Q and peak delay time analysis. Tectonophysics 608, 428–439. doi:10.1016/j.tecto.2013.08.045
Carannante, S., Monachesi, G., Cattaneo, M., Amato, A., and Chiarabba, C. (2013). Deep structure and tectonics of the northern-central Apennines as seen by regional-scale tomography and 3-D located earthquakes. J. Geophys. Res. Solid Earth 118 (10), 5391–5403. doi:10.1002/jgrb.50371
Castro, R. R., Spallarossa, D., Pacor, F., Colavitti, L., Lanzano, G., Vidales-Basurto, C. A., et al. (2022). Temporal variation of the spectral decay parameter kappa detected before and after the 2016 main earthquakes of Central Italy. Bull. Seismol. Soc. Am. 112 (6), 3037–3045. doi:10.1785/0120220107
Castro-Melgar, I., Prudencio, J., Del Pezzo, E., Giampiccolo, E., and Ibanez, J. M. (2021). Shallow magma storage beneath Mt. Etna: evidence from new attenuation tomography and existing velocity models. J. Geophys. Res. Solid Earth 126 (7), e2021JB022094. doi:10.1029/2021jb022094
Chiarabba, C., Buttinelli, M., Cattaneo, M., and De Gori, P. (2020). Large earthquakes driven by fluid overpressure: the Apennines normal faulting system case. Tectonics 39 (4), e2019TC006014. doi:10.1029/2019tc006014
Chiarabba, C., De Gori, P., Cattaneo, M., Spallarossa, D., and Segou, M. (2018). Faults geometry and the role of fluids in the 2016–2017 Central Italy seismic sequence. Geophys. Res. Lett. 45 (14), 6963–6971. doi:10.1029/2018gl077485
Chiarabba, C., Piccinini, D., and De Gori, P. (2009). Velocity and attenuation tomography of the Umbria Marche 1997 fault system: evidence of a fluid-governed seismic sequence. Tectonophysics 476 (1-2), 73–84. doi:10.1016/j.tecto.2009.04.004
Chiaraluce, L., Amato, A., Cocco, M., Chiarabba, C., Selvaggi, G., Di Bona, M., et al. (2004). Complex normal faulting in the Apennines thrust-and-fold belt: the 1997 seismic sequence in Central Italy. Bull. Seism. Soc. Am. 94, 99–116. doi:10.1785/0120020052
Chiaraluce, L., Di Stefano, R., Tinti, E., Scognamiglio, L., Michele, M., Casarotti, E., et al. (2017). The 2016 Central Italy seismic sequence: a first look at the mainshocks, aftershocks, and source models. Seismol. Res. Lett. 88 (3), 757–771. doi:10.1785/0220160221
Chiodini, G., Cardellini, C., Di Luccio, F., Selva, J., Frondini, F., Caliro, S., et al. (2020). Correlation between tectonic CO2 Earth degassing and seismicity is revealed by a 10-year record in the Apennines, Italy. Sci. Adv. 6 (35), eabc2938. doi:10.1126/sciadv.abc2938
Colavitti, L., Lanzano, G., Sgobba, S., Pacor, F., and Gallovič, F. (2022). Empirical evidence of frequency-dependent directivity effects from small-to-moderate normal fault earthquakes in central Italy. J. Geophys. Res. Solid Earth 127 (6), e2021JB023498. doi:10.1029/2021jb023498
Cormier, V. F. (2011). “Seismic, viscoelastic attenuation,” in Encyclopedia of solid Earth geophysics (Netherlands, Dordrecht: Springer), 1279–1290. doi:10.1007/978-90-481-8702-7_55
Cosentino, D., Cipollari, P., Marsili, P., and Scrocca, D. (2010). Geology and evolution of the central Apennines (Italy). Geol. Soc. Lond. Spec. Publ. 340 (1), 163–192. doi:10.1144/SP340.7
Curzi, M., Cipriani, A., Aldega, L., Billi, A., Carminati, E., Van der Lelij, R., et al. (2024). Architecture and permeability structure of the Sibillini Mts. Thrust and influence upon recent, extension-related seismicity in the central Apennines (Italy) through fault-valve behavior. Bulletin 136 (1-2), 3–26. doi:10.1130/B36616.1
De Gori, P., Michele, M., Chiaraluce, L., and Chiarabba, C. (2023). Fault rheology control on rupture propagation and aftershocks distribution during the 2016–2017 Central Italy earthquakes. Seismol. Res. Lett. 94 (6), 2642–2654. doi:10.1785/0220220284
Del Pezzo, E., Ibanez, J., Prudencio, J., Bianco, F., and De Siena, L. (2016). Absorption and scattering 2-D volcano images from numerically calculated space-weighting functions. Geophys. J. Int. 206 (2), 742–756. doi:10.1093/gji/ggw171
Del Pezzo, E., and Ibáñez, J. M. (2020). Seismic coda-waves imaging based on sensitivity kernels calculated using an heuristic approach. Geosciences 10 (8), 304. doi:10.3390/geosciences10080304
Del Ventisette, C., Bonini, M., Maestrelli, D., Sani, F., Iavarone, E., and Montanari, D. (2021). 3D-thrust fault pattern control on negative inversion: an analogue modelling perspective on central Italy. J. Struct. Geol. 143, 104254. doi:10.1016/j.jsg.2020.104254
De Siena, L., Amoruso, A., Pezzo, E. D., Wakeford, Z., Castellano, M., and Crescentini, L. (2017). Space-weighted seismic attenuation mapping of the aseismic source of Campi Flegrei 1983–1984 unrest. Geophys. Res. Lett. 44 (4), 1740–1748. doi:10.1002/2017gl072507
De Siena, L., Thomas, C., and Aster, R. (2014). Multi-scale reasonable attenuation tomography analysis (MuRAT): an imaging algorithm designed for volcanic regions. Res 277, 22–35. doi:10.1016/j.jvolgeores.2014.03.009
Di Luccio, F., Palano, M., Chiodini, G., Cucci, L., Piromallo, C., Sparacino, F., et al. (2022). Geodynamics, geophysical and geochemical observations, and the role of CO2 degassing in the Apennines. Earth-Science Rev. 234, 104236. doi:10.1016/j.earscirev.2022.104236
Gabrielli, S., Akinci, A., De Siena, L., Del Pezzo, E., Buttinelli, M., Maesano, F. E., et al. (2023). Scattering attenuation images of the control of thrusts and fluid overpressure on the 2016–2017 Central Italy seismic sequence. Geophys. Res. Lett. 50, 1–10. doi:10.1029/2023GL103132
Gabrielli, S., Akinci, A., Ventura, G., Napolitano, F., Del Pezzo, E., and De Siena, L. (2022). Fast changes in seismic attenuation of the upper crust due to fracturing and fluid migration: the 2016–2017 Central Italy seismic sequence. Front. Earth Sci. 10, 1–18. doi:10.3389/feart.2022.909698
Gabrielli, S., De Siena, L., Napolitano, F., and Del Pezzo, E. (2020). Understanding seismic path biases and magmatic activity at Mount St Helens volcano before its 2004 eruption. Geophys. J. Int. 222 (1), 169–188. doi:10.1093/gji/ggaa154
Kuehn, N. M., Abrahamson, N. A., and Walling, M. A. (2019). Incorporating nonergodic path effects into the NGA-West2 ground-motion prediction equations. Bull. Seismol. Soc. Am. 109 (2), 575–585. doi:10.1785/0120180260
Lanza, F., Thurber, C. H., Syracuse, E. M., Power, J. A., and Ghosh, A. (2020). Seismic tomography of compressional wave velocity and attenuation structure for Makushin Volcano, Alaska. J. Volcanol. Geotherm. Res. 393, 106804. doi:10.1016/j.jvolgeores.2020.106804
Lombardi, A. M., Akinci, A., Malagnini, L., and Mueller, C. S. (2005). Uncertainty analysis for seismic hazard in Northern and Central Italy. Ann. Geophys. doi:10.4401/ag-3239
Malagnini, L., Akinci, A., Mayeda, K., Munafo', I., Herrmann, R. B., and Mercuri, A. (2011). Characterization of earthquake-induced ground motion from the L'Aquila seismic sequence of 2009, Italy. Geophys. J. Int. 184 (1), 325–337. doi:10.1111/j.1365-246x.2010.04837.x
Malagnini, L., Parsons, T., Munafo, I., Mancini, S., Segou, M., and Geist, E. L. (2022). Crustal permeability changes inferred from seismic attenuation: impacts on multi-mainshock sequences. Front. Earth Sci. 10, 963689. doi:10.3389/feart.2022.963689
Morasca, P., D'Amico, M., Sgobba, S., Lanzano, G., Colavitti, L., Pacor, F., et al. (2023). Empirical correlations between an FAS non-ergodic ground motion model and a GIT derived model for Central Italy. Geophys. J. Int. 233 (1), 51–68. doi:10.1093/gji/ggac445
Muller, T. M., Gurevich, B., and Lebedev, M. (2010). Seismic wave attenuation and dispersion resulting from wave-induced flow in porous rocks A review. Geophysics 75, 75A147-–75A164. doi:10.1190/1.3463417
Napolitano, F., De Siena, L., Gervasi, A., Guerra, I., Scarpa, R., and La Rocca, M. (2020). Scattering and absorption imaging of a highly fractured fluid-filled seismogenetic volume in a region of slow deformation. Geosci. Front. 11 (3), 989–998. doi:10.1016/j.gsf.2019.09.014
Napolitano, F., Gabrielli, S., De Siena, L., Amoroso, O., and Capuano, P. (2023). Imaging overpressurised fracture networks and geological barriers hindering fluid migrations across a slow-deformation seismic gap. Sci. Rep. 13 (1), 19680. doi:10.1038/s41598-023-47104-w
Paasschens, J. C. J. (1997). Solution of the time-dependent Boltzmann equation. Phys. Rev. E 56 (1), 1135–1141. doi:10.1103/physreve.56.1135
Pacor, F., Spallarossa, D., Oth, A., Luzi, L., Puglia, R., Cantore, L., et al. (2016). Spectral models for ground motion prediction in the L'Aquila region (central Italy): evidence for stress-drop dependence on magnitude and depth. Geophys. J. Int. 204 (2), 697–718. doi:10.1093/gji/ggv448
Pastori, M., Baccheschi, P., and Margheriti, L. (2019). Shear wave splitting evidence and relations with stress field and major faults from the “Amatrice-Visso-Norcia Seismic Sequence”. Tectonics 38 (9), 3351–3372. doi:10.1029/2018tc005478
Pastori, M., Baccheschi, P., Piccinini, D., and Margheriti, L. (2023). S wave Splitting in Central Apennines (Italy): anisotropic parameters in the crust during seismic sequences. Ann. Geophys. 66. doi:10.4401/ag-8844
Pischiutta, M., Akinci, A., Tinti, E., and Herrero, A. (2021). Broad-band ground-motion simulation of 2016 Amatrice earthquake, Central Italy. Geophys. J. Int. 224 (3), 1753–1779. doi:10.1093/gji/ggaa412
Prudencio, J., De Siena, L., Ibáñez, J. M., Del Pezzo, E., Garcia-Yeguas, A., and Diaz-Moreno, A. (2015a). The 3D attenuation structure of deception Island (Antarctica). Surv. Geophys. 36, 371–390. doi:10.1007/s10712-015-9322-6
Prudencio, J., Ibáñez, J. M., Del Pezzo, E., Martí, J., García-Yeguas, A., and De Siena, L. (2015b). 3D attenuation tomography of the volcanic island of Tenerife (Canary Islands). Surv. Geophys. 36, 693–716. doi:10.1007/s10712-015-9333-3
Romanowicz, B. (1998). Attenuation tomography of the Earth’s mantle: a review of current status. Pure Appl. Geophys. 153, 257–272. doi:10.1007/s000240050196
Sato, H., Fehler, M. C., and Maeda, T. (2012). SeismicWave propagation and scattering in the heterogeneous Earth. Second Edition. New York, USA: Springer.
Schurr, B., Asch, G., Rietbrock, A., Trumbull, R., and Haberland, C. (2003). Complex patterns of fluid and melt transport in the central Andean subduction zone revealed by attenuation tomography. Earth Planet. Sci. Lett. 215, 105–119. doi:10.1016/S0012-821X(03)00441-2
Scrocca, D., Carminati, E., Doglioni, C., and Marcantoni, D. (2007). “Slab retreat and active shortening along the central-northern Apennines,” in Thrust belts and Foreland Basins: from fold kinematics to hydrocarbon systems (Springer Berlin Heidelberg), 471–487.
Sedaghati, F., and Pezeshk, S. (2016). Estimation of the coda-wave attenuation and geometrical spreading in the New Madrid seismic zone. Bull. Seismol. Soc. Am. 106 (4), 1482–1498. doi:10.1785/0120150346
Sgobba, S., Lanzano, G., and Pacor, F. (2021). Empirical nonergodic shaking scenarios based on spatial correlation models: an application to central Italy. Earthq. Eng. and Struct. Dyn. 50 (1), 60–80. doi:10.1002/eqe.3362
Shapiro, N. M., Campillo, M., Margerin, L., Singh, S. K., Kostoglodov, V., and Pacheco, J. (2000). The energy partitioning and the diffusive character of the seismic coda. Bull. Seismol. Soc. Am. 90 (3), 655–665. doi:10.1785/0119990021
Sketsiou, P., Siena, L.De, Gabrielli, S., and Napolitano, F. (2021). 3D attenuation image of fluid storage and tectonic interactions across the Pollino fault network. Geophys. J. Int. 226, 536–547. doi:10.1093/gji/ggab109
Soldati, G., Zaccarelli, L., and Faenza, L. (2019). Spatio-temporal seismic velocity variations associated to the 2016–2017 central Italy seismic sequence from noise cross-correlation. Geophys. J. Int. 219 (3), 2165–2173. doi:10.1093/gji/ggz429
Sugan, M., Campanella, S., Chiaraluce, L., Michele, M., and Vuan, A. (2023). The unlocking process leading to the 2016 Central Italy seismic sequence. Geophys. Res. Lett. 50 (5), e2022GL101838. doi:10.1029/2022gl101838
Takahashi, T., Sato, H., Nishimura, T., and Obara, K. (2007). Strong inhomogeneity beneath Quaternary volcanoes revealed from the peak delay analysis of S-wave seismograms of microearthquakes in northeastern Japan. Geophys. J. Int. 168 (1), 90–99. doi:10.1111/j.1365-246x.2006.03197.x
Talone, D., De Siena, L., Lavecchia, G., and de Nardis, R. (2023). The attenuation and scattering signature of fluid reservoirs and tectonic interactions in the central-southern Apennines (Italy). Geophys. Res. Lett. 50 (22), e2023GL106074. doi:10.1029/2023gl106074
Toker, M., and Şahin, Ş. (2022). Upper-to mid-crustal seismic attenuation structure above the mantle wedge in East Anatolia, Turkey: imaging crustal scale segmentation and differentiation. Phys. Earth Planet. Interiors 329, 106908. doi:10.1016/j.pepi.2022.106908
Valoroso, L., Chiaraluce, L., Piccinini, D., Di Stefano, R., Schaff, D., and Waldhauser, F. (2013). Radiography of a normal fault system by 64,000 high-precision earthquake locations: the 2009 L'Aquila (central Italy) case study. J. Geophys. Res. Solid Earth 118 (3), 1156–1176. doi:10.1002/jgrb.50130
Vignaroli, G., Mancini, M., Brilli, M., Bucci, F., Cardinali, M., Giustini, F., et al. (2020). Spatial-temporal evolution of extensional faulting and fluid circulation in the Amatrice basin (central Apennines, Italy) during the pleistocene. Front. Earth Sci. 8, 130. doi:10.3389/feart.2020.00130
Keywords: S-wave attenuation, central Italy seismic sequence, coda normalization, regionalization, coda waves, time variation, frequency dependence
Citation: Gabrielli S, Akinci A and Del Pezzo E (2025) Temporal and spatial variability of S-wave and coda attenuation in the Central Apennines, Italy. Front. Earth Sci. 12:1487797. doi: 10.3389/feart.2024.1487797
Received: 28 August 2024; Accepted: 10 December 2024;
Published: 13 January 2025.
Edited by:
Paolo Capuano, University of Salerno, ItalyReviewed by:
Honn Kao, Natural Resources Canada, CanadaFelix Borleanu, Institutul National de Cercetare si Dezvoltare pentru Fizica Pamantului, Romania
Copyright © 2025 Gabrielli, Akinci and Del Pezzo. This is an open-access article distributed under the terms of the Creative Commons Attribution License (CC BY). The use, distribution or reproduction in other forums is permitted, provided the original author(s) and the copyright owner(s) are credited and that the original publication in this journal is cited, in accordance with accepted academic practice. No use, distribution or reproduction is permitted which does not comply with these terms.
*Correspondence: Simona Gabrielli, c2ltb25hLmdhYnJpZWxsaUBpbmd2Lml0