- 1Hunan Engineering Research Center of Development and Application of Ceramsite Concrete Technology, Hunan City University, Yiyang, China
- 2Key Laboratory of Green Building and Intelligent Construction in Higher Educational Institutions of Hunan Province, Hunan City University, Yiyang, China
- 3College of Civil Engineering, Sichuan University of Science and Engineering, Zigong, China
- 4Key Laboratory of Shale Gas Exploration, Ministry of Natural Resources, Chongqing Institute of Geology and Mineral Resources, Yubei, China
- 5Key Laboratory of Safety and High-Efficiency Coal Mining, Ministry of Education, Anhui University of Science and Technology, Huainan, China
With the increasing demand for coal resources and the unreasonable arrangement of subsequent working faces, mining activities in isolated working faces are more likely to induce coal burst accidents. In this study, the minimum distance principle is utilized as the risk assessment indicator and the quantitative theory is introduced to evaluate coal burst risk in isolated working faces. Through a case study in 1,304 isolated working face of Yangcheng Coal Mine, the key factors affecting the risk of coal burst were identified, and a three-dimensional coal burst risk assessment model was constructed to evaluate the risk of the isolated working face. The results show that as the working face advances, the abutment pressure and elastic strain energy density in front of the working face increase to the peak value in a positive exponential relationship at first and then decrease to in situ stress, which presents an upward convex trend. Under different excavation steps, the concentration coefficient of the peak stress gradually increases. The influence range of the abutment pressure of the working face gradually increases. Compared with one-dimensional and two-dimensional evaluation functions, the three-dimensional function significantly improves the accuracy of risk assessment and successfully identifies strong coal and gas outburst risks. Additionally, the model not only enhances the precision of risk assessment but also quantifies the assessment parameters.
1 Introduction
Coal burst is a typical dynamic disaster often accompanied by the sudden ejection of coal during underground mining activities (Zhao et al., 2018a; Wen et al., 2019; Tai et al., 2022; Wang P. et al., 2024). In recent years, there has been a significant expansion of coal mining operations, with corresponding increases in mining depths. As the mining depths increase, the engineering conditions encountered in mining activities become more complex, particularly the issue of high in situ stress due to mining depth, faults, and tectonic areas with isolated working faces (Guo et al., 2017; Zhao et al., 2018b; Li et al., 2022; Wang et al., 2024a; Wang et al., 2024b). Under the action of high stress accumulation and complex tectonic stress, the instability of island working faces is more likely to occur. The reason for this is the substantial accumulation of elastic energy, which can potentially lead to significant geotechnical hazards such as mine earthquakes or severe coal burst accidents (Xie et al., 2015; Pan et al., 2018; Li et al., 2021; Li et al., 2024). The instability of isolated working faces poses a severe threat to the safety of coal mining operations and has been responsible for numerous casualties. Therefore, it is imperative to develop effective methods for risk assessment and dynamic failure prediction.
Coal burst risk evaluation methods can be categorized into the following: qualitative evaluation method and quantitative evaluation method. The qualitative method assesses the risk of coal burst by summarizing the characteristics of the coal burst phenomenon. Based on the characteristics of mine micro-seismic data, Cao et al. (2022) proposed a neural network for coal burst prediction that is driven by the fusion of data and knowledge. Zhou J. et al. (2022) investigated the coal burst mechanism of isolated working surfaces and established a numerical model to describe the evolution of static and dynamic stress. The mechanism of coal burst disasters is highly complex, involving numerous influencing factors throughout the disaster’s preparation and development process. For instance, island mining on a coal face can lead to high stress accumulation before catastrophic failure, which may then trigger a coal burst. These prediction models struggle to quantify the relationships between control factors and the timing and location of coal burst accidents, which hampers the ability to accurately and scientifically evaluate the risk of coal bursting (Guo et al., 2019; Xu et al., 2019; Cao et al., 2023). However, the aforementioned evaluation methods primarily offer a qualitative assessment of prevention measures prior to coal mining, rather than providing a quantitative analysis.
To improve the accuracy of coal burst evaluations, quantitative evaluation methods are introduced to study the coal burst grade evaluation model for isolated working faces. The quantitative evaluation methods mainly include the comprehensive index method (Ahmad et al., 2021), possibility index diagnosis method (Zhou K. Y. et al., 2022), and fuzzy mathematics method (Tang et al., 2010). The comprehensive index method describes the relationship between coal burst risk and various mining conditions. Wu et al. (2019) optimized the least square support vector machine (LSSVM) method through the particle swarm optimization algorithm and proposed a new probability model for tunnel coal burst prediction using Copula’s theory. Dou et al. (2018) analyzed the multi-dimensional information of micro-seismic data during the mining process, conducted early warning of coal burst events through comprehensive analysis, and established a multi-parameter index normalization system for the early warning of micro-seismic coal burst. Di et al. (2023) proposed a comprehensive early-warning mode based on a deep learning algorithm through the comprehensive analysis of micro-seismic, acoustic emission and electromagnetic radiation signals. Wang et al. (2015) established a multi-index model for predicting coal mine rock burst by combining fuzzy matter theory, information entropy theory, and proximity theory. He et al. (2017) performed a comprehensive analysis of stress distribution and dynamic stress perturbations based on stress monitoring. Using Bayesian networks, Wang et al. (2022) quantified the probabilistic relationship between rock burst and its different types, and predicted the occurrence probability of rock burst by integrating multiple indicators. Moreover, Du et al. (2021) adopted the Bayesian method and combined the traditional comprehensive index method with the likelihood index diagnosis method to build a comprehensive risk assessment. Liu et al. (2023) established a multi-layer fuzzy comprehensive evaluation model based on the analytic hierarchy process–fuzzy comprehensive evaluation (AHP-FCE) method. Several influencing factors of rock burst risk were determined, and the evaluation model was calculated using a second-order fuzzy mathematical calculation method. It was found that the evaluation results are consistent with those of the comprehensive index method and the possibility index method. Dong et al. (2013) conducted a study on the AHP applied to the coal mine safety evaluation. Sun et al. (2009) combined fuzzy mathematics and neural networks to propose a fuzzy neural network prediction model for rock burst risk. These quantitative evaluation methods contribute to a more precise and data-driven approach to assessing coal burst risk, which is essential for the effective management and prevention of coal burst incidents in mining operations. The quantitative evaluation method is a significant branch of multivariate analysis methods and serves as an effective tool for processing quantitative data (He et al., 2023; Hao and Niu, 2014; Hu et al., 2014; Wang et al., 2012). This approach allows for the development of more effective strategies to mitigate the risks and enhance the safety of coal mining operations. Furthermore, quantitative theory evaluation and forecasting methods can overcome the limitations of scoring or indexing methods, providing a more robust framework for assessing and managing the risks associated with coal burst disasters. The traditional quantitative model has made some progress in evaluating the risk of rock burst, but there are still areas for improvement. For example, the comprehensive index method captures the relationship among risk factors from a holistic perspective, but its weight allocation relies on expert judgment and is susceptible to subjective influence. The fuzzy mathematical method has an advantage in predicting uncertainty, but it is limited by the complexity of establishing fuzzy sets and defining membership functions. The possibility index diagnostic method is effective in rapidly identifying high-risk areas, but it still lacks in providing complex multivariate analysis. Quantitative theoretical evaluation and prediction techniques are used in this study not only because of their competence in data analysis but also because of their ability to overcome the shortcomings of scoring or indexing methods.
Drawing on the aforementioned research, this study performs a comprehensive examination of coal outburst risk assessment for isolated mining faces, grounded in quantitative theory and the principle of minimum distance. Through the detailed analysis of geological and engineering parameters that influence coal outburst risk, a three-dimensional evaluation model is developed. The utility of various assessment methodologies is further evaluated by integrating numerical simulations with case studies for comparative analysis. This paper is organized as follows: Sections 2, 3 present a numerical simulation analysis on the abutment pressure and elastic strain energy during the mining process; Section 4 establishes a coal burst grade evaluation model for isolated working faces based on quantitative theory and the principle of minimum distance; and finally, conclusions are presented in Section 5.
2 Methodology
2.1 Geological and mining conditions
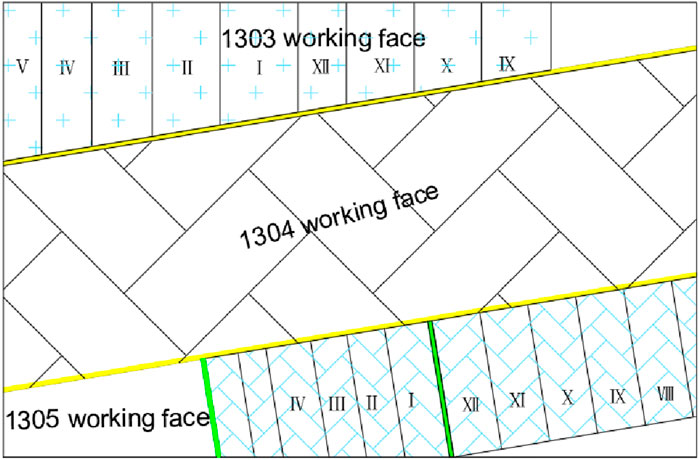
The mining level of working face 1,304 at Yangcheng Coal Mine is −650 m, and the coal seam is 3# coal, which is highly prone to bursts. The ground elevation ranges from 38.3 to 39.5 m. The coal seam floor elevation of the working face is between −535 and −660 m. The length of the working face is 184 m, and the mining advance length is 870 m. The dip angle of the coal seam in the working face varies from 17° to 21°, with an average of 19°. The thickness of the coal ranges from 7.0 to 8.2 m, with an average of 7.5 m. The minable index of 3# coal is 1, the coefficient of variation is 18.6%, and the coefficient of hardness is between 2 and 3, which belongs to medium-hard coal seam. The overburden of the working face is a thick and hard basic roof, which can accumulate extensive elastic properties, and poses potential mine burst hazards. According to the identification of the General Coal Research Institute, the lower part of 3# coal has a weak burst-prone characteristic, and the upper part of 3# coal has a strong burst-prone characteristic. The layout plan of the mining area for working face 1,304 is shown in Figure 1.
In addition, the pore structure of coal samples was characterized using the non-destructive nuclear magnetic resonance system. The magnetic field intensity of the test system is 0.3 ± 0.05 t, the operating temperature is 32°C, and the frequency range is 2–30 MHz. The porosity of three typical coal samples is 8.89%, 8.31%, and 8.94%, with an average porosity of 8.71%. The T2 spectra of typical coal samples are shown in Figure 2.
2.2 Numerical modeling
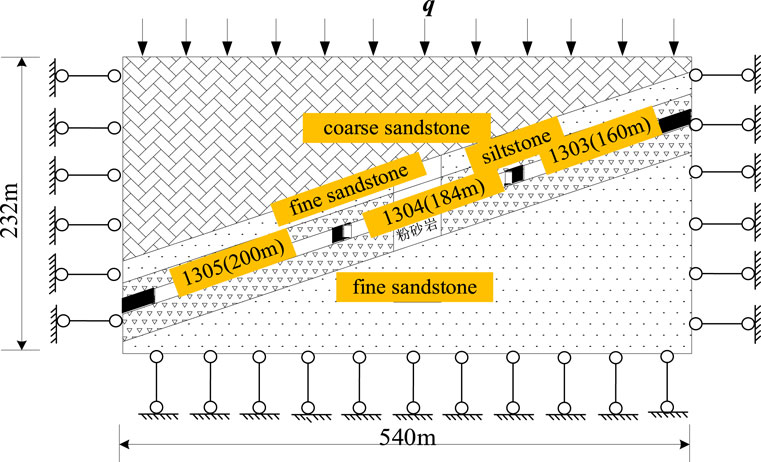
FLAC3D is used to study the energy evolution and abutment pressure of island working faces under the condition of three-sided mining (Wu and Wong, 2012). Based on the energy principle, the distribution of elastic strain energy for coal-rock mass compiled using Fish language in ASD reveals the evolution of the elastic strain energy in front of the coal wall under different advancing steps. The numerical calculation model is established according to the geological conditions of the 1,304 island working face in the Yangcheng Coal Mine. The detailed geometry of the constructed model is shown in Figure 3.
The size of the model is 540 m × 300 m × 232 m (length × wide × height), which consists of 432,000 zones and 451,369 grid points in total. The coal-rock mass is assumed as the elastoplastic material, and the Mohr–Coulomb criterion is adopted. The boundary conditions are horizontal constraints in the x- and y-directions; vertical constraints at the bottom, free boundaries at the top, and equivalent loads (q = γh) in the vertical direction are applied at the top boundary of the model to simulate the self-weight of the overlying strata. γ is the average unit weight of the overlying strata of the model, taken as 24 kN/m3. h is the average distance from the upper part of the model to the surface, taken as 650 m. Thus, the equivalent load can be obtained as 15.3 MPa. The null zone is used to simulate the excavation of two working faces 1,303 and 1,305, which are equivalent to the goaf of working face 1,304. Furthermore, to account for the influence of the boundary effect, 50-m-wide coal pillars are reserved at the boundary along the x-direction, 30-m-wide coal pillars at the boundary along the y-direction, and 5-m-wide roadway protection coal pillars at the sides of the transport drift.
2.3 Physical and mechanical parameters
The mechanical parameters of the coal-rock mass layer in the model are determined according to the actual rock mechanical properties of the Yangcheng Mine, as listed in Table 1. It should be noted that Eb represents the bulk modulus, ρ represents the density, T represents the thickness, Es represents the shear modulus, c represents the cohesion, σt represents the tensile strength, and φ represents the internal friction angle.
According to the mechanical characteristics of the coal-rock mass, the coal-rock mass will be damaged in different forms when the load borne by the coal-rock mass is greater than its ultimate strength and will maintain a certain residual strength after plastic deformation and failure. Therefore, the Mohr–Coulomb criterion is utilized in this study. The modified Mohr–Coulomb model strength criterion is as follows:
where
3 Numerical results
To study the distribution of the abutment pressure of the working face under different advancing steps, the monitoring points are arranged at three positions along the advancing direction of the working face, namely, the side of the transportation drift, the side of the return air drift, and the middle of the working face.
Based on the energy principle, the elastic strain energy density of coal-rock mass compiled by Fish language presented in FLAC3D is used to study the space–time distribution of elastic strain energy density in coal-rock mass in the stope under different advancing steps. The characteristics of strain energy are adopted to reveal the dynamic response in the mining process of the working face. By setting up coal pillars with different widths, the distribution of the inner abutment pressure and the residual elastic strain energy in the coal pillars under different coal pillar widths is obtained. The instability failure of the coal pillars in the isolated working face can be revealed. After the simulated calculation is completed, the values of the monitoring points are exported. The data processing software applications are used to obtain the distribution of the abutment pressure and elastic strain energy in front of the coal wall. The results are analyzed to obtain the cloud nephogram of the abutment pressure and the elastic strain energy in front of the coal wall. Finally, the stress distribution and the evolution of energy accumulation are quantitatively obtained.
3.1 Abutment pressure of the isolated working face
3.1.1 Influence of the excavation step on abutment pressure
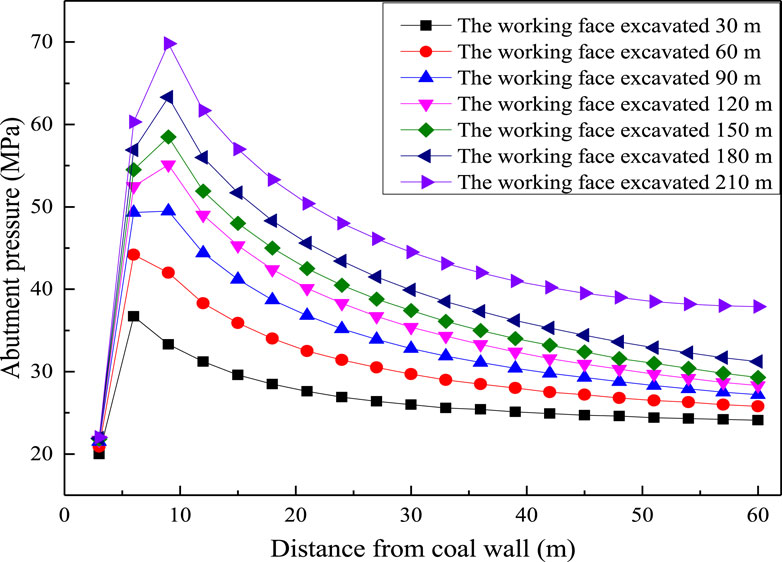
This section discusses the impact of different excavation steps on the hazard risk of an isolated working face by obtaining the distribution of abutment pressure in front of the isolated working face under seven excavation steps, namely, 30, 60, 90, 120, 150, 180, and 210 m. According to the built-in data output and post-processing functions, the stress of each unit of coal-rock strata is derived. Figure 4 shows the bearing abutment distribution in front of the coal wall of the isolated working face. It should be noted that the stress concentration coefficient is the ratio of the maximum stress to the average stress.
Figure 4 shows that the abutment pressure in front of the coal wall of the working face increases to the peak stress in a positive exponential relationship at first and then gradually decreases to the original rock stress in a negative exponential relationship, showing an upward convex trend. With the increase in the advancing step, the peak abutment pressure in front of the working face gradually increases, and the peak stress appears at 8∼10 m in front of the working face. With the increase in the advancing step, the concentration coefficient of peak stress gradually increases, and the influence range of the abutment pressure of the working face gradually increases. When the working face advances 30 m, the peak abutment pressure in front of the coal wall of the working face is 36.7 MPa, and the stress concentration coefficient is 2.45. When the working face is advanced by 90 m, the peak abutment pressure in front of the working face is 49.5 MPa, and the stress concentration coefficient is 3.3. The hazard risk is relatively high when the working face is advanced by 30 m. When the advancing distance of the working face is advanced by 150 m, the peak abutment pressure in front of the working face is 58.5 MPa, and the stress concentration coefficient is 3.9. When the working face is advanced by 180 m, the peak abutment pressure in front of the working face is 63.3 MPa, and the stress concentration coefficient is 4.22. The stress concentration is relatively high when the working face is advanced by 90 m, and the hazard risk is correspondingly increased. When the advancing distance of the working face is advanced by 210 m, the peak abutment pressure in front of the coal wall is 69.8 MPa, and the stress concentration coefficient is 4.65. It can be further inferred that with the continuous advancement of the working face, the stress gradient in front of the working face gradually increases. The stress concentration coefficient exceeds the critical value of the hazard risk, indicating that the hazard risk in the working face gradually increases.
3.1.2 Influence of buried depths on abutment pressure
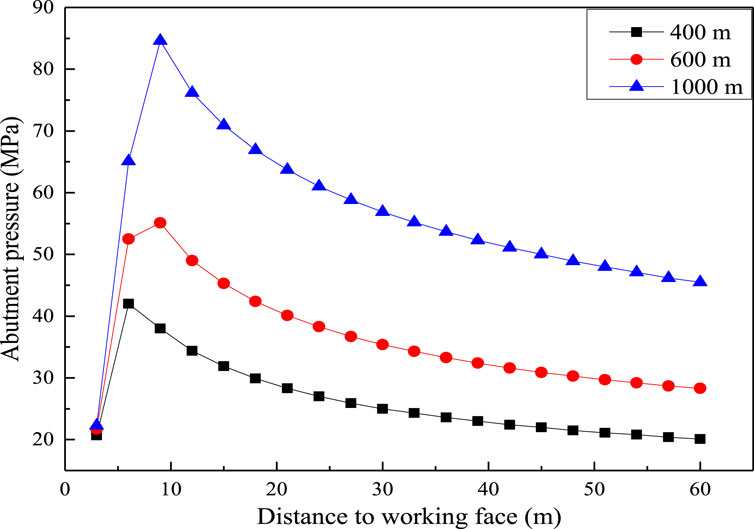
In this section, we discusses the influence of different coal seam depths on the impact risk of isolated working faces by studying the distribution of the abutment pressure in front of the isolated working faces under three buried depths, namely, 400, 600, and 1,000 m.
The distribution of the abutment pressure in front of the island working face under different buried depths is shown in Figure 5. Figure 5 shows that the peak abutment pressure is 42 MPa when the buried depth of the coal seam is 400 m. The concentration coefficient is 4.2. The position of peak stress is 6 m away from the working face. When the buried depth of the coal seam is 600 m, the peak abutment pressure in front of the working face is 52.5 MPa. The concentration coefficient of peak stress is 3.5. The peak stress position is 8 m away from the coal wall of the working face. When the buried depth is 1,000 m, the peak abutment pressure in front of the working face is 84.6 MPa. The concentration coefficient of peak stress is 3.38. The position is 10 m away from the working face. Compared with the different buried depths of the coal seam, the peak abutment pressure in front of the coal wall gradually shifts to the deep part of the coal seam. With the increase in the buried depth, the abutment pressure in front of the coal wall increases first and then decreases. The underlying physical mechanisms of this phenomenon are multifaceted and involve the interaction of various factors. With the increase in the buried depth, the self-weight stress transmitted by overlying strata is intensified, which causes the abutment pressure of working face to increase primarily. This phenomenon manifests itself in a more pronounced stress concentration as the coal-rock is subjected to enhanced compression. In addition, the mechanical properties of coal-rock change with the increase in buried depth. At deeper depths, the evolution of peak stress may migrate deeper into the coal seam, thus reducing the peak stress near the coal wall. In addition, as the depth of burial increases, the overlying rock tends to be rigid, thus storing more elastic energy, which leads to an increase in stress intensity. However, after a certain critical depth, the plasticity of coal-rock mass increases, the ability of rock strata to transfer stress weakens, and eventually, the peak stress decreases.
3.2 Elastic strain energy of the isolated working face
3.2.1 Elastic strain energy density
According to the principle of strain energy density of the elastomer under a three-dimensional stress state derived in elasticity,
where U is the strain energy density of the elastomer, kJ/m3;
The elastic body is regarded as an isotropic body. According to the generalized Hooke’s law, the relationship between stress and strain at any point in the elastic body is
where E is the modulus of elasticity, μ is the lateral pressure coefficient, and G is the shear modulus.
There is a relationship among E, μ, and G:
Substituting Equations 3, 4 into Equation 2, the strain energy density expressed by the stress component is
From Equation 5, it can be found that the strain energy of the roof rock under the three-dimensional stress state is in a quadratic relationship with its internal stress, that is, the higher the stress on the coal-rock in front of the coal wall, the greater the accumulated elastic strain energy.
3.2.2 Influence of the excavation step on elastic strain energy
Based on the built-in data output and post-processing functions of FLAC3D, six stress components of each unit of coal and rock strata in the middle of the working face are derived, and the elastic strain energy distribution of coal-rock strata along the advancing direction is calculated by substituting Equation 7, as shown in Figure 6.
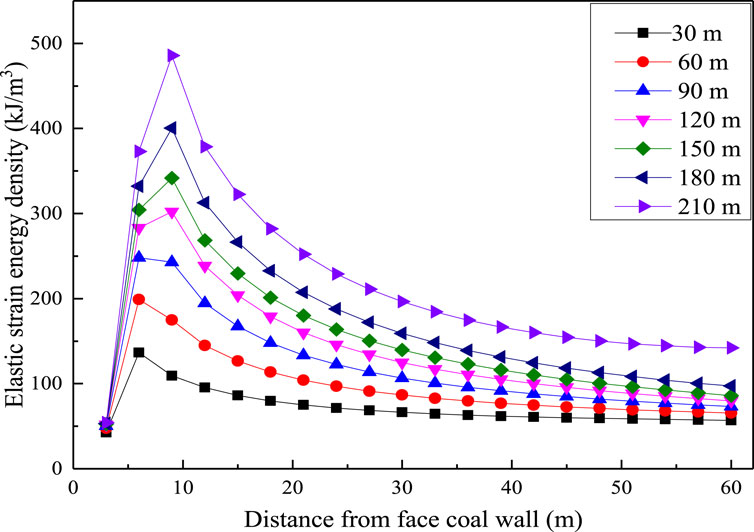
Figure 6. Elastic strain energy distribution curve of the working face in the direction of face advance.
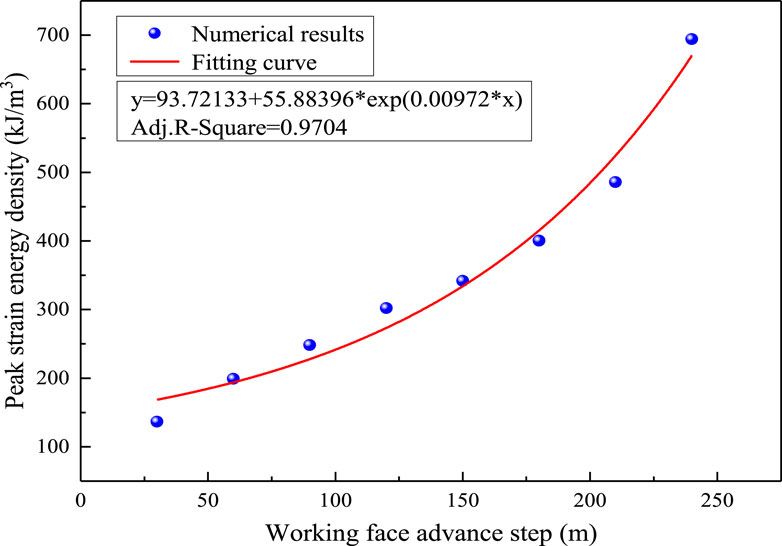
Figure 6 shows that the peak strain energy gradually increases. The peak elastic strain energy is located 8 m in front of the coal wall of the working face with increasing excavation steps. With the increase in the advancing distance of the working face, the elastic strain energy in front of the working face increases. The hazard risk in front of the working face increases accordingly. When the excavation step is 30 m, the peak strain energy is 136.43 kJ/m3. The roof rock layer of the working face is subject to large bending deformation, which causes elastic energy accumulation in the coal layer. Compared with the advancing distance of 30 m, the elastic strain energy in front of the coal wall of the working face increases slightly under the condition of the working face of 60 m. The peak strain energy density is 198.9 kJ/m3, and the peak strain energy also appears 8 m in front of the coal wall. When the working face is advanced by 90 m, the elastic strain energy in front of the working face continues to increase. The peak strain energy density is 248.27 kJ/m3. When the working face is advanced by 120 m, the peak elastic strain energy in front of the working face is 302.19 kJ/m3, which is significantly higher than that of 90 m. When the advancing distance of the working face is 150 m, the peak strain energy in front of the working face is 341.79 kJ/m3. When the excavation step is 180 m, the elastic strain energy density reaches 400.5 kJ/m3. When the working face is advanced by 210 m, the peak elastic strain energy reaches 485.65 kJ/m3.
In the process of underground coal mining, the forward movement of the working face will cause a change in the stress distribution in the front and adjacent areas of the coal seam, which has a significant impact on the coal pillar. These pillars absorb most of the stress transmitted by the overlying rock, resulting in a large expansion of the stress concentration area. This expansion is accompanied by a sharp increase in the elastic energy density within these regions. In addition, the advance of the working face disrupts the initial stress balance, resulting in the elastic deformation of rock strata and coal seams. This deformation is physically manifested as an accumulation of energy or a significant increase in elastic energy density. With the increase in the mining step, the deformation of the coal seam and surrounding rock is more obvious, the stress adjustment speed is faster, and more elastic energy is accumulated. Therefore, with the advance of the working face and the increase in the mining step, the elastic energy density in the unexcavated coal seam in front also increases due to the continuous stress transfer process.
The relationship between the peak of strain energy density in front of the coal wall and the excavation step is fitted, as shown in Figure 7, and the fitting formula is obtained:
From Equation 6, it can be found that the correlation coefficient R2 is 0.9704. With the increase in the excavation step, the peak elastic strain energy in front of the working face gradually increases, and the impact hazard of the working face also gradually increases.
3.2.3 Influence of burial depths on elastic strain energy
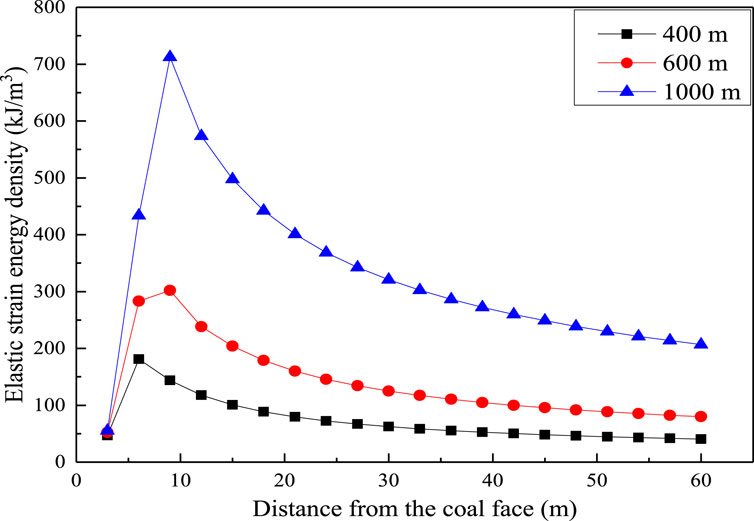
To reveal the influence of the burial depth on the strain energy of coal wall, this section takes a mining height of the coal seam of 7.5 m as the fixed value and the buried depth of the coal seam as the variable to investigate the evolution of elastic strain energy in front of the isolated working face under the three buried depths of 400, 600, and 1,000 m.
Based on the built-in data output and post-processing function of FLAC3D, the distribution curve of elastic strain energy density in front of the working face at different buried depths is calculated by deriving six stress components of each unit of the coal rock strata under three cases of 400, 600, and 1,000 m, and substituting them into Equation 5, as shown in Figure 8. It can be found that the peak elastic strain energy in front of the working face is 181.07 kJ/m3 when the mining depth is 400 m. The peak elastic strain energy density is 6 m away from the coal wall of the working face. When the buried depth is 600 m, the peak elastic strain energy in front of the working face is 302.19 kJ/m3. The distance between the peak strain energy is 9 m away from the coal wall of the working face. When the buried depth increases to 1,000 m, the peak elastic strain energy in front of the working face is 712.22 kJ/m3. The peak elastic strain energy is 10 m away from the coal wall of the working face. Compared with the burial depths of 400 and 600 m, the peak elastic strain energy gradually shifts to the inner of the coal seam when the burial depth increases to a deeper depth.
4 Coal burst risk assessment
4.1 Impact risk assessment of the 1,304 working face
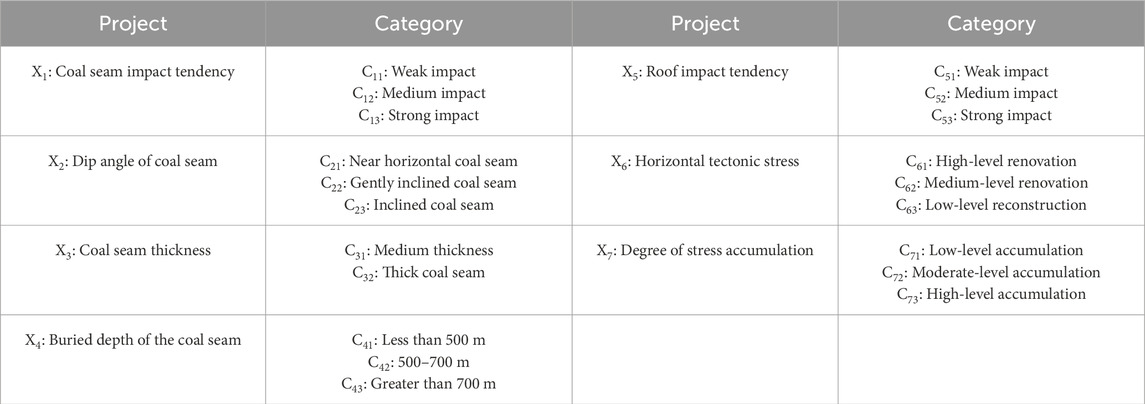
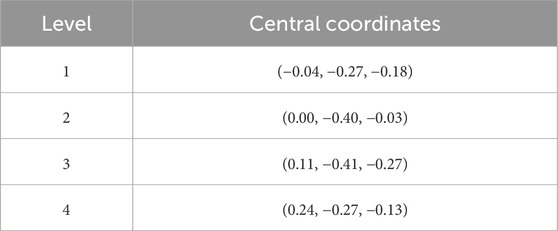
The 1,304 working face is an island working face, and the mine has potential impact risk. To obtain the hazard score coordinates of the region, we can substitute the reaction values of the working face on different items and categories, which are (0, 1, 0), (0, 1, 0), (0, 0, 1), (1, 0, 0), (0, 1, 0), (0, 0, 1, 0), and (0, 0, 1) into the discriminant score function. Subsequently, the distance from this point to the center coordinates of the four grades are 0.3159, 0.3165, and 0.3155 m. Finally, according to the shortest distance theory, the score coordinate of the evaluation area is close to the center coordinate listed in Table 2 (level 4). Therefore, the impact hazard level of the 1,304 island working face is 4; that is, it is a strong impact risk.
The coal burst of the working face is affected by numerous factors such as the physical and mechanical properties of coal-rock mass, geological overview, and mining technical conditions. In quantitative theory, qualitative variables are regarded as items. The various possible situations of items are regarded as categories. Based on the analysis of the factors affecting the induced coal burst, the risk evaluation model of mine coal burst is established by using the relevant theory. The risk of mine regional coal burst is evaluated by using the evaluation model. Based on the specific mining conditions and geological situation of the working face, this study divides the coal burst risk degree of the island working face into four grades: 1, no coal burst risk; 2, weak shock hazard; 3, moderate shock hazard; and 4, strong shock hazard.
4.2 Quantitative theory modeling
In order to obtain modeling data, 60 modeling samples are determined from previous literature and engineering cases, that is, 16 level-1 samples (n1 = 16), 16 level-2 samples (n2 = 16), 16 level-3 samples (n3 = 16), and 12 level-4 samples (n4 = 12). It is specified that when a sample reacts on Cjk (j = 1, 2, 7; k = 1, 2, 3), the value is 1; otherwise, it is 0. According to the major influencing factors inducing the impact hazard of the isolated working face, seven evaluation items are given. In the process of establishing the impact risk assessment model of the isolated working face, the key geomechanical and geotechnical conditions related to the impact risk of the isolated working face are studied by carefully analyzing the selected parameters. The bursting tendency of the coal seam is determined by examining the coal quality type, hardness, and explosive ability of the coal seam, which directly affect the response of the coal seam to sudden pressure change. There is a significant correlation between the hardness of coal and its bursting. The direction of the coal seam affects the stress distribution and may lead to increased stress concentration in some areas, thus increasing the risk of the isolated face. The thickness of the coal seam is the decisive factor of stress release in the process of extraction. The thicker the coal seam, the greater the elastic energy, the greater the energy released in the process of mining, and the greater the possibility of impact risk in the isolated working face. The buried depth affects the ground pressure of the coal seam, and the deeper coal seam bears more ground pressure, which increases the possibility and severity of stress concentration, and is easy to be harmed by the impact of the isolated working face. In addition, geological discontinuities, such as roof conditions, play a crucial role in explaining stress transfer within coal seams. The coal seam with a complex structure or through multiple fracture zones has greater risk of stress concentration and coal seam explosion. In addition, the site stress conditions and cumulative stress levels are considered, which reflect the overall state of stress changes and stress accumulation caused by mining activities. Each project is divided into several categories, of which there are k categories in the j project. A total of 20 categories are listed in Table 2.
4.2.1 Modeling proposed
Using δti (j,k) represents the reaction value of the ith sample in the tth hazard level on the jth item and the kth category. After δti (j,k) is arranged in the original order, the reaction matrix is
According to the quantitative theory, the risk score model is
where
Then, Substituting Equations 9, 10 into Equation 8, can be expressed as
According to the Fisher principle, the problem of category score b in Equation 11 can be transformed into fnding the maximum characteristic root of its characteristic equation λ:
The corresponding equation satisfies the eigenvector:
Among Equations 12, 13,
Equations 14, 15 are the inter-group dispersion matrix and total dispersion matrix, respectively. Among Equations 16–19, Both
As matrices C and D are singular matrices, we refer to the solution given by Dong (1979). The score vectors of three categories are calculated using MATLAB, and the corresponding characteristic roots are 1.10, 0.32, and 0.51, respectively.
The mean vector of the sample response of the tth risk level is recorded as
The discriminant function is obtained by substituting it into Equations 20–23, and three scores are obtained, denoted as
V(t) is the central coordinate of the sample score of the tth hazard level, and the central coordinates of the four levels are obtained from Equation 24, as listed in Table 3.
The evaluation standard is based on the principle of minimum distance. Taking 3D analysis as an example, a certain place in the mine is considered, its response value δ (j,k) on various items is investigated and brought into the discriminant function, and three scores, namely, y1, y2, and y3, are obtained, recorded as V = (y1, y2, y3)T. In l dimensional Euclidean space, the distance from inspection point v to each central coordinate X. If
4.2.2 Modeling verification
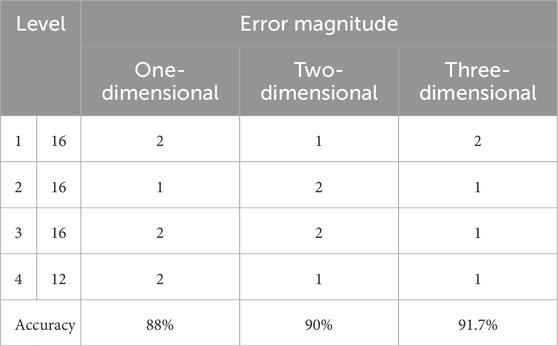
The model has three scoring functions, so one-dimensional, two-dimensional, and three-dimensional evaluation methods can be used to train the model. The test results of the one-dimensional evaluation analysis are only the first score function and the first component of (V1–V4); the two-dimensional evaluation analysis using the first two score functions and the first two components of (V1–V4) and the three-dimensional evaluation analysis are listed in Table 4.
Table 4 shows that compared with the 1D and 2D evaluation results, the accuracy obtained using the 3D analysis method is higher, and the corresponding evaluation effect is relatively ideal. Therefore, the 1D and 2D analysis results are ignored. Finally, the 3D evaluation results are taken as the analysis method of hazard risk evaluation of 1,304 island working face in this study.
4.3 Analysis of electromagnetic radiation of 1,304 working face
It is well known that electromagnetic radiation from coal-rock is a phenomenon where electromagnetic energy is emitted outward during the deformation and fracture of coal-rock under load. The occurrence of a rock burst is the process of mass energy release when the strength limit of the coal-rock mass is reached after the process of energy accumulation. Figure 9 shows the evolution of electromagnetic radiation information in the advanced roadway in front of the coal wall of the working face. It is important to note that the horizontal axis dates in Figure 9 range from 1 August 2012 to 30 September 2012. As observed in Figure 9, the electromagnetic radiation intensity and pulse number of the coal body fluctuated around the normal value during August 1–August 8 and August 27–September 4, indicating that the internal stress level of the coal body was normal during these two periods. From August 9 to August 14 and from September 5 to September 12, the electromagnetic radiation intensity and pulse number of coal continued to increase significantly, with the amplitude of increase reaching or even exceeding about 10 times the normal value, suggesting a sharp increase in stress during these periods. The higher stress levels led to intensified internal fracturing and friction within coal, resulting in stronger electromagnetic radiation signals. On August 25, an abnormal electromagnetic radiation signal with a pulse number of up to 1 × 10⁵ was recorded, which was analyzed as an electromagnetic field interference signal. Before the “8.14 event” and “9.12 event,” the electromagnetic radiation intensity and pulse number of the coal body had been continuously increasing. It can be concluded that there is usually a period of continuous increase in the internal stress of the coal body before a rock burst occurs, and it is the continuous and sharp increase in the internal stress of the coal body that triggers the rock burst event.
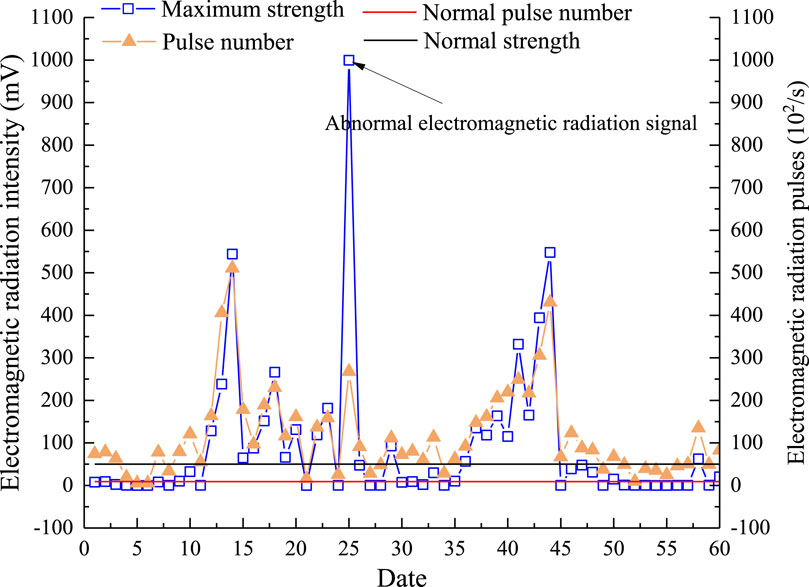
Figure 9. Evolution of the electromagnetic radiation signal at an advance of 30 m of the working face (Wang et al., 2014).
Based on the above analysis, it was found that the silent period of micro-seismic events, the continuously increasing period of electromagnetic radiation intensity of the coal body, and the continuously increasing period of the electromagnetic radiation pulse number of the coal body are the precursor information of rock burst. These precursor information are converted into early-warning parameters of rock burst, and a multi-parameter early-warning method of rock burst precursor information needs to be proposed. Therefore, when the working face is judged to be at risk of rock burst, the drilling cutting method is used to identify the localized areas at risk of rock burst. Subsequently, pressure relief measures such as blasting, coal seam water injection, and drilling pressure-relieving holes are used to decompress and mitigate the risk in the coal seam until the danger of rock burst is eliminated.
5 Conclusion
(1) With the increase in the advancing step, the abutment pressure and elastic strain energy density in front of the working face increase to the maximum in a positive exponential relationship at first and then decrease due to in situ stress, which presents an upward convex trend. The influence range of the abutment pressure of the working face gradually increases.
(2) With the increase in coal thickness and burial depth, the peak abutment pressure and elastic strain energy density in front of the coal wall gradually increase. The position of occurrence gradually moves away from the coal wall. The concentration coefficient of peak strength gradually increases, indicating that the deeper the coal seam is, the greater the possibility of coal burst.
(3) Based on the quantitative theory and the minimum distance principle, the impact risk assessment model of isolated working faces is established. Compared with the evaluation results of one-dimensional and two-dimensional analyses, the accuracy of the three-dimensional analysis method is relatively higher, indicating that the accuracy of the evaluation effect is higher.
Data availability statement
The original contributions presented in the study are included in the article/Supplementary Material; further inquiries can be directed to the corresponding author.
Author contributions
GL: methodology and writing–original draft. RL: funding acquisition and writing–review and editing. LH: software, visualization, and writing–original draft. ML: data curation, formal analysis, and writing–original draft. JZ: data curation, formal analysis, and writing–original draft.
Funding
The author(s) declare that financial support was received for the research, authorship, and/or publication of this article. This study was financially supported by the China Postdoctoral Science Foundation (No. 2023MD744136), the Special Project of Postdoctoral Research in Chongqing (No. 2022CQBSHTB3109), the Opening Project of the Key Laboratory of Safety and High-efficiency Coal Mining, Ministry of Education (JYBSYS202306), and the Opening Project of Sichuan Province University Key Laboratory of Bridge Non-destruction Detecting and Engineering Computing (2022QZJ01), Aid Program for the Science and Technology Innovative Research Team in Higher Educational Institutions of Hunan Province.
Conflict of interest
The authors declare that the research was conducted in the absence of any commercial or financial relationships that could be construed as a potential conflict of interest.
Publisher’s note
All claims expressed in this article are solely those of the authors and do not necessarily represent those of their affiliated organizations, or those of the publisher, the editors, and the reviewers. Any product that may be evaluated in this article, or claim that may be made by its manufacturer, is not guaranteed or endorsed by the publisher.
References
Ahmad, M., Hu, J. L., Hadzima-Nyarko, M., Ahmad, F., Tang, X. W., Rahman, Z. U., et al. (2021). Rock burst hazard prediction in underground projects using two intelligent classification techniques: a comparative study. Symmetry 13 (4), 632. doi:10.3390/sym13040632
Cao, A. Y., Liu, Y. Q., Yang, X., Li, S., and Liu, Y. P. (2022). FDNet: knowledge and data fusion-driven deep neural network for coal burst prediction. Sensors (Basel) 22 (8), 3088. doi:10.3390/s22083088
Cao, J. R., Dou, L. M., He, J., Xie, J. H., Han, Z. P., and Wang, S. W. (2023). Mechanism of the coal bursts in the working face during mining of steeply inclined and extra thick coal seam. Geomatics, Nat. Hazards Risk 14 (1), 2206511. doi:10.1080/19475705.2023.2206511
Di, Y. Y., Wang, E. Y., Li, Z. H., Liu, X. F., Huang, T., and Yao, J. J. (2023). Comprehensive early warning method of microseismic, acoustic emission, and electromagnetic radiation signals of rock burst based on deep learning. Int. J. Rock Mech. Min. Sci. 170, 105519. doi:10.1016/j.ijrmms.2023.105519
Dong, H. S., Zhao, K. Y., and Li, M. (2013). Improvement of analytic hierarchy process and its application for coal mine safety assessment. Appl. Mech. Mater. 368–370, 1979–1984. doi:10.4028/www.scientific.net/amm.368-370.1979
Dong, W. Q., Zhou, G. Y., and Xia, X. (1979). The theory of quantification and its application [M]. Changchun: Jilin People Publishing House.
Dou, L. M., Cai, W., Cao, A. Y., and Guo, W. C. (2018). Comprehensive early warning of rock burst utilizing microseismic multi-parameter indices. Int. J. Environ. Sci. Tech. 28, 767–774. doi:10.1016/j.ijmst.2018.08.007
Du, J. S., Chen, J., Pu, Y. Y., Jiang, D. Y., Chen, L. L., and Zhang, Y. R. (2021). Risk assessment of dynamic disasters in deep coal mines based on multi-source, multi-parameter indexes, and engineering application. Process Saf. Environ. Prot. 155, 575–586. doi:10.1016/j.psep.2021.09.034
Guo, W. Y., Gu, Q. H., Tan, Y. L., and Hu, S. C. (2019). Case studies of rock bursts in tectonic areas with facies change. Energies 12 (7), 1330. doi:10.3390/en12071330
Guo, W. Y., Zhao, T. B., Tan, Y. L., Yu, F. H., Hu, S. C., and Yang, F. Q. (2017). Progressive mitigation method of rock bursts under complicated geological conditions. Int. J. Rock Mech. Min. Sci. 96, 11–22. doi:10.1016/j.ijrmms.2017.04.011
Hao, X. T., and Niu, H. (2014). Research on gas content prediction model of hebi No. 6 mine based on quantification theory. Appl. Mech. Mater. 3044 (535), 614–621. doi:10.4028/www.scientific.net/amm.535.614
He, J., Dou, L. M., Gong, S. Y., Li, J., and Ma, Z. Q. (2017). Rock burst assessment and prediction by dynamic and static stress analysis based on microseismic monitoring. Int. J. Rock Mech. Min. Sci. 93, 46–53. doi:10.1016/j.ijrmms.2017.01.005
He, M. C., Cheng, T., Qiao, Y. F., and Li, H. R. (2023). A review of rockburst: experiments, theories, and simulations. J. Rock Mech. Geotech. Eng. 15 (5), 1312–1353. doi:10.1016/j.jrmge.2022.07.014
Hu, X. C., Yang, S. Q., Zhou, X. H., Zhang, G. X., and Xie, B. B. (2014). A quantification prediction model of coalbed methane content and its application in Pannan coalfield, Southwest China. J. Nat. Gas. Sci. Eng. 21, 900–906. doi:10.1016/j.jngse.2014.10.017
Li, P., Liu, Y., Cai, M. F., Miao, S. J., Dai, L. P., and Gorjian, M. (2024). Accurate stress measurement using hydraulic fracturing in deep low-permeability reservoirs: challenges and research directions. Adv. Geo-Energy Res. 14 (3), 165–169. doi:10.46690/ager.2024.12.02
Li, S. J., Kuang, Z. H., Xiao, Y. X., Qiao, Z. B., and Yang, W. B. (2022). Rockburst tendency prediction based on an integrating method of combination weighting and matter-element extension theory: a case study in the Bayu Tunnel of the Sichuan-Tibet railway. Eng. Geol. 308, 106796. doi:10.1016/j.enggeo.2022.106796
Li, X. L., Chen, S. J., Wang, E. Y., and Li, Z. H. (2021). Rockburst mechanism in coal rock with structural surface and the microseismic (MS) and electromagnetic radiation (EMR) response. Eng. Fail. Anal. 124, 105396. doi:10.1016/j.engfailanal.2021.105396
Liu, Y., Ouyang, Z. H., Yi, H. Y., and Qin, H. Y. (2023). Study of the multilevel fuzzy comprehensive evaluation of rock burst risk. Sustainability 15 (17), 13176. doi:10.3390/su151713176
Pan, J., Liu, S., Qin, Z., Wang, S., Zhang, C., and Ma, W. (2018). Mechanism and prevention of concentrated static load type rock burst of roadway group in deep mining area. J. China Coal Soc. 43 (10), 2679–2686. doi:10.13225/j.cnki.jccs.2018.0016
Sun, J., Wang, L. G., Zhang, H. L., Wang, L. G., and Shen, Y. F. (2009). Application of fuzzy neural network in predicting the risk of rock burst. Procedia Earth Planet. Sci. 1 (1), 536–543. doi:10.1016/j.proeps.2009.09.085
Tai, Y., Yu, B., Kuang, T. J., Shi, B. W., Meng, X. B., and Fu, M. Q. (2022). An innovative technology of fracturing hard strata from the ground for precontrol of rock burst in a coal mine. Energy Sci. Eng. 11, 565–584. doi:10.1002/ese3.1346
Tang, S. F., Tong, M. M., Qin, H. P., Hu, J. L., and He, X. M. (2010). The acoustic emission experiment system of rock outburst in water inrush. J. Min. Saf. Eng. 27 (03), 429–432 + 437.
Wang, C. L., Wu, A. X., Lu, H., Bao, T. C., and Liu, X. H. (2015). Predicting rock burst tendency based on fuzzy matter-element model. Int. J. Rock Mech. Min. Sci. 75, 224–232. doi:10.1016/j.ijrmms.2015.02.004
Wang, C. Q., Jiang, B. Y., Gu, S. T., Tan, Y. L., Wang, R. C., and Huang, R. F. (2014). Study of precursor information recognition and multiparameter early warning before rockburst of island fully mechanized caving face. Rock Soil Mech. 35 (12), 3523–3530. doi:10.16285/j.rsm.2014.12.023
Wang, J. X., Wang, E. Y., Yang, W. X., Li, B. L., Li, Z. H., and Liu, X. F. (2022). Rock burst monitoring and early warning under uncertainty based on multi-information fusion approach. Measurement 205, 112188. doi:10.1016/j.measurement.2022.112188
Wang, P., Gu, S. C., and Sun, W. (2024). Roadway rock burst prediction based on catastrophe theory. Sci. Rep. 14, 7321. doi:10.1038/s41598-024-58072-0
Wang, X., Liu, S., Liu, X., Shan, T., Zhou, X., Xie, H., et al. (2024b). Mode I fracture propagation and post-peak behavior of sandstone: insight from AE and DIC observation. Eng. Fract. Mech. 302 (110093), 110093–110115. doi:10.1016/j.engfracmech.2024.110093
Wang, X., Liu, X., Wang, E., Liu, S., Shan, T., and Labuz, J. F. (2024a). Microcracking characterization in tensile failure of hard coal: an experimental and numerical approach. Rock Mech. Rock Eng. 57, 6441–6460. doi:10.1007/s00603-024-03827-4
Wang, X. Z., Chen, J. J., Li, P., She, X., and Niu, G. Y. (2012). Gas leakage prediction model of large-scale explosions in hard rock based on quantification theory. Transp. Porous Med. 95 (1), 171–183. doi:10.1007/s11242-012-0037-6
Wen, J. L., Li, H. S., Jiang, F. X., Yu, Z. X., Ma, H. T., and Yang, X. L. (2019). Rock burst risk evaluation based on equivalent surrounding rock strength. Int. J. Min. Sci. Techno. 29 (4), 571–576. doi:10.1016/j.ijmst.2019.06.005
Wu, S. C., Wu, Z. G., and Zhang, C. X. (2019). Rock burst prediction probability model based on case analysis. Tunn. Undergr. Sp. Tech. 93, 103069. doi:10.1016/j.tust.2019.103069
Wu, Z. J., and Wong, L. N. Y. (2012). Frictional crack initiation and propagation analysis using the numerical manifold method. Comput. Geotech. 39, 38–53. doi:10.1016/j.compgeo.2011.08.011
Xie, H. P., Gao, F., Ju, Y., Gao, M. Z., and Xie, L. Z. (2015). Quantitative definition and investigation of deep mining. J. China Coal Soc. 40 (01), 1–10. doi:10.13225/j.cnki.jccs.2014.1690
Xu, L. M., Lu, K. X., Pan, Y. S., and Qin, Z. J. (2019). Study on rock burst characteristics of coal mine roadway in China. Energy Sources, Part A Recovery, Util. Environ. Eff. 44 (2), 3016–3035. doi:10.1080/15567036.2019.1655114
Zhao, T. B., Guo, W. Y., Tan, Y. L., Lu, C. P., and Wang, C. W. (2018b). Case histories of rock bursts under complicated geological conditions. B. Eng. Geol. Environ. 77, 1529–1545. doi:10.1007/s10064-017-1014-7
Zhao, T. B., Guo, W. Y., Tan, Y. L., Yin, Y. C., Cai, L. S., and Pan, J. F. (2018a). Case studies of rock bursts under complicated geological conditions during multi-seam mining at a depth of 800 m. Rock Mech. Rock Eng. 51, 1539–1564. doi:10.1007/s00603-018-1411-7
Zhou, J., Chen, C., Wei, C., and Du, K. (2022). An improved connection cloud model of an updated database: a multicriteria uncertainty model for coal burst liability evaluation. Nat. Resour. Res. 31, 1687–1704. doi:10.1007/s11053-022-10042-x
Keywords: coal burst, risk evaluation, isolated working face, quantitative theory, elastic strain energy density
Citation: Liu G, Lei R, Huang L, Li M and Zhou J (2024) Study on the mining response law and coal burst risk assessment of an isolated working face. Front. Earth Sci. 12:1487505. doi: 10.3389/feart.2024.1487505
Received: 28 August 2024; Accepted: 14 October 2024;
Published: 01 November 2024.
Edited by:
Wen Nie, Jiangxi University of Science and Technology, ChinaReviewed by:
Qibin Lin, University of South China, ChinaXiaoran Wang, China University of Mining and Technology, China
Peng Li, University of Science and Technology Beijing, China
Copyright © 2024 Liu, Lei, Huang, Li and Zhou. This is an open-access article distributed under the terms of the Creative Commons Attribution License (CC BY). The use, distribution or reproduction in other forums is permitted, provided the original author(s) and the copyright owner(s) are credited and that the original publication in this journal is cited, in accordance with accepted academic practice. No use, distribution or reproduction is permitted which does not comply with these terms.
*Correspondence: Ruide Lei, bGVpcnVpZGUxMjNAMTYzLmNvbQ==
 Guojun Liu
 Ruide Lei
 Ling Huang3