- 1Institute of Mineral Resources, Chinese Academy of Geological Sciences, Beijing, China
- 2Research Center for Strategy of Global Mineral Resources, Chinese Academy of Geological Sciences, Beijing, China
Tungsten is an irreplaceable primary material and strategic resource for national economic development and modern national defense security. The endowment of tungsten ore resources in various countries is different; we should not only focus on the availability of tungsten ore itself but also the sustainability of its entire process from upstream supply to downstream industry demand. Analyzing the evolution of the supply and demand patterns of tungsten ore trade from the perspective of the industrial chain, identifying the key supply and demand subjects, and exploring the influencing factors of trade has become an important research topic. Therefore, we construct global tungsten trade networks based on the industrial chain, analyze its overall characteristics, explore critical trade supply and demand entities, and identify China’s trade position. We got some meaningful results: (1) The global tungsten trade networks have prominent power-law distribution characteristics. The trend of trade globalization is evident, but the dominance is still in the hands of a few developed countries or developing countries with developed manufacturing industries. (2) In different parts of the tungsten industry chain, the impact of resource endowment, industrial technology level, and geographical location on the country’s trade role is different. (3) China’s position in the global tungsten resource industry chain and value chain is constantly improving, but there is still a risk of high-end technology being “stuck.” This provides some suggestions for the systematic understanding of the evolution of the trade pattern of the tungsten industry chain and how countries occupy a dominant position in the game of tungsten resources.
1 Introduction
Tungsten is a non-ferrous metal with super hardness and wear resistance, known as “industrial teeth.” Tungsten is scarce and irreplaceable, is an essential means of production for high-end manufacturing and high-end technology in the modern industrial system, and is known as the “backbone of high-end manufacturing” (Lederer et al., 2021). Tungsten is simultaneously listed as a critical and strategic raw material (Jia et al., 2024; Tang et al., 2020). Tungsten mineral resources in the global distribution are not uniform; a small number of high resource endowment countries have a dominant position in the trade market, but due to the downstream deep processing links have a solid technical dependence, making the global tungsten trade pattern with the industrial chain downward extension, gradually show a different pattern from the limitation of resource endowments (Li et al., 2020). Tungsten has a long industrial chain, including mining, smelting, processing, deep processing, application, and other links, and is a critical green raw material for energy transformation. With the acceleration of the green transformation of the global energy system and the impact of the Russia-Ukraine conflict, these green mineral resources have become the focus of contention. Sustainable development is a common goal worldwide (Henckens, 2021; Zhang et al., 2019), and it has also become a global consensus to achieve independent control of the industrial chain. Analyzing the supply, demand, and trade patterns of different links of Tungsten from the perspective of the industry chain is an important research topic for improving the toughness and safety level of the industry chain supply chain.
According to the United States Geological Survey data, in 2022, the world’s tungsten reserves were 4.35 million tons (metal), of which China’s tungsten reserves were 2.38 million tons, accounting for 55%, ranking first in the world (USGS, 2022). China is the world’s largest tungsten resource country, producer, and consumer (Zhu et al., 2019), with rich tungsten resources and a complete industry chain (Liang et al., 2022). Tungsten is an advantageous resource in China, but with the extension of the industrial chain, there are still many “stuck neck” links and risk points in the downstream production of Tungsten in China. It is necessary to analyze China’s position in the global tungsten trade pattern to guide the independent control of China’s energy resources security, important industrial chain supply chain security, and the sustainable development of the tungsten industry.
Supply and demand security is slowly gaining the attention (Novikau, 2022). The contradiction between supply restriction and demand growth inevitably intensifies the competition between tungsten trading countries, and international trade has become a meaningful way to meet the demand for resources (Huang et al., 2021; Kim and Yun, 2022). In international trade relations, the relations between countries are complicated. Countries play different roles in the trade network, different trade scopes, abilities to obtain resources, control resources, etc. (Xi et al., 2020). By accurately identifying the role of countries in international tungsten ore trade, we can better develop trade strategies, ensure the safe operation of national energy resources, and reduce risks. Complex network theory is an effective way to analyse international trade issues (Petridis et al., 2020). It can define the structural relationships in real networks well (Du et al., 2017; Hu et al., 2021). Many scholars have used complex networks to reveal trade networks’ topological and structural relations (Zhao et al., 2023). Scholars have explored the structural features (Liu et al., 2020; Zhang et al., 2019), evolution characteristics (Liu et al., 2024a), community characteristics (Cho et al., 2023; Zhong et al., 2017a), centrality characteristics (Zhang et al., 2022a) and national roles (Guan et al., 2016; Zhong et al., 2017b) of the networks. In recent years, scholars have begun to analyze the changes in trade patterns in combination with the theory of industrial chain (Liu et al., 2024b; Xia et al., 2023) and value chain (Zhang et al., 2022b), which provides a perspective for us to analyze the trade changes of different mineral species from the perspective of industrial chain.
In addition, scholars have carried out extensive research on the international trade of mineral resources. Scholars have studied the trade structure (Dong et al., 2018; Hou et al., 2018), supply and demand pattern (Chen et al., 2024a; Chen et al., 2024b), competitiveness and influencing factors (Wang et al., 2019; Xu et al., 2024), dependency level (Xu-guang et al., 2022; Zhao et al., 2020), risk transmission (Kang et al., 2023) and network robustness (Chen et al., 2022) of mineral products. These studies involved different minerals such as copper, rare earth, zinc, cobalt, graphite, lead, and crude oil. More and more research has been done on the critical mineral species in recent years (Kang et al., 2022; Wu et al., 2021; Xu et al., 2024). The use of complex network methods to study the evolution of trade patterns, and the identification of national status has been widely discussed and recognized. The analysis of mineral resource trade from the perspective of industrial chain is also a trend. Therefore, we combine the complex network and industry chain (Chen et al., 2024b) to study the trade pattern of tungsten ore, analyze the evolution of the tungsten trade pattern from the perspective of the industry chain, and provide specific suggestions for trade stability and supply and demand security.
Therefore, we build global tungsten trade networks and analyze the characteristics of tungsten product trade in different links of the industry chain, aiming to systematically understand the evolution of tungsten trade, identify key trading countries, and provide suggestions for the sustainable development of Tungsten in China. First, we defined the boundaries of the tungsten industry chain and measured the weight of metal tungsten in various tungsten-containing products transferred through international trade activities. Then, we built global tungsten trade networks, analyzed the overall structural characteristics of the network, and identified the position of different countries according to the centrality indicators proposed by Freeman (Freeman, 1979). Finally, we analyzed China’s position in the international tungsten ore trade pattern and import and export changes.
2 Data
We downloaded tungsten product trade data over 10 years, from 2013 to 2022, from the UN Comtrade database. We obtained tungsten ore and concentrate (commodity code 261100), tungstate and Ammonium paratungstate (commodity code 284180), ferrotungsten (commodity code 720280), tungsten mill products (commodity code 8101), and tungsten carbide (commodity code 820900) of the tungsten industry chain product international trade data. Each country has an international ISO country code.
3 Methods
3.1 Tungsten industry chain definition
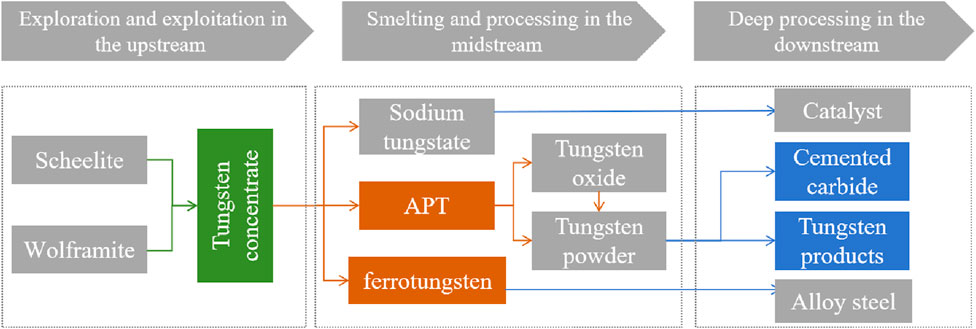
The tungsten industry chain mainly includes four links: upstream exploration and mining, midstream smelting and processing, downstream deep processing, and terminal application. In the upstream link, tungsten concentrate is obtained through exploration, mining, and separation of scheelite and wolframite. Tungsten concentrate is smelted into iron tungsten, ammonium para tungstate (APT), sodium tungstate, and other intermediate products in the middle reaches. In the downstream link, tungsten powder made of ammonium paratungstate and tungsten oxide is mainly used to produce cemented carbide and tungsten products. In the terminal application field, Tungsten is widely used in national defense, aerospace, electronic information, automobile manufacturing, petrochemical energy, photovoltaic industry, etc. It is a crucial chain to support the development of the national industrial system.
Therefore, it is essential to analyze the current global tungsten trade pattern from the perspective of the industrial chain, which has important guiding significance for the industrial development of various countries. This paper mainly considers the trade situation of the first three links. This paper analyzes the tungsten concentrate in the upper reaches, APT and ferrotungsten in the middle reaches and tungsten carbide and tungsten products in the lower reaches, as shown in Figure 1.
3.2 Global tungsten trade network model (GTTN)
We consider the country (region) as a node and the import and export relationship between countries as the edge. In this paper, we use the metal amount of Tungsten (Formula 2) as the weight of the edge. A complex network is composed of nodes and edges between nodes as follows in Equation 1:
where,
Tungsten trade quality refers to the weight of tungsten metal in various types of tungsten-containing products transferred through international trade activities. Therefore, according to the average tungsten content of tungsten-containing products, the trade weight data of various tungsten-containing products are converted into tungsten metal weight as shown in Formula 2:
where,
3.3 Structural characteristics of networks
There are two main aspects involved. From the macroscopic perspective, we analyze the overall structure characteristics of the network (network scale, community characteristics, Cumulative distribution feature). From the microscopic perspective, the important attributes of nodes (degree centrality, betweenness centrality, and closeness centrality) are analyzed, and the roles of different countries are identified.
3.3.1 Macroscopic characteristics of the network
Macroscopic indicators include the network’s scale (the number of nodes and edges), community characteristics, and the Cumulative distribution of edge weights.
(1) Community of trade network.
Community is defined as clusters of nodes with dense intracommunity edges and sparse intercommunity connections (Blondel et al., 2008). It can be represented by modularity in a network, as shown in Formula 3:
where,
3.3.2 Microscopic characteristics of trade network
(1) Diversity and intensity of import and export trade.
Degree refers to the number of edges connected to country
where
(2) The country’s ability to control resources.
Betweenness centrality (BC) measures countries’ roles as mediators and can represent the ability to control resources. If a country repeatedly occupies a position in the path of two countries, its betweenness centrality is high. It is shown in Equation 8.
where
(3) The country’s ability to access resources.
Closeness centrality (CC) can examine the extent to which a country does not rely on other countries to propagate information. Our paper refers to a country’s ability to acquire resources. It refers to the reciprocal of the sum of the shortest distances between a country and all other countries. The formula is shown in Equation 9:
where
4 Results and discussion
We mainly analyze the GTTNs based on the industry chain from three aspects. Firstly, we analyze the overall structural characteristics of the networks, explore their scale and community evolution law, and explore the cumulative characteristics of edge weights. Then, we analyzed export intensity level, resource control ability, and resource acquisition capability, identifying the roles of different countries. Finally, the change of China’s position in global tungsten trade is analyzed.
4.1 Overall structural characteristics of the GTTNs
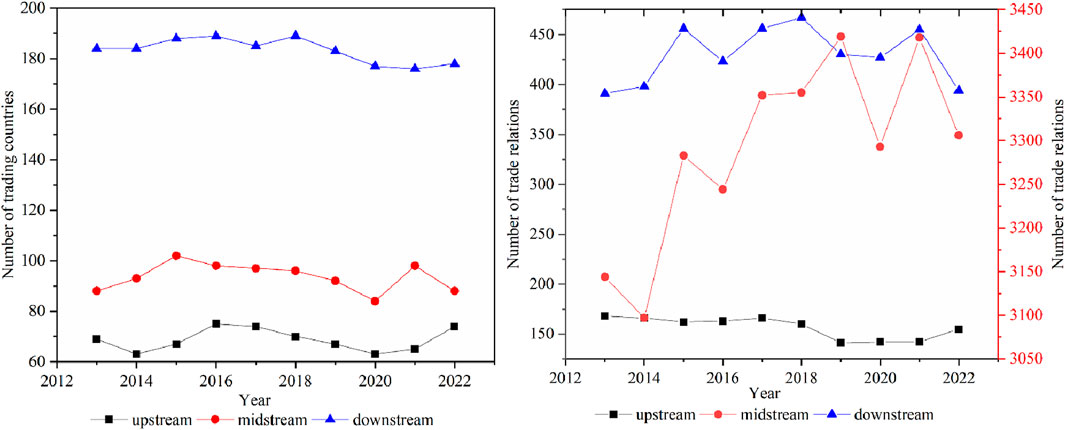
Figure 2 shows the evolution of the number of nodes and edges in the upper, middle, and lower reaches of GTTN. Overall, the number of participating countries changed little over time. Specifically, the number of trading countries in the upper and middle reaches is small, below 100, while there are more than 180 trading countries in the lower reaches. It shows there are more downstream trade participants in the tungsten industry chain. This high probability is related to the uneven distribution of resources and the different resource advantages of countries. There is a big difference in the trade relations in the chart. The number of trade relations between upstream countries is stable at around 150, while the number of trade relations in the middle reaches is the highest, and the number of trade relations in the downstream fluctuates with time. The midstream APT or tungsten iron trade relationship between countries is the most close and complex. Downstream trade relations between countries for tungsten products or cemented carbide have increased over time. Generally speaking, the trade of middle and downstream tungsten products is close.
In Figures 3A–C respectively represent the cumulative distribution of trade volume among countries in the upper, middle, and lower reaches of the global tungsten trading network. As can be seen from Figure 3A, the top 20 percent of the edges in GTUTNs account for more than 90% of the total trade volume, indicating that a small number of edges in the network play an important role in trade exchanges, and there is a power-law distribution. With the evolution of time, this cumulative proportion shows a decreasing state. In GTMTNs and GTDTNs, as shown in Figure 3B, C, the top 10% of the edges account for 90% of the total trade volume, indicating that the power-law distribution characteristics of the middle and downstream networks are more prominent, and fewer trading countries assume the role of tungsten resource trade. This phenomenon is more prominent with the change of time, which shows that the tungsten trade in the middle and lower reaches of Tungsten is increasingly concentrated among a few countries, and individual countries play a more critical role in trade. It shows a severe imbalance in the global tungsten trade, and a few countries have a greater right to speak.
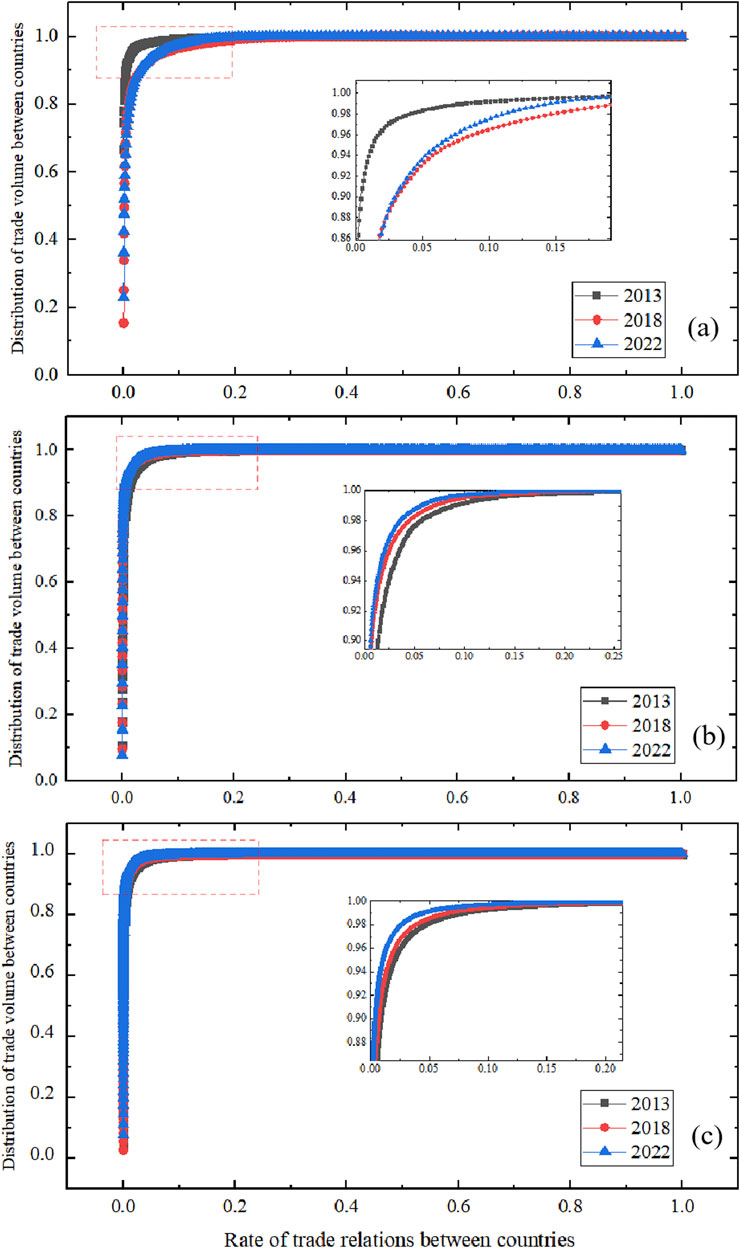
Figure 3. The cumulative distribution of trade volume of tungsten products in GTUTNs, GTMTNs, and GTDTNs is shown in (A–C) respectively.
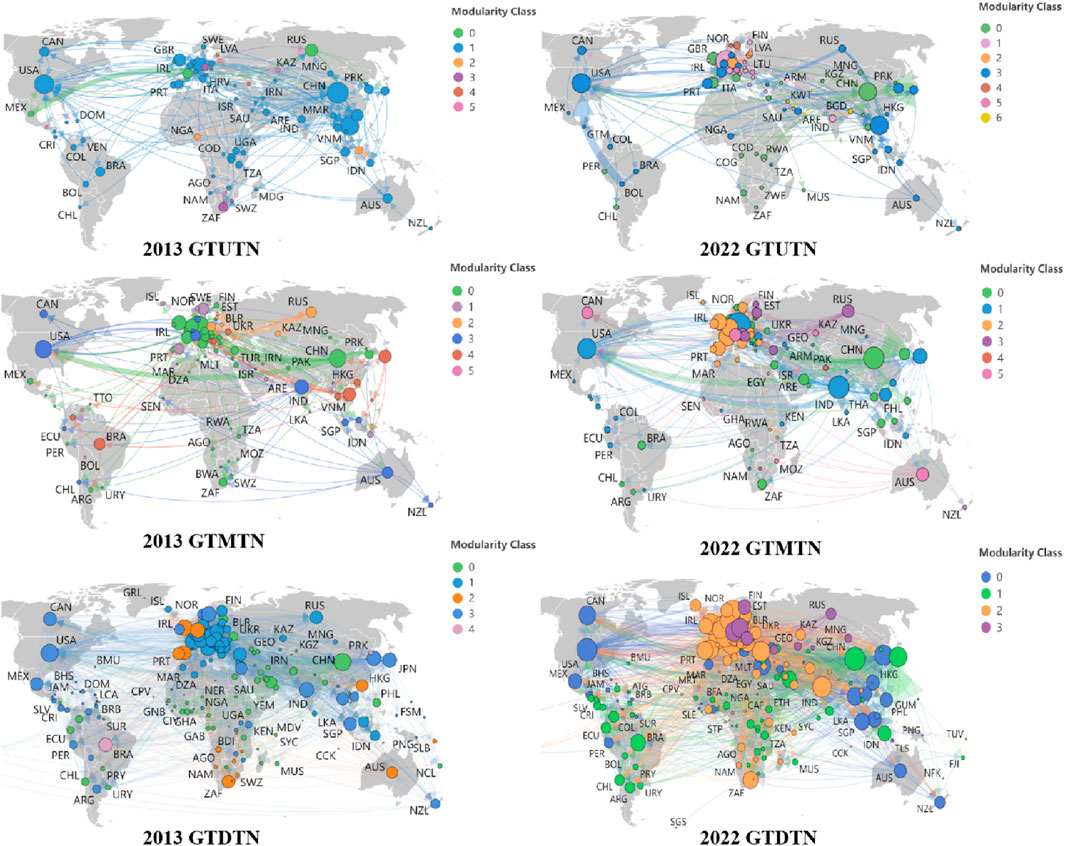
Figure 4 shows the evolution of the community of GTUTNs, GTMTNs, and GTDTNs. The degree value determines the node’s size, representing the country’s trade diversity. Overall, there are four to seven communities in the network. First, by horizontal comparison, the number of upstream communities in GTUTNs in 2013 increased, and communities with CHN, United States, RUS, and ZAF as the central trading countries have gradually formed. In 2022, communities with countries such as CHN, United States, VNM, and NLD as major trading countries were gradually formed. Communities are more concentrated in countries or regions rich in tungsten mineral resources. In GTMTNs, the number of communities in the network has not changed much, with the formation of communities with countries such as DEU, CHN, United States, RUS, SWE, VNM, and BRA as the central trading countries in 2013, and CHN, DEU, United States, RUS, FRA, and AUS as the central trading countries in 2022. The trade communities of midstream products mainly gather in developed countries and countries rich in APT resources. In the GTDTNs, the number of communities has decreased. In 2013, communities were formed with CHN, United States, DEU, GBR, and BRA as the major trading countries. In 2022, communities were formed with CHN, United States, DEU, and CZE as significant trading countries.
The trade of tungsten downstream products has mainly formed national communities, mainly in developed countries or with high manufacturing levels. In different links in the tungsten industry chain, China, the United States, and Germany have been the leading trading countries in the communities. They have more tungsten trade relations with other countries and are essential in trade exchange between communities.
From the longitudinal time scale perspective, the global tungsten product trade has gradually formed the characteristics of community agglomeration in Europe, North America, and Asia. There has been a gradual shift to South America, Africa, Australia, and other countries in recent years. For example, the trade scope of Brazil, South Africa, and Australia has increased and gradually occupies a vital trade role in the community. The globalization trend of tungsten products trade is evident, but the main trading countries are still developed countries, and some developing countries have rich tungsten resources and developed manufacturing industries. This shows that in the global trade of tungsten, there are still some individual countries with developed manufacturing and rich tungsten resources that occupy a dominant position and have a stronger voice.
4.2 Indicators of national capacity levels
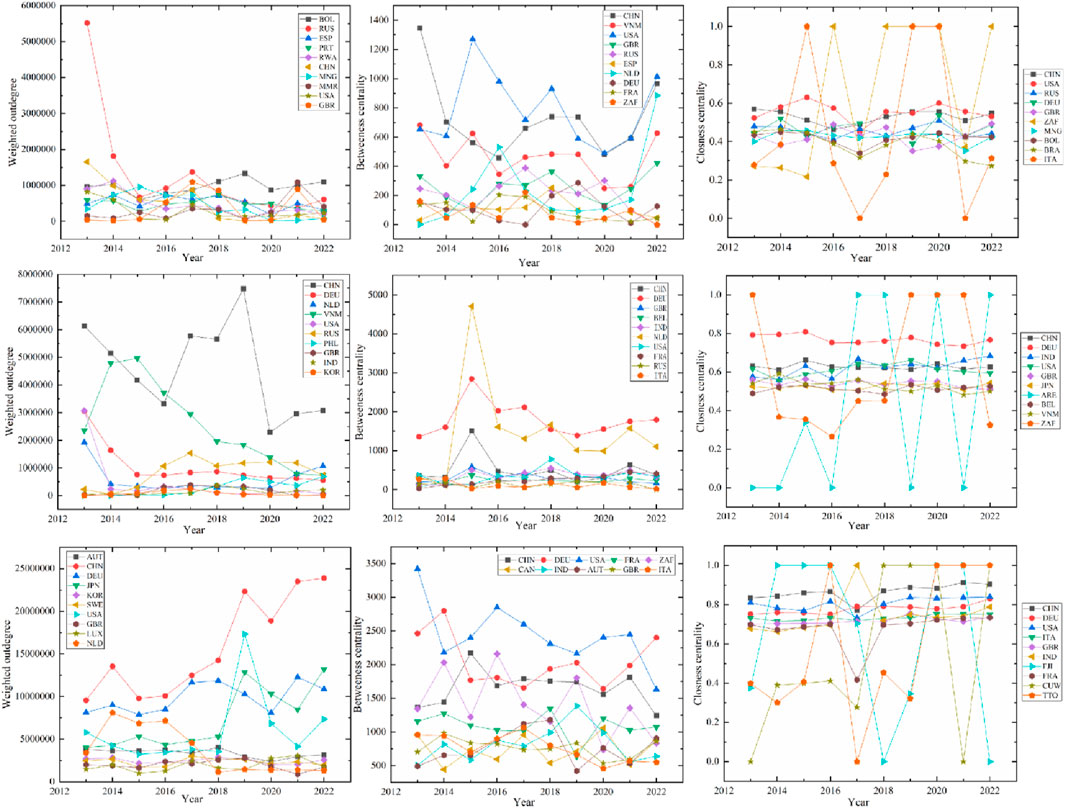
We mainly calculate the level of tungsten trading capacity of different countries in the industrial chain based on centrality, including the weighted outdegree, betweenness centrality, and closeness centrality. These indicators reflect the export strength ability, resource control ability, and resource acquisition capability. To accurately identify the country’s trade role and status, we counted the top ten countries in 2013–2022. Further, we counted the top ten countries with the highest frequency for analysis, as shown in Figure 5.
The figure depicts the changes of national roles in the upstream, midstream, and downstream networks in a top-down manner. In terms of export strength ability, RUS, BOL, ESP, and CHN in GTUTNs have the most extraordinary capacity for trade export intensity. They are all countries with rich reserves of tungsten concentrate, indicating that the difference in resource endowments is a significant factor affecting the export volume. In the midstream, CHN, VNM, DEU, and some other countries have the most extraordinary capacity for trade export intensity. In the downstream, CHN, DEU, JPN, and United States have a higher export intensity; most of them are developed countries, indicating that the export intensity of downstream products has a more significant relationship with the industrial technology level of the country.
In terms of resource control ability, in the upstream, United States, CHN, VNM, and IND have high resource control ability, indicating that they can act as a resource medium in the network, and countries must pass through them to make better trade and circulation of tungsten products. In the midstream, IND, DEU, CHN, and United States have high media power; they are located on different continents and are the central indispensable tungsten midstream products trading countries in each continent. United States, DEU, CHN, ZAF, and FRA play a more apparent media role downstream, indicating that they control the trade of downstream tungsten products. Regarding resource control, the influence of resource endowment is slightly weaker and more affected by the country’s industrial technology and manufacturing levels. Developed countries have leading industrial technology and tend to control more low-price resources to produce high-level tungsten products and sell them at high prices. Countries with a high manufacturing level and cheap labor force, such as China and India, will also control more resources to meet domestic and foreign supply and demand.
Regarding resource acquisition capability, upstream countries such as the United States, CHN, DEU, and RUS can obtain resources, and ZAF and ITA occasionally have high access capacity. They are countries with rich tungsten ore reserves or close to tungsten ore resource countries. In the middle stream, DEU, CHN, IND, United States, and other countries have a higher ability to obtain resources, and ZAF and ARE are more volatile. It shows that tungsten midstream products are close to APT production or on the trade channel, making it easy to obtain resources. In the downstream, CHN, United States, and DEU have always had a high ability to access resources. They are resource producers with solid manufacturing capacity and close trade with neighboring countries, giving them easy access to resources. FJI, CUW, and TTO occasionally rank first, and they are some island countries; their surrounding countries have a strong production capacity of tungsten downstream products, and they have more trade with them, which improves their resource access.
In summary, for the global tungsten trade network based on the industrial chain for nearly a decade, China, the United States, Germany, India, and other countries have been playing an important role in terms of resource export intensity, resource control, or resource acquisition ability. Russia, Japan, and South Africa occasionally play an important role. The different positions and roles of countries in the networks are mainly related to the country’s tungsten resource endowment, the country’s manufacturing level, or the country’s geographical location. These practical factors have an obvious impact on the tungsten trade networks.
4.3 Changes in China’s trade pattern in GTTNs
(1) Evolution of import and export volume of different links of the tungsten industry chain in China.
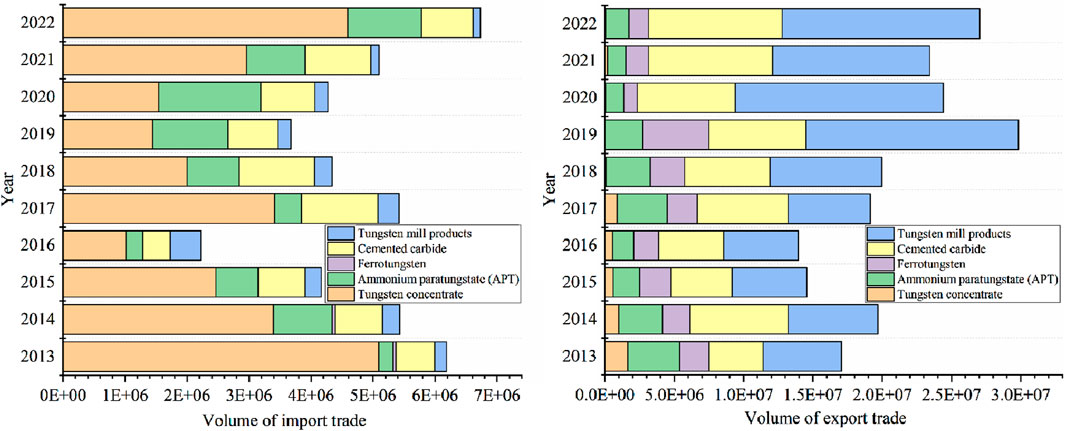
In Figure 6, the graph on the left shows the change in the import volume of different segments. Tungsten concentrate accounted for the most significant proportion of imports in the past decade; although it began to decline in 15 years, its import volume has returned to a high level in the past 2 years. Although tungsten ore is the dominant mineral in China, its demand is enormous and still depends on imports. APT and tungsten carbide products also need to be imported. Because the domestic demand for APT is high, high-precision cemented carbide products still depend on foreign countries. This is mainly because China’s high-end production software and equipment technology still rely on imports. In the figure on the right, China’s downstream tungsten products and cemented carbide exports are the largest, especially in recent years. The proportion of downstream product exports has increased, and the export volume of APT and ferrotungsten in the midstream has decreased. In 2022, China’s actual output of APT reaches 80,000 tons (metal volume), accounting for 74.4% of the world’s total. However, the quantity of downstream Tungsten products in China is large, and the consumption of raw materials in the middle and upper reaches is increasing, hence it exports less to feed domestic demand.
There are apparent differences in the import and export trade structure of tungsten products in China. Tungsten concentrate is China’s largest imported tungsten resource product, and tungsten products are the largest export products of tungsten resources. China’s tungsten industry chain trade has shifted to importing upstream and midstream products with lower added value while producing and exporting downstream products with higher added value, which reflects China’s rising position in the global tungsten product value chain.
(2) China’s trade and import diversity in different links of the tungsten industry chain.
We characterize tungsten trade’s import and export diversity by in-degree and out-degree. Figure 7 shows that the number of importing countries of tungsten upstream products is greater than that of exporting countries, indicating that tungsten upstream products are still dependent on imports. China mainly imports from countries rich in tungsten ore resources, such as RUS and PRK, and exporters from neighboring countries, such as VNM and KOR.
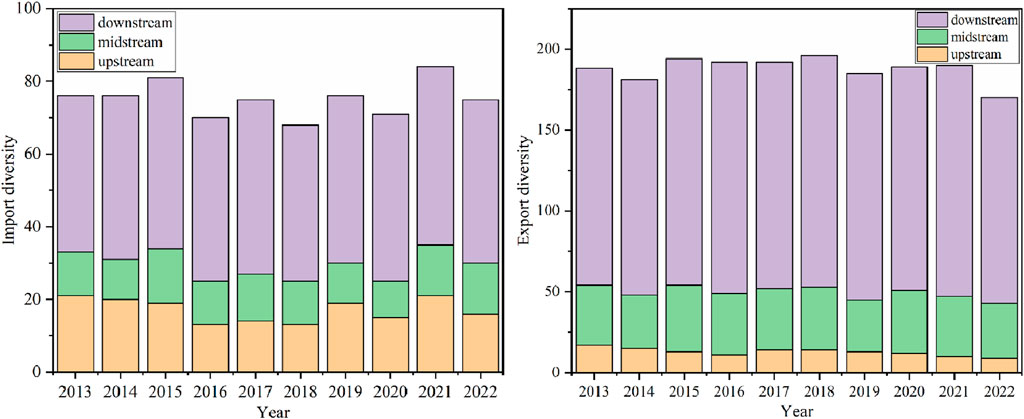
Figure 7. Evolution of import and export diversity in different links of the tungsten industry chain.
In the midstream, the diversity of exports is greater than that of imports, indicating that the export market is more diversified. China imports tungsten midstream products from VNM, PHL, and DEU, which are rich in tungsten ore resources and have certain advantages in midstream product manufacturing. Then, China exports tungsten midstream products to developed countries such as United States and JPN, which have a relatively complete and advanced tungsten ore industry chain, and they manufacture downstream high-precision tungsten products through imported raw materials. The import and export diversity of tungsten downstream products is relatively high, indicating that the globalization trend of the import and export market is the most obvious. China mainly imports downstream products from countries such as JPN, DEU, and KOR, which have a complete industrial base and advanced technology. China imports high-end cemented carbide from them. China mainly exports low-end tungsten products and cemented carbide to PHL, United States, IND, and other countries.
In general, China’s upstream is still mainly imported tungsten concentrate; The import and export market of middle and downstream products is more diversified, especially the import and export diversity of downstream products is the highest. China mainly imports upstream raw materials, and exports middle and downstream tungsten processing products, but high-end cemented carbide products still need to be imported. China’s tungsten industry should be further transferred to the field of deep processing to achieve high-end development of the tungsten industry value chain.
(3) The evolution of China’s trade spatial pattern.
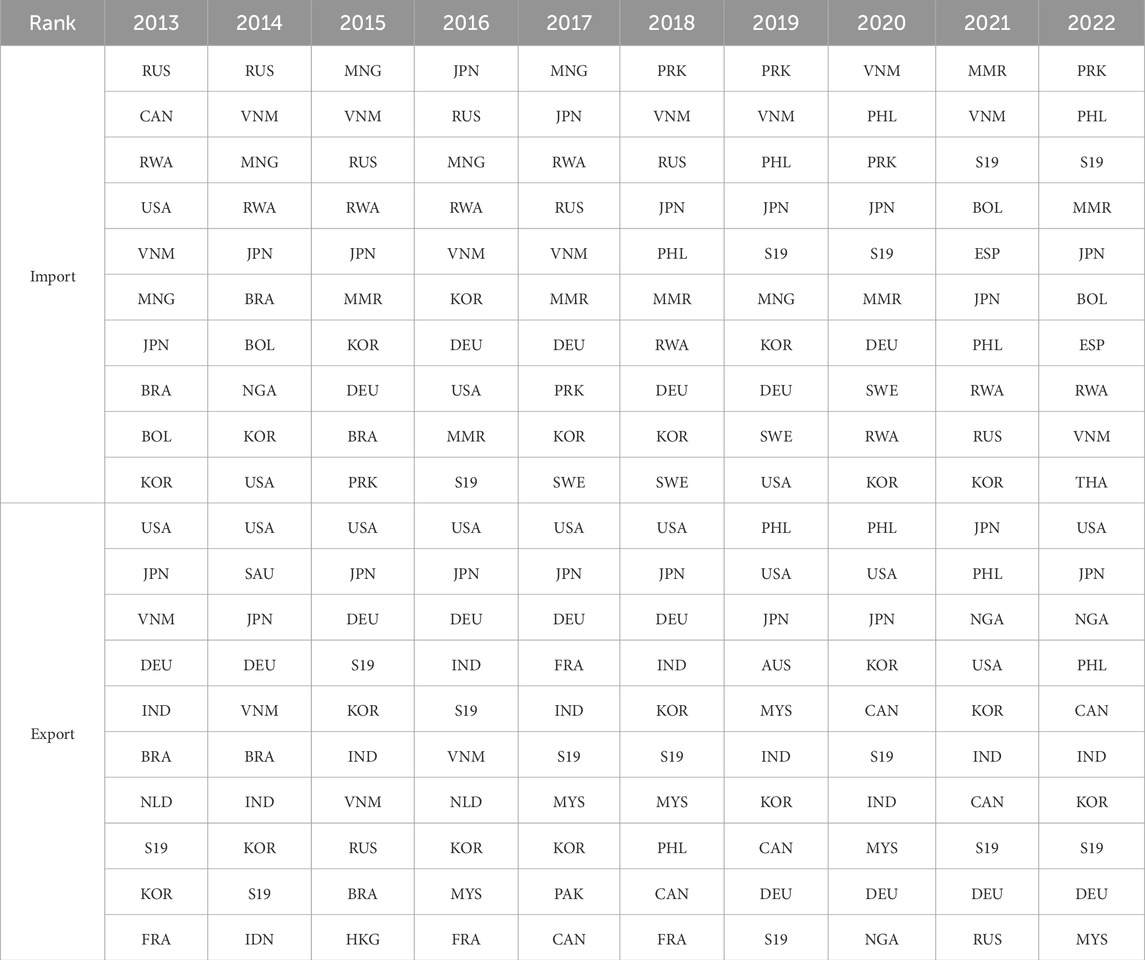
To understand China’s position in international tungsten ore trade, we analyzed China’s top ten import trading countries (regions) and export trading countries (regions) in global tungsten ore trade, as shown in Table 2.
In terms of imports, it was mainly imported from RUS, MNG, VNM, and JPN until 2018, after which it gradually shifted to imports from PRK, VNM, MMR, and PHL. The central import countries of China’s tungsten ore resources have progressively transferred from the developed countries in the north to the developing countries in the southeast, and tungsten concentrate products are still mainly imported upstream. From a geopolitical point of view, China mainly imports from neighboring countries rich in tungsten resources, and there has been good trade cooperation between countries. The number of China’s importing countries has remained at about 56, of which the import volume of the top ten countries has reached more than 85% of the total import volume, indicating that the import of China’s tungsten ore resources is concentrated in some major countries.
Regarding exports, the United States and JPN have always been China’s largest exporters of tungsten ore resources. PHL became the largest exporter of tungsten ore resources in China after 2018. In the past 10 years, the number of exporting countries in China has remained at about 140, and the export volume of the top ten countries has reached more than 70% of the total export volume. This shows that China’s tungsten resources export is more dispersed. China’s largest tungsten ore exports are mainly developed countries, and the main export products to these countries are the downstream products of the tungsten industry chain.
We counted nearly a decade in the highest frequency of ten countries; among them, the most imports are JPN, VNM, KOR, RWA, MMR, RUS, DEU, MNG, PRK, PHL, and the most exports are DEU, IND, JPN, KOR, United States, CAN, MYS, PHL, FRA, VNM. The proportion chart is obtained by summing up the import or export volume of different products in the ten countries with the most frequent frequency in the past 10 years, as shown in Figures 8, 9.
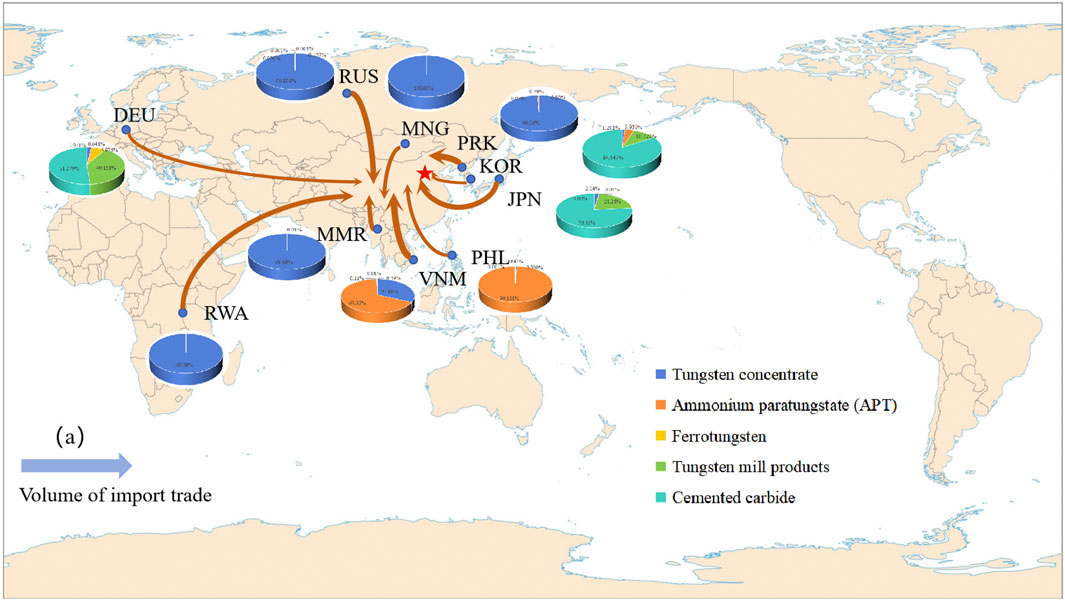
Figure 8. China’s top ten tungsten import trading partners and their product structure in 2013–2022.
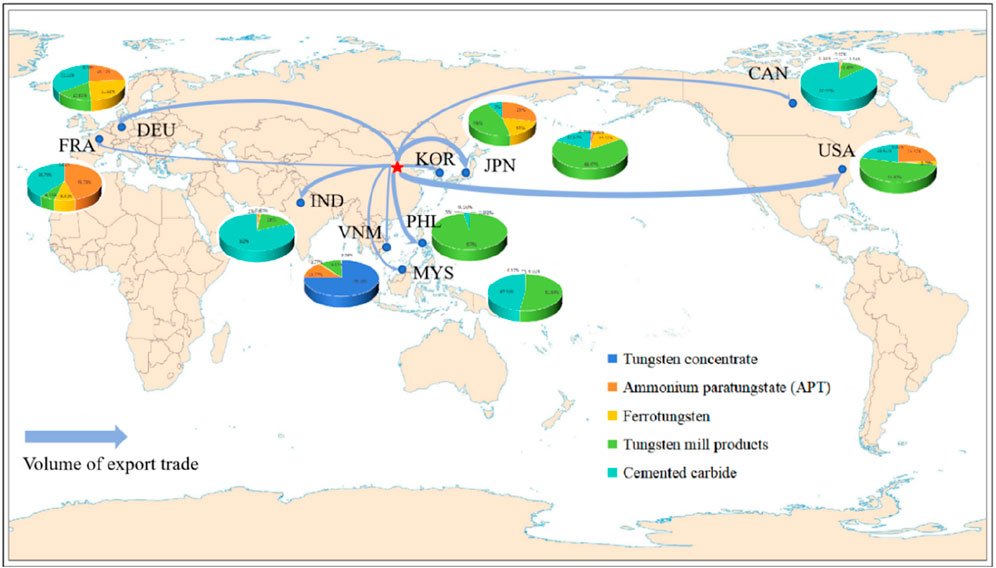
Figure 9. China’s top ten tungsten export trading partners and their product structure in 2013–2022.
In terms of trade relations, developed countries are the main trading partners. In the past 10 years, China has continued to establish trade relations with more than 200 countries and regions, of which about 90% of the trade volume is concentrated in Japan, South Korea, the United States, Germany, and other developed countries.
In Figure 8, regarding imports, China mainly imports tungsten concentrate from RUS, PRK, MNG, VNM, and other countries, mainly because these countries are rich in tungsten ore resources. China imports middle and downstream tungsten products, especially high-end carbide products, from KOR, JPN, DEU, PHL, and other countries. Most of these countries have a high level of industrial production and technical level. In Figure 9, regarding exports, VNM, KOR, DEU, FRA, United States, and other countries are the main exporters of tungsten products in upstream and midstream in China. The United States, JPN, DEU, PHL, etc., are also the main exporters of China’s tungsten products in downstream, mainly exporting some low-end tungsten products. The reason is that the demand for tungsten resources in developed countries is strong, but the resource endowment is poor, so it is the main importing country of tungsten products.
The trade status analysis shows that China’s APT of tungsten midstream products exported in previous years has a larger proportion. With the improvement of China’s tungsten product technology, the export volume of tungsten metal products has increased yearly. From the perspective of tungsten industry chain analysis, in recent years, China has gradually become a tungsten concentrate and precision carbide, tungsten steel and other high-end tungsten products importer and tungsten intermediate products and low-end tungsten metal products exporter. Tungsten enterprises should be encouraged to extend to deep processing to improve the international competitiveness of China’s tungsten export products.
5 Conclusion
From the perspective of the industry chain, we analyze the evolution of the law of tungsten product trade supply and demand patterns and the role of national trade. Moreover, the evolution of China’s trade status is analyzed, and some suggestions are put forward for the sustainable development of tungsten product trade. We defined the tungsten industry chain and selected five types of products for analysis. Then, we convert the trade weight data of various Tungsten products into tungsten metal weight. Finally, we construct global tungsten trade networks based on complex network theory and analyze the structural characteristics.
First, through an analysis of the overall structural characteristics of global tungsten trade networks, we found that the scale of trade in the middle and lower reaches has an increasing trend, and compared with the upstream, the trend of trade globalization is apparent. In addition, we found that the top 10 to 20 percent of countries account for 90 percent of the total tungsten trade, indicating that only a few countries play essential roles in global tungsten trade networks. Moreover, we found that communities with China, the United States, and Germany as the central trading countries have formed indifferent industrial chain links. The global trade pattern of tungsten products has shown a trend of globalization over time. However, the dominant power is still in a few developed or developing countries with developed manufacturing.
Second, in different parts of the tungsten industry chain, we used network indicators to characterize the different national roles, which have changed over time. Among these countries, China, the United States, Russia, Germany, Japan, India, etc., hold export, resource control, and resource access power. From the perspective of export strength ability, the countries with solid export power upstream have high tungsten resource endowment. At the same time, the midstream and downstream are primarily countries with developed manufacturing industries. Regarding resource control ability, the influence of resource endowment is weaker and more influenced by the level of industrial technology in developed countries or the excellent development of the manufacturing industry and the cheap labor in developing countries. For resource acquisition capability, tungsten ore reserves, high manufacturing level, and geographical location impact the country’s resource acquisition.
Third, we found a significant difference in the structure of China’s tungsten import and export trade, which has gradually changed to the import of upper and middle reaches products with lower added value, while the production and export of downstream products with higher added value. This reflects China’s increasing global tungsten resource product value chain position. China’s import and export diversity levels differ; upstream resources depend more on imports. The diversity of imports and exports downstream is higher; China mainly imports high-end cemented carbide products and exports low-end tungsten products or cemented carbide. China’s tungsten industry chain still has the risk of high-end technology being “stuck.” The diversity of imports and exports in the middle reaches is similar, and China mainly imports from neighboring countries and exports to developed countries with a complete tungsten industry chain. This is closely related to geopolitics and related trade policy. China has mainly formed a pattern of trading partners with developed countries, especially in export relations. About 90% of the trade volume is concentrated in Japan, South Korea, the United States, Germany and other developed countries.
This article systematically analyzes the evolution of the global trade pattern of tungsten products from the perspective of the industry chain, providing a new research perspective for the trade study. The paper also focuses on analyzing China’s position in the pattern of tungsten trade. It provides suggestions for the sustainable development of China’s tungsten trade from the perspective of the industry chain. The trade relationship between the upper, middle, and lower tiers has yet to be considered, but it will be considered in the future.
Data availability statement
Publicly available datasets were analyzed in this study. This data can be found here: https://comtradeplus.un.org/.
Author contributions
XX: Conceptualization, Data curation, Formal Analysis, Investigation, Methodology, Software, Visualization, Writing–original draft, Writing–review and editing. WZ: Funding acquisition, Supervision, Writing–review and editing. HZ: Visualization, Supervision, Writing–review and editing.
Funding
The author(s) declare that financial support was received for the research, authorship, and/or publication of this article. This work was supported by the Integrated Project of the Major Research Plan of the National Natural Science Foundation of China (No. 92162321) and the Basic Science Center Project of the National Natural Science Foundation and of China (No. 72088101, the Theory and Application of Resource and Environment Management in the Digital Economy Era), and the Geological Survey project of China Geological Survey (No. DD20243234).
Conflict of interest
The authors declare that the research was conducted in the absence of any commercial or financial relationships that could be construed as a potential conflict of interest.
Publisher’s note
All claims expressed in this article are solely those of the authors and do not necessarily represent those of their affiliated organizations, or those of the publisher, the editors and the reviewers. Any product that may be evaluated in this article, or claim that may be made by its manufacturer, is not guaranteed or endorsed by the publisher.
References
Blondel, V. D., Guillaume, J. L., Lambiotte, R., and Lefebvre, E. (2008). Fast unfolding of communities in large networks. J. Stat. Mechanics-Theory Exp. P10008. doi:10.1088/1742-5468/2008/10/p10008
Chen, W., Dai, Y. Y., Liu, Z. G., and Zhang, H. P. (2024a). The evolution of global zinc trade network: patterns and implications. Resour. Policy 90, 104727. doi:10.1016/j.resourpol.2024.104727
Chen, W., Zhang, J. N., Yu, Z. Y., and Zhao, X. Q. (2024b). Structure and evolution of global lead trade network: an industrial chain perspective. Resour. Policy 90, 104735. doi:10.1016/j.resourpol.2024.104735
Chen, Z. H., Wang, H., Liu, X. Y., Wang, Z., and Wen, S. B. (2022). Risk diffusion of international oil trade cuts: a network-based dynamics model. Energy Rep. 8, 11320–11333. doi:10.1016/j.egyr.2022.08.244
Cho, W., Lee, D., and Kim, B. J. (2023). A multiresolution framework for the analysis of community structure in international trade networks. Sci. Rep. 13, 5721. doi:10.1038/s41598-023-32686-2
Dong, D., Gao, X. Y., Sun, X. Q., and Liu, X. Y. (2018). Factors affecting the formation of copper international trade community: based on resource dependence and network theory. Resour. Policy 57, 167–185. doi:10.1016/j.resourpol.2018.03.002
Du, R. J., Wang, Y., Dong, G. G., Tian, L. X., Liu, Y. X., Wang, M. G., et al. (2017). A complex network perspective on interrelations and evolution features of international oil trade, 2002–2013. Appl. Energy 196, 142–151. doi:10.1016/j.apenergy.2016.12.042
Freeman, L. C. (1979). Centrality in social networks: conceptual clarification. Soc. Netw. 1, 215–239. doi:10.1016/0378-8733(78)90021-7
Guan, Q., An, H. Z., Hao, X. Q., and Jia, X. L. (2016). The impact of countries' roles on the international photovoltaic trade pattern: the complex networks analysis. Sustainability 8, 313. doi:10.3390/su8040313
Henckens, T. (2021). Scarce mineral resources: extraction, consumption and limits of sustainability. Resour. Conservation Recycl. 169, 105511. doi:10.1016/j.resconrec.2021.105511
Hou, W. Y., Liu, H. F., Wang, H., and Wu, F. Y. (2018). Structure and patterns of the international rare earths trade: a complex network analysis. Resour. Policy 55, 133–142. doi:10.1016/j.resourpol.2017.11.008
Hu, X. Q., Wang, C., Zhu, X. Y., Yao, C. Y., and Ghadimi, P. (2021). Trade structure and risk transmission in the international automotive Li-ion batteries trade. Resour. Conservation Recycl. 170, 105591. doi:10.1016/j.resconrec.2021.105591
Huang, J. B., Ding, Q., Wang, Y., Hong, H. J., and Zhang, H. W. (2021). The evolution and influencing factors of international tungsten competition from the industrial chain perspective. Resour. Policy 73, 102185. doi:10.1016/j.resourpol.2021.102185
Jia, N. F., Pi, Z. R., Zuo, M., Liu, D. H., An, H. Z., and Wang, J. L. (2024). Structural evolution and the influence mechanism of the global embedded tungsten value flow networks: the perspective of value chain and technological progress. Resour. Policy 91, 104876. doi:10.1016/j.resourpol.2024.104876
Kang, X. Y., Wang, M. X., Chen, L., and Li, X. (2023). Supply risk propagation of global copper industry chain based on multi-layer complex network. Resour. Policy 85, 103797. doi:10.1016/j.resourpol.2023.103797
Kang, X. Y., Wang, M. X., Wang, T. X., Luo, F. J., Lin, J., and Li, X. (2022). Trade trends and competition intensity of international copper flow based on complex network: from the perspective of industry chain. Resour. Policy 79, 103060. doi:10.1016/j.resourpol.2022.103060
Kim, S., and Yun, J. (2022). Analysis of risk propagation using the world trade network. J. Korean Phys. Soc. 81, 697–706. doi:10.1007/s40042-022-00590-z
Lederer, G. W., Solano, F., Coyan, J. A., Denton, K. M., Watts, K. E., Mercer, C. N., et al. (2021). Tungsten skarn mineral resource assessment of the Great Basin region of western Nevada and eastern California. J. Geochem. Explor. 223, 106712. doi:10.1016/j.gexplo.2020.106712
Li, H., An, H., Qi, Y., and Liu, H. (2020). Trade and competitiveness structure of Chinas advantageous mineral resources based on the international trade network of industrial chain: a case study of Tungsten. Resour. Sci. 42, 1504–1514. doi:10.18402/resci.2020.08.06
Liang, J. J., Geng, Y., Zeng, X. L., Gao, Z. Y., and Tian, X. (2022). Toward sustainable utilization of tungsten: evidence from dynamic substance flow analysis from 2001 to 2019 in China. Resour. Conservation Recycl. 182, 106307. doi:10.1016/j.resconrec.2022.106307
Liu, L., Chen, Y., Yu, J., and Cheng, R. (2024a). Analysis of the trade network of global wood forest products and its evolution from 1995 to 2020. For. Prod. J. 74, 121–129. doi:10.13073/fpj-d-23-00065
Liu, L. T., Cao, Z., Liu, X. J., Shi, L., Cheng, S. K., and Liu, G. (2020). Oil security revisited: an assessment based on complex network analysis. Energy 194, 116793. doi:10.1016/j.energy.2019.116793
Liu, Y. X., Li, Y. T., and Pu, Y. (2024b). Exploring the endogenous structure and evolutionary mechanism of the global coal trade network. Energy Econ. 136, 107710. doi:10.1016/j.eneco.2024.107710
Novikau, A. (2022). Rethinking demand security: between national interests and energy exports. Energy Res. and Soc. Sci. 87, 102494. doi:10.1016/j.erss.2022.102494
Petridis, N. E., Petridis, K., and Stiakakis, E. (2020). Global e-waste trade network analysis. Resour. Conservation Recycl. 158, 104742. doi:10.1016/j.resconrec.2020.104742
Tang, L. B., Wang, P., Graedel, T. E., Pauliuk, S., Xiang, K. Y., Ren, Y., et al. (2020). Refining the understanding of China’s tungsten dominance with dynamic material cycle analysis. Resour. Conservation Recycl. 158, 104829. doi:10.1016/j.resconrec.2020.104829
Wang, X. X., Li, H. J., Yao, H. J., Chen, Z. H., and Guan, Q. (2019). Network feature and influence factors of global nature graphite trade competition. Resour. Policy 60, 153–161. doi:10.1016/j.resourpol.2018.12.012
Wu, C. C., Gao, X. Y., Xi, X., Zhao, Y. R., and Li, Y. (2021). The stability optimization of the international lithium trade. Resour. Policy 74, 102336. doi:10.1016/j.resourpol.2021.102336
Xi, X., Zhou, J. S., Gao, X. Y., Wang, Z., and Si, J. J. (2020). Impact of the global mineral trade structure on national economies based on complex network and panel quantile regression analyses. Resour. Conservation Recycl. 154, 104637. doi:10.1016/j.resconrec.2019.104637
Xia, Q. F., Du, D. B., Cao, W. P., and Li, X. Y. (2023). Who is the core? Reveal the heterogeneity of global rare earth trade structure from the perspective of industrial chain. Resour. Policy 82, 103532. doi:10.1016/j.resourpol.2023.103532
Xu, L. G., Guo, X., Xu, M. J., Jia, Y. L., and Zhong, Z. F. (2024). Evaluation and impact factors of international competitiveness of China’s cobalt industry from the perspective of trade networks. Sci. Rep. 14, 12165. doi:10.1038/s41598-024-63104-w
Xu-guang, Z., Xue-hong, Z., and Jin-yu, C. (2022). Trade dependence network structure of tantalum trade goods and its effect on trade prices: an industry chain perspective. Resour. Policy 79, 103065. doi:10.1016/j.resourpol.2022.103065
Zhang, C., Fu, J. S., and Pu, Z. N. (2019). A study of the petroleum trade network of countries along The Belt and Road Initiative. J. Clean. Prod. 222, 593–605. doi:10.1016/j.jclepro.2019.03.026
Zhang, H. W., Wang, X. Y., Tang, J., and Guo, Y. Q. (2022a). The impact of international rare earth trade competition on global value chain upgrading from the industrial chain perspective. Ecol. Econ. 198, 107472. doi:10.1016/j.ecolecon.2022.107472
Zhang, X. L., Tang, D. C., Kong, S. Y., Wang, X. L., Xu, T., and Boamah, V. (2022b). The carbon effects of the evolution of node status in the world trade network. Front. Environ. Sci. 10. doi:10.3389/fenvs.2022.1037654
Zhao, L. F., Yang, Y. J., Bai, X., Chen, L., Lu, A. L., Zhang, X., et al. (2023). Structure, robustness and supply risk in the global wind turbine trade network. Renew. and Sustain. Energy Rev. 177, 113214. doi:10.1016/j.rser.2023.113214
Zhao, Y. R., Gao, X. Y., An, H. Z., Xi, X., Sun, Q. R., and Jiang, M. H. (2020). The effect of the mined cobalt trade dependence Network's structure on trade price. Resour. Policy 65, 101589. doi:10.1016/j.resourpol.2020.101589
Zhong, W. Q., An, H. Z., Shen, L., Dai, T., Fang, W., Gao, X. Y., et al. (2017a). Global pattern of the international fossil fuel trade: the evolution of communities. Energy 123, 260–270. doi:10.1016/j.energy.2017.02.033
Zhong, W. Q., An, H. Z., Shen, L., Fang, W., Gao, X. Y., and Dong, D. (2017b). The roles of countries in the international fossil fuel trade: an emergy and network analysis. Energy Policy 100, 365–376. doi:10.1016/j.enpol.2016.07.025
Keywords: tungsten product, global trade, supply and demand situation, industrial chain, complex network
Citation: Xi X, Zhong W and Zheng H (2024) Evolution and sustainability analysis of global tungsten trade pattern from the perspective of industry chain. Front. Earth Sci. 12:1484061. doi: 10.3389/feart.2024.1484061
Received: 21 August 2024; Accepted: 08 October 2024;
Published: 23 October 2024.
Edited by:
Hongjian Zhu, Yanshan University, ChinaReviewed by:
Haodong Lv, Tsinghua University, ChinaZhihua Chen, Beijing Normal University, China
Asma Arif, University of Wah, Pakistan
Copyright © 2024 Xi, Zhong and Zheng. This is an open-access article distributed under the terms of the Creative Commons Attribution License (CC BY). The use, distribution or reproduction in other forums is permitted, provided the original author(s) and the copyright owner(s) are credited and that the original publication in this journal is cited, in accordance with accepted academic practice. No use, distribution or reproduction is permitted which does not comply with these terms.
*Correspondence: Weiqiong Zhong, emhvbmd3ZWlxaW9uZzIwMTZAMTI2LmNvbQ==
 Xian Xi
 Weiqiong Zhong
 Huiling Zheng