- 1PetroChina Tarim Oilfield Branch Exploration, Development Research Institute, Korla, Xinjiang, China
- 2National Key Laboratory of Reservoir Geology and Development Engineering, Chengdu, Sichuan, China
- 3School of Petroleum and Natural Gas Engineering, Southwest Petroleum University, Chengdu, Sichuan, China
Fractured tight sandstone reservoirs are representative reservoirs in the Tarim Basin, characterized by the development of natural fractures and diverse interaction modes between artificial and natural fractures. The complex shape of the construction pressure curves during fracturing makes it difficult for existing fracture extension diagnosis methods to provide effective guidance. To thoroughly explore the information contained in the construction curves and accurately characterize hydraulic fracturing parameters, this study proposes a dynamic bottomhole net pressure calculation method based on real-time fracturing construction data, allowing for more precise correction of the bottomhole net pressure. Subsequently, a fracture extension mode recognition mechanism for fractured tight sandstone reservoirs is established, identifying five modes of fracture extension: activation of natural fractures, restricted extension, complex fracture extension, communication with natural fractures, and vertical penetration of fractures. The concept of a post-fracturing complex fracture network index is introduced, leading to a comprehensive method for diagnosing and recognizing construction pressure curves suitable for fractured tight sandstone reservoirs. Field case studies indicate that: (1) the ability of artificial fractures to activate natural fractures and form complex fractures is closely related to net pressure; (2) when the net pressure curve exhibits periodic trends, natural fractures within the reservoir may branch and redirect, forming more complex multi-stage fractures; (3) a higher complex fracture network index post-fracturing corresponds to a higher unimpeded flow capacity, indicating better production enhancement effects. The conclusion suggests that this fracture recognition method can enhance the fracturing potential of fractured tight sandstone reservoirs and is significant for guiding real-time dynamic adjustments in field fracturing operations.
1 Introduction
China has abundant unconventional oil and gas reserves, and under current economic and technological conditions, fractured tight sandstone reservoirs are gradually becoming a focus of exploration and development (Chen, 2024; Yan et al., 1997; Gang et al., 2023). The most representative fractured tight sandstone reservoirs in China are located in the Tarim Basin. As an important component of tight sandstone reservoirs, these fractured reservoirs are characterized by low porosity, low permeability, and low productivity. The development of natural fractures within these reservoirs is a key factor in enhancing production capacity (Zhimin et al., 2023; Liu et al., 2024; Qin et al., 2024; Jin et al., 2022). Currently, the conventional characterization methods for fracture parameters after hydraulic fracturing mainly include microseismic monitoring and wide-area electromagnetic monitoring techniques (Le Zhou et al., 2024; Zeng et al., 2023; Wu et al., 2024). However, both methods are easily influenced by natural fracture zones and various faults underground, making it difficult to provide effective guidance for actual production.
During the construction process, the fracturing construction curve provides a complete depiction of how injection pressure, injection rate, and proppant concentration change over time (Jinzhou et al., 2022; Wang et al., 2024). Therefore, deeply exploring the geological and engineering information revealed by the fracturing curves at different construction stages is of significant importance. Some scholars have studied the fracturing construction curves to indirectly characterize hydraulic fracture parameters. Notably, Nolte and Smith established the relationship between net pressure curves and fracture geometry under a double-logarithmic system, forming a classic fracturing diagnostic method, which subsequent research has built upon (Hong-Yan et al., 2023; Fuqiang et al., 2022; Xiaodong et al., 2022). Barree et al. developed a tangent method for analysis based on Nolte’s theory, determining fracture closure time and closure pressure by drawing a line through the origin that is tangent to the overlaid derivative GdP/dG curve. This method has been widely applied in the field (JeongWon et al., 2023; Gong and El-Monier, 2019). Yao (2018) characterized fracture complexity by analyzing fracture fluctuation states and improving the G-function. Wang et al. (2014) studied the pressure drop patterns of shale gas wells during small-scale fracturing tests using numerical simulation methods. Their findings indicated that the pressure drop process after stopping the pump involves four stages: fracture extension, elastic closure of fractures, pseudo-linear flow stage post-closure, and pseudo-radial flow stage. They estimated reservoir and fracture parameters using G-function, linear flow time function, and radial flow time function models. Xianshan et al. (2024) analyzed flow patterns in tight sandstone gas reservoirs using views of homogeneity, linear fractures, and complex fractures, identifying artificial fracture characteristics based on G-function theory and comprehensively evaluating the complexity of the hydraulic fracture network, validating results against microseismic monitoring data to enhance diagnostic accuracy.
The prerequisite for realising the full mobilisation of fractured tight sandstone reservoirs is whether the artificial fractures during hydraulic fracturing can interact with natural fractures to form a complex fracture network, and the study of the interaction mode between artificial fractures and natural fractures for hydraulic fracturing process is particularly important, e.g., Sang et al. (2023). obtained four kinds of natural fractures by establishing a coupled fluid-solid computational model of natural fracture extension in porous elastic strata, and examined the relevant influencing factors. Yu et al. (1997) and others carefully analysed the key factors affecting the interaction between hydraulic fracture extension and natural fractures, and focused on the formation mechanism and final structure of the fracture network, while Yueliang et al. (2022) and others investigated the influence of natural fractures on hydraulic fracture extension during hydraulic fracturing of tight reservoirs through indoor experiments, where the main influencing factors are the inclination angle of natural fractures and the relationship between natural fractures and wells. inclination angle and the distance between natural fractures and wellbore. Currently, there is still exploration space for the study of construction curves in fractured tight sandstone reservoirs, particularly a lack of detailed descriptions of post-fracture extension states and widely applicable field cases. This study focuses on various wells in the Bozi Block of the Tarim Basin. Based on real-time monitored construction data such as wellhead pressure, injection rate, and proppant concentration, we established a novel dynamic bottomhole net pressure conversion model. By simulating fracture extension scenarios on an integrated platform, we performed double-logarithmic processing of the net pressure curve and summarized the changes in curve slopes, identifying five distinct fracture extension modes to describe different fracture behaviors and corresponding mechanical conditions during the fracturing process. We propose a post-fracturing complex fracture network index and comprehensively establish a diagnostic recognition model for the construction pressure curves of fractured tight sandstone reservoirs, aiming to provide positive guidance for field operations.
2 Overview of the study area
2.1 Geological characteristics
As shown in Figures 1, 2, the Bozi Block is located in the western part of the Kuqa Depression within the Tarim Basin. The primary target formations in the block are the Bashijiqike Formation and the Baxi Formation of the Cretaceous, with an average burial depth exceeding 6,000 m (Peng et al., 2023; Ke et al., 2022). The Bashijiqike Formation is primarily composed of lithic feldspathic sandstone, with subordinate feldspar-lithic sandstone. The grain size is mainly medium to fine; the sorting of sandstone clastic particles is moderate to good, and the roundness is sub-angular to sub-rounded, with particle contact primarily point-to-line. The main cementation type is pore-type cementation.
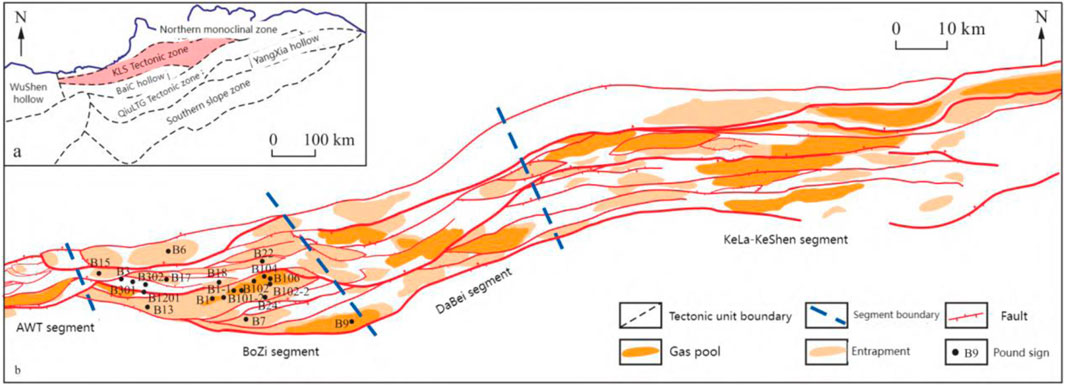
Figure 1. Regional location and division map of Kelasu tectonic belt in Kuqa Depression. (A) Study block structure location; (B) Structural characteristics of Kelasu tectonic belt.
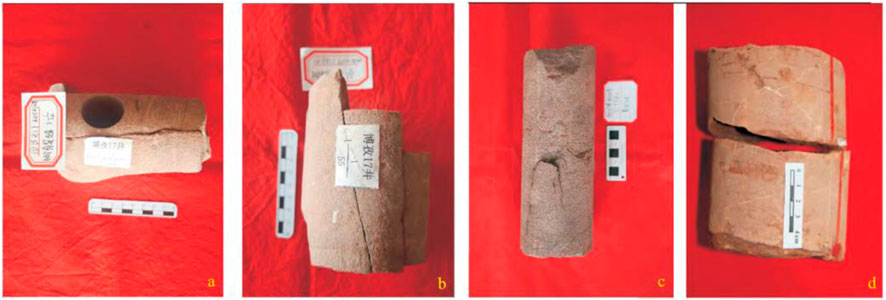
Figure 2. Core fracture characteristics of ultra-deep reservoir in Bozi block. (A–D) all are cores from different Wells in the study block.
The Baxi Formation consists mainly of variegated small gravel, small gravel, and sandstone gravel, with gravel components primarily including metamorphic rock gravel, igneous rock gravel, and, to a lesser extent, sedimentary rock gravel. The compositional maturity is moderate, while the structural maturity is relatively high. The effective porosity of the Bashijiqike Formation and the Baxi Formation generally ranges from 4.0% to 10.0%, with an average of 5%–8%. The matrix permeability is typically between 0.05 and 0.5 mD, classifying it as a typical ultra-deep tight sandstone reservoir.
3 Characteristics of natural fractures
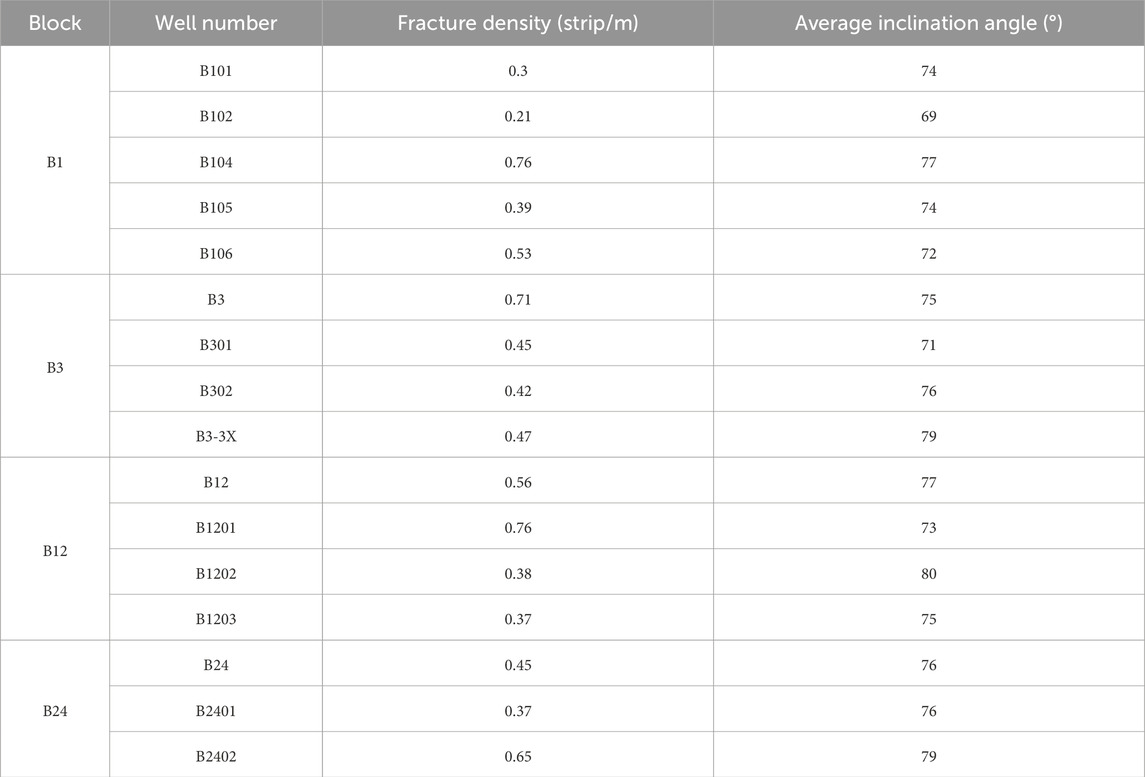
In the Bozi Block, the ultra-deep reservoirs exhibit well-developed fractures, predominantly featuring high-angle structural fractures. The main type of fractures is shear fractures, followed by extensional fractures. Shear fractures typically develop at high angles, have flat fracture surfaces, extend over long distances, and exhibit small openings (0.1–0.3 mm). Most of these fractures are unfilled, while a small number of smaller fractures are filled with calcite or gypsum.
In contrast, extensional fractures account for a smaller proportion; they usually have rough fracture surfaces, shorter extensions, and larger openings (>2 mm), with the majority filled by calcite or gypsum. The general orientation of natural fractures in the Bozi Block is primarily near north-south and northwest-southeast, displaying a network-like distribution. Most fractures are in an unfilled or partially filled state, with the main fillings consisting of calcite, gypsum, and clay materials. The dip angle of these fractures is generally greater than 70°.
The development of natural fractures in various wells within the Bozi Block is summarized in Table 1 and illustrated in Figures 3A, B.
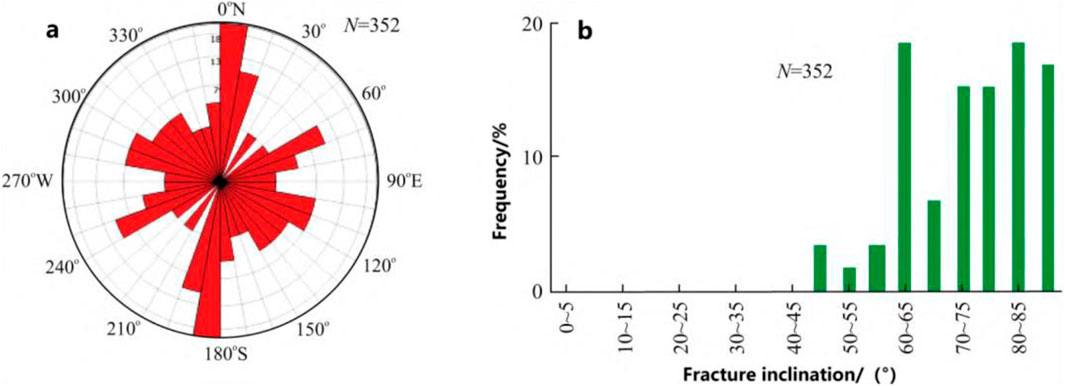
Figure 3. FMI image fracture occurrence statistical map of ultra-deep reservoir in Bozi block [(A) Rose diagram; (B) Dip frequency diagram].
4 Engineering background
Table 2 presents the transformation process parameters obtained from the construction data of various wells in the Bozi Block. Most wells in this block utilize a cased perforation completion method, with a sand-based hydraulic fracturing technique being commonly employed. The overall transformation scale for the Bashijiqike Formation is relatively large, with an average transformation volume of 1,030 m³. The pre-treatment fluid volume typically ranges from 70 to 600 m³, while the average sand volume is 52.42 m³, with a sand-to-fluid ratio between 5% and 30%. The construction pressure varies from 87 to 122 MPa, and the pumping rate ranges from 1 to 6 m³/min.
In contrast, the transformation scale, pre-treatment fluid volume, and sand volume for the Baxi Formation are generally smaller than those of the Bashijiqike Formation, although the pressure range and average pumping rate are similar. Due to the development of natural fractures in the fractured sandstone reservoirs, there is significant fluid loss during fracturing. To ensure proper fracture initiation, extension, and sand addition, the study area typically employs stable high-rate construction (generally exceeding 4 m³/min). To control excessive vertical extension of the fractures, some wells utilize variable rate pumping techniques, with pumping rates generally ranging from 1 to 7 m³/min.
5 Net pressure calculation
The activation process of natural fractures is often accompanied by changes in fluid pressure inside the fractures, and this increase and decrease in fluid pressure inside the fractures can provide insight into the fracturing of the formation and natural fracture communication, which can lead to the diagnosis of the overall fracture complexity after modification (Yan et al., 2024; Changgui et al., 2023). The key to the opening of natural fractures in fractured tight sandstone reservoirs lies in the net pressure, which is the difference between the pressure of the fluid in the fracture (bottom-of-well pressure) and the minimum principal stress (closure pressure) (Shen and Ji, 2024; Campos et al., 2024).
In the actual fracturing construction process, the fracturing fluid enters the fracture from the pumping machine through the surface pipeline, wellbore tubing column, and injection hole, and pressure loss occurs in each flow channel due to the friction, and along with the continuous change of the construction volume, sand concentration, etc., the column pressure and wellbore friction change accordingly, so the increment of the wellbore pressure changes dynamically, which makes the calculation of the wellbore pressure more complicated (Leonardo et al., 2023; Hongyang et al., 2023).
At present, the general practice of calculating the bottomhole pressure is to regard the whole wellbore as a whole, take the average value of the density of fracturing fluid in the wellbore, calculate the static wellbore column pressure without considering the change of well inclination angle, and calculate the wellbore resistance using the theoretical formula, which leads to a large deviation of the calculated value of the bottomhole pressure from the actual value (Liu et al., 2013; Haibo et al., 2021). In order to address the above problems, the author proposes a method of calculating dynamic bottomhole pressure based on specific fracturing construction data. By dividing the wellbore liquid into units, calculating the liquid volume and sand concentration of the liquid units at different moments by correction, and correcting the formula for calculation of moiré of indoor experiments by using on-site construction moiré, the results of calculation of bottomhole pressure can be more accurate, which can improve the accuracy of the subsequent analysis of the fracture extension situation. The accuracy of the subsequent analysis of the fracture extension is improved.
(1) Fluid Unit Hydrostatic Pressure:
Where
In Equation 2,
Where
In Equation 1,
Where
(2) Fluid Unit Friction:
In practical application, the wellbore fracturing fluid friction is often calculated on the basis of clean water friction, because the value of clean water friction is the largest under the same conditions, as shown in Equation 4:
Where
In Equation 5,
Where d is the wellbore diameter, in mm;
In Equation 6,
Where H is the depth of the oil and gas well, in meters.
Actual value of fracturing fluid friction in fluid unit iii at flow rate
The friction calculation formula mentioned above is the theoretical calculation value under the maximum displacement, and in the actual construction process, it is necessary to consider the influence of objective factors, so the actual friction calculation formula is shown in Equation 7.
Where
In Equation 8,
Where
In Equation 9,
Where
In Equation 10,
Where
In Equation 9,
As shown in Equation 11, the theoretical value of clean water friction of liquid unit i under displacement Qt is calculated as
(3) Dynamic Bottom-Hole Pressure During Fracturing Operations. The bottom hole pressure at different times is shown in Equation 12:
Where
In Equation 13,
As shown in Equation 14, the final bottom-hole net pressure calculation formula is
Where
6 Fracture extension mode identification
The analysis of fracture propagation is typically based on the classic Nolte-Smith (N&S) diagnostic theory. The classic N&S theory is established on traditional 2D fracture models and does not consider the extension of fractures in the vertical direction. It mainly includes PKN, KGD, and radial models, which categorize different ranges of double-logarithmic slopes of net pressure to derive various fracture propagation scenarios. However, in fractured tight sandstone reservoirs characterized by high geological complexity, well-developed natural fractures, and diverse modes of fracture propagation, the N&S theory is no longer applicable (Luo et al., 2020; Deng et al., 2024). Therefore, the author optimizes the N&S theory by simulating fracture propagation through an integrated platform, using the UFM model for complex fracture simulation and the planar 3D model PLANAR3D for simulating artificial primary fractures and vertical extension. This approach aims to address the shortcomings of the classic N&S theory while establishing a fracture propagation mode identification mechanism suitable for fractured reservoirs.
Currently, there is limited systematic research on the initiation and propagation of natural fractures in fractured tight sandstone reservoirs. Most studies focus on the changes in mechanical parameters related to the fracture of matrix rocks. For instance Zhao et al. (2021), discusses and explains the variations in the stress-strain curve, irreversible strain, elastic modulus, and Poisson’s ratio during the rock fracture process Zhou et al. (2019). investigates the influence of rock brittleness on fracture initiation, propagation, and merging processes, noting that variations in rock brittleness can directly affect fracture initiation modes. While these studies clarify the changes in mechanical parameters during fracture initiation, they do not address the propagation of artificial fractures when encountering natural fractures.
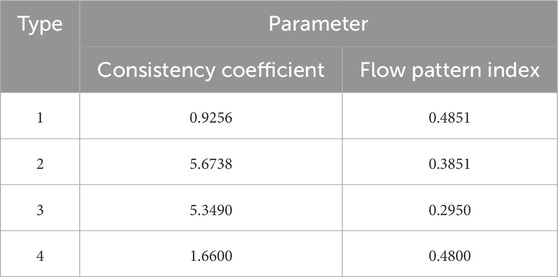
As shown in Table 3, based on the actual fracturing conditions of various wells in the work area, basic parameter settings for fracturing parameters, proppant parameters, and construction displacement parameters are established. Subsequently, under conditions of variable displacement (with a simulation range of 1–7 m³/min) and variable fluid (determined by the use of fracturing fluids over the past 5 years in the work area, resulting in four combinations of consistency and flow coefficients as shown in Table 4), the net pressure curve is processed logarithmically to determine the double-logarithmic slope ranges for various fracture propagation modes. This leads to the establishment of a fracture propagation identification mode specific to fractured sandstone reservoirs.
6.1 Artificial fracture extension
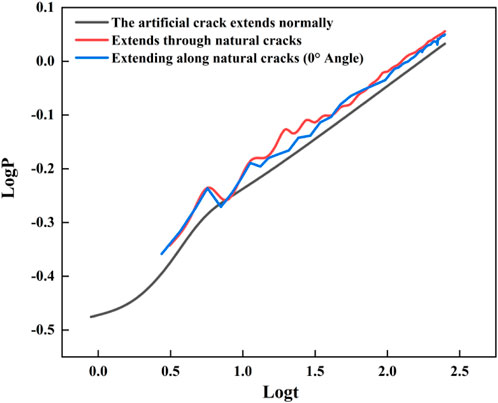
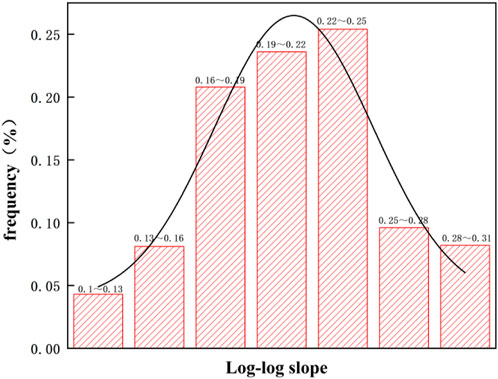
Artificial fracture extension primarily includes three scenarios: (1) encountering no natural fractures, resulting in normal extension of artificial fractures; (2) extending through natural fractures; and (3) extending along natural fractures when the angle is 0°. As shown in Figure 4, which depicts the double logarithmic curves of net pressure for the three extension scenarios, it is evident that while there are three distinct situations for artificial fracture extension, none achieve communication with natural fractures. The shapes and slope variations of the double logarithmic curves for net pressure remain largely consistent across all scenarios. Figure 5 illustrates the distribution of double logarithmic slopes for net pressure in these three cases, with the dominant slope ranging from 1/6 to 1/4, accounting for 69.8%.
Therefore, the criteria for identifying the artificial fracture extension mode are: when the double logarithmic slope of the bottom-hole net pressure ranges from 1/6 to 1/4, it indicates that the hydraulic fracture is extending normally as a symmetrical bi-wing fracture, as shown in Equation 15.
6.2 Complex fracture extension
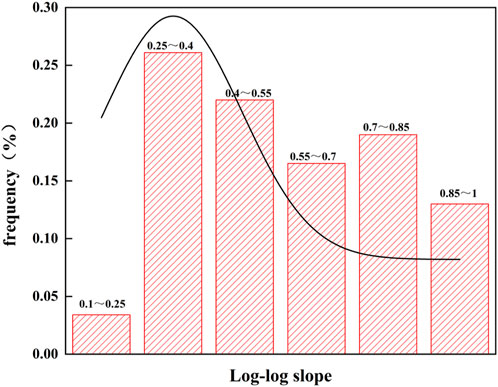
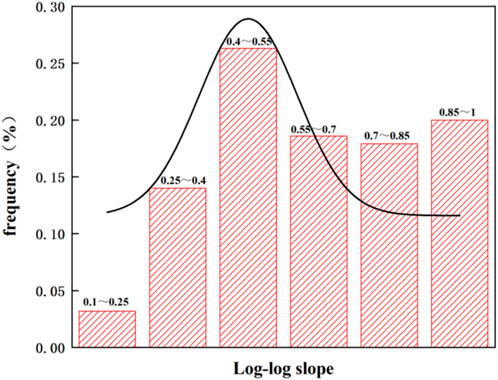
The situation of complex fracture extension is relatively intricate. As shown in Figures 6A, B, it can generally be categorized into two types: after the artificial fracture activates the natural fracture, (1) there is branching extension within the fracture; (2) after branching extension, there is directional change extension. As illustrated in Figures 7A, B, the double logarithmic net pressure curves for branching and directional change extensions show that during branching extension, the double logarithmic net pressure curve initially increases slowly and then linearly, with the slope increasing from small to large. In contrast, during directional change extension, the net pressure curve initially increases and then slows down, with the slope decreasing. The different trends in the slope changes of the double logarithmic net pressure curves for the two extension methods are mainly due to the sequence in which they occur. When the fracturing fluid activates the natural fracture, it flows and fills within the fracture, resulting in a slowly increasing net pressure curve. It then enters the directional change stage, where the net pressure continues to rise. Once the directional change is successful, the increased filtration area causes the slope of the double logarithmic net pressure curve to turn into a slow decline. As shown in Figure 8, the distribution of the double logarithmic net pressure slopes for the two extension situations indicates that the main frequency slope ranges from 1/4 to 1, accounting for 96.6%.

Figure 6. Complex joint extension [(A) Natural fractures branch and extend; (B) Natural cracks turn to extend].
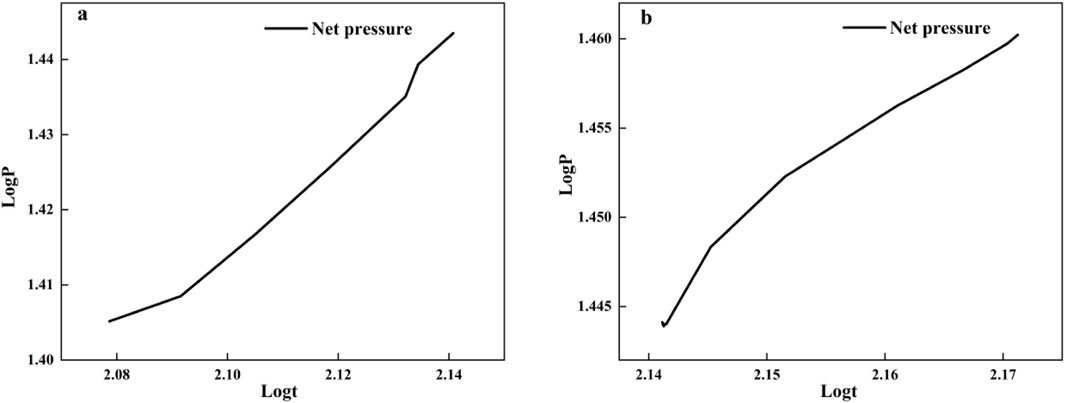
Figure 7. Double log of net pressure in both extension cases [(A) Double log of net branch extension pressure; (B) Double logarithm of the net pressure of the steering extension].
Therefore, the criteria for identifying complex fracture extension are: when the double logarithmic slope of the bottom-hole net pressure ranges from 1/4 to 1, and the net pressure value meets the critical conditions for the rupture of natural fractures in the fractured sandstone reservoir, it can be considered that the hydraulic fracture has formed a complex fracture.
The formulas for calculating σn and τ in Equation 16 are shown in Equation 17.
In the formula,
6.3 Blocked extension
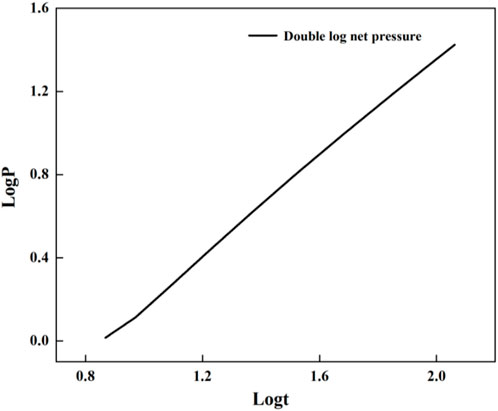
Blocked extension occurs when an artificial fracture encounters a natural fracture but fails to meet the conditions for fracture initiation, resulting in an impeded fracture extension process. As shown in Figure 9, the double logarithmic net pressure curve under blocked extension conditions indicates that the slope of the curve remains constant, continuing linear growth, which suggests that the pressure build-up occurs during the blocked extension stage, causing the net pressure to keep rising. As shown in Figure 10, the distribution of the double logarithmic net pressure slopes for blocked extension indicates that the main frequency slope ranges from 1/4 to 1, accounting for 96.8%.
Therefore, the criteria for identifying blocked extension are: when the double logarithmic slope of the bottom-hole net pressure ranges from 1/4 to 1, but the pressure value does not meet the critical conditions for the rupture of natural fractures in the fractured sandstone reservoir, it indicates that the hydraulic fracture is experiencing difficulty in extending, as shown in Equation 18.
6.4 Communication with natural fractures
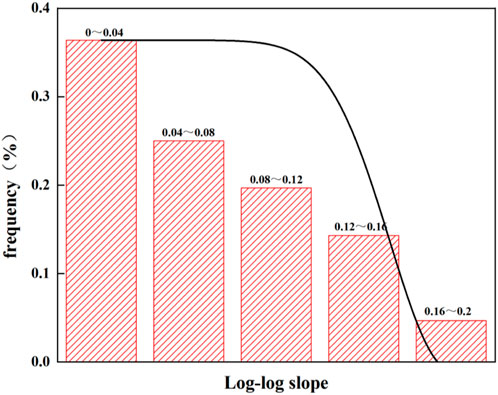
When an artificial fracture communicates with a natural fracture, two situations may occur: increased fluid loss and fluid loss equilibrium. Initially, when the artificial fracture activates the natural fracture, the opening of the natural fracture leads to increased fluid loss of the fracturing fluid. After some time, this increased fluid loss transitions to fluid loss equilibrium. As shown in Figures 11A, B, in the double logarithmic net pressure curves for increased fluid loss and fluid loss equilibrium, it can be seen that after the artificial fracture activates the natural fracture, the presence of the natural fracture causes a rapid increase in fluid loss, manifested as a rapid decrease in the slope of the double logarithmic net pressure curve. Once the fluid loss transitions from increased to equilibrium, the net pressure remains largely unchanged, with the corresponding double logarithmic slope also remaining essentially unchanged. In the case of increased fluid loss, the fracturing fluid continues to be lost, resulting in the double logarithmic net pressure slope being necessarily less than 0. For fluid loss equilibrium, as shown in Figure 12, the main frequency slope ranges from 0 to 1/6, accounting for 95.3%.
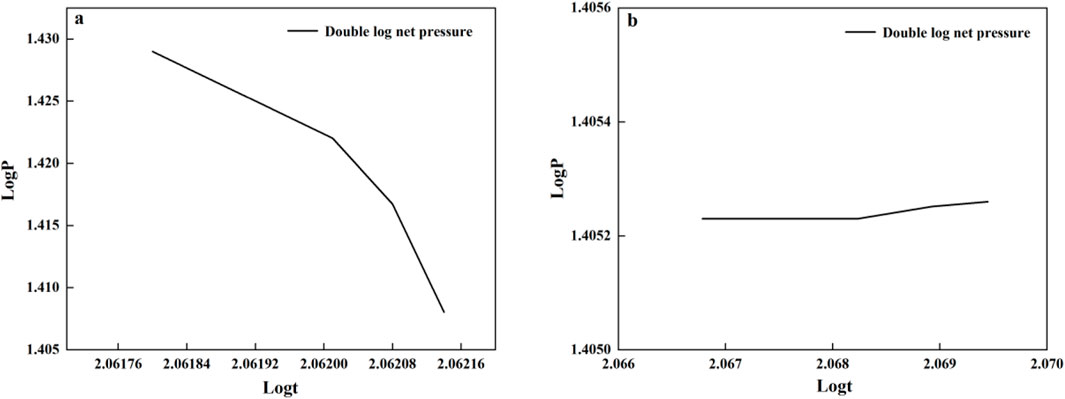
Figure 11. Double log of net pressure in both extension cases. (A) Double logarithm of the net pressure of the steering extension; (B) Double logarithm of the net balance pressure of filtration loss.
Therefore, the criteria for identifying increased fluid loss are: when the double logarithmic slope of the bottom-hole net pressure is less than 0, and the pressure value does not exceed the stress difference between the reservoir and the upper and lower barriers, it indicates that significant fluid loss of the fracturing fluid is occurring within the hydraulic fracture, as shown in Equation 19.
In the formula,
The criteria for identifying fluid loss equilibrium are: when the double logarithmic slope of the bottom-hole net pressure ranges from 0 to 1/6, it indicates that the amount of fracturing fluid injected into the reservoir is equal to the amount lost, and the fracture has not experienced further extension, as shown in Equation 20.
6.5 Fracture height penetration
Fracture height penetration refers to the process where the fracture, during its extension, breaks through the barrier of high-stress layers and expands in the vertical direction. At this point, the fluid loss area of the fracturing fluid also increases. The double logarithmic net pressure curve under these conditions is similar to that of increased fluid loss, both showing a continuous decline in the slope of the double logarithmic curve.
Therefore, the criteria for identifying fracture height penetration are: when the double logarithmic slope of the bottom-hole net pressure is less than 0, and the pressure value exceeds the stress difference between the reservoir and the upper and lower barriers, it indicates that the hydraulic fracture has broken through the reservoir barrier interface and is extending in the vertical direction, as shown in Equation 21.
The aforementioned study, through the correction calculation of bottom-hole net pressure and simulation of fracture extension using an integrated platform, has effectively utilized the slope of the double logarithmic net pressure curve as a breakthrough point. This approach has successfully achieved accurate identification of fracture extension patterns in fractured sandstone reservoirs based on bottom-hole net pressure curves after fracturing operations, thereby accomplishing the goal of deeply analyzing fracturing construction curves. As shown in Equation 22, in order to better characterize the communication between artificial cracks and natural cracks, the characterization parameter fracture complexity is introduced.
In the formula, S represents the complexity index of the fracture network after modification, which is dimensionless; TComplex join indicates the total time for the complex fracture extension mode, in minutes; and TTotal represents the total time for the fracturing operation, in minutes.
7 Application and effect analysis of the mining field
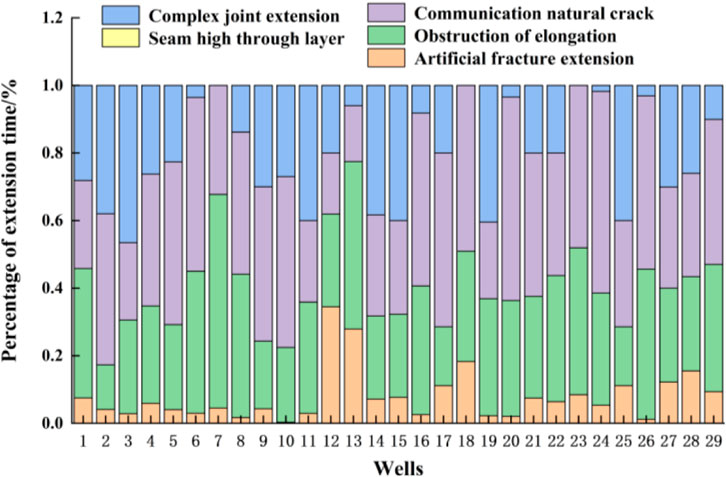
As shown in Figure 13, using the above-calibrated method for bottom-hole net pressure and the fracture extension mode identification mechanism for fractured reservoirs, an analysis was conducted on the fracture extension modes for 29 wells in the work area. It can be observed that none of the wells exhibit vertical fracture penetration. Based on the time proportions of fracture extension modes, two main categories emerge: (1) complex fracture extension and communication with natural fractures as the dominant mode; (2) extension impeded and communication with natural fractures as the leading mode. The overall modification effect in the work area is quite favorable, with wells primarily extending artificial fractures being in the minority; most wells achieve communication with natural fractures, yielding an average fracture network complexity index of 0.21.
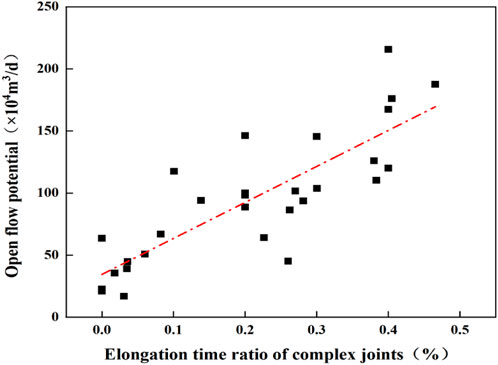
Figure 14 illustrates the relationship between the time proportion of complex fracture extension for each well and the open flow capacity. A strong positive correlation is evident, with a correlation coefficient of 0.7. This suggests that after the modification operations, the time proportion of complex fracture extension (fracture network complexity index) can be used to predict the post-fracturing productivity of the reservoir.
In this study, well A in the western Tarim Basin was selected for the field application and analysis of a fracturing construction curve diagnosis method for fractured sandstone. The main modification section of well A is the Bashkichik Formation (vertical depth/measured depth 6,813.00–6,961.00 m), with a reservoir depth of 6,887 m and a thickness of 148 m. The horizontal minimum principal stress in the modification section is about 2.14 MPa/100 m, with vertical stress at approximately 2.4 MPa/100 m and maximum horizontal stress ranging from 2.5 MPa/100 m to 2.6 MPa/100 m. The stress state indicates a potential strike-slip type, with an average horizontal stress difference of about 25 MPa. The average compressive strength of the Bashkichik Formation rocks is 98 MPa, with a Young’s modulus of about 29 GPa and a Poisson’s ratio of about 0.25. Due to the large modification span and thin mudstone layers, artificial fractures can easily activate natural fractures, hence the use of a temporary plugging and directional fracturing technique for modification.
FMI imaging logging data shows that natural fractures are well developed in the Bashkichik Formation of well A, indicating high overall fracturability of the reservoir. Analysis of logging data reveals that a total of 58 natural fractures were identified in well A, predominantly oriented northwest and northeast with high angles (almost exceeding 80°). The principal stress direction forms a moderate angle (less than 45°) with the direction of the natural fractures.
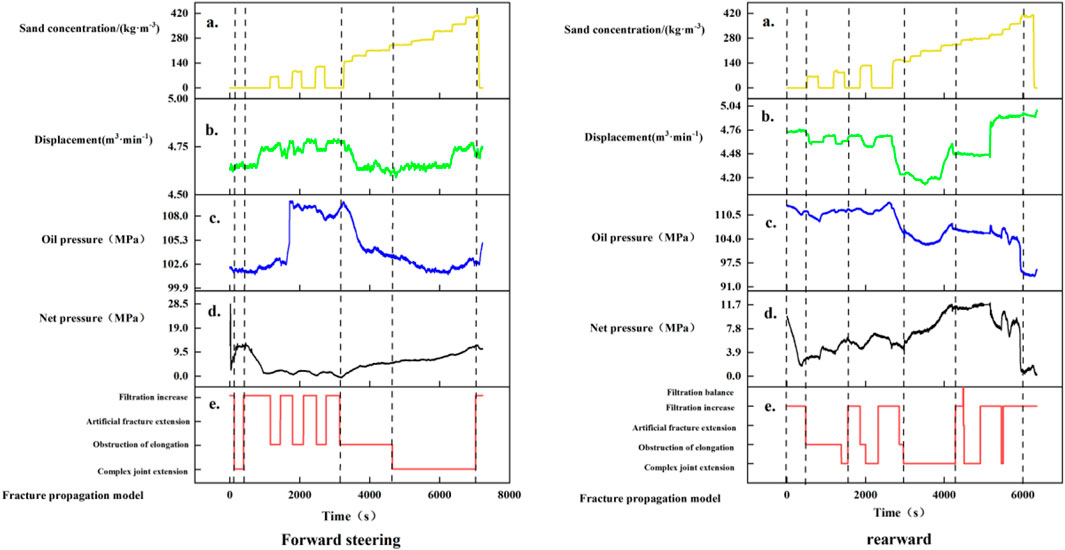
Based on the previously established fracturing construction curve diagnosis method for fractured sandstone, a diagnostic analysis was performed on well A’s fracturing construction curve. By calibrating the bottom-hole pressure, the net pressure curve was obtained, and the fracture extension modes were identified, allowing for an assessment of the overall effectiveness of the fracturing operation. Using the actual field parameters from well A and the Bashkichik Formation construction curve as an example, as shown in Figures 15A–E, the fracture extension modes before and after the directional change were identified using the fracturing construction curve diagnosis method.
Before the directional change, the dominant fracture extension modes included complex fracture extension, impeded extension, and communication with natural fractures (increased fluid loss), with time proportions of 30.44%, 36.49%, and 32.75%, respectively. During the early stage of the pre-fill phase, the bottom-hole net pressure exhibited an upward trend with minor fluctuations, indicating complex fracture extension and successful activation of natural fractures. Subsequently, the net pressure curve decreased while the oil pressure curve rose (212–1135 s), due to the gradual opening of natural fractures leading to increased fluid loss. From 1,150 s to 3,100 s, the net pressure curve showed periodic fluctuations, with alternating modes of increased fluid loss and impeded extension, attributed to continuous activation of natural fractures, causing changes in fluid loss area and periodic net pressure fluctuations. After 3,100 s, the net pressure curve continued to rise, indicating impeded extension. The increase in net pressure facilitated further extension and communication with more natural fractures. At 42,68 s, the fracture extension mode shifted from impeded to complex extension, indicating that the net pressure had surpassed the critical value, successfully activating natural fractures. The complexity index before the directional change was 0.35.
After the directional change, the dominant fracture extension modes shifted to complex extension and communication with natural fractures (increased fluid loss), with time proportions of 45.48% and 35.42%, respectively. Prior to the segmental sand plug, the net pressure curve sharply decreased, indicating increased fluid loss, as human-induced and natural fractures intersected, opening the natural fractures. The net pressure then rose overall (235 s–1,620 s), transitioning from impeded extension to complex extension mode. In the following stage (1,620 s–3,000 s), a combination mode of increased fluid loss, impeded extension, and fracture network extension appeared alongside changes in the net pressure curve. From 3,000 s to 4,180 s, the net pressure further increased, showing a prolonged period of complex fracture extension. In the final section, while the net pressure slightly declined, the dominant modes remained increased fluid loss and complex extension, suggesting significant natural fractures were activated in this stage. The complexity index after the directional change was 0.56.
Through the analysis of the bottom-hole net pressure recalibration and identification of fracture extension modes before and after the directional change in well A, it can be concluded that the formation of complex fracture extensions is closely related to net pressure. An increase in net pressure within a certain range can effectively communicate with natural fractures, facilitating the formation of complex fractures. Given the characteristics of fractured sandstone reservoirs, periodic trends in the net pressure curve may lead to branching and directional extensions of natural fractures, resulting in more complex multi-level fractures that enhance the effectiveness of reservoir modification.
8 Summary and insight
(1) Breaking through the conventional idea of calculating the net bottomhole pressure, a method of calculating the dynamic net bottomhole pressure of fracturing based on specific real-time fracturing construction data is established. Using the idea of “turning the whole into zero”, the net bottomhole pressure calculation results are more accurate by dividing the wellbore fluid into units, correcting the fluid volume and sand concentration of the fluid units at different moments, and correcting the formula of the indoor experimental fitted friction formula with the on-site construction friction, which is a more accurate calculation of the net bottomhole pressure.
(2) A fracture extension mode discrimination method based on fracturing construction curves in fractured sandstone is proposed, and five fracture extension modes are obtained, including artificial fracture extension, complex fracture extension, impeded extension, communicating with natural fracture, and fracture height penetrating through layers, etc. Among them, artificial fracture extension includes normal extension of the artificial fracture, extension through the natural fracture, and extension along the natural fracture at 0°; complex fracture extension includes branching extension and steering extension; communicating with the natural fracture includes filter loss increase, and natural fracture extension includes branching extension and turning extension; and the natural fracture extension includes branching extension and steering extension. Natural fracture includes loss of filtration increase and loss of filtration equilibrium. To achieve the detailed classification of man-ten fracture communication in fractured sandstone reservoirs after modification, the post-pressure fracture network complexity index is established based on the fracture extension pattern recognition mechanism, which shows strong positive correlation with the unimpeded flow after unimped modification in each well in the work area, and further deepens the understanding of man-ten fracture activation through the application of example wells in the mine.
(3) The diagnostic method of fracturing pressure curves in fractured sandstone reservoirs is of great theoretical value and practical significance for improving the theory of fracture extension in reservoir reforming, guiding the fracturing construction in the field, and evaluating the quality of post-pressure fracture network construction.
Data availability statement
The original contributions presented in the study are included in the article/supplementary material, further inquiries can be directed to the corresponding author.
Author contributions
MC: Conceptualization, Data curation, Funding acquisition, Project administration, Writing–original draft. HZ: Data curation, Software, Validation, Visualization, Writing–original draft, Writing–review and editing. JQ: Methodology, Software, Writing–review and editing. ZW: Data curation, Writing–review and editing. GY: Conceptualization, Writing–review and editing. CX: Writing–original draft. KC: Data curation, Writing–original draft. HX: Data curation, Conceptualization, Funding acquisition, Writing–original draft, Writing–review and editing.
Funding
The author(s) declare that financial support was received for the research, authorship, and/or publication of this article. The research was funded by Tarim Oilfield Company of CNPC under the project titled “Technical study on the evaluation of the geological effect of reservoir reforming in the foreland alluvial fault zone of Tarim Oilfield (041023070069).” The funder was not involved in the study design, collection, analysis, interpretation of data, the writing of this article, or the decision to submit it for publication.
Conflict of interest
Authors MC, JQ, ZW, and GY were employed by PetroChina Tarim Oilfield Branch Exploration.
The remaining authors declare that the research was conducted in the absence of any commercial or financial relationships that could be construed as a potential conflict of interest.
The reviewer XW declared a shared affiliation with the authors HZ, ZW, CX, KC, and HX to the handling editor at the time of review.
Publisher’s note
All claims expressed in this article are solely those of the authors and do not necessarily represent those of their affiliated organizations, or those of the publisher, the editors and the reviewers. Any product that may be evaluated in this article, or claim that may be made by its manufacturer, is not guaranteed or endorsed by the publisher.
References
Campos, D., Wayo, D. D. K., De Santis, R. B., Martyushev, D. A., Yaseen, Z. M., and Duru, U. I. (2024). Evolutionary automated radial basis function neural network for multiphase flowing bottom-hole pressure prediction. Fuel (Lond) 377, 132666. doi:10.1016/j.fuel.2024.132666
Changgui, X., Shusheng, G., and Hao, L. (2023). Numerical study failure characteristics of natural fracture under induced stress. Energy Rep. 10, 4332–4341. doi:10.1016/j.egyr.2023.10.089
Chen, H. (2024). Fine description of unconventional clastic oil reservoirs. Petroleum Res. 9 (2), 289–303. doi:10.1016/j.ptlrs.2024.01.013
Deng, J., He, J., Liu, J., and Song, H. (2024). Improved identification of fracture total factor characteristics and cross-scale flow channels by interpreting initial production data of horizontal wells. J. Clean. Prod. 450, 142005. doi:10.1016/j.jclepro.2024.142005
Fuqiang, S., Du, S., and Ya-Pu, Z. (2022). Fluctuation of fracturing curves indicates in-situ brittleness and reservoir fracturing characteristics in unconventional energy exploitation. Energy (Oxf), 252.
Gang, H., Zhangxin, C., and Ryan, S. (2023). Intricate unconventional fracture networks provide fluid diffusion pathways to reactivate pre-existing faults in unconventional reservoirs. Energy (Oxf), 282.
Gong, Y., and El-Monier, I. (2019). Microstructure diagnosis of the fractured tight sandstone using image analysis. J. Pet. Sci. Eng. 183, 106449. doi:10.1016/j.petrol.2019.106449
Haibo, L., Gang, L., Jialing, Z., Bai, J., and Jiang, Y. (2021). Research on calculation model of bottom of the well pressure based on machine learning. Future Gener. Comput. Syst. 124, 80–90. doi:10.1016/j.future.2021.05.011
Hong-Yan, Q., Jian-Long, Z., Fu-Jian, Z., Peng, Y., Pan, Z. J., and Wu, X. Y. (2023). Evaluation of hydraulic fracturing of horizontal wells in tight reservoirs based on the deep neural network with physical constraints. Pet. Sci. 20 (2), 1129–1141. doi:10.1016/j.petsci.2023.03.015
Hongyang, C., Tianbi, M., Weiyao, Z., and Lee, W. J. (2023). Flow diagnosis in variable bottom hole pressure multi-well horizontal pad with well interference using rate/pressure transient analysis. J. Pet. Sci. Eng. 220, 111216. doi:10.1016/j.petrol.2022.111216
JeongWon, H., Bangning, Z., Xiao, Z., Huang, K., Fang, V., and Xu, X. (2023). Associations between occurrence of birth defects and hydraulic fracturing activities in Barnett shale region, Texas. Heliyon 9 (4), e15213. doi:10.1016/j.heliyon.2023.e15213
Jin, S., Haijun, Y., Xiaomei, W., Chen, Y., Fang, Y., Zhang, H., et al. (2022). The genesis of gas condensates and light oilsin the lower paleozoic of Tarim Basin, NW China: the exploration implications for ultra-deep petroleum. J. Pet. Sci. Eng. 219, 111032. doi:10.1016/j.petrol.2022.111032
Jinzhou, Z., Yongqiang, F., Zhenhua, W., Song, Y., Ren, L., Lin, R., et al. (2022). Diagnosis model of shale gas fracture network fracturing operation pressure curves. Nat. Gas. Ind. B 9 (5), 448–456. doi:10.1016/j.ngib.2022.10.003
Ke, X., Haijun, Y., Hui, Z., Ju, W., and Fang, L. (2022). Fracture effectiveness evaluation in ultra-deep reservoirs based on geomechanical method, Kuqa Depression, Tarim Basin, NW China. J. Pet. Sci. Eng. 215, 110604. doi:10.1016/j.petrol.2022.110604
Leonardo, G., Sabah, M. R., Abba, S. I., and Yaseen, Z. M. (2023). Development of hybrid computational data-intelligence model for flowing bottom-hole pressure of oil wells: new strategy for oil reservoir management and monitoring. Fuel (Lond) 350, 128623. doi:10.1016/j.fuel.2023.128623
Le Zhou, Z., Hou, Z. K., Guo, Y. T., Zhao, H., Wang, D., and Qiu, G. Z. (2024). Experimental study of hydraulic fracturing for deep shale reservoir. Eng. Fract. Mech. 307, 110259. doi:10.1016/j.engfracmech.2024.110259
Liu, C., Rong, H., Chen, S., Tang, Y., and Deng, Y. (2024). Diagenesis and reservoir property variations of tight sandstone with burial depths ranging from shallow to ultra-deep in the Kuqa Depression, Tarim Basin, China. Nat. Gas. Ind. B 11 (2), 121–139. doi:10.1016/j.ngib.2024.03.001
Liu, M., Bai, B., and Li, X. (2013). A unified formula for determination of wellhead pressure and bottom-hole pressure. Energy Procedia 37, 3291–3298. doi:10.1016/j.egypro.2013.06.217
Luo, H., Li, H., Tan, Y., Li, Y., Jiang, B., and Lu, Y. (2020). A novel inversion approach for fracture parameters and inflow rates diagnosis in multistage fractured horizontal wells. J. Pet. Sci. Eng. 184, 106585. doi:10.1016/j.petrol.2019.106585
Peng, Q., Dakang, Z., Chen, S., Yang, X., Sun, H., Zhang, H., et al. (2023). A unique saline lake sequence in the eastern Tethyan Ocean in responses to the Palaeocene-Eocene thermal maximum: a case study in the Kuqa Depression, Tarim Basin, NW China. J. Asian Earth Sci. 250, 105594. doi:10.1016/j.jseaes.2023.105594
Qin, Q., Zhou, K., Wei, B., Du, Q., Liu, Y., and Li, X. (2024). Experimental and simulation study on deep reservoir fracturing technology: a review and future perspectives. Geoenergy Sci. Eng. 242, 213209. doi:10.1016/j.geoen.2024.213209
Sang, Y., Yi, S., Shouyi, W., Yongjun, X., Junjie, H., Yiting, W., et al. (2023). Novel phase field model of hydraulic fracture propagation in poroelastic media and numerical investigation of interaction between hydraulic fracture and natural fracture. Petroleum.
Shen, Z., and Ji, G. (2024). A model for evaluating fracture leakage based on variations in bottom-hole temperature and pressure during the fracturing process. Geoenergy Sci. Eng. 238, 212902. doi:10.1016/j.geoen.2024.212902
Wang, F., Zhang, S., and Cai, J. (2014). A simple analytical method for testing fracturing pressure decrement. J. Southwest Pet. Univ. 36, 115–120. doi:10.11885/j.issn.1674-5086.2014.02.14.01
Wang, Y., Liu, H., Hu, X., Dai, C., and Fang, S. (2024). Fracture network types revealed by well test curves for shale reservoirs in the Sichuan Basin, China. Energy Geosci. 5 (1), 100135. doi:10.1016/j.engeos.2022.09.005
Wu, G., Yu, W., Guo, H., Pan, B., and Liu, X. (2024). Investigation on water inrush fracture mechanics model based on fracture mechanics and microseismic monitoring. Ain Shams Eng. J. 15 (4), 102587. doi:10.1016/j.asej.2023.102587
Xianshan, L., Shaoyang, G., Peng, H., Li, Y., Zhu, R., Liu, S., et al. (2024). Blasingame production decline curve analysis for fractured tight sand gas wells based on embedded discrete fracture model. Gas Sci. Eng. 121, 205195. doi:10.1016/j.jgsce.2023.205195
Xiaodong, H., Guopeng, H., and Fujian, Z. (2022). Pressure response using wavelet analysis in the process of hydraulic fracturing: numerical simulation and field case. J. Pet. Sci. Eng., 217.
Yan, D., Zhao, L., Song, X., Tang, J., and Zhang, F. (1997). Fracability evaluation model for unconventional reservoirs: from the perspective of hydraulic fracturing performance. Int. J. Rock Mech. Min. Sci. 183, 105912. doi:10.1016/j.ijrmms.2024.105912
Yan, X., Qin, G. Y., Zhang, L. M., Zhang, K., Yang, Y. F., and Yao, J. (2024). A dual-porosity flow-net model for simulating water-flooding in low-permeability fractured reservoirs. Geoenergy Sci. Eng. 240, 213069. doi:10.1016/j.geoen.2024.213069
Yao, Z. (2018). Evaluating the complexity of fracture network using construction pressure curve. Beijing: China University of Petroleum.
Yu, H., Quan, G., and Andrew, H. (1997). Investigation of coupled hydro-mechanical modelling of hydraulic fracture propagation and interaction with natural fractures. Int. J. Rock Mech. Min. Sci. 2023, 169.
Yueliang, L., Xianbao, Z., Xianfeng, P., Zhang, Y., Chen, H., and He, J. (2022). Influence of natural fractures on propagation of hydraulic fractures in tight reservoirs during hydraulic fracturing. Mar. Pet. Geol. 138, 105505. doi:10.1016/j.marpetgeo.2021.105505
Zeng, F., Gong, G., Zhang, Y., Guo, J., Jiang, J., Hu, D., and Chen, Z. (2023). Fracability evaluation of shale reservoirs considering rock brittleness, fracture toughness, and hydraulic fracturing-induced effects. Geoenergy Sci. Eng. 229, 212069.
Zhao, Y., Bi, J., Wang, C., and Liu, P. (2021). Effect of unloading rate on the mechanical behavior and fracture characteristics of sandstones under complex triaxial stress conditions. Rock Mech. Rock Eng. 54 (9), 4851–4866. doi:10.1007/s00603-021-02515-x
Zhimin, W., Cuili, W., Ke, X., Zhang, H., Chen, N., and Deng, H. (2023). Characteristics and control factors of tectonic fractures of ultra-deep tight sandstone: case study of the Lower Cretaceous reservoir in Bozi-Dabei area, Kuqa Depression, Tarim Basin, China. J. Nat. Gas Geoscience 8 (6), 439–453. doi:10.1016/j.jnggs.2023.11.004
Keywords: construction pressure curve, diagnosis and recognition, fracture extension, Tarim Basin, hydraulic fracturing
Citation: Cai M, Zhang H, Qiang J, Wang Z, Yin G, Xie C, Chen K and Xi H (2024) In-depth exploration and application of fracturing construction curves in fractured tight sandstone reservoirs of the Tarim Basin. Front. Earth Sci. 12:1483485. doi: 10.3389/feart.2024.1483485
Received: 23 August 2024; Accepted: 12 November 2024;
Published: 24 December 2024.
Edited by:
Manoj Khandelwal, Federation University Australia, AustraliaReviewed by:
Jing Bi, Guizhou University, ChinaXiaochen Wei, Southwest Petroleum University, China
Hung Vo Thanh, Seoul National University, Republic of Korea
Copyright © 2024 Cai, Zhang, Qiang, Wang, Yin, Xie, Chen and Xi. This is an open-access article distributed under the terms of the Creative Commons Attribution License (CC BY). The use, distribution or reproduction in other forums is permitted, provided the original author(s) and the copyright owner(s) are credited and that the original publication in this journal is cited, in accordance with accepted academic practice. No use, distribution or reproduction is permitted which does not comply with these terms.
*Correspondence: Haojiang Xi, eGlkZWVhQGdtYWlsLmNvbQ==
 Mingjin Cai1
 Haojiang Xi