- 1China United Coalbed Methane National Engineering Research Center Company Limited, Beijing, China
- 2Information Institute of the Ministry of Emergency Management of PRC, Beijing, China
- 3Key Laboratory of Coalbed Methane Resources and Reservoir Formation Process of the Ministry of Education, China University of Mining and Technology, Xuzhou, China
- 4School of Resources and Geosciences, China University of Mining and Technology, Xuzhou, China
- 5Huayang New Material Technology Group Co., Ltd. No. 1 Coal Mine, Yangquan, China
Introduction: Coal reservoir fractures serve as critical storage spaces and migration pathways for coalbed methane (CBM), significantly influencing CBM enrichment. The characteristics of coal reservoir fracture development can be obtained using traditional simulation methods, but these still have shortcomings. This work presents an optimization approach for the traditional method.
Methods: This study introduces an optimization approach for traditional methods with two novel contributions. This study integrates the simulation of tectonic stress fields with fracture prediction, using surface sandstone fractures as constraints to reconstruct the paleostress field of the coal seam, while also accounting for the influence of coal thickness on fracture development to calculate fracture density.
Results: The predicted fracture density results were validated against measured values from the Bailongshan mine and Xiongdong coal mine with a relative error of approximately 12%, suggesting a reasonable degree of reliability.
Discussion: Based on the results of the fracture simulation predictions, it is believed that the coal seam fracture density in the study area is mostly 10–20 lines/m and that the sweet spot for CBM development is located in the Yuwang block.
1 Introduction
In coal reservoirs, the storage spaces and migration pathways of coalbed methane (CBM) are jointly formed by the pore–fracture system, which is an important index that determines the success of CBM development projects (Moore, 2012; Li and Liu, 2022; Zhang et al., 2019). Most of the regional fractures are formed under the control of tectonic stresses; hence, the characteristics of the tectonic stress field determine the spatial distribution, development, and evolution of these fractures (Zhou et al., 2006; Liu et al., 2023). Concurrently, most coal-bearing basins experience superimposed and reworked tectonic processes of varying magnitudes and phases, including compression, shearing, and extension (Liu et al., 2000). Tectonic movements control the formation and distribution of fractures and pores in coal reservoirs, reshaping their structural characteristics and ultimately altering the permeability of the coal reservoir (Ju et al., 2005; Pang et al., 2017). Accordingly, numerical simulations are used as feasible and practical approaches for restoring the paleo stress fields and predicting fractures in coal reservoirs.
In the 1990s, Qian et al. (1994) explored the use of numerical simulations to invert the stress field for fracture prediction, and this approach has been used in oil and gas fields. Numerical simulation of the tectonic stress field involves establishing a numerical model of the study area to simulate and calculate the stress field distribution using finite element software (Carminati and Vadacca, 2010; Zhou et al., 2021; Ren, 2019). Wu et al. (2011) used numerical simulation to study the fracture development in the Longmaxi formation; Wang et al. (2016) numerically simulated the low-permeability sandstone reservoirs of the Yanchang Formation using ANSYS software. Wang (2007) combined rock mechanics with numerical simulation to establish a quantitative relationship between the stress field and fracture parameters as well as realize quantitative fracture predictions; this method was successfully applied to the Dina gas field. Since then, numerical simulations have been widely used for quantitative predictions of reservoir fractures. Predicting reservoir fractures based on the paleo stress field is more accurate (Fang et al., 2005; Fang et al., 2017); however, this method has been primarily used on sandstone, carbonate, and shale formations, with relatively fewer studies on fracture prediction in coal reservoirs.
Studies have shown that fracture development is influenced by the thickness of the rock formation (Dixon, 1979). McQuillan (1973) and Ladeira and Price (1981) showed that fracture spacing has a linear relationship with layer thickness when the layer is less than 1.5 m thick or a nonlinear relationship when the layer thickness exceeds 1.5 m. Jiang and Wang (2015) noted that there is an exponential relationship between the fracture density of the rock layer and its thickness. However, most reservoir simulations are based on basic mechanical properties, such as Poisson’s ratio and Young’s modulus, and do not take into account the effects of reservoir thickness on the fractures.
Therefore, this paper introduces an optimized method for predicting fractures in CBM reservoirs. The proposed method uses surface fractures as boundary constraints to initially simulate the paleotectonic stress field during the critical period of fracture formation. Subsequently, by considering the influence of thickness on the evolution of the coal seam fractures, an optimized fracture prediction model is used to forecast fractures in the 9# coal seam of the established mining area. Finally, based on the fracture prediction outcomes, the sweet spots for CBM development are delineated, thereby establishing a foundation for further exploration and development.
2 Geological conditions and the key period of fracture formation
The geotectonic position of the Laochang area is in the Pu’an-Shizong depression of the Nanpanjiang-Youjiang basin. The Youjiang Basin (Figure 1) is along the southwestern margin of the Upper Yangzi landmass; it is connected to the North Vietnam landmass in the southwest, to the Yinzhi landmass through the Jinshajiang-Maoguishan Suture Belt and Majiang Suture Belt, and to the Qinzhou Suture Belt in the southeast. The basin is bounded by the Mile-Shizong Fault in the northwest and Ziyun-Luodian Fault in the northeast. Inside the basin, the northwest Baise-Longlin Fault and northeast Nanpanjiang Fault are developed.
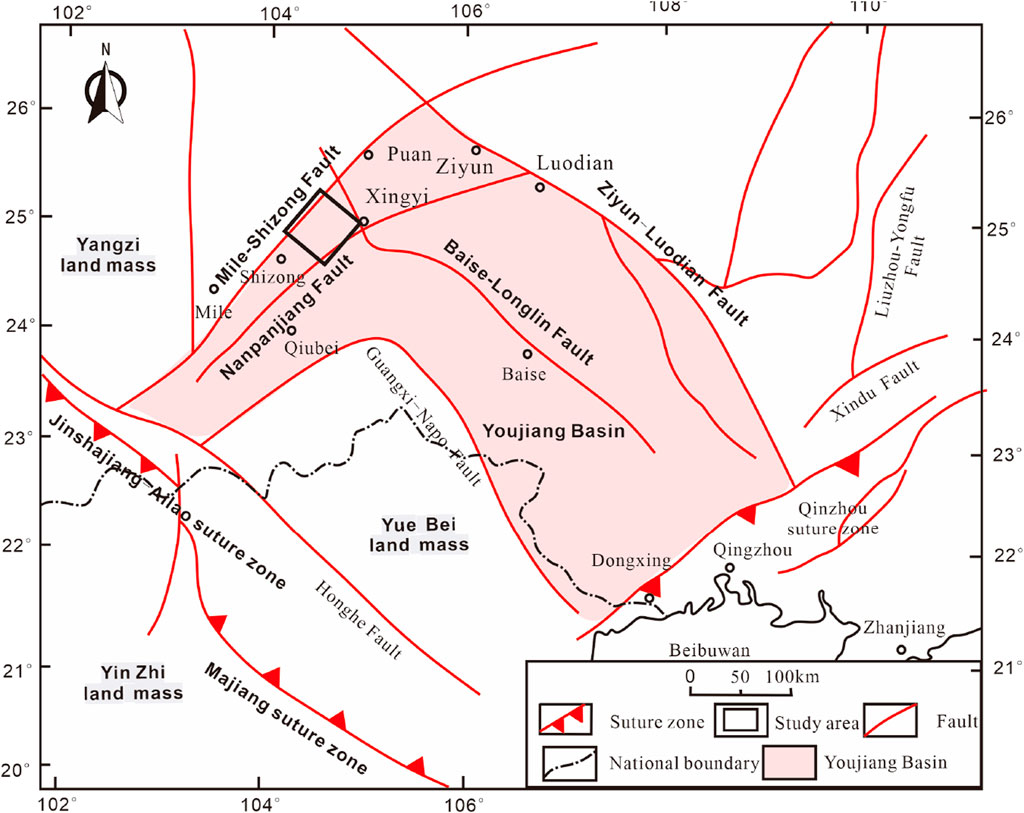
Figure 1. Tectonic outline of the Youjiang Basin (Gui and Wang, 2000).
2.1 Stratigraphy and coal-bearing strata of the study area
In the Laochang area, the strata exposed from oldest to youngest include the Permian system: Maokou Formation (P2m), Longtan Formation (P3l), and Changxing Formation (P3c), the Triassic system: Kaiyuan Formation (T1k), Feixianguan Formation (T1f), Yongning Formation (T1y), and Gejiu Formation (T2g), as well as the Quaternary system (Q). The distribution of outcrops is controlled by the structural influences of the Laochang anticline, with the exposed strata becoming progressively older toward the core of the anticline. The Upper Triassic strata are missing, and only the Wailu Formation is in direct contact with the Quaternary unconformity in the area.
The coal-bearing strata in the Laochang area belong to the Upper Permian Longtan Formation (P3l) and Changxing Formation (P3c). The Longtan Formation is divided into upper and lower parts, with the main exploitable coal seam 9# being concentrated in the upper part; its thickness ranges from 0 to 17.53 m, and the total exploitable thickness is approximately 18.46 m. The lower part of the Longtan Formation is dominated by tuff, sandstone, shale, and coal seams. The Changxing Formation contains the main recoverable coal seam 6# with a single-layer thickness of 0–6.65 m and total recoverable thickness of approximately 8.97 m; it is in conformable contact with the base of the Longtan Formation. The present study focuses on the 9# coal seam of the Longtan Formation.
2.2 Tectonic features of the study area
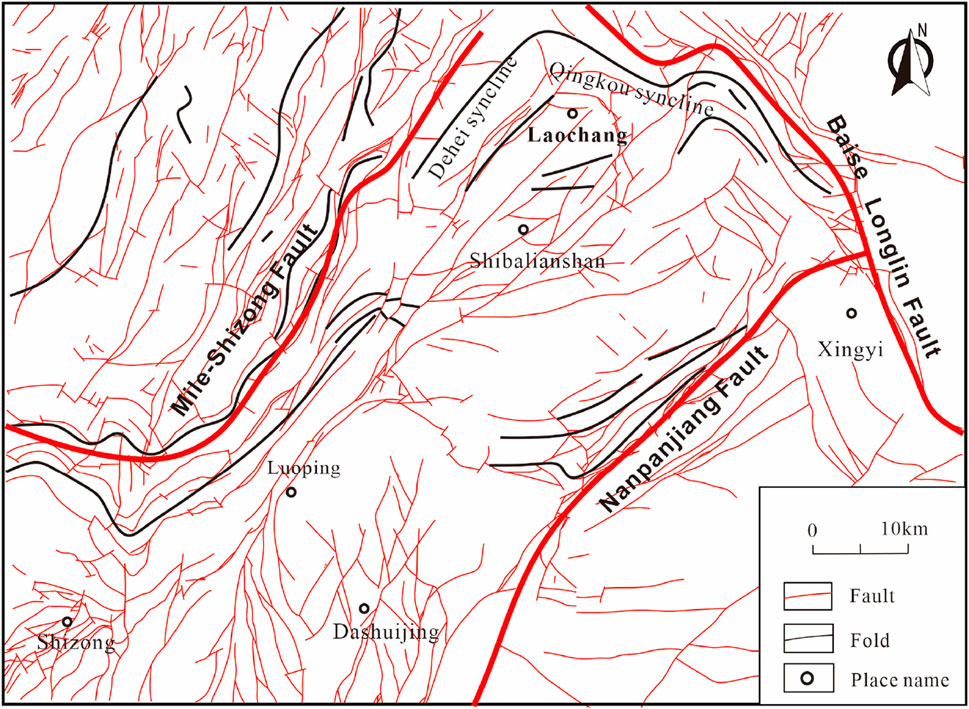
The Laochang area is surrounded by the Baise-Longlin Fault, Nanpanjiang Fault, and Mile-Shizong Fault, which divide the South China landmass from the Yangzi landmass. Moreover, there are ancient uplifts between the fa zones located near the Laochang and Dashuijing areas. Owing to the ancient uplifts, the area surrounding Laochang has developed interspersed dome and basin structures; arcuate structures parallel to the boundaries of the uplift are also formed near the margins (Figure 2). For instance, an arcuate fault zone developed in the southern part of the Laochang area, while the northern and western parts formed the Dehei-Qingkou arcuate compressional deformation belt. The central part features a rhombic dome, the eastern part has a clockwise rotating pivot structure, and the northern part has a series of extensional faults (Wang, 2007).
During the Indosinian movements, the southern part of the Nanpanjiang Fault was extruded by NNW-SSE stresses, and these stresses changed to NW-SE on the northern side of the fault. At the same time, owing to the existence of the Dashuijing ancient uplift, folds were formed parallel to the Nanpanjiang Fault and boundary of the Dashuijing ancient uplift, which then compounded to form the arcuate structures of the Tsuiyang Fault and Xiaolajia Fault. Thus far, the main tectonic framework of the study area was formed under the influence of the Indosinian stress field. During the Early and Middle Yanshanian periods, the study area was subjected to NE-SW compressive stress; during the Late Yanshanian period, the study area was in a NWW-SEE tensile environment; during the Himalayan period, the area was transformed into an EW extensional stress environment, which further modified the tectonics of the study area (Guo et al., 2004).
2.3 Characteristics of fracture development and the key period of formation
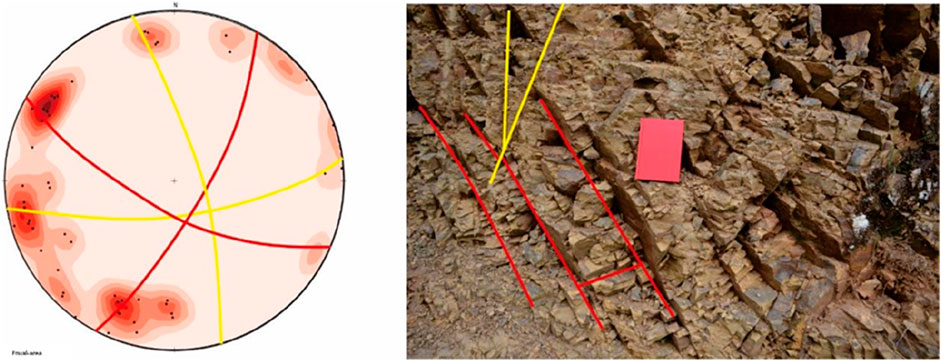
Owing to weak tectonic deformations in Yuwang and its surrounding area, the recovered paleo stress field based on the statistical fracture data is more credible. In addition, the fractures in the study area are predominantly conjugate shear joints, which are conducive to restoring the paleo stress field. Using the stereographic projection method, the original orientations of the structural fractures in the horizontal state of the rock layer were restored. Based on the corrected fracture data, a contoured equal-area projection map was drawn to determine the dominant orientations of the conjugate structural fractures.
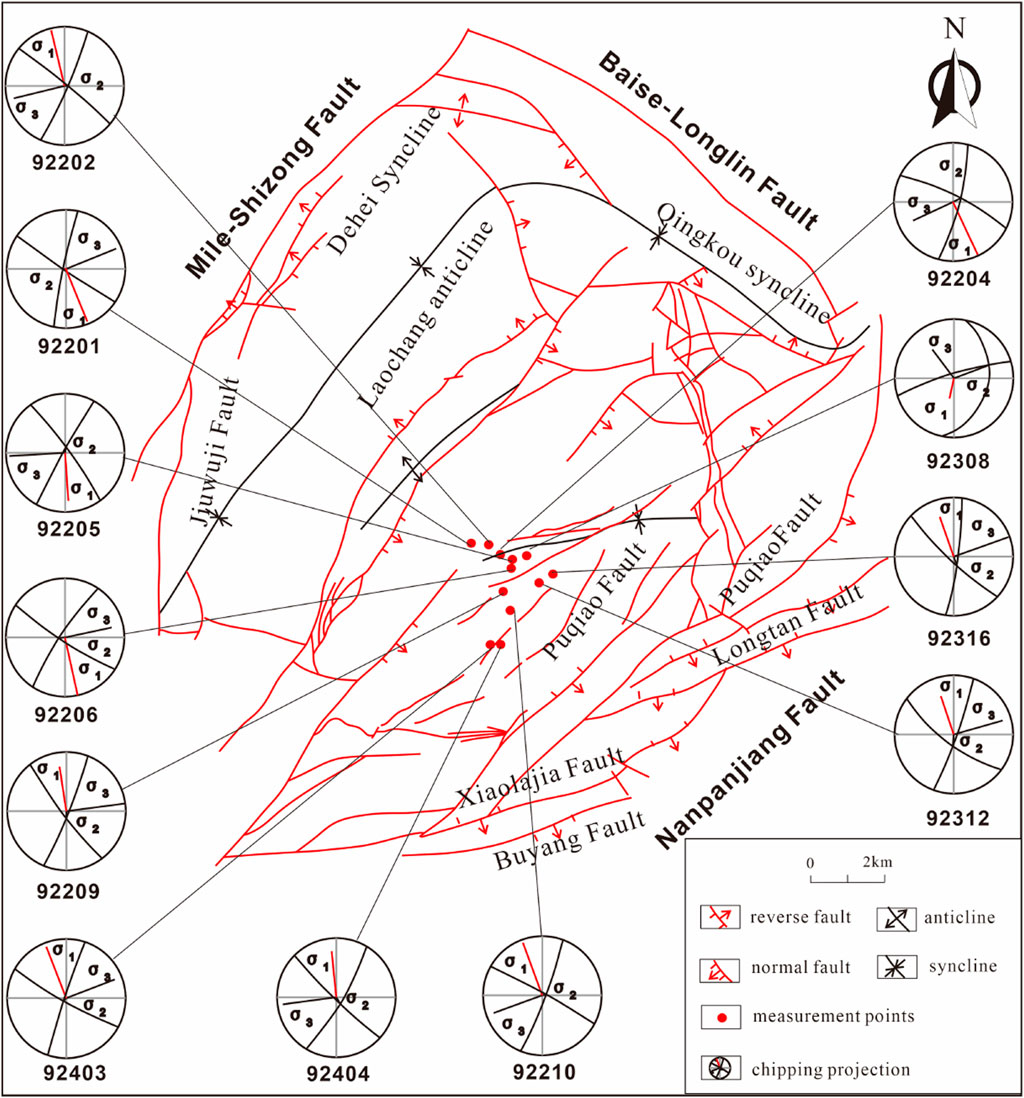
To investigate the fracture development in the study area, we selected 19 outcrops to calculate the orientations and density of fractures from different formational episodes to reconstruct the principal stresses individually. The results show that the fractures in the study area experienced three stages of tectonics in different directions. The statistical results indicate that a total of 12 outcrop fracture measurement points predominantly show development of the NW-NNE fractures, and the maximum compressive stresses recovered in the NNW-SSE direction, which belongs to the Indosinian period (Figure 3). Three of the field outcrop fracture measurement points focus on the development of the NNW-NEE fractures, and the maximum compressive stresses are in the NW-SE direction, which belongs to the Early and Middle Yanshanian periods. Four of the fracture measurement points show dominant fractures developing in the NE-NWW direction, with the maximum compressive stresses being in the NEE-SWW direction, belonging to the Himalayan period (Figure 3). Obviously, the Indosinian fractures account for a higher proportion in the study area, and it is assumed that the tectonic stresses of the Indosinian movements have the greatest influence on fracture formation in the study area.
For instance, at the 92404 fracture point (Figure 4), the Feixianguan Formation is exposed with yellowish-brown thin-bedded silty fine sandstone. The strike and dip of this formation is 130°∠10°, indicating a relatively gentle stratification with the development of two sets of fracture systems. The fracture dip is significant and nearly perpendicular to the stratum. The first set of conjugate shear fractures trend NW and NNE, indicating NWW-SSE compressional stress from the Indosinian period; the second set of conjugate shear fractures trend SWW and NNW, indicating NW-SE compressional stress from the Yanshanian period.
3 Fracture prediction principles
In this paper, fracture development in the surface rock layers was taken as a constraint, and ANSYS finite element simulation software was used to invert the paleotectonic stress field during the critical period; then, the fracture density computation model was used to predict the density and orientation of the fractures by taking the rock layer thickness into account. Thus, it is necessary to first clarify the mathematical theoretical model of stress on the density and orientations of the fractures.
3.1 Relationship between fracture density and stress
Fractures are formed when the rock stress approaches or exceeds its ultimate strength, such that the internal binding force of the rock is damaged and the rock is no longer integral, thus producing deformations of various sizes. Accordingly, fracture deformations can be described as local responses of the rock to applied stress. According to the Mohr–Coulomb model of fracture strength, each rock variety has its own inherent shear strength τ0. Under the premise that all other conditions remain unchanged, τ0 is a constant. For a given cross section of the rock, when the applied shear stress reaches or exceeds τ0, shear fractures may be formed along the section. Wang (2007) established the following equation set based on energy conservation (Figure 5):
where Wf is the energy dissipated during loading; considering that the energy dissipated as elastic waves is negligible, the loading energy denotes the power consumed during fracture formation (J/m3). Furthermore, E is the elastic modulus of the rock stratum (GPa);
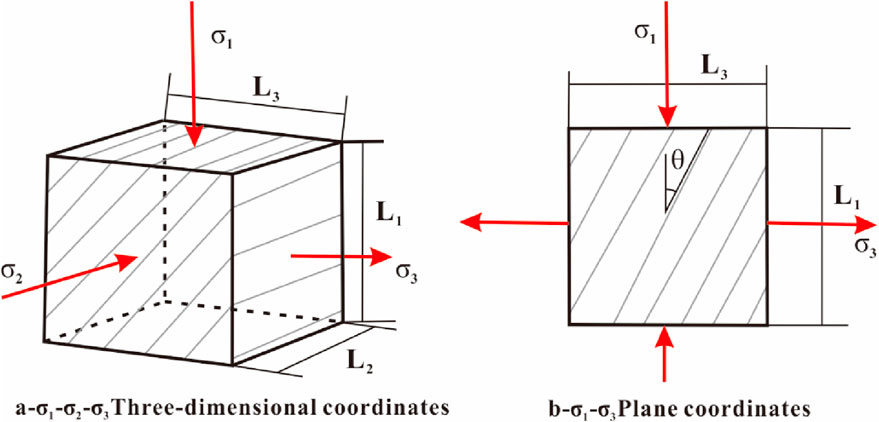
Figure 5. Relationships between the parameters and stress for fractures within the representative elementary volume (Wang, 2007).
The confining pressure impedes fracture formation as the energy accumulated in the rock needs to overcome the intrinsic cohesion due to the intermolecular forces as well as the confining pressure to experience lithological disruption and form a fracture. The surface energy of the fractures is a combination of the effects of the intrinsic properties of the rock and pressure impediments to fracture formation. According to the theory of maximum strain energy density and maximum tensile stress in brittle fracture mechanics, brittle materials like rocks fracture when the rate of release of the elastic strain energy accumulated in the material is equal to the amount of energy required to produce a unit area of the fracture surface. Therefore, the following energy equation is established:
Adopting the fracture bulk density to describe the fractures comprehensively reflects the fracture information and is less affected by the size of the unit; however, this is not conducive to the study of fractures in coal reservoirs. In fracture research, emphasis is placed on the fracture trace density (or fracture spacing), which refers to the number of fractures per unit length (with fracture spacing being the reciprocal of the fracture line density). Consequently, it is necessary to establish a formula for the fracture line density.
In particular, the volume and trace density of the fractures can be converted as follows:
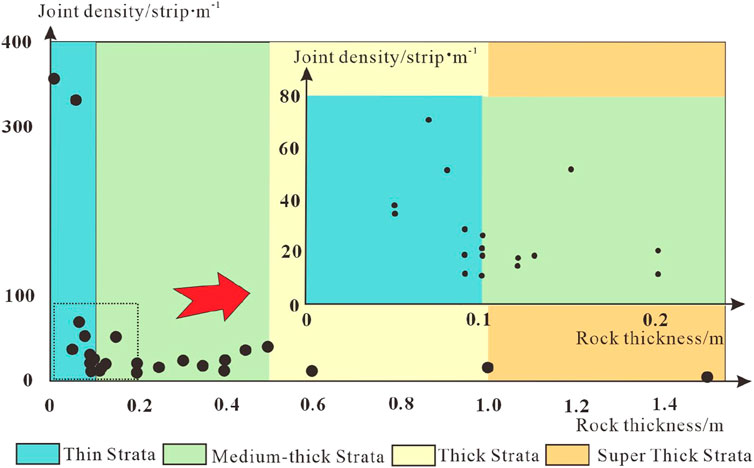
According to Equation 3, there is no necessary relationship between the fracture line density and stratum thickness. However, Jing et al. (2014) and Wang (2014) believed that there is a negative power function relationship between the two variables. When the rock stratum is thin (thickness: <10 cm), the stratum thickness has the most significant influence on fracture line density. When the rock layer is medium-thick (thickness: 10–50 cm), the influence of the formation thickness on the stratum declines rapidly. In some areas, the fracture density may increase abnormally under the influence of tectonics. If the stratum is thick or superthick, the fracture line density is comparatively low and tends to be stable. The fracture data compiled from previous field outcrop observations show a similar negative power function relationship between the fracture line density and stratum thickness (Figure 6).
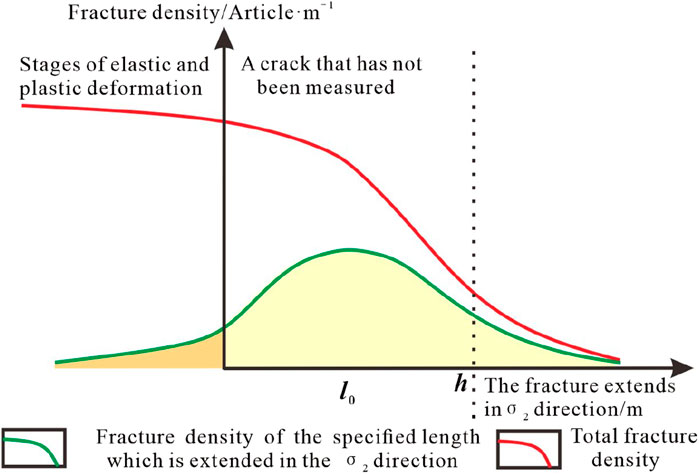
Wang (2007) proposed a model that does not consider the effect of thickness on the fracture line density; here, it was considered that the depth of the fracture formed under stress is greater than the rock thickness, i.e., the fractures extend throughout the model. However, during fracture formation, although some of the microfractures eventually extend throughout the model to form fractures, there are still numerous microfractures with depths less than the rock thickness that are unable to penetrate the entire model or can only form small fractures inside the rock. During actual measurements, such fractures are not counted, resulting in lower measured fracture line density values.
In addition, owing to the non-homogeneous nature of the rock, there are bound to be differences between the fractures in the homogeneous model and those in the actual rock. This means that under stress, the lengths of the fractures formed by interconnected microfractures in the direction of
For rocks of thickness h, fractures with lengths greater than h in the
where
Theoretical analysis results were compared with the field survey outcomes, and it was found that the expected value of the fracture length along
3.2 Relationship between fracture orientation and stress
Based on the Mohr–Coulomb shear fracture criterion, an angular bisector of the conjugate fractures is in the stress direction. If the stress direction is known, we only need to acquire the rupture angles of the coalbed fractures under stress to roughly predict the orientations of the coal reservoir fractures. Based on long-term geological research, Ramsay (1980) proposed that the conjugate shear angle is variable, i.e., it can be less or more than 90°. However, according to the Cullen–Moore rupture criterion, there are no rupture angles larger than 90° or that such angles larger than 90° cannot be expressed mathematically. Although the relationship between the conjugate shear angle and confining pressure can be expressed by envisioning the ultimate stress Moore envelope as a parabola, when the conjugate shear angle is close to 90°, the field measurement is at 0.5°, and the error of the derived pressure reaches several orders of magnitude. Later, Lin (1993) improved this method by replacing the parabola with an ellipse to better represent the relationship between the conjugate shear angle and confining pressure. Accordingly, Lin (1993) proposed an ellipse parameter t as follows:
When
By substituting Equations 6, 7 into Equation 8, i.e., the measured values of shear strength and cohesive force of the rock, the theoretical value of the rupture angle can be obtained. Thus, under the premise of a known stress direction, the fracture orientation can be clarified.
4 Coal reservoir fracture prediction
Fractures formed under the influence of tectonic stress exhibit a spatial distribution and an evolutionary development dictated by the regional tectonic stress field. Research on fracture formation and distribution in the Laochang area show that the fractures are formed under the control of lithology and tectonic stress as well as the influence of rock stratum thickness. The tectonic stresses exerted on rock strata and coal reservoirs are consistent to a certain extent. Thus, ANSYS finite element numerical simulations were conducted to establish a prediction model by placing the coal reservoir and a certain thickness of the rock layer in the same stress field. Field measurements of the fracture density values of the outcrop rock layers and surface structural characteristics were adopted as constraints to fulfill the equivalent stress inversion during the critical period of fracture formation in the study area. Hence, the overall fracture development and distribution rules can be predicted for the coal reservoir in accordance with the distribution of the surface fractures. Subsequently, by incorporating the thickness of the simulated coal seam stratigraphy from the study area in the mathematical model, it is possible to obtain the predicted fracture density distribution within the coal reservoir that closely matches the actual measured fracture density (Figure 8).
4.1 Prediction model
The construction of the prediction model entails building a unified geometric model, building the model, and mesh generation.
4.1.1 Unified geometric model
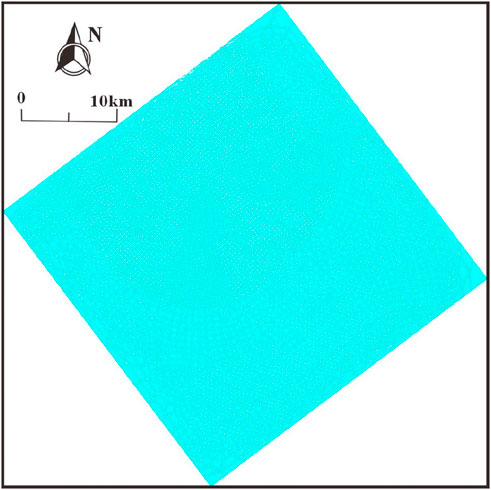
Since the formation of the Permian coal measures, the Laochang area primarily experiences tectonic movements due to Indosinian, Yanshanian, and Himalayan influences. As observed from the field fracture measurement data and principal stress restoration results, the Indosinian period is the critical stage of fracture formation; therefore, we consider it as the target period for this simulation. However, stresses in the Laochang area during the Indosinian period vary in both direction and magnitude, which is not conducive to the establishment of the model. Hence, the model scope was extended to the southern district of the Laochang area. In this case, the entire model roughly covers places from the Laochang ancient uplift to the northeastern boundary of the Dashuijing ancient uplift. Based on the geological evolution of the Laochang area, the model is initially simplified by removing the structures formed during and after the Indosinian period while retaining only the basement structures that existed before. Finally, to facilitate stress loading, the model was rotated to generate a simulation model for the Laochang area (Figure 9).
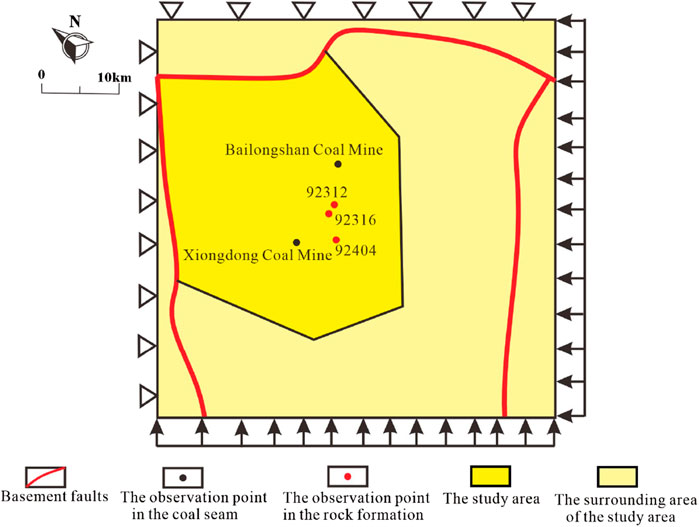
Figure 9. Schematic illustration of the coal reservoir fracture development prediction model for the Laochang area.
The stresses should be applied so that they are maximally consistent with the actual scenarios. During the Indosinian period, the closure of the Mayang River and Qinzhou remnant troughs almost created a south–north stress, but the study area was influenced by the Nanpanjiang Fault such that the direction of stress shifted to NNW-SSE. This result is consistent with the stress recovery results from the fractures in the field. According to the tectonic framework surrounding the Laochang area, the Dashuijing ancient uplift and Nanpanjiang Fault are deemed to be located to the southwest and southeast of this area, respectively. In the actual process of tectonic evolution, different modes of stress attenuation produced different stress strengths and directions near the Laochang area. Based on the structural outline map of the Luoping area, it is inferred that stress along the southeastern boundary of Laochang area is in the northwest direction, and fault zones and folds are densely formed along the Nanpanjiang Fault by the stresses applied directly on it during the Indosinian period. Along the southwestern boundary of the Laochang area, the stresses are almost in the south–north and NNE directions, resulting in simple faults and wide but gentle folds; the reason for this is that the stresses from the Indosinian movements act on the Dashuijing ancient uplift via the Nanpanjiang Fault and finally affect the Laochang area, which could lead to stress attenuation to a certain extent. Basement faults were found at the northwest and northeast boundaries of Laochang area. Therefore, the stress status of the surroundings for the model is designed as follows. In addition to inward extrusion along the ancient uplift boundary, the southeastern stress is far greater than the southwestern component. Moreover, the displacements of the basement faults remain unchanged. The rock mechanical parameters of the Laochang area are obtained experimentally from the collected samples (Table 1).
4.1.2 Model construction
Transformation from a geometric to geological model was realized by attaching the rock mechanical parameters representing the properties of different units to the geometric model. In combination with the results of the field geological survey, the siltstone of the Feixianguan Formation exposed in the Laochang area was selected as the reference stratum. Based on the rock mechanical experiments, the Young’s modulus and Poisson’s ratio that represent the mechanical properties of the rock were included with the original model to establish the geological model for siltstone in the Laochang area.
Once the geological model is constructed, the unit model must be selected. Generally, for the 3D geological model, PLANE183 is selected as the basic unit in the finite element analysis.
4.1.3 Mesh generation
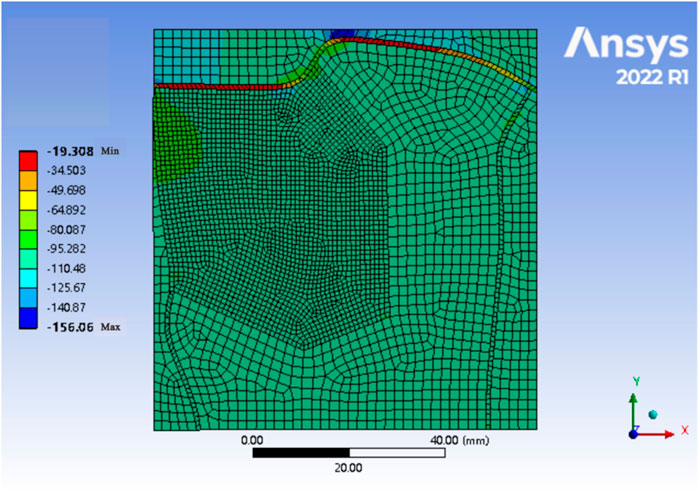
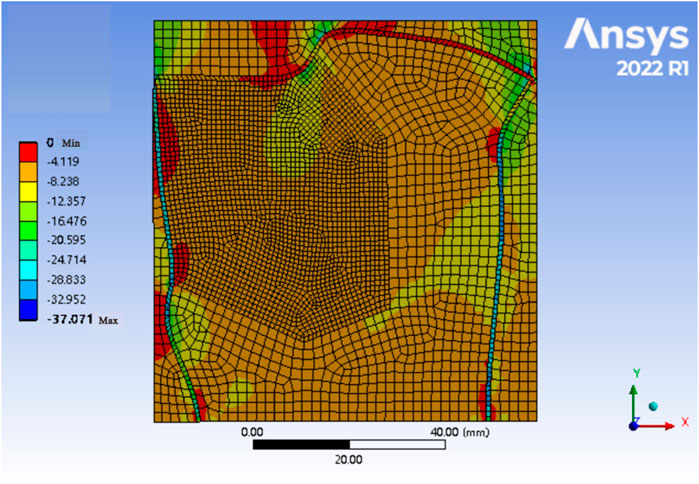
Given the complex geological conditions, the automatic mesh division methods available in simulation software cannot accurately represent the complex geological structures and lithologies. However, manual mesh division can take into account different material properties. During mesh division, rock bodies with different material properties should be categorized with different units, and the parts wherein the rock properties vary should be refined using a denser mesh where appropriate. It is also important to avoid the use of obtuse angles within the units. Concurrently, the special characteristics of the strata and structures must be considered to determine the combination of units and specific division method to be employed. In accordance with mesh generation principles, quadrilateral meshes were primarily adopted in this work. Specifically, the geological model of the entire research area was divided into 5,609 elements and 18,925 nodes to reflect the geological tectonic characteristics of the main research area (Figure 10).
4.1.4 Data selection and processing
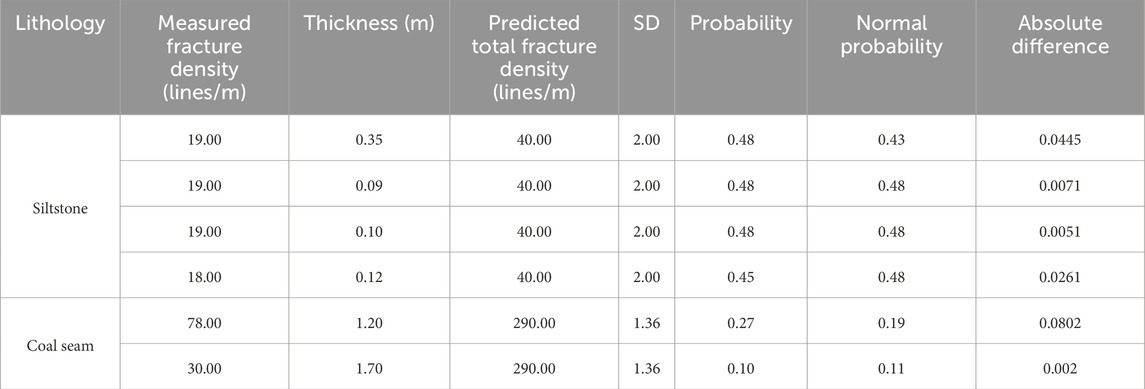
The data from field measurements are first screened, and the fracture points from the Indosinian period are selected and classified according to lithology. Then, the variance of the fracture density in the mathematical formula is calculated based on the relationship between the rock layer thickness and fracture density (Table 2).
4.1.5 Mechanical model
Using the generated mesh, the boundary conditions of the stress field were loaded for the study area to realize conversion from a geological model to a mechanical model. In addition to applying appropriate stresses along the bottom and right-side boundaries of the model, constraints were imposed on the model boundaries adjacent to the Mile-Shizong Fault and Baise-Longlin Fault to restrict displacement of the basement faults.
As seen from the previous paleo stress measurements from the vicinity of the research area, the corresponding differential stress was designed as approximately 100 MPa. By applying stresses to the boundaries along the sides of the model, the stress distribution was obtained for the research area, followed by calculation of the fracture density predicted using the constrained points. Then, the calculated and measured fracture density values were compared, and the errors between them were further analyzed. Finally, the stress magnitudes along the sides were adjusted according to the experimental findings. By ensuring that the differential stress magnitudes remained roughly unchanged, the above procedures were repeated until the predicted fracture density of the surface was maximally similar to its measured value.
Error analysis was performed based on the relative errors calculated as follows:
where R is the relative error.
Considering that the fracture densities measured during the field survey may have errors, especially when the values at the observation points are rather low, the relative errors may greatly inconvenience the overall error analysis. Hence, absolute error is introduced to support the error analysis as follows:
where r is the absolute error.
The fracture density was calculated using the simulation results of the maximum and minimum principal stress values under varying stress conditions (Figures 11, 12). Under the condition that the extremal stress values are 8 MPa and 100 MPa, the predicted fracture density calculated by using Equation 5 is slightly different from the measured value with respect to the constraint points. Specifically, the relative errors are all below 9%, and the absolute errors are less than 2 fractures per meter, which are calculated by using Equations 9, 10.
4.2 Prediction results
By modifying the mechanical parameters of the surface geometric model as well as lithological parameters used in the calculations, it is possible to perform a forward modeling of the structural evolution of the coal reservoir by substituting the thickness of the coal seam at each point in Equation 4. This allows the simulation and prediction of the fracture density as well as fracture orientations within the coal reservoir.
4.2.1 Fracture density distribution prediction
Using the self-programmed command flow, all node coordinates and stress values of the paleo stress field simulation results were extracted, and the fracture density prediction was calculated using Equations 1–3. Finally, the node coordinates and predicted fracture density were imported into Surfer to draw the contour map of the overall fracture density of the coal reservoir (Figure 13). Xiao (2017) reported that the overall fracture density in the Laochang area is mainly controlled by large-scale boundary faults and ancient uplifts, while the local fracture density anomalies are influenced by different tectonic combinations in the area. Based on the current results from the paleo stress field study on the key period of fracture formation in the study area, we note that Laochang and its surrounding areas were subjected to NNW-SSE stresses during the Indosinian period, which resulted in bidirectional lateral extrusion stresses perpendicular to the boundaries of the Nanpanjiang Fault and Dashuijing ancient uplift. Thus, the fracture density in the study area gradually decreases from the southeast to northwest direction.
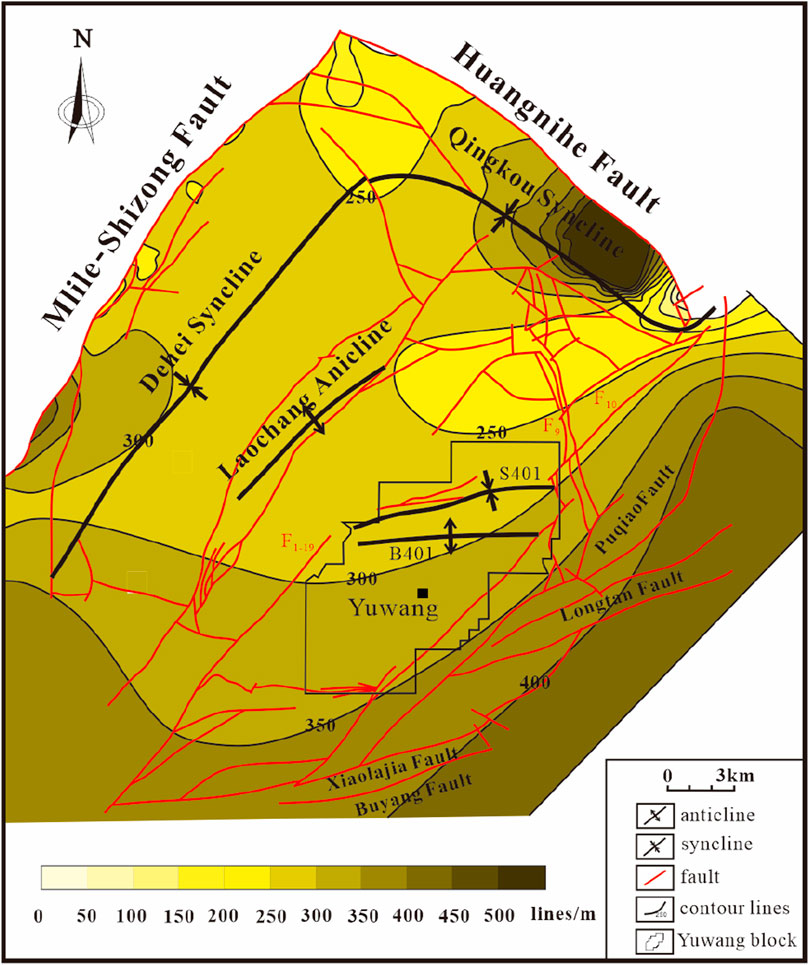
Figure 13. Contour map of the predicted fracture density for coal reservoirs in the Laochang area without considering stratum thickness.
The findings of previous studies regarding the thickness of the 9# coal seam in the study area (Figure 14) were applied as the thickness parameter values in the fracture mathematical model to calculate the fracture density using Equation 4; then, the measured fracture density contour map of the coal reservoir was obtained using the contour map of its total fracture density as well as the contour map of the thickness of the 9# coal seam (Figure 15). Comparing the measured and calculated fracture densities after considering the effects of thickness, the relative error in fracture density is less than 13% (Table 3), which indicates that the predicted results have a certain degree of confidence. According to the results, the number of fractures measured in the coal reservoir in the Laochang area mostly ranges from 10 to 20 per meter, while some regions may have up to 80 fractures per meter or above. Under tectonic influence, the fractures in the Laochang area have a higher distribution density in the south than in the north as well as higher density in the west than in the east. Owing to the impact of thickness, fractures are mainly developed in the east of F1-19 as well as other places next to B401, F9, and F10, where the coal seams are rather thin. The fracture density of the coal reservoir in the Yuwang block is generally high. In the northern part of the Laochang anticline, rapid increases in the coal seam thickness cause the fracture density to decline rapidly. In some zones, the number of fractures is even as low as 1 per meter.
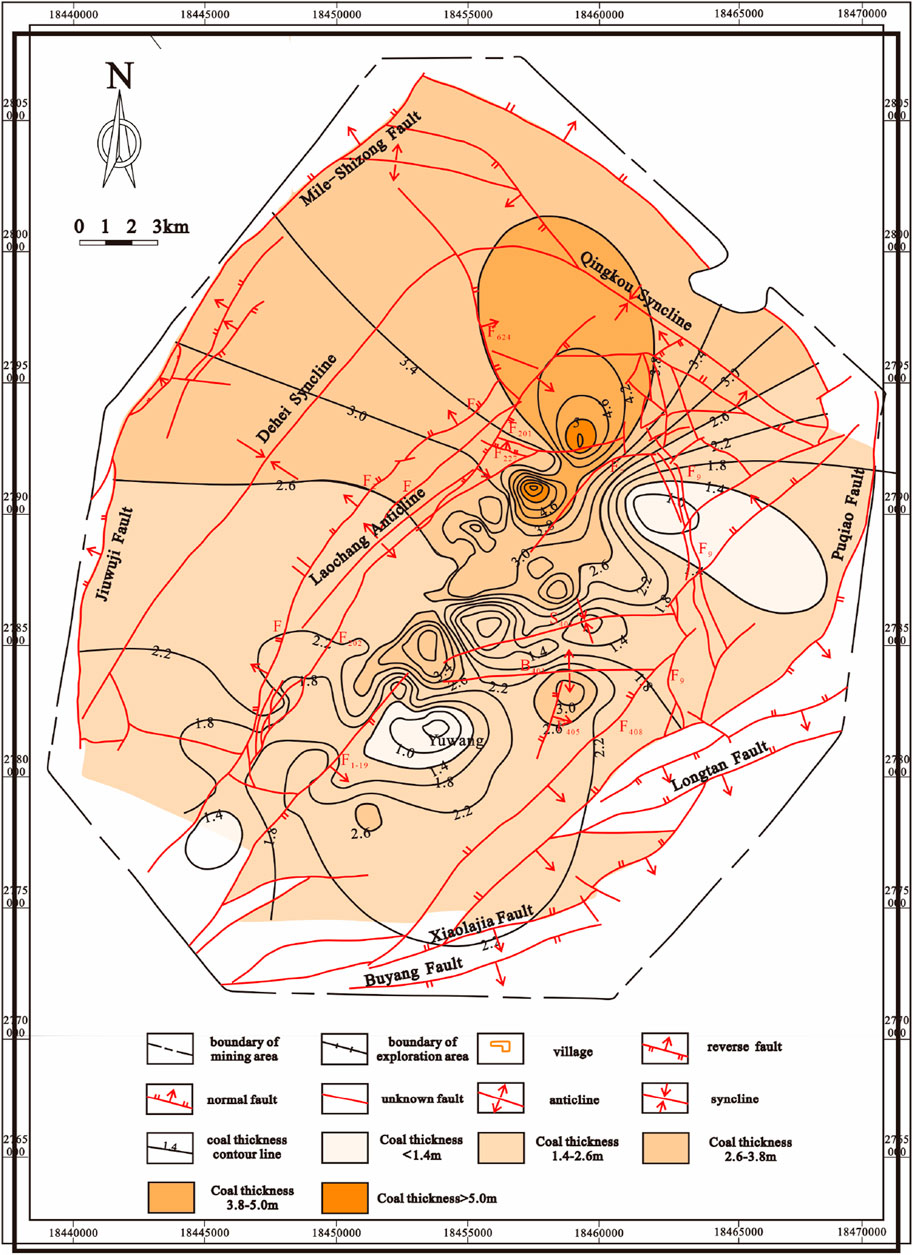
Figure 14. The Thickness contour map of the 9# coal seam in the Laochang area (Wang, 2007).
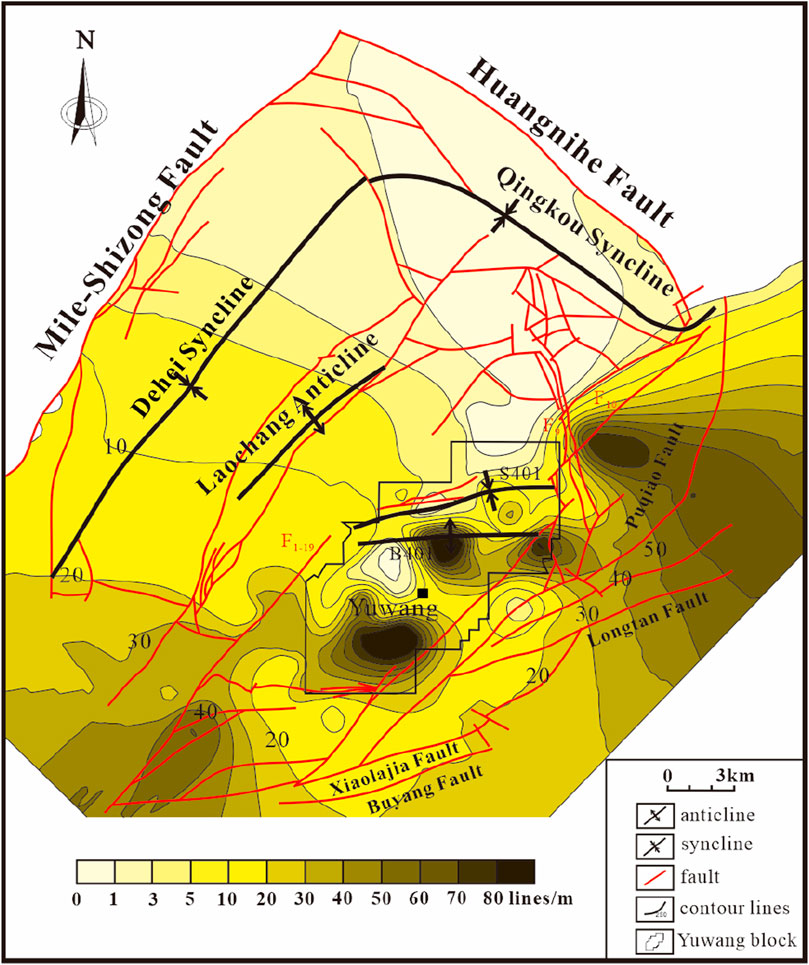
Figure 15. Contour map for the predicted fracture density of coal reservoirs in the Laochang area considering stratum thickness.

Table 3. Error analysis of the fracture density prediction considering stratum thickness for coal reservoirs in the Laochang area.
4.2.2 Fracture orientation prediction
The coordinates of all the nodes and directions of the stress values were extracted using the self-programmed command flow. After simple calculations, the data were imported into Surfer to obtain the statistical results. The predicted stress direction of the coal reservoir in the Laochang area is mostly between 150° and 155°. The stress direction is roughly NNW and perpendicular to the Nanpanjiang Fault. Given the presence of basement faults, the stress directions may change perpendicular to such faults. Along the east side of the Mile-Shizong Fault, the stresses move gradually downward from 152° to 150°; in contrast, the stresses near the Baise-Longlin Fault move upward from 152° to 155°.
Based on the stress directions obtained from the simulations and theoretical rupture angles obtained by calculations, the following conclusions can be drawn (Table 4). When the fracture formation in the coal reservoir does not change with progressive deformation or preliminary rupture, two major sets of fractures are developed in the coal reservoir; the fracture strikes from one set are roughly at 193°, while those from the other set are at about 116°. In addition, unusual concentration or changes in the stress direction in the area due to inhomogeneities in the coal and rock can lead to abnormal changes in the direction and density of the fractures. However, the overall tendency for variation should generally be similar to the corresponding predicted outcomes.
4.2.3 Sweet spot area optimization
Permeability and gas content are the factors that directly control CBM accumulation (Fang et al., 2005). Although the permeability generally decreases with increasing burial depth, the development of fracture systems in deep coal reservoirs can enhance permeability (Sun et al., 2014); therefore, cleat density is crucial for CBM development. Based on the simulation results presented herein, thicker coal seams tend to have lower cleat densities and lower permeability. The Yuwang Block is characterized by relatively thin coal seams with well-developed cleats and good connectivity, resulting in high permeability. However, excess tectonic stresses can lead to significant deformation of the coal seams and the formation of mylonitic coal, which would reduce permeability (Jiang et al., 2005). The Yuwang Block exhibits a simple geological structure and lacks major faults and folds, suggesting a high potential for CBM. Furthermore, the coal seam thickness is correlated with the gas content, with thicker seams generally exhibiting lower gas content (Qin et al., 2000). Although the Yuwang Block generally has thin coal seams, the presence of small-scale folds in the northern region, particularly within the synclinal structures, has resulted in locally thicker coal seams with well-developed cleats; these represent the areas with the highest potential for CBM development.
Based on previous studies of the present-day in situ stress in the Yuwang region, the maximum horizontal principal stress in the Yuwang Block is approximately in the south–north direction (Ju et al., 2020). Previously reported fracture prediction results for the Laochang area within the region indicate that the dominant joint sets are oriented NNE and NEE. One of these joint sets forms a smaller angle with the present-day SHmax orientation. Consequently, this joint set exhibits higher effectiveness under the influence of the current stress regime, leading to increased coal seam permeability and enhanced CBM migration. Therefore, the most suitable areas for CBM exploitation would be the middle and southern parts of the Yuwang block. This conclusion is also consistent with the previously reported sweet spot for coalbed gas development in the Laochang area.
5 Conclusion
This paper entails recovery and evaluation of the paleotectonic stress field in a study area using numerical simulations by taking the Laochang area as an example and drawing on the development of fractures in the adjacent layers of the coal seam. Accordingly, the method for calculating the reservoir fracture density is optimized to the study area to realize prediction of the coal reservoir fracture density and direction. The main findings of this study are as follows:
1) Traditional approaches of simulating tectonic stresses are often limited by their reliance on experimental stress parameters without incorporating geological constraints such as faults. This study introduces a method to integrate tectonic stress field simulation with fracture prediction by using surface sandstone faults as the constraints for stress inversion. The sandstone layer, which is geographically aligned with the coal reservoir, provides a natural dataset for analyzing the stress history influencing both the sandstone layer and coal reservoir. This integration is expected to improve the accuracy of stress predictions and enhance our understanding of the geological structures in the study area.
2) The fracture density calculation model was improved by specifically considering the effect of the rock layer thickness on the fracture density. The fracture density calculation formula previously summarized by researchers does not account for the influence of stratum thickness on fracture density. In the Laochang area, there is an inverse power function relationship between the fracture density and stratum thickness. Owing to the heterogeneity of the rock layer, there are variations in the fracture lengths in the
3) According to the prediction results of the fracture simulations, it is believed that the fracture density of the coal reservoir in the study area is mostly 10–20 per meter. Overall, the fracture density distribution in the coal reservoir trends high in the south to low in the north and high in the east to low in the west. Ultimately, through integrated analysis of the fracture density and orientation, coal seam thickness, structural complexity, and the present-day stress field within the study area, the Yuwang block is determined as the sweet spot for CBM development in the Laochang area.
Data availability statement
The raw data supporting the conclusions of this article will be made available by the authors without undue reservation.
Author contributions
CW: conceptualization, methodology, and writing–review and editing. BW: methodology, resources, and writing–review and editing. XH: investigation and writing–review and editing. XJ: software and writing–original draft. WL: supervision and writing–original draft. MS: writing–original draft. XZ: writing–original draft. LG: Visualization and writing–review and editing.
Funding
The authors declare that financial support was received for the research, authorship, and/or publication of this article. This study was supported by the Jiangsu Province Carbon Peak Carbon Neutral Technology Innovation Project in China (Grant no. BE2022034-1).
Conflict of interest
Authors CW, XH, WL, and XZ were employed by China United Coalbed Methane National Engineering Research Center Company Limited.
Author LG was employed by Huayang New Material Technology Group Co., Ltd. No. 1 Coal Mine.
The remaining authors declare that the research was conducted in the absence of any commercial or financial relationships that could be construed as a potential conflict of interest.
Publisher’s note
All claims expressed in this article are solely those of the authors and do not necessarily represent those of their affiliated organizations, or those of the publisher, the editors, and the reviewers. Any product that may be evaluated in this article, or claim that may be made by its manufacturer, is not guaranteed or endorsed by the publisher.
References
Carminati, E., and Vadacca, L. Two- and three-dimensional numerical simulations of the stress field at the thrust front of the Northern Apennines, Italy. J. Geophys. Res. Solid Earth, 2010, 115 doi:10.1029/2010jb007870B12).
Ding, Z., Qian, X., Huo, H., and Yang, Y.(1998). A new method for quantitative prediction of tectonic fractures—two-factor method. Oil & Gas Geology 19(1), 1–7. doi:10.11743/ogg19980101
Dixon, J. M. (1979). Techniques and tests for measuring shearing fracture intensity [D]. Morgantown: West Virginia University.
Fang, A., Hou, Q., Ju, Y., Bu, Y., and Lu, J. (2005). A study on control action of tectonic activity on CBM pool from various hierarchies. Coal Geol. China, 17 (04):15–20. doi:10.3969/j.issn.1674-1803.2005.04.006
Fang, H., Sang, S., Wang, J., Liu, S., and Ju, W. (2017). Simulation of paleotectonic stress fields and distribution prediction of tectonic fractures at the Hudi coal mine, Qinshui Basin. Acta Geol. Sin. Ed., 91 (06). doi:10.1111/1755-6724.13447
Gui, B., and Wang, C. (2000). Tectonic characteristics of coalbed methane in the east Yunnan-Qianxi area. Yunnan Geol., 19 (04): 321–351.
Guo, X., Zhuang, D., Gui, B., and Kong, L. (2004). Hydrogeological characteristics of coal seams and coalbed methane reservoirs in Laofang mining area. Yunnan Geol., 23 (04): 487–495. doi:10.3969/j.issn.1004-1885.2004.04.010
Jiang, Bo, and Wang, L. (2015). Structural kinematic evaluation and prediction method for fracture development in coal reservoirs. Coal Sci. Technol., 43 (02): 16–20. doi:10.13199/j.cnki.Cst.2015.02.004
Jiang, B., Qin, Y., Ju, Y., and Wang, J. (2005). Research on tectonic stress field of generateand reservoir of coalbed M ethane J. China Univ. Min. & Technol., 34 (05): 564–569. doi:10.3321/j.issn:1000-1964.2005.05.005
Jing, B., Wang, L., Wang, J., and Qu, Z. (2014). “Tectonic prediction and evaluation of non-homogeneity of coal reservoir rift development in Linfen area, East China [A],” in 2014 China geoscience joint academic conference--topic 57: basin dynamics and unconventional energy proceedings [C].
Ju, Y., Jiang, B., Wang, G., Hou, Q., et al. (2005). Tectonic coal structure and reservoir physical properties [M]. Xuzhou: China University of Mining and Technology Press.
Ju, W., Jiang, B., Qin, Y., Wu, C., Li, M., Xu, H., et al. (2020). Characteristics of present-day in-situ stress field under multi-seam conditions: implications for coalbed methane development. J. China Coal Soc., 45 (10): 3492–3500. doi:10.13225/j.cnki.jccs.2019.1135
Ladeira, F. L., and Price, N. J. (1981). Relationship between fracture spacing and bed thickness. J. Struct. Geol., 3 (2): 179–183. doi:10.1016/0191-8141(81)90013-4
Li, P., and Liu, Q. (2022). A dual porous and fractures medium CBM numerical model development and analysis. J. Petroleum Sci. & Eng., 214. doi:10.1016/j.petrol.2022.110511
Lin, Y. (1993). Exploration of the relationship between the conjugate shear angle of rocks and the magnitude of peritectic pressure. Adv. Geophys. (04): 133–139.
Liu, C., Chongyuan, Z., and Xingke, Y. (2000). Strong activity and active deep action-two important features of sedimentary basins in China. Oil Gas Geol. 21(1): 1–6.
Liu, H., Zuo, Y., Rodriguez-Dono, A., Wu, Z., Sun, W., Zheng, L., et al. (2023). Study on multi-period palaeotectonic stress fields simulation and fractures distribution prediction in Lannigou gold mine, Guizhou. Geomechanics Geophys. Geo-Energy Geo-Resources, 9, 92, doi:10.1007/s40948-023-00633-01).
McQuillan, H. (1973). Small-scale fracture density in Asmari Formation of southwest Iran and its relation to bed thickness and structural setting. Bull. Am. Assoc. Petrolewn Geol., 57 (12): 2367–2385. doi:10.1306/83d9131c-16c7-11d7-8645000102c1865d
Moore, M. A. (2012). Coalbed methane: a review. Int. J. Coal Geol. 101, 36–81. doi:10.1016/j.coal.2012.05.011
Pang, Y., Chen, K., Zhang, P., He, K., Tang, J., Zhang, D., et al. (2024). Simulation study on the paleo-stress field of the Longmaxi formation in the wulong area, southeast chongqing [J/OL]. Seismol. J. 1-19. doi:10.11939/jass.20230137
Qian, X., Ding, Z., Zheng, Y., and Hou, G.(1994). Research on quantitative prediction technology of tectonic fracture, taking hilly oilfield as an example. China Petroleum and Natural Gas Corporation. Report on the research results of China’s oil and gas reservoirs, a key scientific and technological research project of China National Petroleum Corporation.
Qin, Y., Ye, J., Lin, D., Jiao, S., and Li, G. (2000). Relationship of coal reservior thickness and its permeability and gas-bearing property. Coal Geol. & Explor., 28 (01), 24–27. doi:10.3969/j.issn.1001-1986.2000.01.007
Ramsay, J. G. (1980). Shear zone geometry: a review. J. Struct. Geol., 2 (1): 83–99. doi:10.1016/0191-8141(80)90038-3
Ren, Q., Jin, Q., Feng, J., and Li, M. (2019). Simulation of stress fields and quantitative prediction of fractures distribution in upper Ordovician biological limestone formation within Hetianhe field, Tarim Basin, NW China. J. Petroleum Sci. & Eng., 173, 1236–1253. doi:10.1016/j.petrol.2018.10.081
Sun, F., Wang, B., Li, M., and Liang, H. (2014). Major geological factors controlling the enrichment and high yield of coalbed methane in the southern Qinshui Basin. Acta Pet. Sin., 35 (06): 1070–1079. doi:10.7623/syxb201406004
Wang, B. (2007). Tectonic fracture description and quantitative prediction of reservoirs [D]. Qingdao: China University of Petroleum.
Wang, J., Ju, W., Shen, J., and Sun, W. (2016). Prediction of tectonic fracture distribution in chang7-1 reservoir of Yanchang Formation, dingbian area, ordos basin. Geol. Explor., 52 (05): 966–973. doi:10.13712/j.cnki.dzykt.2016.05.019
Wang, L. (2014). Tectonic dynamics method for evaluating the inhomogeneity of coal reservoir fracture development and its application - a case study in Linfen area, East China [D]. Xuzhou: China University of Mining and Technology.
Wu, L., Ding, W., Jinchuan, Z., Yuxi, L., Song, Z., and Liangjun, H. (2011). Prediction of fracture distribution in organic-rich shale reservoirs of the Lower Silurian Longmaxi Formation in southeastern Chongqing. J. Petroleum Nat. Gas, 33 (9), 4. doi:10.3969/j.issn.1000-9752.2011.09.009
Xiao, W. (2017). Geological characteristics of coalbed methane and dessert section preference in the Laofang mine area, east Yunnan. Xuzhou: China University of Mining and Technology.
Zhang, B., Li, Y., Fantuzzi, N., Zhao, Y., Liu, Y. B., Peng, B., et al. (2019). Investigation of the flow properties of CBM based on stochastic fracture network modeling. Materials, 12 (15): 2387, doi:10.3390/ma12152387
Zhou, J., Jiang, T., Mou, H., Jiang, S., and Zhou, L. (2021). Effect of fault zone and natural fracture on hydraulic fracture propagation in deep carbonate reservoirs. IOP Conf. Ser. Earth Environ. Sci., 861 (6): 062057, doi:10.1088/1755-1315/861/6/062057
Keywords: coal reservoir, fracture, numerical simulation, quantitative prediction, tectonic stress
Citation: Wu C, Wang B, Hu X, Jin X, Liang W, Shi M, Zhu X and Guo L (2024) Optimization method for predicting coal reservoir fractures in the Laochang area of Eastern Yunnan using paleotectonic stress inversion. Front. Earth Sci. 12:1480459. doi: 10.3389/feart.2024.1480459
Received: 14 August 2024; Accepted: 24 September 2024;
Published: 13 November 2024.
Edited by:
Zhengguang Zhang, General Prospecting Institute of China National Administration of Coal Geology, ChinaReviewed by:
Chaojun Fan, Liaoning Technical University, ChinaLong Fan, University of Alaska Fairbanks, United States
Copyright © 2024 Wu, Wang, Hu, Jin, Liang, Shi, Zhu and Guo. This is an open-access article distributed under the terms of the Creative Commons Attribution License (CC BY). The use, distribution or reproduction in other forums is permitted, provided the original author(s) and the copyright owner(s) are credited and that the original publication in this journal is cited, in accordance with accepted academic practice. No use, distribution or reproduction is permitted which does not comply with these terms.
*Correspondence: Bo Wang, d2FuZ2JvMTIzMDAzOEAxNjMuY29t
 Changwu Wu1
 Xue Jin