- 1PetroChina Research Institute of Petroleum Exploration and Development, Beijing, China
- 2China University of Geosciences (Beijing), Beijing, China
The structure of the Tajik Basin is characterized by a series of NE-trending fold-thrust belts that share a common detachment layer composed of Upper Jurassic evaporite rocks. These fold-thrust structures, thrusting face to face, converge toward the Vakhsh Depression. Due to limitations of seismic and drilling data, the controlling factors of the formation of the fold-thrust belts in the Tajik Basin remain controversial. Taking the Tajik Basin as a geological prototype, structural physical simulation experiments were conducted to decipher the controlling factors of salt-related structure deformation. The experiment results indicate that the tectonic deformation of the strata above the Jurassic evaporite rocks in the Tajik Basin is mainly controlled by the detachment layer of the Upper Jurassic evaporite rocks. The early salt diapirs in the Upper Jurassic played a key role in the formation of the thrust belts. Additionally, tectonic stress near the mountain front was rapidly transmitted to the inner basin due to the load of the structural wedge. Based on the results of physical simulation experiments, we speculate that the tectonic deformation of the subsalt strata and the basement in the Tajik Basin is primarily controlled by a deep detachment layer. The deformation of the subsalt strata is relatively gentle, which is conducive to the formation of large-scale, broad and gentle anticlinal structures. The anticlinal structures of the subsalt strata can form effective traps due to the sealing effect of the Upper Jurassic evaporite layer, offering promising exploration potential.
1 Introduction
The Tajik Basin is located within the oil- and gas-rich zone of the Tethys tectonic domain in Central Asia. It is adjacent to the Amu Darya Basin (also known as the Karakum Basin) to the west and the Tarim Basin to the east. As a significant Meso-Cenozoic superposition foreland basin, it plays an important role in Central Asia (Zuoxiang and HU, 1993; JIA and YANG, 2001; Chapman et al., 2019; Dedow et al., 2020). The thick evaporite layer of the Upper Jurassic in the Tajik Basin acts as a detachment layer. Under strong compressive stress, complex structural deformations, primarily salt diapirs and fold-thrust structures, have developed (Brookfield and Hashmat, 2001; Käßner et al., 2016; Abdulhameed et al., 2020; Gągała et al., 2020; McNab et al., 2019). The Upper Jurassic Tithonian evaporite layer divides the basin’s sedimentary sequence into two sediment units, supra-evaporite layer and sub-evaporite layer, forming two distinct sets of oil and gas accumulation systems. At present, many oil and gas fields have been discovered in the supra-evaporite strata, with the distribution of hydrocarbons mainly controlled by structural traps (Yin et al., 2015; Zhang et al., 2018; Zhu and Liu, 2007; Luo et al., 2005; Abitkazy et al., 2014). However, due to the lack of seismic data and the poor data quality in the interior of the Tajik Basin, as well as the lack of drilling that penetrates the Jurassic evaporite layer and its underlying strata, there are still no effective methods for conducting in-depth research on the deformation characteristics and formation mechanisms of salt-related structures in the basin. The role of salt-related structures in controlling hydrocarbon accumulation both above and below the evaporite remains unclear, thus limiting oil and gas exploration efforts in the Tajik Basin.
Physical simulation is an effective method for studying tectonic deformation processes and formation mechanisms, particularly in complex tectonic zones and salt-related structures (Panien et al., 2006; Weijermars et al., 1993; Schrerus et al., 2006; Chen et al., 2019). On the basis of previous studies and actual geological conditions of the Tajik Basin, this paper analyses the influence of detachment layer, salt diapir and structural wedge on structure deformation through structural physical simulation experiments, and discusses the formation mechanisms of complex salt-related structure deformation in the Tajik Basin.
2 Geological setting
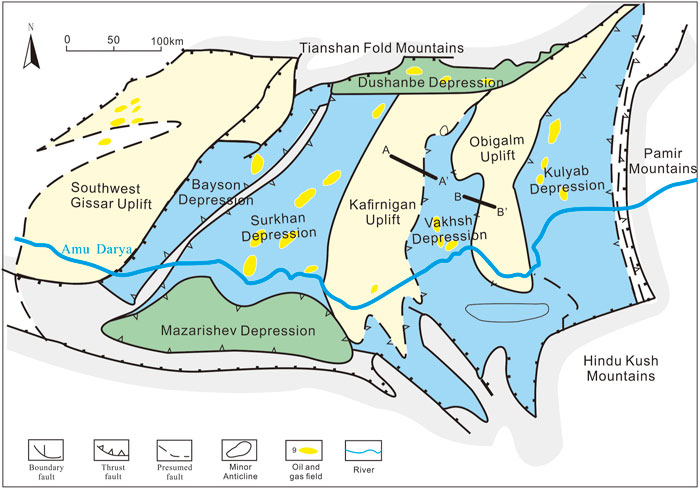
The Tajik Basin is tectonically located at the confluence of the South Tianshan Hercynian orogenic belt and the Meso-Cenozoic Pamir-Hindu Kush orogenic belt with the Turan Plate (JIA and YANG, 2001; Chapman et al., 2019). It is bounded by the southwest branch of the South Tianshan orogenic belt to the north, and the Southwest Gissar Mountain to the west, and surrounded by Pamir and Hindu Kush to the east and south, respectively. The basin covers an area of approximately 12.5 × 10⁴ km2 (Figure 1).
The Tajik Basin experienced significant geological evolution, marked by depression stage during the Mesozoic and Eocene, followed by a foreland basin since the Oligocene. In the early Neogene, the ongoing collision between the Indian and Eurasian plates led to the formation of the Pamir and Southwest Gissar orogenic belts on the eastern and western flanks of the basin, respectively, resulting in intense overthrusting towards the basin. Within the basin, large-scale thrust deformation gave rise to a series of N-NE trending fold and thrust belts. These structures were influenced by a thick evaporite layer. Situated atop the Jurassic strata, acting as a major detachment layer (Abdulhameed et al., 2020; Gągała et al., 2020). The thrust faults partition the basin into alternating uplift and depression regions oriented roughly N-NE. From west to east, these include the Southwest Gissar Uplift, Bayson-Surkhan Depression, Kafirnigan Uplift, Vakhsh Depression, Obigalm Uplift and Kulyab Depression (Yin et al., 2015; Zhang et al., 2018) (Figure 1). Additionally, the Dushanbe Depression developed along the northern margin of the basin, adjacent to the southern Tianshan orogenic belt, while the Mazarishev Depression formed to the south of the Surkhan Depression, near the Northern Afghanistan Uplift.
The Tajik Basin has been part of the northern margin of Tethys basin system since Mesozoic (JIA and YANG, 2001). Its formation and evolution were predominantly influenced by the subduction of the Paleo-Tethys Ocean and the subsequent opening and closure of the Neotethys Ocean. From the Late Triassic to Early Jurassic, the Paleo-Tethys Ocean progressively closed from east to west. During this process, the Middle Pamir Block, Afghanistan Block and Central Iran Block successively collided with the Turan Block (a landmass that was connected to the Tarim Block) forming the Cimmerides Orogenic Belt. Simultaneously, the Black Sea-Caspian remnant ocean basin, known as the sub-Tethys Sea, continued to develop in the western part of the region (Käßner et al., 2016).
During the Middle Jurassic, the northward subduction of the Neotethys Ocean triggered back-arc expansion in the residual Black Sea-Caspian Sea basin, leading to the formation of a back-arc ocean basin. Several transgressions occurred from west to east during the Middle Jurassic and Early Cretaceous, resulting in the widespread deposition of Marine clastic rocks, carbonate rocks and evaporites across extensive areas, including the Tajik Basin.
Since the Middle Eocene (∼40Ma), the collision between the Arabian Plate and the Eurasian Plate formed the Zagros Orogenic Belt, gradually terminating marine deposition in most of the Central Asian basin group, including the Tajik Basin. Concurrently, the ongoing collision between the Indian Plate and the Eurasian Plate reactivated the eroded ancient Tianshan Orogenic Belt, leading to the formation of an intracontinental orogenic belt, which influenced the Tajik basin to transition into a foreland basin stage.
Since the early Miocene (∼20Ma), the Pamir region has surged northward, separating the Tarim Basin from the Tajik-Karakum Basin (Gągała et al., 2020; McNab et al., 2019). From the middle Miocene (∼12 Ma), with the rapid northward advance of the Pamir thrust and the uplift of the southwest Gissar Mountain, the Tajik Basin and Karakum Basin became distinct. Significant foreland overthrusting occurred on both the eastern and western sides of the Tajik Basin, resulting in a nappe structure system centered on the Vakhsh Depression, with Jurassic evaporites serving as the detachment layer within the basin.
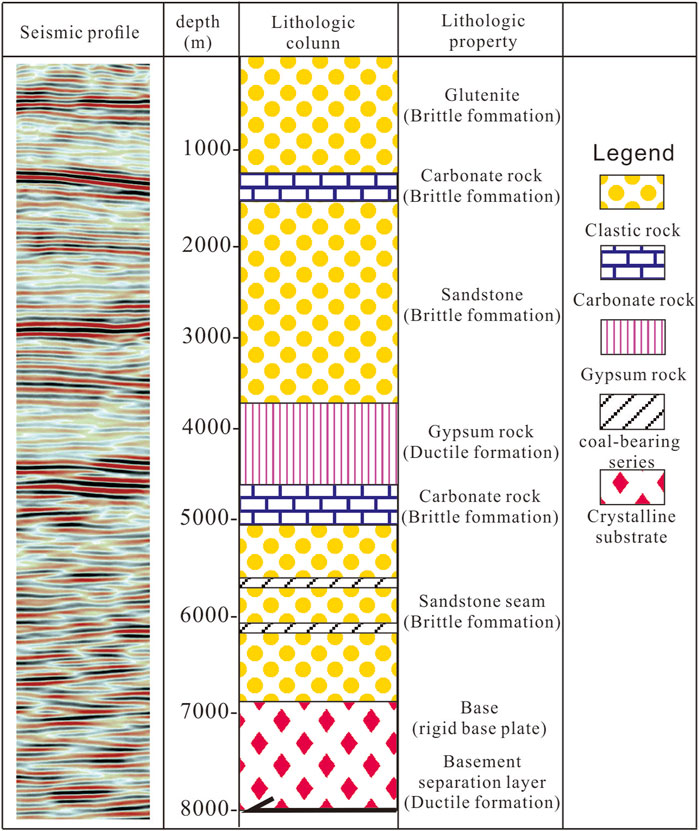
The Paleozoic era forms the basement of the Tajik Basin, with the sedimentary cover comprising a transitional Permo-Triassic layer, a Jurassic-Paleogene continental-marine transition deposit, and a Neogene-Quaternary continental clastic rock deposit (Figure 2). The Permo-Triassic consists of marine clastic rocks and volcanic rocks, outcropped in the Gissar and Darvaz mountains around the basin. The Lower Jurassic unconformity overlays the Triassic system. The basal Jurassic strata are characterized by continental molasse, transitioning upward into continental and coastal coal-bearing clastic rocks. The predominant lithologies include siltstone, fine sandstone, and argillaceous rock, with sedimentary thickness decreasing from southwest to northeast. The Middle to Upper Jurassic sequence features carbonate deposits containing oolitic and algal concretions. At the top of the Upper Jurassic strata are evaporite deposits primarily composed of salt rock and anhydrite, which are widely distributed throughout the basin, with local thicknesses exceeding 1 km. The Lower Cretaceous sequence is composed of alternating marine and lagoon sediments, characterized mainly by red-variegated sandstone, mudstone and siltstone, with partial evaporitic layers. This sequence exhibits a thickness range of 300–1,500 m, thickening from west to east. The Upper Cretaceous consists of shoreline shallow lagoon facies deposits, predominantly dark gray to green marine shales, limestone and evaporites. The thickness of this layer reaches approximately 500–750 m in the central Tajik Basin and exceeds 1 km near the Pamir Mountain. The Paleocene-Eocene interval is primarily composed of shallow marine limestone, calcareous mudstone with minor evaporite, and sandstone, achieving a thickness of about 500 m. During the late Eocene to Oligocene, the basin experienced uplift, leading to significant erosion and the formation of a widely distributed unconformity. Since the Miocene, both the eastern and western margins of the Tajik Basin have been thrust into the basin, resulting in the deposition of thick coarse clastic rocks, such as molasse.
3 Experimental materials and model design
3.1 Experimental materials
Based on the rheological attributes of natural rocks, natural strata can be divided into brittle strata and ductile strata. Herein, the deformation conduct of brittle strata adheres to the Mohr-Coulomb fracture criterion, while the deformation of ductile strata conforms to the deformation traits of Newtonian fluid. Previous research has demonstrated that the rheology and fracture behavior of dry quartz sand and silicone respectively follow the Mohr-Coulomb fracture criterion and Newtonian fluid deformation characteristics under the circumstance of the natural gravity field, and they are also the most prevalently utilized experimental materials in structural physics simulation experiments (Chen et al., 2019; Wu et al., 2017; Hong-Xing et al., 2004; Yixin et al., 2021; Hong et al., 2022). In the structural physics simulation experiment, dry quartz sand is employed to simulate the brittle rock. The particle size of the quartz sand is 200–300 μm, the density is approximately 1,457 kg/m3, and the cohesion strength is about 49 Pa (Panien et al., 2006). To facilitate the observation of model deformation, colored dry quartz sand with identical properties is utilized as the marker layer. Transparent silicone (polymeric silicone resin) is adopted to simulate the ductile rock, with a viscosity of 1.2 × 10⁴ Pa·s and a density of 929 kg/m3 (Weijermars et al., 1993) (Table 1). Additionally, glass microbeads were used in the experiment to simulate the substrate slip layer (Schrerus et al., 2006), which are a type of white spherical particles with a particle size of approximately 100 μm, a density of approximately 1,500 kg/m3, and a rupture internal friction angle of 22°.

Table 1. Material parameters of physical simulation experiment of salt-related structure in Tajik Basin.
3.2 Similarity principle in the simulation experiment
According to the similarity principle, the density of the experimental material is approximately half that of the actual rock, with a density similarity factor ranging from 0.42 to 0.54. In the experimental, 1 cm of the model corresponds to about 4.5 km of the geological prototype, and the length similarity factor is 2.2 × 10⁻⁶. The gravitational acceleration is 9.8 m/s2 in both the experimental model and the actual geological environment, making the gravitational acceleration factor 1. The viscosity coefficient of silicone (1.2 × 10⁴ Pa·s) is significantly lower than that of natural salt rock (1018 Pa·s), yielding a viscosity similarity factor of 1.2 × 10⁻¹⁴ (see Table 1).
3.3 Experimental model
The experiment was conducted on the structural physics simulation experiment platform at the Key Laboratory of Basin Structure and Hydrocarbon Accumulation of PetroChina Company. The sandbox for the experimental model measured 700 mm in length and 400 mm in width. Movable baffles were positioned on the left and right sides and connected to power devices, enabling them to move forward or backward. During the experiment, computer software controlled the uniform transfer of velocity and displacement on both sides of the baffles.
Based on the comprehensive stratigraphic distribution and typical seismic and geological profile characteristics of the Tajik Basin, the stratigraphic structure of the basin can generally be divided into three layers: (1) a plastic layer of Upper Jurassic evaporites approximately 1 km thick; (2) an overlying brittle layer, about 3–4 km thick, dominated by clastic rock; and (3) a subsalt brittle layer, approximately 2 km thick, composed primarily of clastic and carbonate rocks (Figure 3). In this study, the experimental model for the salt-related structural physics simulation of the Tajik Basin was designed according to experimental similarity ratios. Two sets of physical simulation models were created (Figure 4), primarily focusing on the influence of detachment layer, salt diapir, tectonic wedge and other factors on salt-related deformation. In Model 1, a single ductile layer is included to primarily account for the impact of the Upper Jurassic evaporite layer on the deformation of the overlying strata. In contrast, Model two incorporates two ductile layers: a deep basement ductile layer and a shallow Jurassic evaporite layer.

Figure 4. Schematic diagrams of the experimental model. (A) Schematic diagram of Model 1; (b) Schematic diagram of Model 2.
The initial dimensions of Model one are 700 mm in length, 400 mm in width, and 32 mm in height (Figure 4A). From bottom to top, the layers are as follows: (1) A 3 mm layer of glass microbeads are used to reduce friction between the model’s bottom surface and the groove’s top surface; (2) A 10 mm layer of lower quartz sand (also named lower sand layer); (3) A 4 mm layer of silicone, covering the entire model plane without a salt diapir; (4) A 15 mm layer of upper quartz sand layer (also named upper sand layer). Before the extrusion began, structural wedges, approximately 12 mm in height and 150 mm in length, were present at both ends of the model. During the experiment, the shortening rate of the left end was 0.0055 mm/s, while at the right end, it was 0.0065 mm/s. The total amount of shortening was 185 mm, resulting in a shortening rate of 26.4%. When the total amount of compression reached 20 mm, the height of the structural wedges at both ends increased to 24 mm. Surface denudation was not considered in this experiment.
The initial dimensions of Model two are 900 mm in length, 400 mm in width, and 57 mm in height (Figure 4B). From bottom to top, the layers are as follows: (1) A 2 mm layer of glass microbeads is used to reduce the friction between the bottom surface of the model and the top surface of the groove. (2) Silicone layers at the left and right ends are 6 mm and 10 mm thick, respectively, and are not connected in the middle. The design of the weak connections in this model primarily designed to reflect the structure and distribution of the thrust-nappe system in the Tajik Basin. Due to the constraints imposed by the limited length of the experimental sandbox, a lack of weak connections between both sides may lead to a collision of the thrust structure from both sides, which would be inconsistent with the actual geological model of the basin. (3) The quartz sand layers are 20 mm thick at the left end and 16 mm thick at the right end. (4) The silicone layers at the left and right ends are 4 mm and 6 mm thick, respectively, with no connection in the middle. (5) The quartz sand layers are 20 mm thick at the left end and 18 mm at the right end.
The experiment is divided into four stages. In stage 1, the shortening rate at both the left and right ends is 0.002 mm/s, with a total extrusion of 60 mm; In stage 2, the shortening rate at both ends is reduced to 0.0006 mm/s, with another 60 mm of total extrusion. In stage 3, the shortening rate at the left end is 0.002 mm/s, while at the right end it is 0.001 mm/s, resulting in a total extrusion of 150 mm, where the left end is pushed 100 mm and the right end 50 mm; In stage 4, the shortening rate at the left end remains 0.002 mm/s, and at the right end 0.001 mm/s, with a total extrusion of 60 mm–40 mm at the left end and 20 mm at the right end. When the total shortening reaches 280 mm, a structural wedge is added to the depression area in the middle of the model, matching the height of the highest point at both ends of the depression. The total extrusion reaches 330 mm, and the shortening rate reaches 36.7%. Denudation was not considered in this experiment.
4 Experimental results
4.1 Model 1
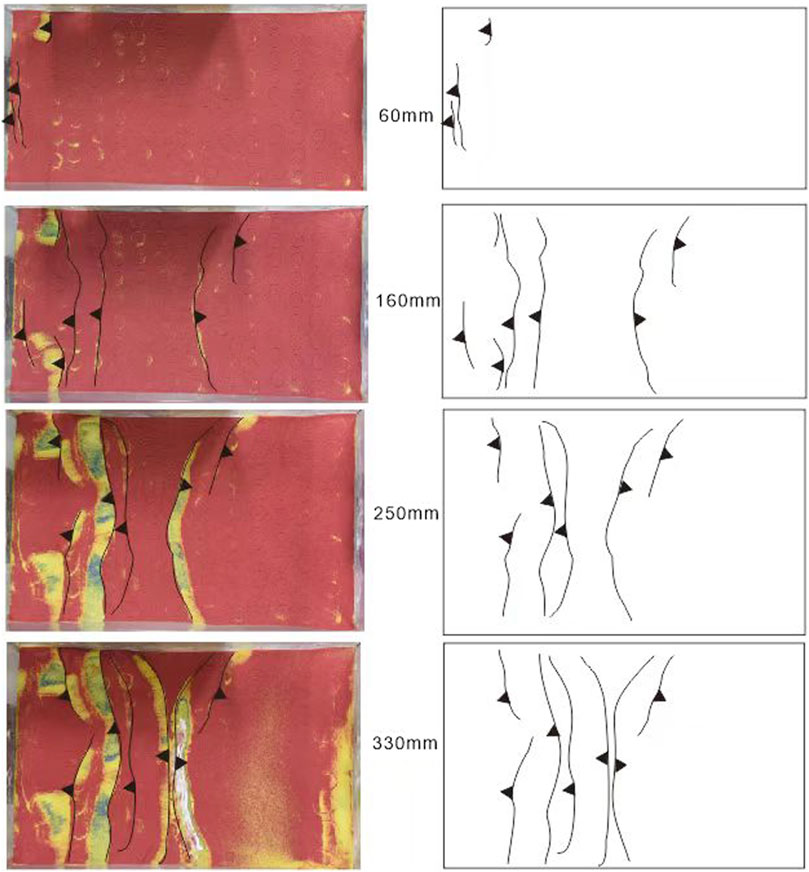
When the total compression shortening from the beginning of the experiment to both sides was 20 mm, no obvious deformation was observed under the ductile layer. However, folding deformation began to develop in the upper sand layer near the moving baffle, resulting in thrust faults F1 and F1′ on both sides (Figure 5B). At this point, a structural wedge of 24 mm in height was added on both sides near the baffle. As compression continued on both sides, the faults in the upper sand layer, with the ductile layer as the detachment layer, rapidly migrated towards the interior. When the total shortening on both sides reached 50 mm, a new set of faults, F2 and F2′, began to develop in the upper sand layer at the front of the structural wedge on both sides, while new thrust faults began to form in the lower sand layer near the baffle on both sides (Figures 5C, D). As the compression continued, the new faults in the upper sand layer migrated progressively inward, forming 3 to 4 rows of high, steep thrust nappe belts in the upper sand layers on both sides (fault F3, F4, F5 and F3′, F4′ and F5′, with fault F3′ extending further toward the middle part of the model). The fault inclination was approximately 40°–50°. From the edge to the center, a wedge-shaped structural feature is formed. However, in the lower sand layer, new faults only overlap with F1 and F1′ near the two sides of the baffles, forming imbricate fan structures (Figures 5E, F). These faults do not propagate inward, so the central areas of the lower sand layer remain largely undeformed, except the edges near the baffles. This can be observed in the cross-sectional profiles of the final deformation model (Figure 6).
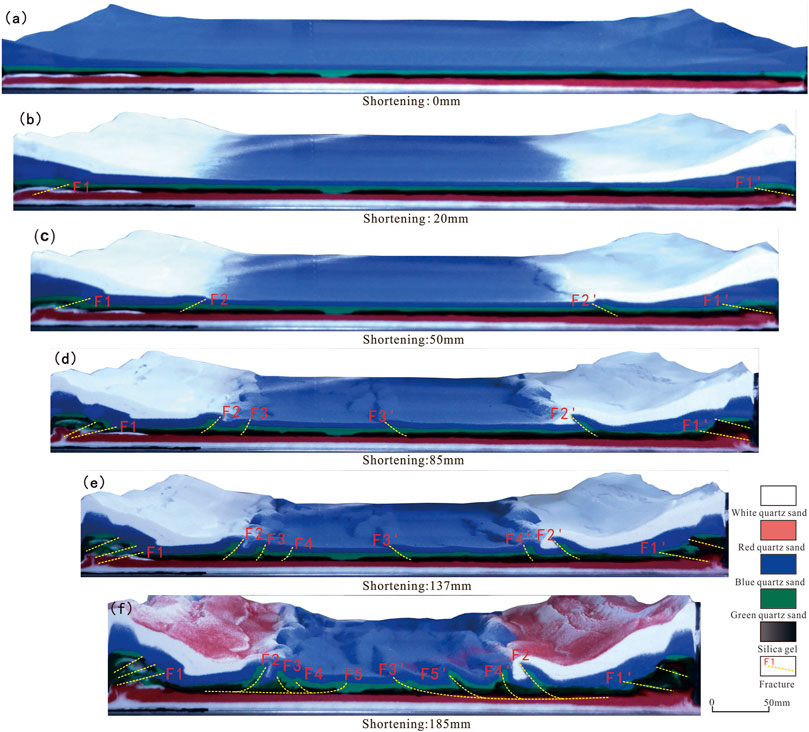
Figure 5. Cross-section of experimental Model 1 deformation process. (A) Initial stage of the experiment Model 1; (B–E) Experimental stages when the shorten distance was 20 mm, 50 mm, 85 mm, 137 mm, respectively. (F) The final stage of the experiment Model 1 with the shorten distance of 185 mm.
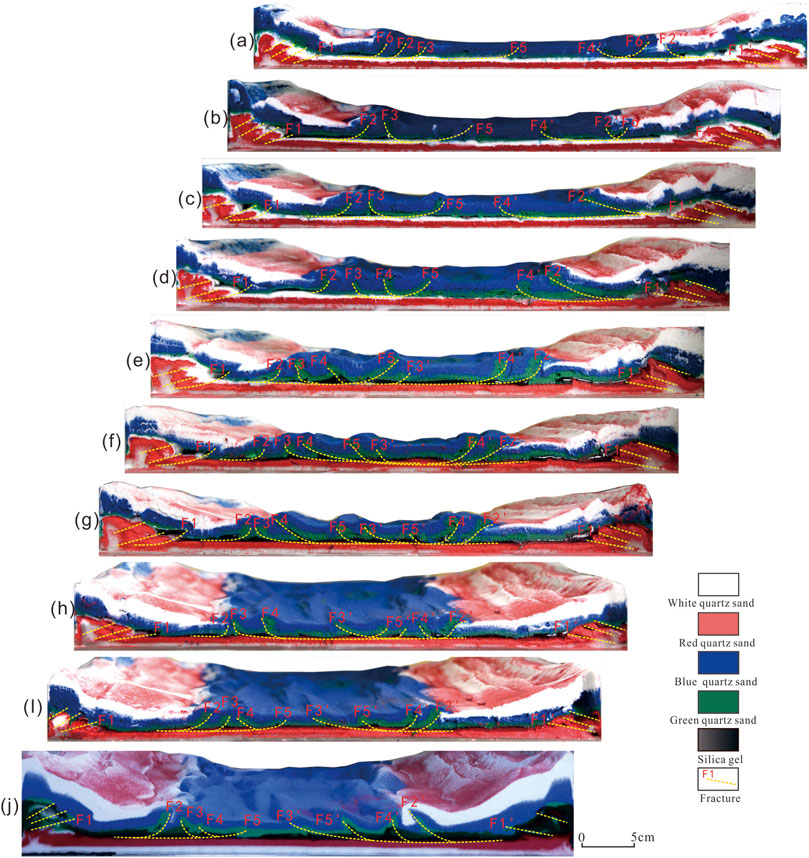
Figure 6. Cross-sectional view of the final stage of experimental Model 1. (A–J) Cross-sections at interval of about 4–5 mm, from the inside of the sandbox to the outside.
Throughout the deformation process of the entire model, thrust faults, using the weak layer as the detachment layer, predominantly occurred in the upper sand layer. The fault in the upper sand layer was relatively consistent in the horizontal direction, with localized reversals in the thrust direction. In contrast, fracturing in the lower sand layer was primarily concentrated near the baffles. At all fault development sites, the ductile layer thickened and was involved in the structural deformation in a diapiric form, with some instances where the diapirs breached the surface (Figure 6D).
4.2 Model 2
In Model 2, the deep ductile basement, located 10–15 km underground, is considered part of the basin deformation. As a result, the model includes two weak layers. Due to the presence and adjustment of ductile layer, as well as the variation in the detachment layer thickness at both sides, the tectonic deformation of the intersalt and suprasalt strata is obviously inconsistent. This model is designed to simulate the tectonic deformation process of the compressed salt basin in the presence of pre-existing bulges (Figure 7). The bulges are located in the upper ductile layer, where the thickness of the silicon is reduced or absent in the areas where the bulges occur.
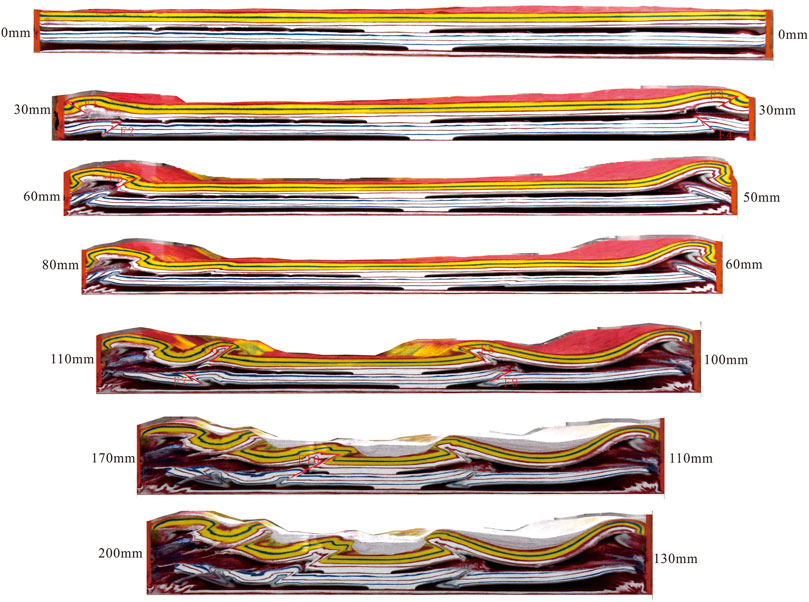
From the deformation process of the experimental model 2 (Figure 8), when the shortening reaches 60 mm, the strata near the pusher plate thickened from 57 mm to 60 mm, and deformation begins in both the suprasalt strata and the intersalt strata. As compressional shortening increases to 110 mm, the strata near the thrust plate thicken to 64 mm, and thrust fault F3 and F4 form at both sides of the intersalt strata, with dip angles of approximately 20°. Recoil faults F1 and F2 also develop, with dip angles of around 30°. An imbricate thrust structure continues to develop in the subsalt strata.
When compressional shortening reaches 210 mm, the strata near the thrust plate thicken to 67 mm. The deformation in the suprasalt strata becomes significantly more pronounced compared to the subsalt layers. Forward faults, F13 and F14, develops closer to the center of the model, with dip angles of approximately 30°, indicating further deformation on the right side. At both sides of the intersalt strata, recoil faults F15 and F16 form beneath F13 and F14, creating an anticline.
As compressional shortening reaches 280 mm, the strata near the pusher plate thicken to 70 mm, and a larger thrust fault, F17, forms near the center of the model. A tight anticline develops in the intersalt layer, with silicon on both sides accumulating into a large dome. When the shortening reaches 330 mm, the strata near the pusher plate thicken to 72 mm, but no new structural deformation forms, marking the final stage of the experiment.
Overall, the structural deformation of the left side is more complex, with a variety of structural styles, while the right side is relatively simple. The deformation front on the left extends 230 mm from the basin edge, while the right extends 270 mm.
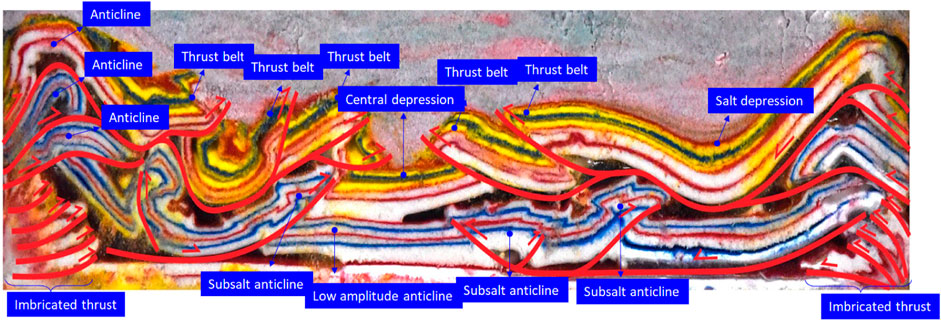
From the cross-sectional diagrams of the final deformation of experimental model 2 (Figure 9), the deformation is significantly influenced by variations of in the detachment layer and its thickness. The cross-sectional morphology shows that the suprasalt and intersalt strata exhibit distinctly different tectonic deformations. From the edges toward the center, the suprasalt strata transitions from anticline to thrust belt and then to depressions. Thrust belts and depression are more likely to form where the bulges exist. The intersalt strata are dominated by anticlines at both edges, while subsalt fault-related anticlines develop near the center. The subsalt strata form a pre-imbricate thrust system at both edges (Figure 9I).
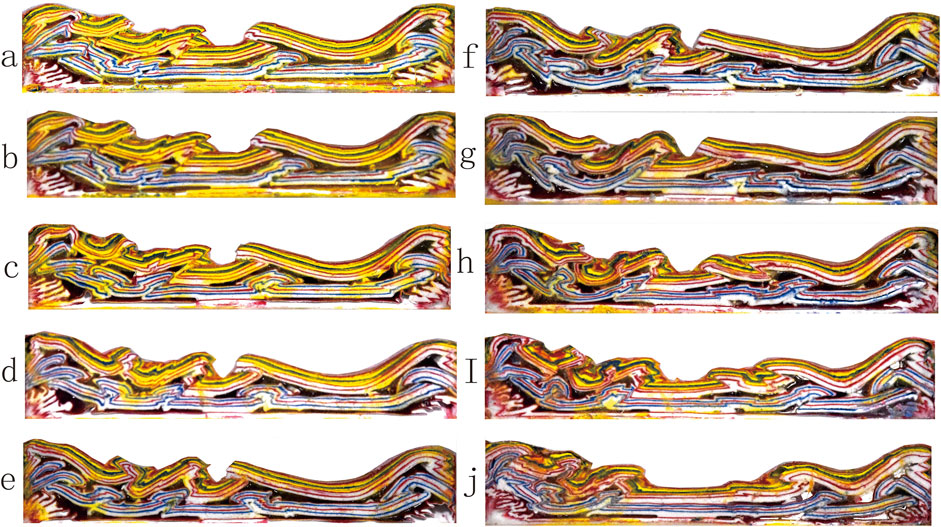
Figure 9. Cross-sectional view of the final stage of experimental Model 2. (A–J) Cross-sections at interval of about 4–5 mm, from the inside of the sandbox to the outside.
Various salt structures, such as salt-bottom cleavage and salt welds, develop within the two ductile layers. The deformation of the whole model has the characteristics of hedge structure, including basement involvement structure, cap slip structure, long-distance slip deformation and imbrication structure. Moreover, the thickness of the ductile layer has a significant influence on the scale of tectonic deformation. Thin ductile layers are dominated by imbricated thrust structures, while thick ductile layers result in more complex tectonic deformations.
5 Discussion
5.1 Influence of detachment layer on structural deformation
In Model 1, a single detachment layer is designed, representing the evaporite detachment layer at the top of the Jurassic. The experimental results show that in the process of single layer slip and compressional deformation, the strata above the detachment layer experience deformation first, forming a thrust nappe structure, with fault propagation towards the interior of the model occurring more rapidly. However, the deformation of the strata beneath the detachment layer is restricted to the region near the model’s edge, where superimposed deformation dominates, resulting in imbricated thrust blocks. The structural deformation under the detachment layer struggles to propagate into the interior of the model. Even when the deformation of the strata above the detachment layer becomes intense, the strata below the detachment layer retain their original state.
These findings indicate that in the single detachment model, the detachment layer has a significant influence on the tectonic deformation of the overlying strata. Shallow, large-scale detachment-related deformation is often localized above the detachment layer, while tectonic deformation beneath the detachment layer is primarily confined to the model’s edges and has limited ability to propagate into the basin.
In Model 2, two sets of detachment layers, one deep and one shallow, are introduced, with a significant thickness separating them. The lower detachment layer represents the deep crustal detachment, while the upper detachment layer corresponds to the evaporite detachment at the top of the Jurassic sedimentary strata. The experimental results show that during the early stage of compression, the tectonic deformation first occurs near the diapir in the upper detachment layer, forming a thrust nappe. Subsequently, the thicker strata representing the basement between the upper and lower detachment layers deform, creating detachment structures with the basement’s ductile layers acting as the detachment plane.
During the deformation process, the strata between the upper and lower detachment layers experience more intense deformation along their edges, with the deformation amplitude gradually exceeding that of the overlying strata, leading to the formation of a large basement backthrust structure. This phase of tectonic deformation corresponds to the early stage of the Pamir and Southwest Gissar overthrust belts located on the eastern and western sides of the Tajik Basin in actual geological models. As compression continues, basement uplift extends into the interior, forming a basement fault-anticline structure with large deformation amplitudes in the middle of the model. The suprasalt strata are affected by the basement uplift, and strong detachment deformation occurs, controlled by the upper detachment layer. Under the influence of the backthrust structure on the left and the central thrust structure developed in the basement, a deep depression forms at the junction of these two structures. This depression leads to deformation in the overlying strata, corresponding to the Bayson-Surhan depression in the western Tajik Basin, as observed in the actual geological settings. Therefore, in model with two detachment layers and significant thickness between them, the deep detachment layer plays a dominant role in controlling the overall tectonic deformation of the basin.
In the process of compressive tectonic deformation, the detachment layer plays a crucial role in controlling the deformation pattern of the overlying strata. It often forms a thrust detachment tectonic system with the detachment layer acting as the basal boundary. In the presence of multiple detachment layer, a multi-detachment layer can develop. The intensity of deformation within each detachment system is significantly influenced by the thickness of the strata above the detachment layer; generally, the greater the thickness, the more intense the deformation.
5.2 Influence of pre-existing bulges on structural deformation
In Model 2, two pre-existing bulges are introduced within the upper ductile layer. During the compression process, the strata above the upper ductile layer develop the first thrust nappe structure at the locations of these two pre-existing diapirs. As compression continues, the deformation of these two thrust nappe structures intensifies, which largely controls the tectonic deformation of the shallow formation units and leads to the formation of hedging structural characteristics.
The experimental results demonstrate that diapiric structures represent zones of relative weakness within the strata at the same depth, where compressive stress tends to concentrate. The initial deformation occurs in these regions during compression, leading to the formation of thrust nappe structures. In the later stages of continued compression, these regions continue to control the deformation of the overlying strata as the primary areas for stress release. However, not all pre-existing uplift structures evolve into thrust nappe structures during the later stages of compression. Without considering other influencing factors, pre-existing uplift structures that are closer to the source of stress are more likely to be activated.
5.3 Influence of tectonic wedge on tectonic deformation
In the actual geological model, orogenic belts with significant uplift on the east and west sides of the basin tend to form wedge-shaped structural layers that thin from the edge of orogenic belt towards the basin. To simulate this, a marginal tectonic wedge model was introduced at different stages in two models. To investigate the influence of wedge size on tectonic deformation, the thickness and length of the wedges on both sides of the model were varied.
The experimental results show that in the presence of both a pre-existing tectonic wedge and a detachment layer, tectonic stress in the strata above the detachment layer is transferred more rapidly, with thrust nappe structures preferentially developing at the tips of the wedge. Thrust deformation of the strata under the detachment layer primarily occurs near the orogenic belt, forming an imbricate thrust nappe structure. For strata beneath the tectonic wedge, deformation is limited to a small region near the edge, influenced by the overlying wedge’s gravitational forces, while other regions experience minimal deformation.
Therefore, the existence of a pre-existing tectonic wedge exerts a controlling influence on the location of thrust structures in the strata above the ductile layer, which mainly develop near the pinch-out zone of the tectonic wedge. However, the influence of the tectonic wedge on deformation beneath the detachment layer is relatively weak.
5.4 Comparative analysis between the experimental results and actual geological models
This study uses the Tajik Basin as a geological prototype to simulate the deformation processes and structural styles associated with salt-related tectonic deformation under varying conditions. The experimental results demonstrate that the thick evaporite strata in the Tajik Basin exert a significant control on the basin’s tectonic deformation, resulting in notable differences between the deformation characteristics of the suprasalt strata and the subsalt strata in the basin. Additionally, factors such as thickness and distribution of the ductile layer, paleo-structures, and basement properties also play crucial roles in shaping the overall deformation pattern of the basin.
The experiment demonstrates that the rigidity of the basement beneath the detachment layer significantly influences tectonic deformation. When a hard rigid basement exists beneath the ductile layer, it impedes the tectonic deformation of the subsalt strata. In the Tajik Basin, the basement is primarily composed of Periman-Triassic volcanic rocks, and the thickness of the subsalt sedimentary layer is relatively small, suggesting that the basement is near-rigid.
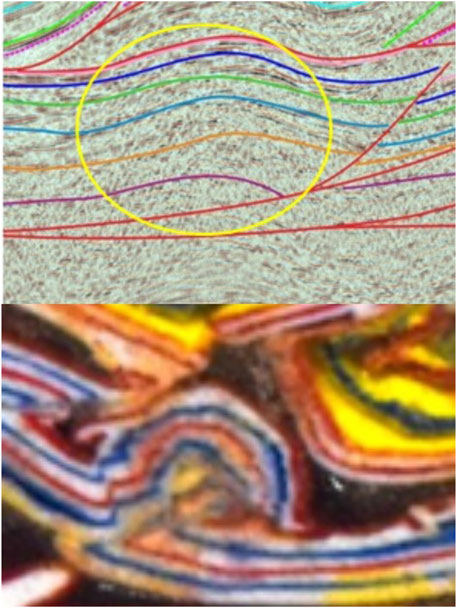
Due to the substantial thickness of the Jurassic evaporite, the western and eastern flanks of the Tajik Basin experienced intense compression during the Himalayan orogeny, causing significant overthrusting and nappe deformation in the suprasalt strata, where the ductile layer acted as a detachment horizon. However, the basement deformation is largely concentrated along the basin margins, with minimal deformation occurring beneath the detachment layer within the basin. Local structural deformation, such as the formation of anticlines or fault-related anticlines, may be influenced by the pre-existing protrusions or other factors (Figures 10, 11). Overall, the Tajik Basin exhibits limited basement-involved deformation, with the dominant style being caprock slip deformation (Figure 12).

Figure 10. Seismic profile interpretation of the Tajik Basin (profile location see Figure 1).
The tectonic deformation of the subsalt strata in the Kafirnigan uplift is minimal, allowing the subsalt anticlinal structures to form effective traps due to the sealing properties of the evaporite layer. The primary reservoir in these traps is Upper Jurassic carbonate rock, with the thick evaporite layer serving as the caprock (Figure 10). Faults that extend through the subsalt strata connect to the Lower and Middle Jurassic coal-bearing source rocks, enabling hydrocarbons to migrate directly into the traps along these fault zones. In addition, basement uplift near the Vakhsh depression has resulted in the development of broad, gentle anticlinal structures beneath the detachment fault. The presence of a thick ductile layer overlying these anticlines creates an excellent caprock, allowing for the formation of effective anticlinal traps in this area.
These observations indicate that the subsalt strata hold significant exploration potential, particularly in areas with anticlines and fault-related anticlines. The anticlines formed in the subsalt strata during the Himalayan compression, and due to the sealing effect of the overlying evaporite layer, they represent highly prospective traps for hydrocarbon exploration.
6 Conclusion
Structural physics simulation results indicate that the shallow fold and thrust system of the Tajik Basin is primarily controlled by the thick Upper Jurassic evaporite, which creates a complex hedged structural pattern. Early-stage salt diapirs have a strong influence on the localization of thrust structures. The deep basement detachment plays a critical role in controlling the overall tectonic deformation of the Tajik Basin, particularly affecting the subsalt strata. Subsalt tectonic deformation is characterized by large, broad, gently-faulted anticlinal structures. The Bison-Surhan Depression may have formed due to basement thrusting from both sides.
Additionally, the tectonic wedges at the basin margins accelerate the transfer of thrust-fault structures in the suprasalt strata towards the basin interior after the wedge is formed. In contrast, the deformation in the subsalt strata is more intense at the basin edges, resulting in the formation of imbricate thrust nappe structures.
Data availability statement
The original contributions presented in the study are included in the article/supplementary material, further inquiries can be directed to the corresponding authors.
Author contributions
YW: Methodology, Writing–original draft, Writing–review and editing. JZ: Supervision, Writing–review and editing. ZaY: Conceptualization, Writing–original draft. HJ: Data curation, Formal Analysis, Writing–original draft. WX: Data curation, Validation, Writing–review and editing. ZM: Project administration, Supervision, Writing–review and editing. JR: Investigation, Resources, Writing–review and editing. ZeY: Data curation, Methodology, Writing–review and editing. PY: Data curation, Formal Analysis, Writing–original draft.
Funding
The author(s) declare that no financial support was received for the research, authorship, and/or publication of this article.
Acknowledgments
Thanks to Zhuxin Chen, Nan Su and Yuqing Zhang from RIPED, CNPC for their guidance and great help in the structural physics simulation experiment. Thanks 24ZYGJCJ001and 2024DJ99 for support in publication. We are deeply grateful to the two reviewers for their constructive comments and suggestions, which has significantly improved the quality of this paper.
Conflict of interest
The authors declare that the research was conducted in the absence of any commercial or financial relationships that could be construed as a potential conflict of interest.
Publisher’s note
All claims expressed in this article are solely those of the authors and do not necessarily represent those of their affiliated organizations, or those of the publisher, the editors and the reviewers. Any product that may be evaluated in this article, or claim that may be made by its manufacturer, is not guaranteed or endorsed by the publisher.
References
Abdulhameed, S., Ratschbacher, L., Jonckheere, R., Gągała, Ł., Enkelmann, E., Käßner, A., et al. (2020). Tajik Basin and southwestern tian Shan, northwestern India-Asia collision zone: 2. Timing of Basin inversion, tian Shan mountain building, and relation to pamir-plateau advance and deep India-Asia indentation. Tectonics 39, e2019TC005874. doi:10.1029/2019tc005873
Abitkazy, T., Li, J.-H., Li, H.-L., Li, W.-B., Mao, X., and Wang, H.-H. (2014). Tectonic evolution and hydrocarbon potential of basins in central Asia and its adjacent regions. Geoscience 28 (3), 573–584. doi:10.3969/j.issn.1000-8527.2014.03.015
Brookfield, M. E., and Hashmat, A. (2001). The geology and petroleum potential of the North Afghan platform and adjacent areas (northern Afghanistan, with parts of southern Turkmenistan, Uzbekistan and Tajikistan). Earth-Science Rev. 55, 41–71. doi:10.1016/s0012-8252(01)00036-8
Chapman, J. B., Carrapa, B., DeCelles, P. G., Worthington, J., Mancin, N., Cobianchi, M., et al. (2019). The Tajik Basin: a composite record of sedimentary basin evolution in response to tectonics in the Pamir. Basin Res. 32, 525–545. doi:10.1111/bre.12381
Chen, Z., Yongliang, L. E. I., Dong, J. I. A., and Chen, H. (2019). Physical analog and structural modeling techniques and applications. Beijing: Science Press, 219–231.
Dedow, R., Franz, M., Szulc, A., Schneider, J. W., Brückner, J., Ratschbacher, L., et al. (2020). Tajik Basin and southwestern tian Shan, northwestern India-Asia collision zone: 3. Preorogenic to synorogenic retro-foreland basin evolution in the eastern Tajik depression and linkage to the Pamir hinterland. Tectonics 39, e2019TC005871. doi:10.1029/2019tc005874
Gągała, Ł., Ratschbacher, L., Ringenbach, J. C., Kufner, S. K., Schurr, B., Dedow, R., et al. (2020). Tajik Basin and southwestern tian Shan, northwestern India-Asia collision zone:1. Structure, kinematics, and salt tectonics in the Tajik fold-and-thrust belt of the western foreland of the Pamir. Tectonics 39, e2019TC005871. doi:10.1029/2019tc005871
Hong, C., Zhang, L., Lin, X., Sun, D., Chen, H., Chen, C., et al. (2022). Analogue modelling of the deformation in southwest Tarim Basin: implications for the influence of denudation and sys-tectonic sedimentation on the deformation of fold-and-thrust belts. Quat. Sci. 42 (3), 692–703. doi:10.11928/j.issn.1001-7410.2022.03.06
Hong-Xing, G. E., Vendeville, B. C., and Jackson, M. P. A. (2004). Physical models of thick-skinned contractional salt tectonics in a foreland fold-and thrust bels. Geol. J. China Univ. 10 (1), 39–49. doi:10.3969/j.issn.1006-7493.2004.01.003
Jia, C., and Yang, S. (2001). Tectonic geology and gas in basins, northern margin of Tethys. Beijing: Petroleum Industry Press, 39–49.
Käßner, A., Ratschbacher, L., Jonckheere, R., Enkelmann, E., Khan, J., Sonntag, B.-L., et al. (2016). Cenozoic intracontinental deformation and exhumation at the northwestern tip of the India-Asia collision-southwestern Tian Shan, Tajikistan, and Kyrgyzstan. Tectonics 35, 2171–2194. doi:10.1002/2015tc003897
Luo, J., Zhou, X., Qiu, B., Yang, Z., Yin, H., Li, Y., et al. (2005). Petroleum geology and geological evolution of the tarim-karakum and adjacent areas. Geol. Rev. 51 (4), 409–415. doi:10.3321/j.issn:0371-5736.2005.04.007
McNab, F., Sloan, R. A., and Walker, R. T. (2019). Simultaneous orthogonal shortening in the Afghan-Tajik Depression. Geology 47, 862–866. doi:10.1130/g46090.1
Panien, M., Schreurs, G., and Pfiffner, A. (2006). Mechanical behaviour of granular materials used in analogue modelling: insights from grain characterisation, ring-shear tests and analogue experiments. J. Struct. Geol. 28 (9), 1710–1724. doi:10.1016/j.jsg.2006.05.004
Schrerus, G., Buiter, S. H., Boutelier, D., Corti, G., Costa, E., Cruden, A. R., et al. (2006). “Analogue benchmarks of shortening and extension experiments,”. Analogue and numerical modeling of crustal-scale processes. Editors S. J. H. Buiter, and G. Schreurs (Geological Society of London), 253, 1–27. doi:10.1144/gsl.sp.2006.253.01.01
Sibson, R. H. (1998). Brittle failure mode plots for compressional and extensional tectonic regimes. J. Struct. Geol. 20, 655–660. doi:10.1016/s0191-8141(98)00116-3
Weijermars, R., Jackson, M. P. A., and Vendeville, B. (1993). Rheological and tectonic modeling of salt provinces. Tectonophysics 217 (1-2), 143–174. doi:10.1016/0040-1951(93)90208-2
Wu, Z., Yin, H., Zhang, T., and Fan, X. (2017). Characteristics and formation mechanism of thrust structures in the eastern margin of Pamir salient: insights from analogue modeling and discussion. Geotect. Metallogenia 41 (4), 663–677. doi:10.16539/j.ddgzyckx.2017.03.013
Yin, J., Jia, C., Wang, C., Li, Q., and Zhou, T. (2015). Petroleum geology characteristics and exploration potential in Afghan- Tajik Basin. Mar. Orig. Pet. Geol. 20 (4), 43–48. doi:10.3969/j.issn.1672-9854.2015.04.006
Yu, Y., Tao, C., Shi, S., Yin, J., Wu, C., and Liu, J. (2021). Physical modeling of salt structures in the middle south Atlantic marginal basins and their controlling factors. Petroleum Explor. Dev. 48 (1), 118–126. doi:10.11698/PED.2021.01.10
Zhang, K., Han, S., Wang, Z., Tao, C., Han, F., Li, C., et al. (2018). Characteristics of petroleum systems and resources potential in the Afghan-Tajik Basin. Geol. China 45 (5), 920–930. doi:10.12029/gc20180503
Zhu, Y., and Liu, L. (2007). Petroleum geology of south Tajikistan Basin in central Asia. Xinjiang Pet. Geol. 28 (2), 257–261. doi:10.3969/j.issn.1001-3873.2007.02.036
Keywords: fold-thrust belt, salt-related deformation, ductile layer, physical simulation, Tajik Basin
Citation: Wei Y, Zhifeng J, Yiqiong Z, Jinyou H, Xueke W, Mingjun Z, Ren J, Yue Z and Ying P (2024) Physical modelling of salt structural deformation in the Tajik Basin: insights into the formation of complex fold-and-thrust structures. Front. Earth Sci. 12:1478591. doi: 10.3389/feart.2024.1478591
Received: 10 August 2024; Accepted: 08 November 2024;
Published: 22 November 2024.
Edited by:
Zhong-Hai Li, University of Chinese Academy of Sciences, ChinaCopyright © 2024 Wei, Zhifeng, Yiqiong, Jinyou, Xueke, Mingjun, Ren, Yue and Ying. This is an open-access article distributed under the terms of the Creative Commons Attribution License (CC BY). The use, distribution or reproduction in other forums is permitted, provided the original author(s) and the copyright owner(s) are credited and that the original publication in this journal is cited, in accordance with accepted academic practice. No use, distribution or reproduction is permitted which does not comply with these terms.
*Correspondence: Ji Zhifeng, aml6aGlmQHBldHJvY2hpbmEuY29tLmNu; Zhang Yiqiong, Y3VnYnp5cUAxNjMuY29t
 Yin Wei1
 Zhang Yiqiong
 He Jinyou
 Wang Xueke
 Zheng Yue