- 1Wuhan Center, China Geological Survey (Central South China Innovation Center for Geosciences), Wuhan, Hubei, China
- 2Faculty of Earth Resources, China University of Geosciences, Wuhan, China
- 3College of Civil Engineering & Architecture, China Three Gorges University, Yichang, Hubei, China
- 4Chongqing Bureau of Geology and Mineral Resources Exploration and Development Nanjiang Hydrogerlogy Engineering Geology Team, Chongqing, China
Shallow landslides and debris flows triggered by heavy rainfall are widespread catastrophic geological disasters in mountainous areas. Landslides with complex terrain are often the material source of debris flows as a disaster chain. However, the failure mechanism and dynamic process of landslide triggered debris flow are still not clear. In July 2023, an obvious rockslide occurred during heavy rainfall in Changtan Town, Chongqing City, Southwest China, resulting in one death and seven houses collapsed. In this paper, back analysis in the dynamic process of the Yanghuachi (YHC) landslide triggered debris flow is carried out by the coupled particle flow model and elastic viscoplastic model. The reults indicate that the sliding body moves downward along the sliding surface, pushing the loose deposits at the lower part of the landslide to slip and then extending along the gully to the right bank of the Modao River. The overall movement duration of the landslide in the study area is approximately 180 s, with a maximum sliding velocity of about 22.08 m/s and a final deposition thickness of approximately 10.91 m. This study provides a methodology for analyzing the dynamic process of landslide triggered debris flows.
1 Introduction
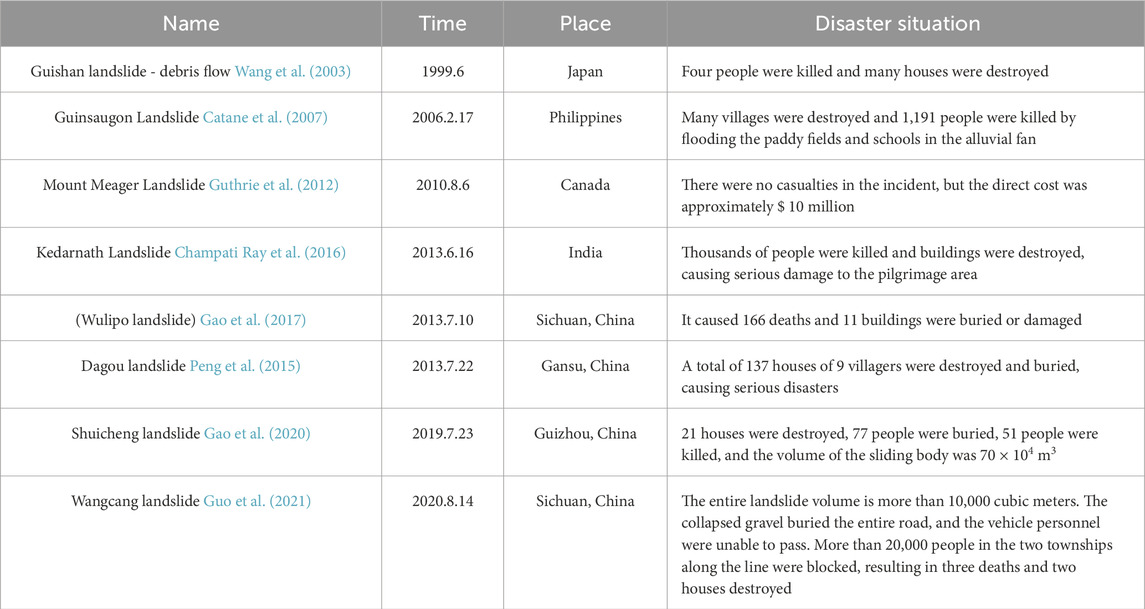
In recent years, geological disasters such as collapse and landslide have occurred on the bedding or near bedding rock mass in areas like high mountain areas, geologically active zones, river valleys, and canyons, particularly under the influence of heavy rainfall (Cheng et al., 2023; Chen et al., 2023; Yang et al., 2023; Wei et al., 2024; Ye et al., 2024; Liu et al., 2024). When a landslide destabilizes the rock and soil mass, it drives a large amount of debris, soil and rock, forming a highly concentrated and fluid debris flow (Ortiz-Giraldo et al., 2023). This fluid moves rapidly down the hillside with high speed and strong erosive force, eroding and destroying obstacles in its path, including buildings, roads and vegetation, and potentially causing numerous casualties, thereby significantly increasing the disaster’s impact. (Hungr et al., 2001; Chen et al., 2006). Recent typical landslide and debris flow disaster events in Table 1. These events all involve the transformation process from landslide triggered debris flow, which have resulted in significant loss of life and property.
This kind of debris flow is mostly caused by the instability of shallow landslide caused by heavy rainfall. These debris flow accumulate in the main channel to form channel debris flows (Igwe et al., 2015; Liu et al., 2021a; b, Qiu et al., 2024). It is an extremely fast flow-type landslide that often propagates long distances from its source in steep rivers (Arghya et al., 2022; Trujillo-Vela et al., 2022). The transformation of landslide triggered debris flow usually occurs suddenly, and the location is mostly located on the high slope. It is difficult to observe the whole movement process completely when the disaster occurs. Domestic and foreign scholars focus on the movement of landslide triggered debris flow, and the research methods are mainly physical model and numerical simulation (An et al., 2019; Ouyang et al., 2013).
Although the numerical simulation of simple debris flow is increasingly in-depth, the simulation research on the evolution of landslide triggered debris flow is still in the preliminary stage. The numerical simulation of debris flow mostly adopts a single numerical model. For example, Hungr and Evans (2004) and Scott and Hungr. (2004), McDougall, (2006) developed DAN3D software based on the equivalent fluid analysis theory of scraping rate, and successfully inverted the process of landslides such as Frank, Nomash River and Zymoetz River in Canada, which has become an efficient method for landslide dynamics analysis. Yin et al. (2016) used the SPH principle to reproduce the motion transformation process of landslide-debris flow disaster chain induced by artificial landfill. Chen et al. (2020) used Open LISEM software to simulate the initiation and flushing process of debris flow in Longxi River Basin of Dujiangyan City. It is concluded that long-term rainfall leads to the softening of loose accumulation of landslide, which eventually leads to the transformation of landslide damage to debris flow disaster. However, although these methods can simulate the long-distance propagation process of debris flow, it is difficult to effectively simulate the deformation of landslide and transform it into the dynamic conversion process of debris flow.
However, for high-level landslides, the instability movement will wrap the soil along the line to form a debris flow. It is difficult to effectively simulate the process of landslide instability, scraping the soil along the shovel, forming debris flow and long-distance propagation by using a single numerical simulation. At present, two numerical models are used to simulate the process of landslide movement and long-distance propagation of debris flow. For example, Hsu and Liu (2019) used a combination of TRIGRS and DEBRIS-2D models to simulate shallow landslides and subsequent debris flows caused by rainfall infiltration. Panpan et al. (2022) used the elastic-viscoplastic model and the particle flow model to invert the landslide barrier event in Guang ‘an Village, Chongqing in 2017, and used the calibrated numerical model and parameters to predict the failure of the deformation zone III. Lee et al. (2023) used TiVaSS and Deb2D models to analyze the phenomenon of slope collapse and the signs of sliding during collapse, and effectively identified the deterioration effect of landslide-debris flow events on dam function. In the data, it is still found that the provenance in the study area is rich. If the landslide slides again, it will form a more serious secondary debris flow disaster, which will eventually affect the safety of residents on both sides of the gully.
In this paper, the Yanghuachi landslide is taken as the case study Based on the field investigation, the numerical simulation is used to back-analyze the movement process of the landslide into debris flow event. The dynamic characteristics are analyzed to obtain the movement speed and final accumulation state of the landslide at different times, and the movement process of the landslide triggered debris flow is revealed.
2 Geological and geomorphological setting
In July 2023, a series of geological disasters were triggered by a sudden torrential rain in Wanzhou District of Chongqing City. The most severe event among them was the Yanghuachi landslide, which resulted in the damage of seven houses, the loss of one life, and the burial of 200 m of village roads (Figure 1A). Affected by the heavy rainfall on July 4, the upper landslide body of Yanghuachi landslide slipped and then continuously loaded and hit the debris accumulation area on the slope. Following the disintegration of the deposit, it became obstructed at the forefront of the D area and then dispersed downward through the adjacent gullies on both sides. As it moved, the material interacted with rainwater, triggering secondary debris flow disasters.
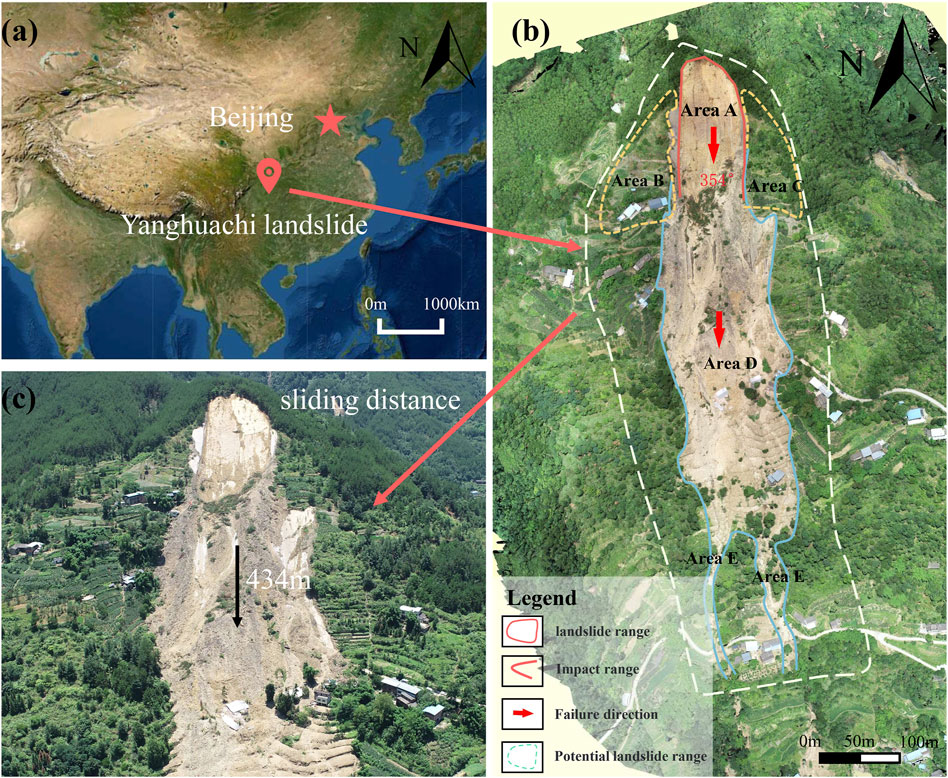
Figure 1. (A) landslide location map of the Yanghuachi landslide; (B) drone photo of the Yanghuachi landslide from top view; (C) The larger view of area A.
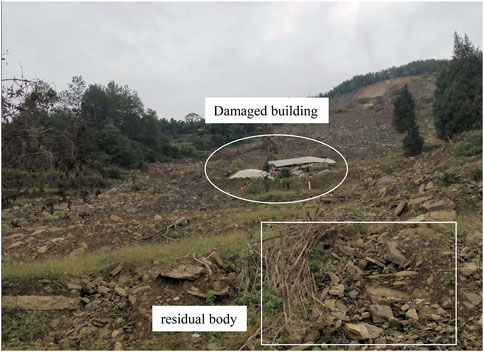
The terrain of Yanghuachi landslide is steep, and the lithology is mainly shale. The surface layer is Quaternary Holocene artificial accumulation layer, colluvial layer and landslide accumulation layer, with a distribution thickness of 1–2 m. The sliding area is rectangular in shape, with dimensionos of 90 m in width and 180 m in length, totaling an area of about 1.62 × 10⁴ m2. The thickness ranges from 2 to 8 m, averaging around 5 m, with a volume of about 8.1 × 10⁴ m3. The sliding direction is 354°. Currently, the A area has slipped downward to produce scraping and accumulation extrusion, only some residual bodies exist in the local slope, and the volume of the residual body is about 0.8 × 10⁴ m3. The upper shale fragment is composed of silty clay (Q4del), while the lower part consists of sandy shale (J1Zl-Sh). A muddy weak interlayer separates the shale layers (Figure 1B).
It is estimated that the total volume of the landslide is about 30.3 × 10⁴ m3. The upper section consists of rock mass, the middle section involves soil mass compressed by debris deposition, and the lower part involves debris flow. The landslide exhibits a generally ‘tongue’ shape (Figure 1C), extending in a north-south direction. The leading edge of the landslide ranges in elevation from 482–484 m, while the trailing edge stands at 720–728 m (Figure 2). The middle section is characterized by steps and slopes, covered with a significant amount of soil. The western upper part is bounded by the scar, while the lower section is enclosed by landslide accumulation and gullies. The landslide is segmented into five areas: collapsed area A, potential slump areas B and C, debris deposition area D, and debris transport area E.
3 The landslide propagation
3.1 Characteristics of landslide movement
Based on the topography of the study area and the observed landslide deposits, the landslide into debris flow can be divided into three areas: source area, impact scraping area and tranportion and deposition area.
3.1.1 Source area
Landslide failure occurred at 5:00 a.m. on July 4. The Yanghuachi landslide is a medium-sized rock-soil mixed landslide, which is mainly caused by the infiltration of surface water into the steeply inclined cracks at the trailing edge, which reduces the physical and mechanical properties of the argillized weak interlayer between the layers, resulting in the slip of the upper shale body along the layer. The sliding direction of the sliding body is 354°, the distribution thickness is about 2–8 m, the rear edge rock mass is thin about 2–4 m, the front edge is thick about 6–8 m, the overall thickness is 2–8 m, and the average thickness is about 5 m. At present, the landslide has slipped downward to produce scraping and accumulation extrusion. Only part of the residual body exists in the slope, and the volume of the residual body is about 0.8 × 10⁴ m3. After the left trailing edge of the landslide collapses, it moves to the leading edge, and the occurrence of the rock stratum is curved and nearly horizontal (Figure 3).

Figure 3. Photos of landslide source area [(A) shear joint between the right side wall of potential slip zone (B) and zone (A); (B). shear joint; (C). landslide wall in the collapsed slip zone; (D). the occurrence of rock strata in the left trailing edge is curved and nearly horizontal].
3.1.2 Impact scraping area
The rock and soil mass on the lower steep slope of the slump area is scraped by the accumulation of the upper slump body. At the same time, it is affected by rainfall and diffuses downward to the upper part of the D area (Figure 1B). The surface material of the D area produces scraping, loading and pushing, so that the surface soil slope of the D area slips and forms a scraping area (Figure 4). The elevation of the rear part of the area is about 630 m, and the elevation of the front part is about 460 m. There are some residual materials in the rear edge. The debris accumulation in the D area is squeezed and destroyed in the front house, and the local accumulation is higher. The upper part of the landslide area is superimposed on the accumulation body on the original slope. The thickness of the lower debris accumulation area is about 1–7 m, the average thickness is about 5 m, and the volume is about 25.2 × 10⁴ m3.
3.1.3 Tranportion and deposition area
Due to the steep terrain, it slips along the slope to the original gully. Under the condition of a large number of water migration and topography, the kinetic energy is converted into potential energy, and the flow rate is faster. The loose deposits at the bottom of the original gully also enter the debris flow, and the gully is impacted to the existing accumulation area. The flow valley area is the area of Erguanyan, Yanghuachi and Changtanba. The elevation of the trailing edge is about 230 m, the elevation of the leading edge is about 460 m, the thickness of the accumulation is about 4–6 m, the average thickness is about 5 m, and the slope angle is 25°–48°. The gully is circular, the cutting depth is generally 2–3.5 m, and the width of the gully bottom is 1.2–3 m (Figure 5). In the range of the circulation area, the upper part of the valley is mainly exposed to the bedrock, and the lower part is the accumulation layer. There are a large number of accumulation blocks on both sides of the valley, and obvious debris flow impact traces such as scratches can be seen at the bottom of the valley.
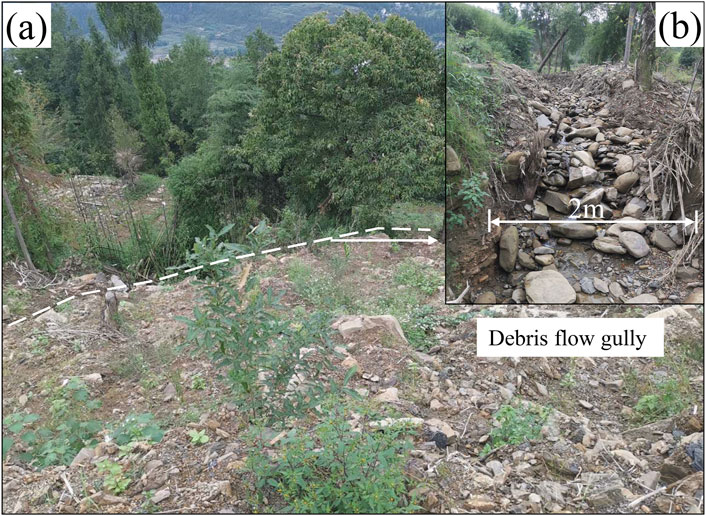
Figure 5. Debris flow gully in landslide circulation area [(A) debris flow gully on the right side of E area; (B). stone at the bottom of gully].
These three regions jointly reveal the whole development process of landslide-type debris flow. From the initial source area of the landslide, after impact and scraping, the debris flow is finally formed and deposits are formed downstream.
3.2 Deformation and failure mechanism of landslide
The Yanghuachi landslide is stepped, the front edge is a steep slope, the middle has a wide platform, and the rear edge is steep. The gullies on both sides of the landslide are the boundary of the landslide, and the free front of the landslide provides sufficient topographic and geomorphic conditions for the formation of the landslide.
The Yanghuachi landslide is a bedding rock landslide. The slope is mainly composed of shale, and there is a argillized weak interlayer between the shale layers. Under the long-term extrusion of the trailing edge slope, the leading edge slope deforms and the rock mass is free, which provides conditions for the instability and failure of the landslide. During the heavy rainfall on July 22, because the middle and rear slope of the landslide is a multi-stage platform and residential area that has been artificially transformed, the middle and rear roads, housing construction and slope retaining walls of the landslide are placed in the soil layer, which is equivalent to loading on the landslide body, aggravating the deformation and failure of the landslide and unfavorable for rainwater discharge.
Rainwater infiltrates along the cracks at the trailing edge of the slope, but the underlying bedrock of the slope is shale, which is an impermeable layer, which increases the weight of the landslide, softens the weak interlayer between the layers, and reduces the shear strength of the muddy interlayer. Under the combined influence of factors and external factors, the sliding force of the slope is increased, the anti-sliding force is reduced, and the slope is destabilized.
Based on the field investigation, the landslide area was preliminarily divided according to the accumulation characteristics and the event was restored: under long-term rainfall, the strength of the structural plane in the sliding source area decreased and the sliding was unstable, and the landslide body impacted the debris accumulation body at the lower part of the scraper. The sliding source area is mainly composed of shale, the bedding is very developed, and the accumulation body is basically disintegrated under the action of impact scraping. After that, the two are mixed and moved in the direction of 354°, which destroyed several houses. Because the original terrain is a flat platform, some sliding bodies have accumulated. From the on-site accumulation, it is shown that the disintegration of the sliding body in the source area is very sufficient. The terrain drops sharply in front of the platform, and part of the sliding bodies continue to move and scrape the soil on both sides of sides. In this process, the clay minerals in the debris flow continue to increase and move along the main gully, the rainfall in the whole basin continues to converge, and the water content of the mixture continues to increase, which leads to the transformation of the landslide triggered debris flow.
4 Back-analysis of the process of landslide propagation
4.1 Numerical model
4.1.1 The elasto-viscoplastic and particle flow models
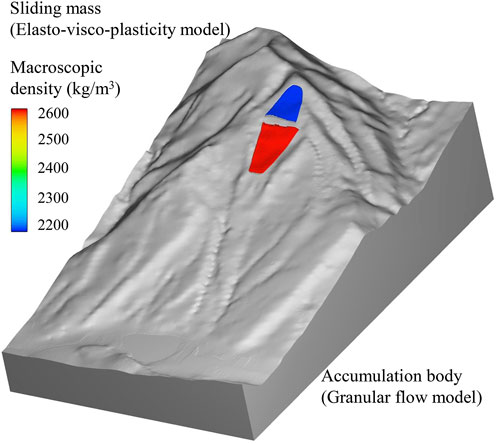
In order to accurately understand the dynamic evolution of Yanghuachi landslide event, this paper uses FLOW3D to establish a three-dimensional numerical model, and comprehensively uses the elastic-viscoplastic model and particle flow model to simulate the whole process of deformation and failure of the Yanghuachi landslide into debris flow.
In the whole process of movement, the upper sliding will collide with the lower debris accumulation, which leads to the movement of the whole landslide. The elastic viscoplastic model is used to simulate the deformation of the sliding process of the upper bedding rock sliding body. The particle flow model is used to describe the movement characteristics of the loose deposits to the gully on both sides of the middle debris accumulation and the lower debris flow. The particle flow model simulates the movement process of debris flow fluid, which can effectively couple the movement of fluid and particles, so as to simulate the movement process of real landslide triggered debris flow (Luo et al., 2022).
The elasto-viscoplastic model can effectively model the significant deformation of geotechnical materials in motion, and simulate the landslide as a continuous and equivalent fluid. In this model, the overall stress state is regarded as the superposition of viscous stress and elastic stress. Among them, the model predicts the linear relationship between the increase of elastic stress and strain. In addition, after applying strain in a short period of time, if the strain continues to increase and the elastic stress exceeds the yield threshold, the influence of viscous stress becomes particularly significant. At this time, the material will yield and exhibit fluid-like flow characteristics.
The stress tensor can be divided into deviatoric stress part and isotropic stress part Panpan et al. (2022):
In Equations 1, 2,
In order to predict yield effects, the Mises yield criterion is applied as follows (Equation 3):
If the stress on the material exceeds the yield criterion, the elastic stress relaxation obeys Equation 4:
where Y is the yield stress limit, and
After the upper mountain impacts the loose deposits, the movement of the loose deposits has a flow-like movement characteristic, which can be described by the particle flow model of Mih (1999). Mih’s particle flow shear stress equation (Equation 5) is:
In the formula: μf and ρ are the viscosity and density of the fluid between particles; ρs is the density of particles; e is the correlation coefficient with solid impact; D is the diameter of the particle;
The equation includes the fluid viscosity and the solid impact correlation coefficient. The viscosity is a constant, and the solid impact correlation coefficient is related to the characteristics of solid particles and fluids. This equation is in good agreement with the results of a large number of particle flow physical experiments carried out by different people (Mih, 1999). This study uses this formula to control the movement of loose deposits after the failure of Yanghuachi landslide.
At the same time, the two-phase flow energy exchange model (Flow Science, 2016) is used to consider the energy exchange generated during the collision between the sliding mountain and the lower deposit. The coupling model of granular flow and elasto-viscoplasticity adopts the incompressible fluid model with different densities. Assuming that the density of the elasto-viscoplastic fluid is
Equations 6–10 are derived from the Flow Science (2016) Flow-3D V11.0 user’s manual. The continuous momentum balance formula (Equation 6) of elasto-viscoplastic fluid is:
The momentum balance formula (Equation 7) of granular flow is:
where u1、u2 are the velocity of elastic-viscoplastic fluid and particle flow; F is the pressure of the object; P is pressure; K is the drag coefficient related to the interaction between the two stages; in Equation 9, ur is the relative velocity difference between different phases Equation 8 in Mih (1999).
The volume-weighted average velocity formula (Equation 9) of the mixture is:
The drag force formula for each unit volume is:
In the formula, A2 is the cross section area of each unit volume in the particle flow;
4.1.2 Model establishment
The digital elevation model of Yanghuachi landslide is drawn according to the engineering geological survey profile and plan, and the volume is about 30.3 × 10⁴ m3. According to the 1:10,000 topographic map, a three-dimensional numerical simulation model of Yanghuachi landslide was established (Figure 6). The model area includes the slope to the right bank of Modao Creek, and the terrain contour line is imported into the materilise magics three-dimensional modeling software to generate the terrain entity. The generated terrain entity is imported into FLOW3D software to check whether the model is complete.
In order to improve the calculation efficiency and avoid affecting the size of the study area, the minimum elevation and maximum elevation of the three-dimensional calculation model of Yanghuachi landslide are set to 220 m and 750 m respectively, and the height difference (Z direction) is 530 m. The length (X direction) and width (Y direction) of the model are 1,390 m and 2,150 m, respectively.
The initial state of the calculation model is static. The Z min surface is the zero-flow wall boundary, and the Z max surface (water surface) is the zero-pressure boundary, that is, the free surface. The X min surface (valley), X max surface, Y min surface and Y max surface are all outflow boundaries, that is, the open boundary, and the fluid can flow freely. According to the results of the model test, the grid of the required calculation area is divided. According to the terrain size and the computer operation ability, the unit grid is divided into 3 m × 3 m × 3 m, a total of 29,574,722 units.
4.1.3 Parameters
The particle collision grain restitution coefficient, grain density, global vent coefficient, and average grain diameter in the particle flow model are all field measured values (Table 2). After calibration, the two parameters of fluid density and fluid viscosity are comprehensively valued.
4.2 Numerical model check
4.2.1 Comparative analysis of motion process
When constructing the calculation model, the sliding area is divided into the upper rock and soil mass and the lower accumulation body. It is assumed that the lower accumulation body should remain stable without the action of the unstable sliding of the upper rock and soil mass. Based on this assumption, the stability of the lower deposit is calculated before the simulation. The calculation results (Figure 7). When t = 6 s, only a small displacement occurs in some areas of the lower deposit and the velocity is small (less than 1 m/s). When t = 18 s, most of the lower accumulation body has stopped moving, and only a few areas still creep forward at an extremely slow speed. From the whole movement process of a single accumulation body, there is no obvious change in the shape of the accumulation body. With the increase of time, the movement speed of the accumulation body continues to slow down, and finally stops moving. Although the effect of erosion is not considered, the existing model can also reproduce the whole process of motion by adjusting the parameters. In summary, the particle flow model for the accumulation body is in line with the stability requirements of the slope.
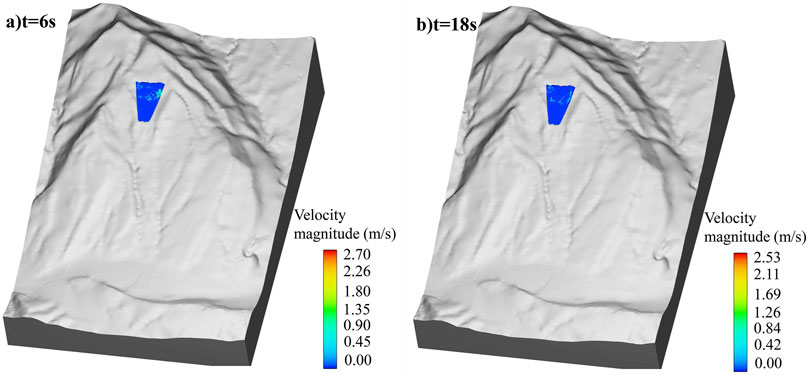
Figure 7. Instantaneous velocity field diagram of middle and lower accumulation body of slope under natural state. (A) t = 6s, (B) t = 18s.
4.3 Analysis of landslide dynamic process
When the particle flow model slides, the collision on the elastic viscoplastic model will produce a series of motion processes. From the beginning of landslide sliding, a total of 92 s is calculated. From the motion pattern diagram of each period in the study area (Figure 8), it can be seen that when t = 4 s, the upper sliding body is unstable and slides, and the main sliding direction is 354°. The potential energy is converted into kinetic energy, and the front edge of the scraping area below the impact shear outlet begins to impact at a speed of about 19.59 m/s. When t = 8 s, part of the rock and soil mass enters the scraper area at a speed of about 22.08 m/s, continuously impacts the accumulation body in the scraper area, takes away the surface weathered rock and soil mass, and continuously disintegrates into debris flow. Compared with Figure 7B, under the push of the sliding body, the accumulation body began to uplift upward and slide downward, and the speed gradually accelerated.
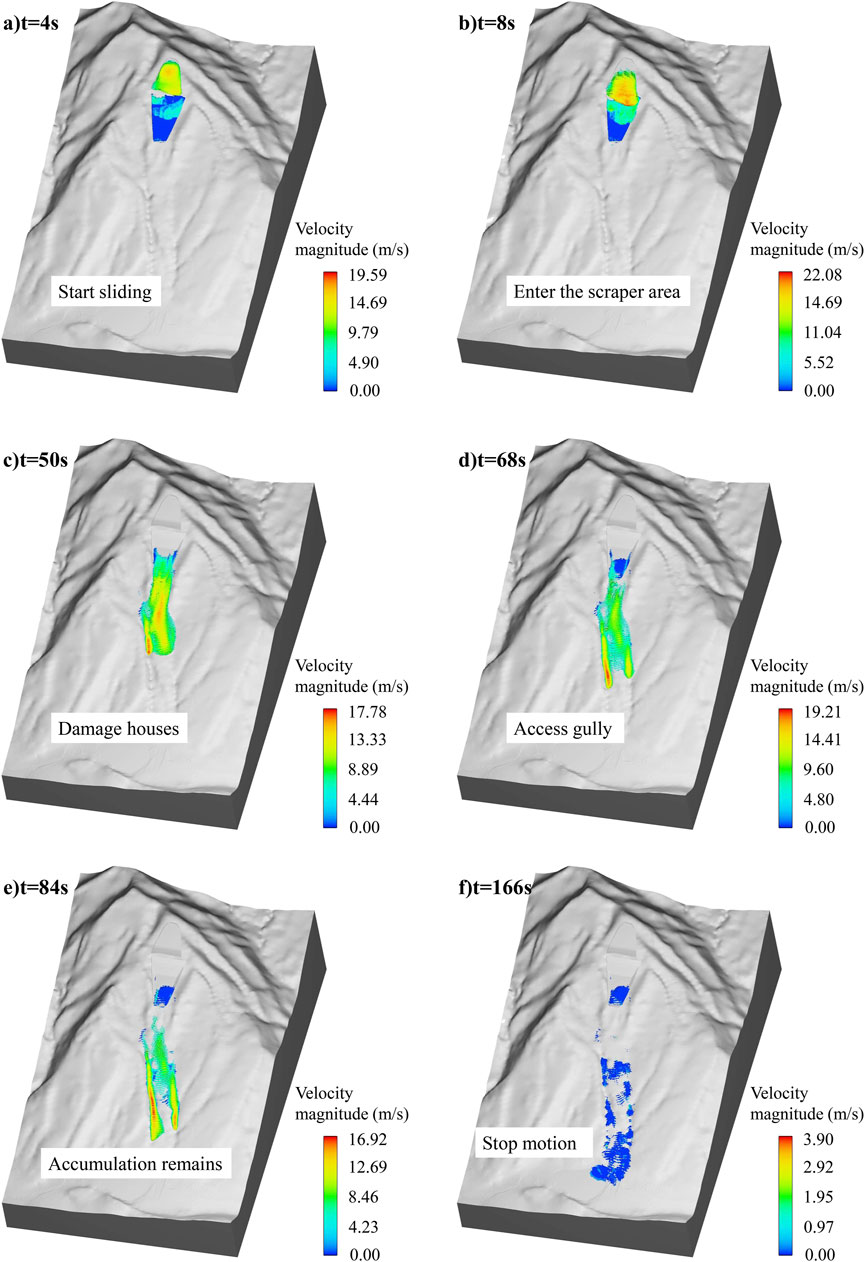
Figure 8. Slope movement process diagram. (A) t = 6s, (B) t = 8s, (C) t = 50s, (D) t = 68s, (E) t = 84s, (F) t = 166s.
When t = 50 s, the sliding body continues to move after the leading edge of the scraping shovel area converges, and the average speed in front is about 13.33–8.89 m/s. The accumulation body driven by the rear began to move at a speed of 8.89 m/s-4.44 m/s, passing through the housing area and destroying and burying the house. When t = 68 s, the rock and soil mass has slipped through the scraping shovel area, and the rock and soil mass enters the two gullies to move downward due to the influence of the terrain, and the flow rate is about 19.21 m/s. When t = 84 s, there are still some accumulation bodies left in the scraper area at the trailing edge, and most of the rock and soil mass continue to move downward along the gullies on both sides. The average velocity of the lower accumulation body is about 8.70–11.50 m/s, and the average velocity of the upper sliding body is about 8.46–5.56 m/s. When t = 166 s, the front edge of the front sliding body has stopped moving around the river, and the speed of the rear sliding body is greatly reduced due to the blocking and resistance of the front accumulation body.
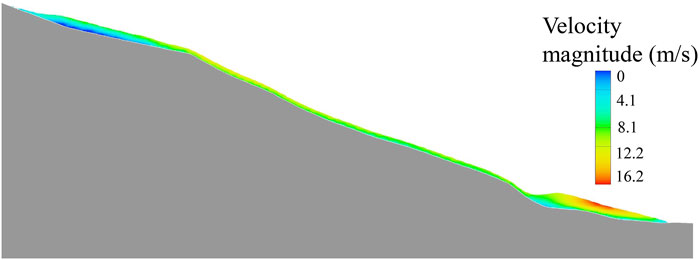
Figure 8 shows the velocity change process of the whole process of landslide transforming debris flow. On the whole, after the instability of the upper slope of the Yanghuachi landslide started, the speed increased greatly in a short period of time, and then maintained a speed of about 17 m/s for a certain distance, and then the overall speed began to decrease. At 166 s, most of the movement of the debris flow stopped, and the speed converged to zero. By extracting the model data, the overall average speed of the landslide was 16 m/s. As shown in Figure 8C, 50%–60% of the Y-axis positive direction is intercepted along the sliding direction of the landslide, and the velocity section of the landslide is obtained in the Y-axis positive direction (Figure 9). In the vicinity of 50 s, the maximum velocity of the landslide surface unit is 16.2 m/s. From the cross section of Figure 9, the velocity of the landslide shows an increasing distribution pattern in the transition from the base to the surface, which reflects that the bottom of the landslide may have experienced significant shear strain. The solid materials in the landslide body are mainly distributed in the middle and lower parts of the landslide under the action of gravity. At the same time, in the process of eroding the riverbed, the movement speed of these materials is relatively slow due to the obstruction of the riverbed. In contrast, the upper part of the landslide is less hindered by the bottom, so its movement speed is relatively fast.
4.3.1 Analysis of landslide accumulation state
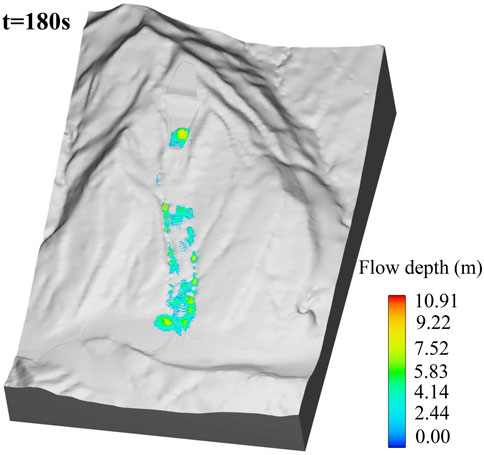
At 180 s, the movement process of landslide turning into debris flow is basically over, and the accumulation form has been basically formed. From the accumulation pattern of the landslide (Figure 10), at 180 s, most of the residual body of the slope is concentrated in the debris flow circulation area, and the local residue is in the impact scraping area, which is close to the actual situation of the landslide (Figure 5B). The upper part of the gully in the circulation area is mainly exposed to bedrock, and the lower part is the accumulation layer. There are a large number of accumulation bodies on both sides of the gully. The accumulation thickness is about 4.44–10.91 m, the average thickness is about 7 m, and the maximum thickness of the final accumulation is about 10.91 m. The thickness of the bottom of the accumulation form changes from thick to thin, which conforms to the accumulation form after the landslide movement process stops.
5 Discussion and conclusion
On 4 July2023, a heavy rainfall in Changtan Town, Wanzhou District, Chongqing City, Southwest China triggered a landslide-type debris flow. Through field investigation and numerical simulation, the characteristics of the landslide disaster, especially the dynamic mechanism of particle flow during the movement, were studied. The following conclusions were obtained.
(1) The total volume of Yanghuachi landslide is about 30.3 × 10⁴ m3. The upper part is a consequent rock landslide, the middle part is a soil landslide squeezed by debris accumulation, and the lower part is a compound geological disaster chain of debris flow. After the landslide slides, there are five deformation zones on the slope, and the amount of landslide in the collapsed area is about 1.62 × 10⁴ m3.
(2) The formation of the Yanghuachi landslide is the result of the interaction of its unique step-like topography, geological structure and heavy rainfall events. The topography of the landslide is step-like, and the shale layer is sandwiched with argillized weak interlayer. The long-term extrusion leads to the deformation of the front edge. The heavy rainfall on July 22, coupled with the loading of artificial facilities such as roads and houses, resulted in rainwater infiltration and increased self-weight of the slope, which eventually triggered landslide instability.
(3) The elastic-viscous-plastic model coupled with the particle flow model is used to simulate the process of instability movement, scraper soil and long-distance movement of Yanghuachi landslide. The maximum velocity of the landslide is about 22.08 m/s, the overall movement time is about 180 s, and the maximum accumulation depth is about 10.91 m. The numerical calculation results are in good agreement with the actual situation of field investigation, and the coupling calculation model can be used to simulate the dynamic process of landslide motion-scraping, pushing-damming etc.
In this paper, the numerical simulation software is used to simulate the landslide-debris flow. However, due to the complexity and uncertainty of the actual geological environment, the landslide-debris flow in different regions is quite different, and its motion characteristics must be different from this paper. Therefore, the simulation of other cases needs to continuously compare and correct the simulation results with the field measured data. Real-time data such as landslide deformation and rainfall intensity are obtained by monitoring equipment, and various parameters in the model are constantly adjusted to ensure the accuracy and reliability of the simulation results. At the same time, in order to better predict and mitigate landslide and debris flow disasters, monitoring and early warning of such landslides should be deployed in advance, and emergency measures should be taken quickly in the near-sliding stage, such as strengthening the slope, dredging the water flow, and reducing the source of materials to prevent the occurrence of landslides.
Data availability statement
The original contributions presented in the study are included in the article/supplementary material, further inquiries can be directed to the corresponding author.
Author contributions
FW: Conceptualization, Formal Analysis, Investigation, Methodology, Software, Supervision, Writing–original draft, Writing–review and editing. ZD: Conceptualization, Investigation, Methodology, Project administration, Resources, Supervision, Writing–original draft, Writing–review and editing. AZ: Conceptualization, Formal Analysis, Methodology, Writing–review and editing. SC: Conceptualization, Formal Analysis, Methodology, Writing–review and editing. QX: Funding acquisition, Investigation, Resources, Writing–review and editing.
Funding
The author(s) declare that financial support was received for the research, authorship, and/or publication of this article. The work was supported by a follow-up of the Geological Disaster Prevention and Control Project in the Three Gorges area (Grant No. 000121 2024C C60 001 and Grant No. 000121 2023C C60 001), Qianlong Plan Top Talent Project of Wuhan Center of China Geological Survey (Grant No. QL2022-06).
Acknowledgments
The authors would like to thank Chongqing Bureau of Geology and Mineral Resources Exploration and Development Nanjiang Hydrogerlogy Engineering Geology Team, for the great assitance in field investigation and providing date.
Conflict of interest
The authors declare that the research was conducted in the absence of any commercial or financial relationships that could be construed as a potential conflict of interest.
Publisher’s note
All claims expressed in this article are solely those of the authors and do not necessarily represent those of their affiliated organizations, or those of the publisher, the editors and the reviewers. Any product that may be evaluated in this article, or claim that may be made by its manufacturer, is not guaranteed or endorsed by the publisher.
References
An, H., Kim, M., Lee, G., Kim, Y., and Lim, H. (2019). Estimation of the area of sediment deposition by debris flow using a physical-based modeling approach. Quatern Int. 503, 59–69. doi:10.1016/j.quaint.2018.09.049
Arghya, A. B., Hawlader, B., and Guthrie, R. H. (2022). A comparison of two runout programs for debris flow assessment at the Solalex-Anzeindaz region of Switzerland. in Géorisques - VIII - geohazards (quebec, Canada). Available at: https://www.stantec.com/en/ideas/a-comparison-of-two-runout-programs-for-debris-flow-assessment-solalex-anzeindaz-region-switzerland (Accessed May 1, 2023).
Catane, S. G., Cabria, H. B., Tomarong, C. P., Saturay, R. M., Zarco, M. A. H., and Pioquinto, W. C. (2007). Catastrophic rockslide-debris avalanche at st. Bernard, southern leyte, Philippines. Landslides 4, 85–90. doi:10.1007/s10346-006-0050-3
Champati Ray, P. K., Chattoraj, S. L., Bisht, M. P. S., Kannaujiya, S., Pandey, K., and Goswami, A. (2016). Kedarnath disaster 2013: causes and consequences using remote sensing inputs. Nat. Hazards 81, 227–243. doi:10.1007/s11069-015-2076-0
Chen, H., Dadson, S., and Chi, Y.-G. (2006). Recent rainfall-induced landslides and debris flow in northern Taiwan. Geomorphology 77, 112–125. doi:10.1016/j.geomorph.2006.01.002
Chen, H. J., Zou, H., Yin, Y., Wang, C., and Mao, S. (2023). Analysis of characteristics and causes of landslide damage in group 3 of yuanshan village, huangmei county under the influence of continuous heavy rainfall. South China Geol. 39 (3), 482–491. (in Chinese). doi:10.3969/j.issn.2097-0013.2023.03.007
Chen, M., Tang, C., Wang, F., and Wang, X. (2020). Prediction of debris flow start-up and washout based on OpenLISEM model. Sediment Res. 45 (04), 59–65. (in Chinese). doi:10.16239/j.cnki.0468-155x.2020.04.010
Cheng, S., Dai, Z. W., Fu, X. L., Zhang, A. L., Wang, L. Q., Zhang, C. Y., et al. (2023). Instability mechanism and debris flow dynamics of fenghuang mountain dangerous rock mass in wuxi, three Gorges reservoir area. South China Geol. 39 (3), 470–481. (in Chinese). doi:10.3969/i.issn.2097-0013.2023.03.006
Gao, L., Zhang, L. M., and Chen, H. X. (2017). Two-dimensional simulation of debris flow impact pressures on buildings. Eng. Geol. 226, 236–244. doi:10.1016/j.enggeo.2017.06.012
Gao, Y., Li, B., Gao, H., Chen, L., and Wang, Y. (2020). Dynamic characteristics of high-elevation and long-runout landslides in the Emeishan basalt area: a case study of the Shuicheng “7.23” landslide in Guizhou, China. Landslides 17, 1663–1677. doi:10.1007/s10346-020-01377-8
Guo, J., Wang, J., Li, Y., and Yi, S. (2021). Discussions on the transformation conditions of Wangcang landslide-induced debris flow. Landslides 18, 1833–1843. doi:10.1007/s10346-021-01650-4
Guthrie, R. H., Friele, P., Allstadt, K., Roberts, N., Evans, S. G., Delaney, K. B., et al. (2012). The 6 August 2010 Mount Meager rock slide-debris flow, Coast Mountains, British Columbia: characteristics, dynamics, and implications for hazard and risk assessment. Nat. Hazards Earth Syst. Sci. 12, 1277–1294. doi:10.5194/nhess-12-1277-2012
Hsu, Y. C., and Liu, K. F. (2019). Combining TRIGRS and DEBRIS-2D models for the simulation of a rainfall infiltration induced shallow landslide and subsequent debris flow. Water 11 (5), 890. doi:10.3390/w11050890
Hungr, O., and Evans, S. G. (2004). Entrainment of debris in rock avalanches: an analysis of a long run-out mechanism. GSA Bull. 116 (9-10), 1240–1252. doi:10.1130/b25362.1
Hungr, O., Evans, S. G., Bovis, M. J., and Hutchinson, J. N. (2001). A review of the classification of landslides of the flow type. Environ. Eng. Geosci. 7 (3), 221–238. doi:10.2113/gseegeosci.7.3.221
Igwe, O., Mode, W., Nnebedum, O., Okonkwo, I., and Oha, I. (2015). The mechanisms and characteristics of a complex rock-debris avalanche at the Nigeria-Cameroon border, West Africa. Geomorphology 234, 1–10. doi:10.1016/j.geomorph.2014.12.040
Lee, S., An, H., Kim, M., and Kang, T. (2023). Assessment of dam function deterioration due to landslide-debris flows: numerical modeling based on vegetation distribution scenarios. Front. Earth Sci. 11, 1216096. doi:10.3389/feart.2023.1216096
Liu, B., He, K., Han, M., Hu, X., Ma, G., and Wu, M. (2021b). Application of UAV and GB-SAR in mechanism research and monitoring of Zhonghaicun landslide in Southwest China. Remote Sens. 13 (9), 1653. doi:10.3390/rs13091653
Liu, B., He, K., Han, M., Hu, X., Wu, T., Wu, M., et al. (2021a). Dynamic process simulation of the Xiaogangjian rockslide occurred in shattered mountain based on 3DEC and DFN. Comput. Geotech. 134, 104122. doi:10.1016/j.compgeo.2021.104122
Liu, Y., Qiu, H., Kamp, U., Wang, N., Wang, J., Huang, C., et al. (2024). Higher temperature sensitivity of retrogressive thaw slump activity in the Arctic compared to the Third Pole. Sci. Total Environ. 914, 170007. doi:10.1016/j.scitotenv.2024.170007
Luo, C., Chang, M., Wu, B. B., Liu, P., and Yu, B. (2022). Simulation of debris flow faucet movement process based on FLOW-3D. The Chinese Journal of Geological Hazard and Control 33 (06), 53–62. (in Chinese). doi:10.16031/j.cnki.issn.1003-8035.202107005
McDougall, S. (2006). A new continuum dynamic model for the analysis of extremely rapid landslide motion across complex 3D terrain. University of British Columbia.
Ortiz-Giraldo, L., Botero, B. A., and Vega, J. (2023). An integral assessment of landslide dams generated by the occurrence of rainfall-induced landslide and debris flow hazard chain. Front. Earth Sci. 11, 1157881. doi:10.3389/feart.2023.1157881
Ouyang, C. J., He, S. M., Xu, Q., Luo, Y., and Zhang, W. (2013). A MacCormack-TVD finite difference method to simulate the mass flow in mountainous terrain with variable computational domain. Comput. Geosci. 52, 1–10. doi:10.1016/j.cageo.2012.08.024
Panpan, Q., Bolin, H., Bin, L., Xiaoting, C., and Xiannian, J. (2022). Hazard analysis of landslide blocking a River in guang’an village, wuxi county, chongqing, China. Landslides 19, 2775–2790. doi:10.1007/s10346-022-01943-2
Peng, J., Fan, Z., Wu, D., Zhuang, J., Dai, F., Chen, W., et al. (2015). Heavy rainfall triggered loess–mudstone landslide and subsequent debris flow in Tianshui, China. Eng. Geol. 186, 79–90. doi:10.1016/j.enggeo.2014.08.015
Qiu, H., Su, L., Tang, B., Yang, D., Ullah, M., Zhu, Y., et al. (2024). The effect of location and geometric properties of landslides caused by rainstorms and earthquakes. Earth Surf. Process. Landforms 49 (7), 2067–2079. doi:10.1002/esp.5816
Scott, M. D., and Hungr, O. (2004). A model for the analysis of rapid landslide motion across three-dimensional terrain. Can. Geotechnical J. 41 (6), 1084–1097. doi:10.1139/t04-052
Trujillo-Vela, M. G., Ramos-Cañón, A. M., Escobar-Vargas, J. A., and Galindo-Torres, S. A. (2022). An overview of debris-flow mathematical modelling. Earth Sci. Rev. 232, 104135. doi:10.1016/j.earscirev.2022.104135
Wang, G., Sassa, K., and Fukuoka, H. (2003). Downslope volume enlargement of a debris slide–debris flow in the 1999 Hiroshima, Japan, rainstorm. Eng. Geol. 69 (3-4), 309–330. doi:10.1016/s0013-7952(02)00289-2
Wei, Y., Qiu, H., Liu, Z., Huangfu, W., Zhu, Y., Liu, Y., et al. (2024). Refined and dynamic susceptibility assessment of landslides using InSAR and machine learning models. Geosci. Front. 15 (6), 101890. doi:10.1016/j.gsf.2024.101890
Yang, S. S., Ye, R. Q., Fu, X. L., Wu, R. Z., Xiong, N., and Wen, T. L. (2023). Study on early warning rainfall threshold of rainfall induced landslide in the three Gorges reservoir area. South China Geol. 39 (3), 445–454. (in Chinese). doi:10.3969/j.issn.2097-0013.2023.03.004
Ye, B., Qiu, H., Tang, B., Liu, Y., Liu, Z., Jiang, X., et al. (2024). Creep deformation monitoring of landslides in a reservoir area. J. Hydrol. 632, 130905. doi:10.1016/j.jhydrol.2024.130905
Keywords: landslide triggered debris flow, particle flow, elasto-viscoplastic, failure mechanism, dynamic process
Citation: Wang F, Dai Z, Zhang A, Cheng S and Xiong Q (2024) Failure mechanism and dynamic process of landslide triggered debris flows—an example from Chongqing, China. Front. Earth Sci. 12:1478252. doi: 10.3389/feart.2024.1478252
Received: 09 August 2024; Accepted: 05 September 2024;
Published: 14 November 2024.
Edited by:
Haijun Qiu, Northwest University, ChinaReviewed by:
Yifei Gong, Beijing University of Technology, ChinaZhiqian Liu, Hong Kong Polytechnic University, Hong Kong SAR, China
Copyright © 2024 Wang, Dai, Zhang, Cheng and Xiong. This is an open-access article distributed under the terms of the Creative Commons Attribution License (CC BY). The use, distribution or reproduction in other forums is permitted, provided the original author(s) and the copyright owner(s) are credited and that the original publication in this journal is cited, in accordance with accepted academic practice. No use, distribution or reproduction is permitted which does not comply with these terms.
*Correspondence: Zhenwei Dai, ZGFpemhlbndlaUBtYWlsLmNncy5nb3YuY24=
 Fen Wang1,2
 Zhenwei Dai
 Anle Zhang