- 1Key Laboratory of Cryospheric Science and Frozen Soil Engineering, Northwest Institute of Eco-Environment and Resources Chinese Academy of Sciences, Lanzhou, China
- 2Da Xing’anling Observation and Research Station of Frozen-Ground Engineering and Environment, Northwest Institute of Eco-Environment and Resources, Chinese Academy of Sciences, Beijing, China
- 3Electric Power Research Institute, State Grid Heilongjiang Electric Power Company Limited, Harbin, Heilongjiang, China
Meteorological characteristics and freeze-thaw processes are crucial indicators guiding regional economic development and practical production. The Da Xing’anling Mountains, serving as a transitional zone between continuous permafrost and seasonal frozen ground in northeastern China’s high latitudes, understanding the meteorological parameters and freeze-thaw development patterns in this region can significantly enhance the accuracy of permafrost zoning maps and validate climate simulation models. Based on meteorological and ground temperature monitoring data from 2022–2023, this study analyzed the meteorological characteristics and seasonal freeze-thaw processes of Jagdaqi (southern Da Xing’anling Mountains), which is located at the boundary between permafrost and seasonally frozen soil. The results indicate: (1) At a height of 5 m, the annual average temperature is 1.04°C. The air-freezing index and air-thawing index are −2318.95°Cd and 2698.52°Cd, respectively, categorizing it as a severe cold region. (2) The total annual precipitation is 397.1 mm, with summer rainfall accounting for 77.4% and winter rainfall only 11.3%. (3) The prevailing wind direction is from the northwest, accounting for approximately 47% of the total annual wind direction frequency. Annual wind speeds range from 0.045 to 10.33 m/s, with an average speed of 1.51 m/s. (4) At heights of 5 m and 10 m, the annual average relative humidity is 63.49% and 62.1%, respectively, reaching its lowest in May at 44.58% and 43.38%. (5) The study area is located in a seasonal frozen ground region, with maximum frost depths occurring in early to mid-March, ranging between 1.93–1.99 m, classified as middle-thick seasonally frozen ground. These findings hold valuable implications for ecological conservation, resource management, and engineering construction, enhancing the accuracy and applicability of models and permafrost zoning maps in this region.
1 Introduction
The Da Xing’anling Mountains, as an important geographical and climatic boundary in Northeast China, lies at the junction of temperate and cold zones, serving as a transitional zone between high-latitude permafrost and seasonal frozen ground. This unique location has shaped distinctive climate and ecological environments (Luo et al., 2014; Yasmeen et al., 2019). The region is significant for forestry and mineral resources, as well as vital for ecological conservation, boasting rich forest resources and unique ecosystems (Chen and Zhou, 2023; Tian et al., 2009). With global climate change intensifying, the Da Xing’anling Mountains faces increased frequency and intensity of climate extremes such as meteorological droughts, floods, and snowstorms (Chen et al., 2014; Guo and Li, 1981). Research into the meteorological characteristics of this region can effectively support the development of climate adaptation strategies and risk management measures (Liu et al., 2024; Jiang et al., 2024). This, in turn, reduces disaster losses and ensures sustainable socio-economic development (Wang et al., 2014). Additionally, such research provides scientific basis for the rational utilization and management of forests, water resources, etc. (Gao et al., 2018), aiding in finding a balance between resource exploitation and ecological protection (Gao et al., 2020). The Da Xing’anling Mountains exhibits significant seasonal and interannual variability, making it an ideal demonstration area and representative region for studying climate change (Wei et al., 2011). Studying its climate change patterns helps better understand the interactions of various complex factors within the global climate system and their impacts on regional climates (Fan et al., 2023). Seasonal freeze-thaw processes directly impact regional plant growth and soil nutrient cycling, water resource availability, and flood formation. Simultaneously, they serve as crucial guiding parameters for engineering projects and resource utilization in cold regions (Song et al., 2022). Therefore, research on seasonal freeze-thaw characteristics not only aids in deepening our understanding of natural geographical processes and ecosystem response mechanisms but also provides vital scientific basis and decision support for climate change monitoring, water resource management, engineering construction, and resource utilization (Zhu et al., 2024). Furthermore, the monitoring site was located in Jagdaqi (southern part of Da Xing’anling Mountains), situated in the transitional zone between high-latitude permafrost and seasonal frozen ground. The region’s climate characteristics and freeze-thaw cycles, as evidenced by observational data, provide reliable verification conditions for climate models and permafrost mapping, thereby enhancing their accuracy and applicability.
In meteorological research for the Da Xing’anling region, Zhang et al. (2018) analyzed trends in precipitation and temperature changes across the area up to 2014 using field data. Xu et al. (2022) focused on the characteristics of extreme cold weather in the region. Wan et al. (2014) examined the meteorological features of the Jagdaqi area, exploring the relationships between local temperature, ground temperature, precipitation, and evaporation. Zhang et al. (2010) discussed long-term climate change patterns in Jagdaqi based on data from 1967 to 2005. It is evident that research on the climate of Jagdaqi in the Da Xing’anling Mountains is relatively sparse, with existing studies relying on older data and no recent reports on meteorological characteristics from the past decade. The absence of up-to-date data introduces significant uncertainty in assessing Jagdaqi’s capacity to adapt to climate change and in developing future climate prediction models. The lack of recent data impedes the accurate simulation of changes in temperature, precipitation, and their impacts on permafrost and ecosystems. Additionally, research on frozen soil in the Da Xing’anling area has predominantly concentrated on permafrost distribution (Wei et al., 2011; Ran et al., 2012), degradation processes and responses to climate change (He et al., 2009; Jin et al., 2007; Wei et al., 2008; Chang et al., 2013), and the impacts of engineering activities (Cao et al., 2023; Cao et al., 2024; Jin et al., 2010). There is a notable absence of objective reports on the development of seasonal freeze depth and the quantification of maximum freezing depth in this region.
Given this, this study is based on in-situ monitoring data, with a focus on describing the patterns of temperature, precipitation, humidity, and wind in the Jagdaqi area from 2022 to 2023. It also involves a quantitative analysis of the seasonal freezing and thawing development process of the soil and the distribution characteristics of maximum freezing depth in this region. The research results can directly support the drawing of regional maps, validate simulation models, guide regional ecological protection, resource management, and engineering construction, and provide a scientific basis for government formulation of regional development plans and policies.
2 Materials and methods
2.1 Study area
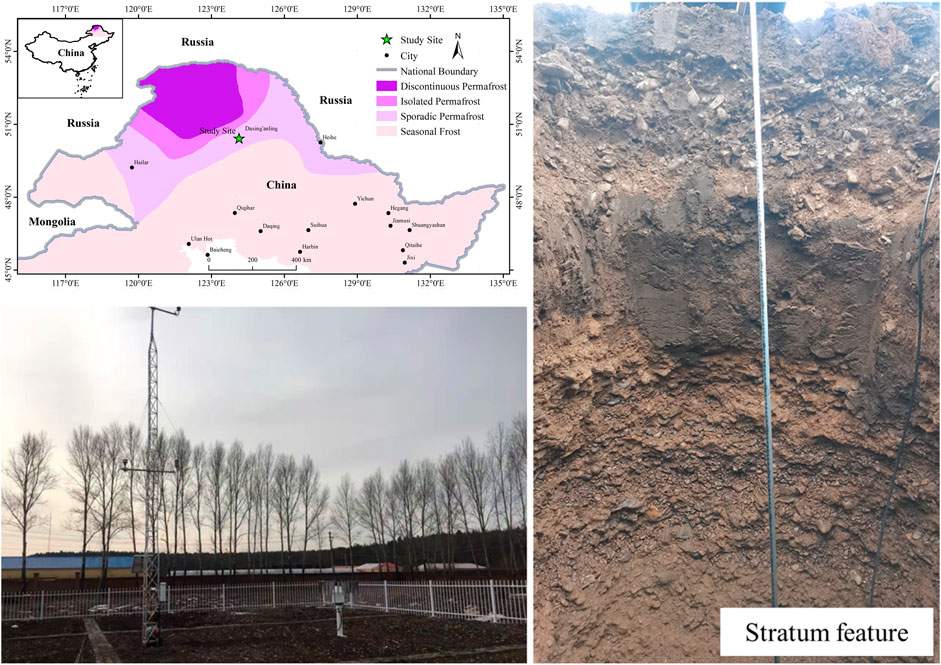
The research area is located in Jagdaqi District, Da Xing’anling, Heilongjiang Province, China. It is situated on the southeast slope of the Da Xing’anling Mountains at an elevation of approximately 387 m. The coordinates of the area are 50°22′29″N, 124°6′27″E, as shown in Figure 1. The terrain is generally flat with gentle undulations, characteristic of a low mountain and hilly region. The vegetation in the Jagdaqi District belongs to the cold temperate coniferous forest zone of the Da Xing’anling Mountains (Tian et al., 2009). Due to the climatic conditions, the region has a relatively sparse variety of plant species, predominantly of the Dahurian flora (Jia et al., 2021). The research area is located in the permafrost and seasonal frost transition zone and experiences a winter season from September to May of the following year (Jin et al., 2007). The frost-free period ranges from 85 to 130 days, and the climate is classified as a cold temperate continental monsoon climate with distinct seasons, characterized by long, cold winters and short summers. The stratum within a depth range of 2 m consists of loamy soil, clay, and gravel.
2.2 Data and methods
Field monitoring parameters include air temperature, humidity, wind speed and direction, precipitation, soil moisture and temperature. A 10-meter-high meteorological tower was installed at the monitoring site, with sensors for air temperature, humidity, wind speed, and direction placed at heights of 5 m and 10 m, respectively. The air temperature and humidity are measured using the HMP155A sensor, which is equipped with a radiation shield for outdoor installation. Wind direction and speed are monitored using the WindSonic sensor, while precipitation is measured with a T-200 series precipitation gauge. Soil temperature and volumetric water content (VWC) at depths of 0.2, 0.4, 0.6, 0.8, 1, 1.5, and 2 m in the active layer are measured using CS655 sensors. The data is collected by a CR1000X data logger at a 10-minute sampling interval. The data acquisition system is powered by solar panels and batteries, with data collection conducted through remote transmission.
3 Result and analysis
3.1 Meteorological characteristics
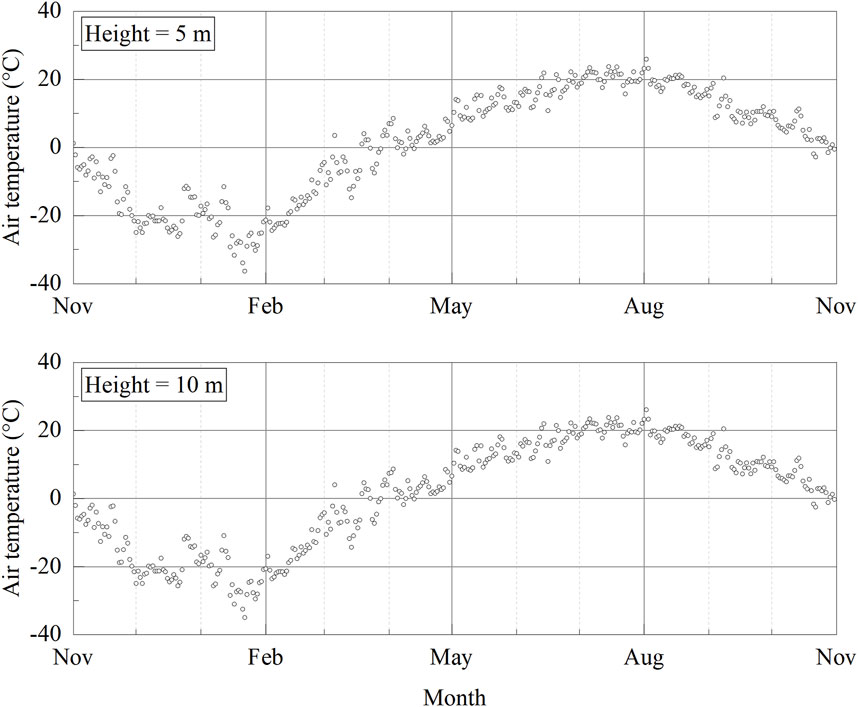
Figure 2 shows the variation of daily average temperature from November 2022 to November 2023. The average annual temperatures at heights of 5 m and 10 m are 1.04°C and 1.36°C, respectively, with the highest annual temperatures reaching 25.93°C and 26.09°C, and the lowest annual temperatures dropping to −36.35°C and −34.95°C. Compared to the average annual temperature during 2001–2005 (0.15°C–0.6°C) (Zhang et al., 2010), the temperature in this region has significantly increased over the past 17 years. January is the coldest month, with an average temperature of −24.25°C, while July is the warmest month, with an average temperature of 20.64°C. There are 189 days with temperatures equal to or lower than 5°C. Therefore, the study area belongs to a severe cold region (Qin et al., 2016). The warm months (with temperatures exceeding 10°C) are from May to September, with average temperatures of 3.18°C in April and 4.38°C in October. The air-freezing index and air-thawing index are the cumulative sums of degree-days below and above 0°C, respectively, over the course of a year. In this region, the air-freezing index is −2318.95 °Cd, and the air-thawing index is 2698.52°Cd. The results of air temperature monitoring can offer valuable insights for assessing climate change, planning agricultural production, and guiding infrastructure development.
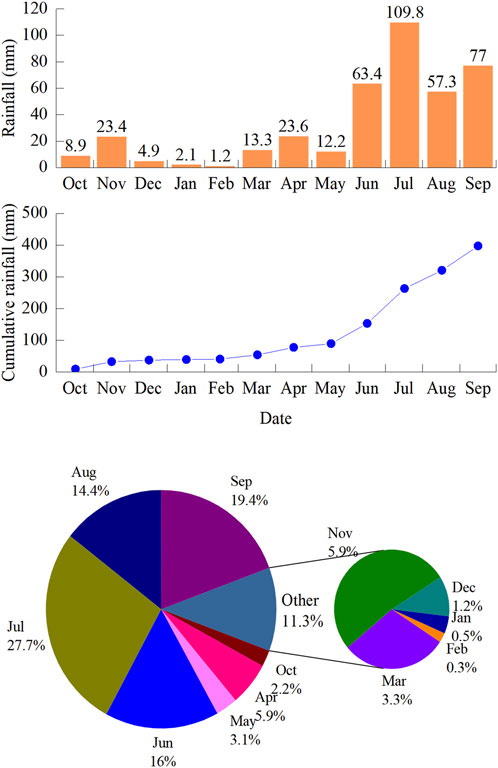
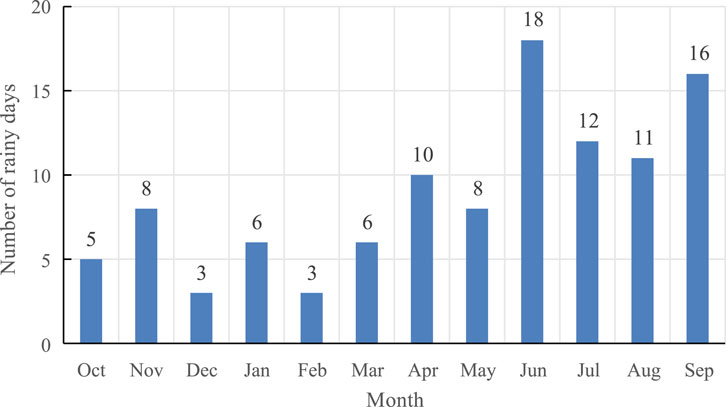
Figure 3 shows the precipitation from October 2022 to September 2023. The total precipitation from October 2022 to September 2023 is 397.1 mm. The distribution of precipitation shows that the highest rainfall occurs in July, with 109.8 mm, and the total rainfall from June to September is 307.5 mm, accounting for approximately 77.4% of the annual precipitation. Winter has lower precipitation, with a total of 44.9 mm from November to March, accounting for 11.3% of the annual rainfall, with only 1.2 mm in February. In the months of frequent temperature fluctuations, October and April, the precipitation is 8.9 mm and 23.6 mm, respectively. On the other hand, the annual rainfall days are 106, with a total of 57 days from June to September, accounting for 53.77% of the annual rainfall days (Figure 4). In addition, the maximum rainfall days in June is 18, while both December and February have the least rainfall days of 3. In terms of rainfall levels, there are only 3 days throughout the year with heavy rainfall, 6 days with moderate rainfall, and the rest are light rainfall. The maximum single-day rainfall occurred on July 10th, with a 24-hour cumulative rainfall of 46.1 mm. The above monitoring results can provide guidance for local water resource utilization, flood prevention, and disaster mitigation.
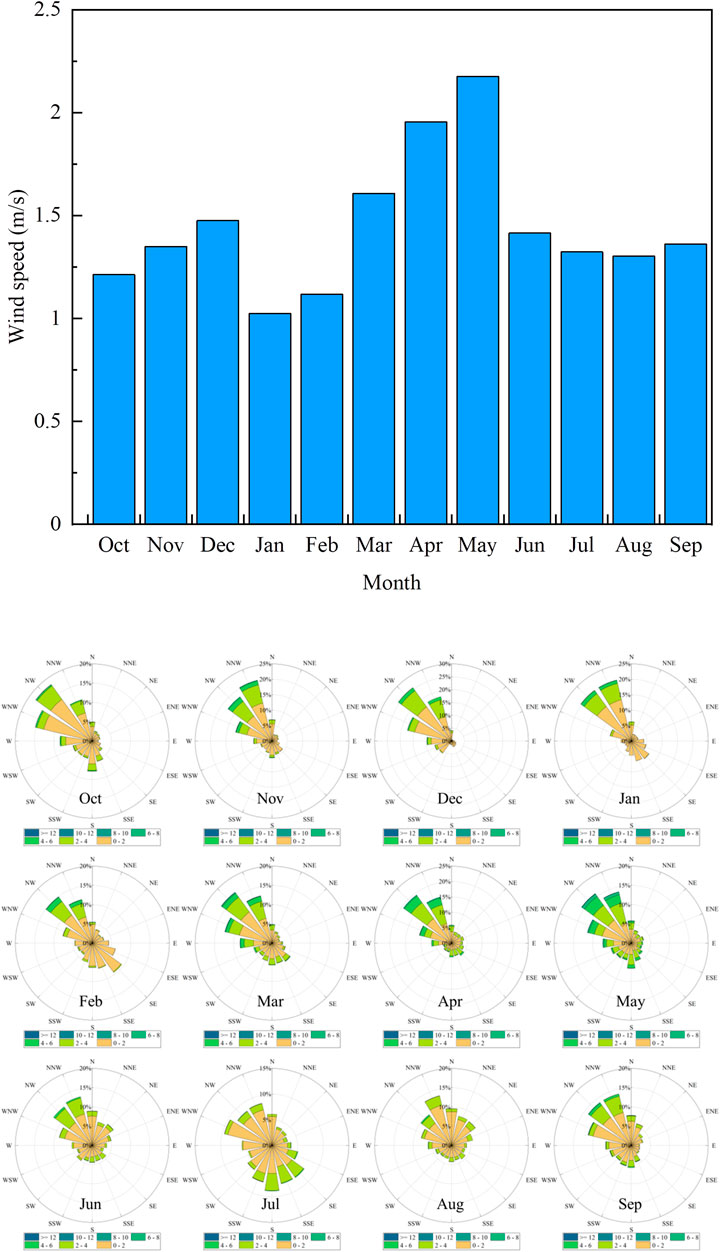
Figure 5 shows the wind speed and wind direction from October 2022 to September 2023. The northwest wind direction was the prevailing wind direction, and this wind direction frequency accounts for approximately 47% of the total annual wind direction frequency. The annual wind speed ranges from 0.045 to 10.33 m/s, with an average speed of 1.51 m/s, falling into the low wind speed category. Most of the time, the wind speed is between 0 and 4 m/s, accounting for 95% of the time. In terms of wind speed distribution, the average wind speed is highest in May at 2.18 m/s, and lowest in January at only 1.12 m/s. In terms of the trend, the average wind speed gradually increases from January to May. From June to September, the wind speed remains relatively stable, averaging between 1.3 and 1.42 m/s. The results of wind speed and wind direction monitoring can guide energy development and air quality assessment in the region.
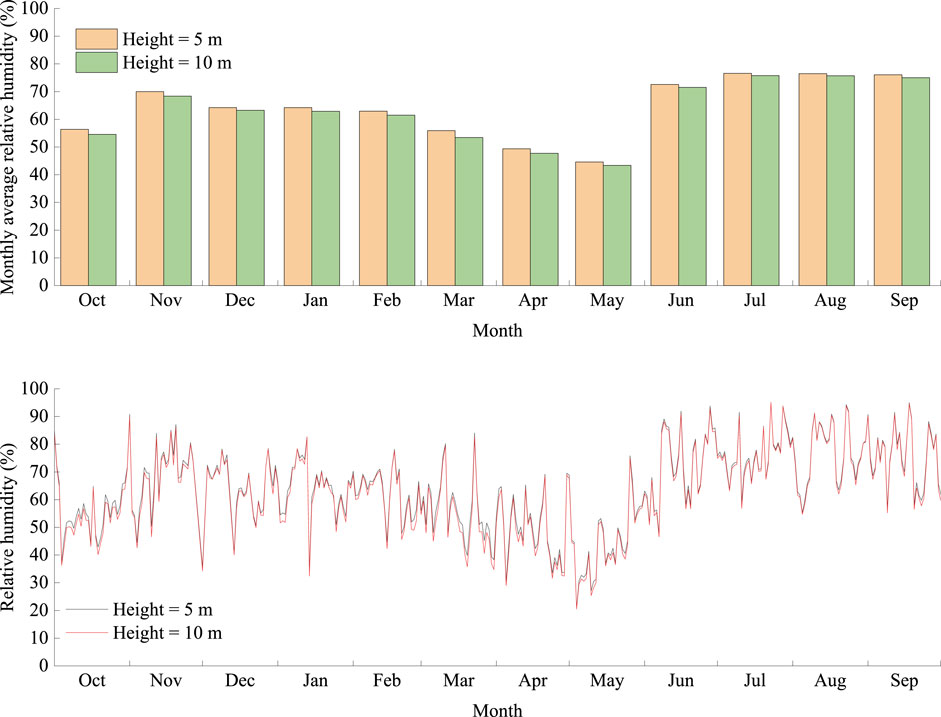
Figure 6 illustrates the relative humidity (RH) variations from October 2022 to September 2023. During this period, the average relative humidity at 5 m and 10 m heights was 63.49% and 62.1%, respectively. Notably, the average RH between June and September was higher, fluctuating between 71.54% and 76.6%. It is important to highlight that from January to May, there was a clear negative correlation between relative humidity and wind speed, with RH progressively decreasing as wind speed increased. The lowest RH values at both heights were recorded in May, with 44.58% at 5 m and 43.38% at 10 m. This could be attributed to the low precipitation levels, dominated by solid-state precipitation, along with a significant decrease in vegetation transpiration during this period. Under such conditions, the increase in wind speed likely enhanced air convection and mixing, facilitating the quicker diffusion and evaporation of water vapor, thereby reducing the relative humidity. Additionally, in October, during frequent temperature fluctuations, the RH at 5 m and 10 m was 56.41% and 54.57%, respectively. These monitoring results can offer valuable guidance for agricultural production and improving the freeze-thaw durability of buildings in cold regions.
3.2 Freeze-thaw process
The research area is located in a seasonally frozen ground zone, and Figure 7 illustrates the seasonal freeze-thaw process within a 2-meter depth range. Firstly, it can be observed that the maximum seasonal freezing depth during the monitoring period was 1.93–1.99 m, signified by middle-thick seasonally frozen ground. In terms of the development of the freezing depth, as winter progressed, the freezing of the 0.2-meter layer began on November 5th, and the freezing depth gradually increased, reaching its maximum in early March, and then gradually decreased. From the 0°C isotherm line, it can be seen that the seasonally frozen ground starts to thaw from both the top and bottom directions, and completely melts on May 5th. Therefore, the process of frozen depth development in the region at depths of 0.2–2 m lasts approximately 4 months, with the melting development process lasting 2 months. In the warm season, at a depth of 2 m, the soil temperature is above 12°C for about 2.5 months, above 8°C for 5 months, and the 16°C isotherm can extend to a depth below 1.4 m. Regarding the soil temperature at a depth of 0.2 m, the shallow soil layer is warmer from June to August, with approximately 2 months of soil temperature above 20°C.
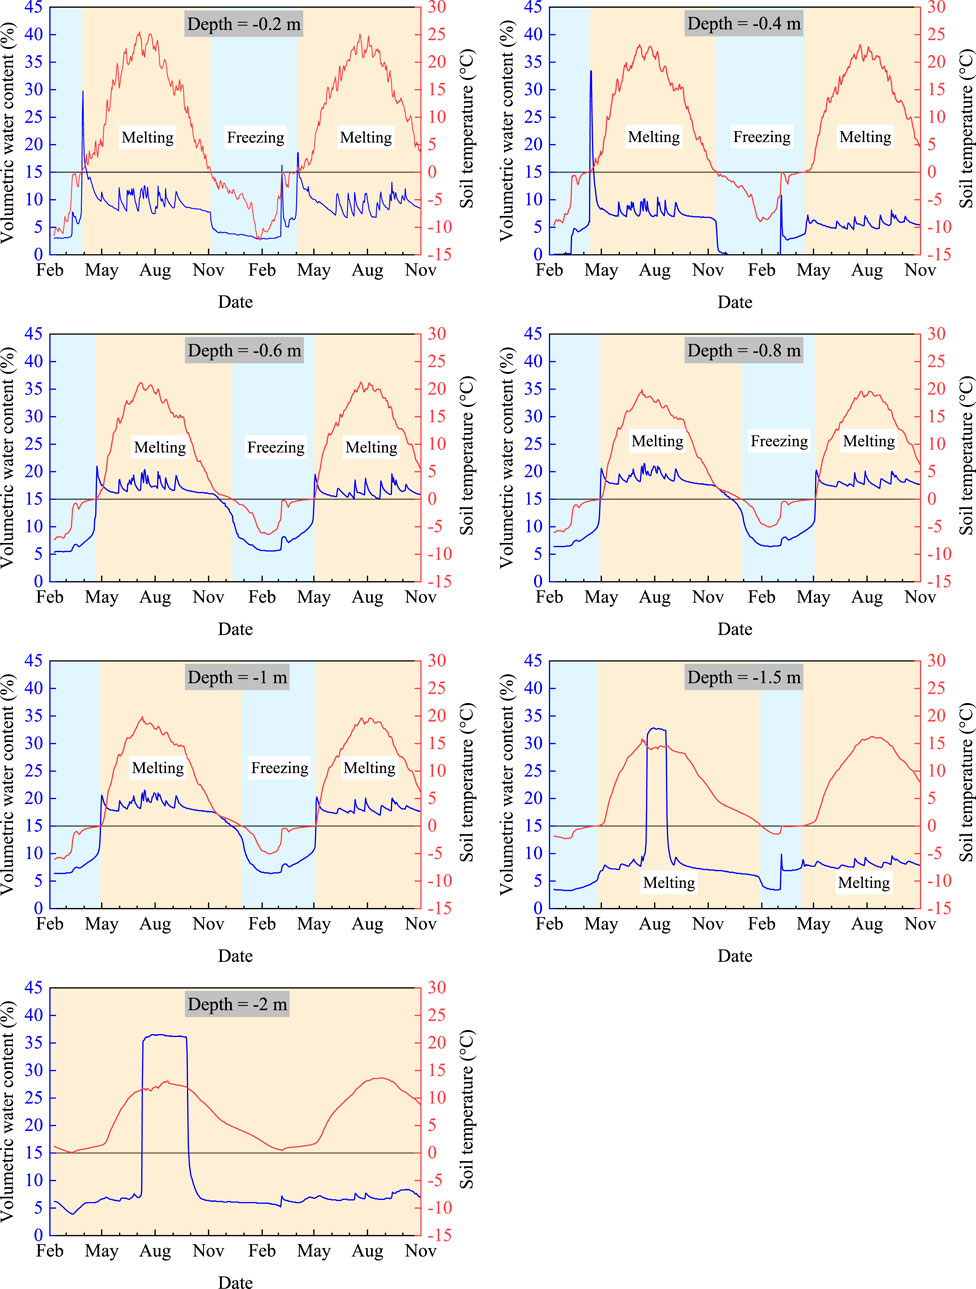
Figure 8 shows the variation of soil moisture and temperature from February 2022 to October 2023. The annual average ground temperature in the depth range of 0.2–2 m is between 6.22°C and 6.6°C, as indicated in the graph. Due to differences in depth, there are significant variations in ground temperature fluctuation characteristics across different layers. The fluctuation amplitudes of ground temperature for seven layers are 37.44, 32.19, 27.65, 24.7, 22.86, 17.73, and 13.21°C respectively. Among them, the average ground temperature in the 0.2–0.6 m soil layer during the months of May to September ranges from 15.29°C to 17.51°C. In terms of freezing duration, the freezing duration at a depth of 0.4 m is 147 days, whereas at a depth of 1.5 m, it decreases to 62 days. During the freezing development period, the freezing depth development rate ranges from 0.74 to 2.22 cm/day, with slower freezing rates observed in the 0.4–0.6 m soil layer. As temperatures drop during the freezing period, soil moisture content declines significantly as water transforms from a molecular to a crystalline ice structure. In the early stages of thawing, the moisture content in the shallow soil layers rises sharply, likely due to the infiltration of surface snowmelt, resulting in a supersaturated condition in the shallow layer.
Seasonal freeze-thaw variations in the ground are indicators of climate change, influenced by soil temperature states and moisture distribution (Luo et al., 2020). Human activities can significantly alter these seasonal freeze-thaw processes, such as changes in land use, construction activities, greenhouse gas emissions, and pollutant releases (Shiklomanov et al., 2017). Specifically, activities like farmland reclamation, grazing, and urbanization modify land use patterns, which in turn affects the type and thickness of surface cover. This change impacts the heat transfer processes at the surface, thereby altering the depth and timing of seasonal freeze-thaw cycles. Infrastructure development in cold regions (such as roads, buildings, and pipelines) alters the thermodynamic properties of the soil (Jin et al., 2023). Human-induced greenhouse gas emissions are a major driver of global warming, which directly affects seasonal freeze-thaw characteristics, leading to shorter freezing periods and increased frequency of freeze-thaw events. Pollutants generated by industrial activities and transportation, such as dust and black carbon, settle on snow or ice surfaces, reducing their albedo and accelerating melting, thereby impacting the thermal balance of permafrost regions (Jin et al., 2024). Overall, human activities change the characteristics of seasonal freeze-thaw through both direct and indirect means.
4 Conclusion
To investigate the meteorological characteristics and features of seasonally frozen soil in the southern part of the Da Xing’anling Mountains, based on the meteorological and ground temperature data from 2022 to 2023, the following conclusions were drawn:
1. The annual average air temperature at 5 m above ground is 1.04°C. The air-freezing index and air-thawing index are −2318.95°Cd and 2698.52°Cd, respectively, indicating a region of severe cold.
2. The total annual precipitation is 397.1 mm, with 77.4% occurring in summer and only 11.3% in winter.
3. Northwestern winds dominate, accounting for approximately 47% of the total annual wind frequency. Wind speeds range from 0.045 to 10.33 m per second, with an annual average of 1.51 m per second.
4. The annual average relative humidity at 5 m and 10 m above ground is 63.49% and 62.1%, respectively, reaching their lowest points in May at 44.58% and 43.38%.
5. The study area is located within a region of seasonally frozen ground. The maximum frost depth occurs in mid to late March, with seasonal frost depths ranging between 1.93 and 1.99 m, classifying it as moderately thick seasonally frozen ground.
Data availability statement
The original contributions presented in the study are included in the article/Supplementary Material, further inquiries can be directed to the corresponding authors.
Author contributions
YS: Conceptualization, Data curation, Formal Analysis, Investigation, Methodology, Resources, Validation, Writing–original draft, Writing–review and editing. YC: Data curation, Formal Analysis, Investigation, Methodology, Software, Writing–original draft. GL: Methodology, Project administration, Resources, Supervision, Writing–review and editing. KG: Methodology, Writing–review and editing, Project administration, Resources, Supervision. HZ: Funding acquisition, Supervision, Writing–review and editing. JS: Software, Validation, Visualization, Writing–review and editing. DC: Validation, Visualization, Writing–review and editing. JL: Validation, Visualization, Writing–review and editing.
Funding
The author(s) declare that financial support was received for the research, authorship, and/or publication of this article.
Conflict of interest
Authors HZ and JS were employed by State Grid Heilongjiang Electric Power Company Limited.
The remaining authors declare that the research was conducted in the absence of any commercial or financial relationships that could be construed as a potential conflict of interest.
The reviewer CH declared a shared affiliation with the authors YS, YC, GL, KG, DC, JL to the handling editor at time of review.
The authors declare that this study received funding from the Science and Technology Project of State Grid Corporation of China (Grant No. 5200-202230098A-1-1-ZN). The funder had the following involvement in the study: the study design and the decision to submit it for publication.
Publisher’s note
All claims expressed in this article are solely those of the authors and do not necessarily represent those of their affiliated organizations, or those of the publisher, the editors and the reviewers. Any product that may be evaluated in this article, or claim that may be made by its manufacturer, is not guaranteed or endorsed by the publisher.
Supplementary material
The Supplementary Material for this article can be found online at: https://www.frontiersin.org/articles/10.3389/feart.2024.1476234/full#supplementary-material
References
Cao, Y., Li, G. Y., Ma, W., Chen, D., Shang, Y., Wu, G., et al. (2023). Permafrost degradation induced by warm-oil pipelines and analytical results of thermosyphon-based thawing mitigation. Energy 269, 126836. doi:10.1016/j.energy.2023.126836
Cao, Y. P., Ma, W., Li, G. Y., Gao, K., Li, C., Chen, D., et al. (2024). Rapid permafrost thaw under buried oil pipeline and effective solution using a novel mitigative technique based on field and laboratory results. Cold Reg. Sci. Technol. 219, 104119. doi:10.1016/j.coldregions.2023.104119
Chang, X. L., Jin, H. J., He, R. X., Jing, H. Y., Li, G. Y., Wang, Y. P., et al. (2013). Review of permafrost monitoring in the northern da hinggan mountains, northeast China. J. Glaciol. Geocryol. 35 (1), 93–100. doi:10.7522/j.issn.1000-0240.2013.0011
Chen, X. K., and Zhou, Z. H. (2023). Deposit types, metallogenesis and resource prospect of Li-Be-Nb-Ta deposits in the Great Xing'an Range. Acta Petrol. Sin. 39 (7), 1973–1991. doi:10.18654/1000-0569/2023.07.06
Chen, Y. N., Deng, H. J., Li, Z., and Xu, C. C. (2014). Abrupt change of temperature and precipitation extremes in the arid region of Northwest China. Quatern. Int. 336, 35–43. doi:10.1016/j.quaint.2013.12.057
Fan, M. S., Xin, Z. H., Ye, L., Song, C. C., Wang, Y., and Guo, Y. D. (2023). Changes in soil freeze depth in response to climatic factors in the high-latitude regions of northeast China. Sustainability 15, 6661. doi:10.3390/su15086661
Gao, Z. Y., Niu, F. J., Lin, Z. J., Luo, J., Yin, G. A., and Wang, Y. B. (2018). Evaluation of thermokarst lake water balance in the Qinghai-Tibet Plateau via isotope tracers. Sci. Total. Environ. 636, 1–11. doi:10.1016/j.scitotenv.2018.04.103
Gao, Z. Y., Niu, F. J., Wang, Y. B., Lin, Z. J., and Wang, W. (2020). Suprapermafrost groundwater flow and exchange around a thermokarst lake on the Qinghai–Tibet Plateau, China. J. Hydrol. 593, 125882. doi:10.1016/j.jhydrol.2020.125882
Guo, D. X., and Li, Z. F. (1981). Preliminary approach to the history and age of permafrost in Northeast China. J. Glaciol. Geocryol. 3, 1–16. doi:10.7522/j.issn.1000-0240.1981.0053
He, R. X., Jin, H. J., Chang, X. L., Lv, L. Z., Yu, S. P., Yang, S. Z., et al. (2009). Degradation of permafrost in the northern part of northeastern China: present state and causal analysis. J. Glaciol. Geocryol. 31, 829–834. doi:10.7522/j.issn.1000-0240.2009.0114
Jia, B. R., Sun, H. R., Shugart, H. H., Xu, Z. Z., Zhang, P., and Zhou, G. S. (2021). Growth variations of Dahurian larch plantations across northeast China: understanding the effects of temperature and precipitation. J. Environ. Manag. 292, 112739. doi:10.1016/j.jenvman.2021.112739
Jiang, R. Q., Bai, X. F., Wang, X. H., Hou, R. J., Liu, X. C., and Yang, H. B. (2024). Effects of freeze–thaw cycles and the prefreezing water content on the soil pore size distribution. Water 16, 2040. doi:10.3390/w16142040
Jin, H. J., Hao, J. Q., Chang, X. L., Zhang, J. M., Yu, Q. H., Qi, J. L., et al. (2010). Zonation and assessment of frozen-ground conditions for engineering geology along the China–Russia crude oil pipeline route from Mo'he to Daqing, Northeastern China. Cold Reg. Sci. Technol. 64, 213–225. doi:10.1016/j.coldregions.2009.12.003
Jin, H. J., Yu, Q. H., Lv, L. Z., Guo, D. X., He, R. X., Yu, S. P., et al. (2007). Degradation of permafrost in the Xing’anling Mountains, Northeastern China. Permafr. Periglac. Process. 18, 245–258. doi:10.1002/ppp.589
Jin, X. Y., Huang, S., Wang, H. W., Wang, W. H., Li, X. Y., He, R. X., et al. (2024). Quantifying the influencing factors of the thermal state of permafrost in Northeast China. Geoderma 449, 117003. doi:10.1016/j.geoderma.2024.117003
Jin, X. Y., Tang, J. J., Luo, D. L., Wang, Q. F., He, R. X., Serban, R.-D., et al. (2023). Impacts of national highway G214 on vegetation in the source area of yellow and yangtze rivers on the southern qinghai plateau, west China. Remote Sens. 15, 1547. doi:10.3390/rs15061547
Liu, Y., Zhang, Y. D., Yu, M., and Dai, C. L. (2024). Impacts of climate and land use/land cover change on water yield services in Heilongjiang Province. Water 16, 2113. doi:10.3390/w16152113
Luo, D. L., Jin, H. J., Jin, R., Yang, X. G., and Lv, L. Z. (2014). Spatiotemporal variations of climate warming in northern Northeast China as indicated by freezing and thawing indices. Quatern. Int. 349, 187–195. doi:10.1016/j.quaint.2014.06.064
Luo, S. Q., Wang, J. Y., Pomeroy, J. W., and Lv, S. H. (2020). Freeze–thaw changes of seasonally frozen ground on the Tibetan plateau from 1960 to 2014. J. Clim. 33, 9427–9446. doi:10.1175/jcli-d-19-0923.1
Qin, D. H., Yao, T. D., Ding, Y. J., and Ren, J. W. (2016). Glossary of cryospheric science. Beijing, China: China Meteorological Press.
Ran, Y. H., Li, X., Cheng, G. D., Zhang, T. J., Wu, Q. B., Jin, H. J., et al. (2012). Distribution of permafrost in China: an overview of existing permafrost maps. Permafr. Periglac. Process. 23, 322–333. doi:10.1002/ppp.1756
Shiklomanov, N. I., Streletskiy, D. A., Grebenets, V. I., and Suter, L. (2017). Conquering the permafrost: urban infrastructure development in Norilsk. Russia. Polar Geogr. 40, 273–290. doi:10.1080/1088937x.2017.1329237
Song, C. J., Dai, C. L., Wang, C., Yu, M., Gao, Y. Q., and Tu, W. M. (2022). Characteristic analysis of the spatio-temporal distribution of key variables of the soil freeze–thaw processes over Heilongjiang Province, China. Water 14, 2573. doi:10.3390/w14162573
Tian, X. R., Yin, L., Shu, L. F., and Wang, M. Y. (2009). Carbon emission from forest fires in Da Xing'anling region in 2005-2007. Chin. J. Appl. Ecol. 20 (12), 2877–2883.
Wan, L. P., Zhang, Y. Y., Li, H. T., Lu, Z. T., and You, H. Y. (2014). Analysis of the relationship between air temperature, ground temperature, and sunshine, precipitation, and evaporation in Jiagedaqi. Heilongjiang Meteorol. 31, 24–25. doi:10.14021/j.cnki.hljqx.2014.04.010
Wang, Y. B., Gao, Z. Y., Wen, J., Liu, G. H., Geng, D., and Li, X. B. (2014). Effect of a thermokarst lake on soil physical properties and infiltration processes in the permafrost region of the Qinghai-Tibet Plateau, China. Sci. China Earth Sci. 57, 2357–2365. doi:10.1007/s11430-014-4906-4
Wei, Z., Jin, H. J., Luo, C. X., Zhang, J. M., Lv, L. Z., Yang, S. Z., et al. (2008). Characteristics of atmospheric environmental changes of permafrost in northeastern China in 50 years. J. Lanzhou Univ. Nat. Sci. 44, 39–43. doi:10.13885/j.issn.0455-2059.2008.03.013
Wei, Z., Jin, H. J., Zhang, J. M., Yu, S. P., Han, X. J., Ji, Y. J., et al. (2011). Prediction of permafrost changes in Northeastern China under a changing climate. Sci. China. Earth. Sci. 54 (6), 924–935. doi:10.1007/s11430-010-4109-6
Xu, L. L., Kang, H. Y., Pan, M. X., Han, F. Q., Shen, Y. Z., Yu, W. B., et al. (2022). Characteristics analysis of extremely cold weather in the Da Xing’anling Mountains region. J. Glaciol. Geocryol. 44, 1748–1756. doi:10.7522/j.issn.1000-0240.2022.0362
Yasmeen, S., Wang, X., Zhao, H., Zhu, L., Yuan, D., Li, Z., et al. (2019). Contrasting climate-growth relationship between Larix gmelinii and Pinus sylvestris var. mongolica along a latitudinal gradient in Da xing’an Mountains, China. Dendrochronologia 58, 125645. doi:10.1016/j.dendro.2019.125645
Zhang, K. Y., Li, T. Q., Qu, Y. H., Gao, F., Lin, J. W., and Jiang, L. C. (2018). Analysis of precipitation and temperature change in the Da Xing’anling area. Forest. Eng 34, 8–14. doi:10.16270/j.cnki.slgc.2018.05.002
Zhang, S. Y., Xu, L. L., and Hou, W. F. (2010). Analysis of climate change characteristics in Jiagedaqi over the past 38 years. Heilongjiang Meteorol. 27, 14–19. doi:10.14021/j.cnki.hljqx.2010.01.003
Keywords: freeze-thaw characteristics, seasonally frozen soil, meteorology, Jagdaqi, Da Xing’anling Mountains
Citation: Shang Y, Cao Y, Li G, Gao K, Zhang H, Sheng J, Chen D and Lin J (2025) Characteristics of meteorology and freeze-thaw in high-latitude cold regions: a case study in Da Xing’anling, Northeast China (2022–2023). Front. Earth Sci. 12:1476234. doi: 10.3389/feart.2024.1476234
Received: 05 August 2024; Accepted: 24 December 2024;
Published: 17 January 2025.
Edited by:
Eric Josef Ribeiro Parteli, University of Duisburg-Essen, GermanyReviewed by:
Xiaoying Jin, Northeast Forestry University, ChinaChuntan Han, Chinese Academy of Sciences (CAS), China
Giribabu Dandabathula, Indian Space Research Organisation, India
Copyright © 2025 Shang, Cao, Li, Gao, Zhang, Sheng, Chen and Lin. This is an open-access article distributed under the terms of the Creative Commons Attribution License (CC BY). The use, distribution or reproduction in other forums is permitted, provided the original author(s) and the copyright owner(s) are credited and that the original publication in this journal is cited, in accordance with accepted academic practice. No use, distribution or reproduction is permitted which does not comply with these terms.
*Correspondence: Guoyu Li, Z3VveXVsaUBsemIuYWMuY24=; Kai Gao, Z2Fva2FpQG5pZWVyLmFjLmNu
 Yunhu Shang
 Yapeng Cao
 Guoyu Li
 Kai Gao
 Hang Zhang3
 Dun Chen