- 1School of Consturction Engineering, Zhengzhou Shengda University, Zhengzhou, Henan, China
- 2School of Engineering Economics, Henan Institute of Economics and Trade, Zhengzhou, Henan, China
- 3School of Engineering Management and Real Estate, Henan University of Economics and Law, Zhengzhou, Henan, China
- 4School of Civil & Architecture Engineering, Xian Technological University, Xian, Shanxi, China
The practical application of micropiles in landslide reinforcement and prevention advanced before theoretical research, significantly limiting their application and promotion. To determine the damage patterns and stress distribution of micropiles during sliding failure in reinforced shallow landslides, three sets of physical modeling tests were performed. These tests examined the stability of shallow soil slopes with and without micropiles, including single-row and three-row configurations. During the tests, the foot displacement of the landslide, the top displacement of the micropiles, and the strain within the micropiles were monitored throughout the loading process. Following the tests, the landslide was excavated to observe the damage patterns in the micropiles. The experimental results showed that the pile-soil composite structure formed by three rows of micropiles, together with the soil between them, significantly improved the stability of the landslide and demonstrated effective anti-sliding effects. The stress distribution curve of the micropile was inversely S-shaped, with the peak stress located near the sliding surface. Within the micropile group, the first row exhibited the highest stress, and the micropiles nearest to the free face experienced the greatest displacement. Through the micropile-reinforced landslide tests, we identified three stages in the slope’s sliding damage process and the stress distribution pattern of the micropiles. The research findings offer valuable insights into the anti-sliding mechanism of micropiles, which can guide design and construction.
1 Introduction
Micropiles typically have diameters less than 400 mm, slenderness ratios exceeding 30, and are constructed using drilling, robust reinforcement, and pressure grouting techniques (Khidri and Deng, 2021; Hong et al., 2022). Micropiles originated in the 1950s and were primarily employed for foundation reinforcement initially (Malik et al., 2021; Gupta and Chawla, 2022; Al-Dabagh and Al-Omari, 2024; Lee et al., 2024). Over time, as engineering experience accumulated, micropiles found applications in pit support, slope stabilization, foundation treatment, foundation replacement, and various other projects (Aboutabikh et al., 2020; Kong et al., 2020; Shah et al., 2021; Abdollahi and Ghanbari, 2022; Bernardes et al., 2022; Casagrande et al., 2022; Dastgerdi et al., 2023; Elsawwaf et al., 2023a; Elsawwaf et al., 2023b; Kamura et al., 2023).
With the advantages such as compact construction machinery, flexible pile layouts, rapid construction, minimal vibration, adaptability to diverse sites, and environmental friendliness, micropiles were well-suited for emergency management of small to medium landslides, causing the increasing attention in the field of geotechnical support engineering (Choi et al., 2020; Alizadeh et al., 2021; Bayesteh et al., 2021; Fiscina et al., 2021; Neto et al., 2022). Nevertheless, due to the limited history of micropile use in anti-slip engineering, research into the force mechanisms, failure patterns, and associated design theories of micropiles under horizontal loads in slope reinforcement engineering remains underdeveloped, highlighting a gap between theoretical research and practical applications (Borthakur and Dey, 2020; Fang et al., 2020; Khidri and Deng, 2021; Fang et al., 2023a; Fang et al., 2023b; Kamura et al., 2023; Pei et al., 2023; An et al., 2024; Fang et al., 2024; Khidri and Deng, 2024).
Currently, research on micropile reinforcement for landslides primarily consists of theoretical studies and numerical simulations, with fewer experimental investigations. Zeng and Xiao (2020) proposed a simplified theoretical method for slope stability analysis that calculated the net thrust on the sliding surface and the internal forces of micropile groups under the condition of a specific safety factor. Deng et al. (2017) simplified the failure patterns of micropiles and analyzed the stability of slopes reinforced with micropiles using the limit equilibrium method. Based on the contour map of the safety factor for slopes reinforced with a single row of micropiles, researchers can analyze slope stability and optimize the design parameters of anti-slide micropiles. Sun et al. (2013) developed an analytical model to determine the ultimate bearing capacity of micropiles, which calculated the displacement, shear force, and bending moment at any location along the micropile under specific conditions. Dastgerdi et al. (2023) used Plaxis software to study the effectiveness of micropiles in stabilizing landslides. The results showed that simply arranged micropiles could stabilize the slope with performance comparable to that of three rows of soil nails, which were low-cost and easy to implement. Yang et al. (2021) investigated the reinforcement effects of micropile groups under dynamic and static loads, as well as the damage patterns following slope destabilization with a predetermined sliding surface. The results indicated that the distribution of bending moments and axial forces in each row of micropiles differed under dynamic and static loads, and the degree of damage to the micropiles also varied. Pei et al. (2023) studied the reinforcement effect of micropiles on unstable, folded sliding surface slopes. The results indicated that the location of the potential sliding surface was influenced by the geometry of the bedrock, and the pile-top platform effectively reduced the displacement of the pile tops, thereby enhancing the anti-slip effect of the micropile-soil composite.
Addressing the scarcity of large-scale model tests for anti-slip micropiles, model experiments were conducted based on similarity theory to enhance understanding of the anti-slip mechanism and damage patterns within micropile-soil structures (Fang et al., 2023c). The experiments, utilizing graded loading, investigated damage patterns in slopes without piles and with single-row and three-row micropile reinforcement, analyzed trends in displacement at the slopes base and at the top of the micropiles during sliding, and examined stress changes and distributions within the micropiles. The studys findings hold significant implications for future research on anti-slip micropiles and for guiding engineering practices in design, construction, and monitoring.
2 Model experiment design
2.1 Test rationale and similarity ratio determination
The size and materials for the landslide model test were determined based on similarity theory. The similarity ratio was defined as the ratio of physical parameters between the prototype and the model test, as illustrated in Equation 1.
where i represents any physical parameter and subscripts p and m represent in situ and model tests, respectively.
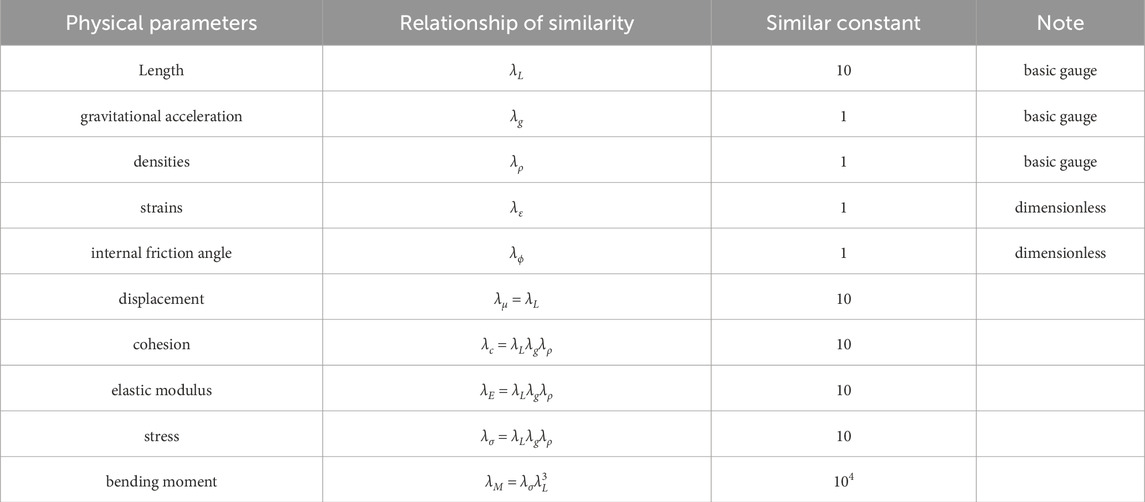
The main factors affecting landslides include the landslide materials, the sliding bed, and the physical and mechanical parameters of the anti-slip pile. These parameters are: ① geometric scale: Length (L); ② physical and mechanical properties: density (ρ), cohesion (c), internal friction angle (ψ), elasticity modulus (E), gravitational acceleration (g), stress (σ), strain (ε), and displacement (µ). There were nine parameters involved. Among them, L and µ have the same dimension, and c, E, and σ are identical quantities. Since the similarity ratios of dimensionless quantities (ψ and ε) were equal to l, and identical quantities share the same similarity ratios, only four sets of independent quantities remained among the nine parameters. In the [FLT] gauge system, L, ρ, and g were selected as the basic gauges. The relationships among the remaining physical parameters were derived from similarity theory, as shown in Table 1.
2.2 Experiment setup
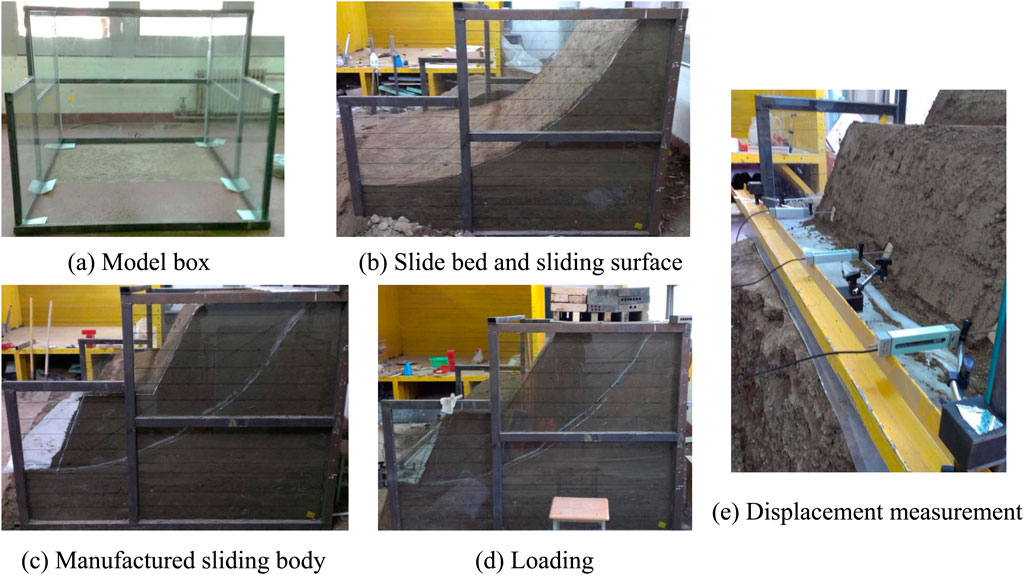
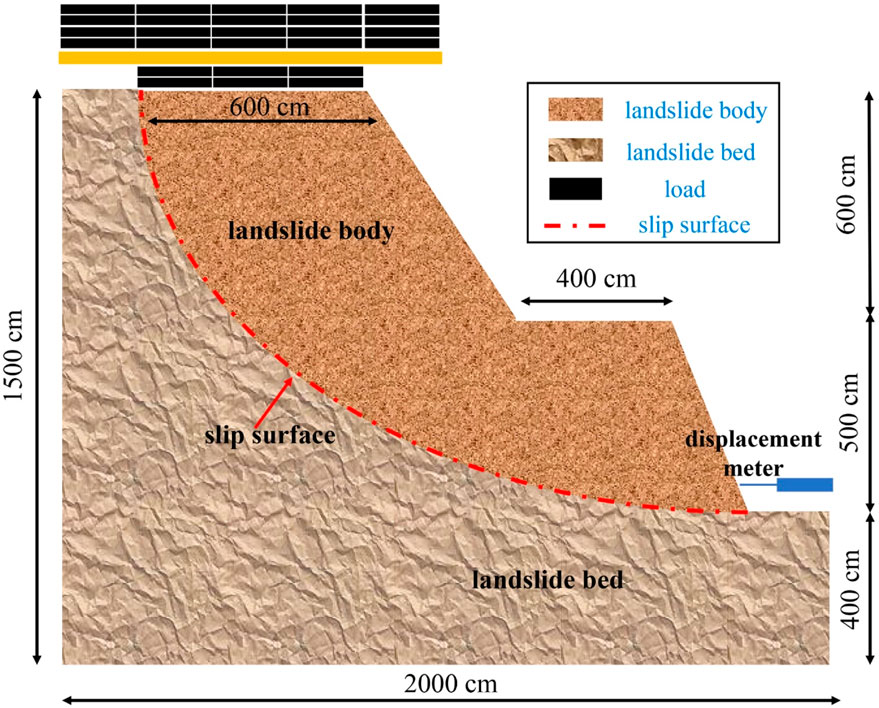
The frame model box used for the test had dimensions of 2.0 m × 1.8 m × 1.5 m (L × W × H). To ensure the strength and stability of the model test box, a cross-section size of 40 mm × 60 mm × 3 mm square steel was used as the skeleton, and horizontal supports were added around the frame model box (Figure 1A). The left and right sides of the model box were made of 10 mm thick tempered laminated glass to observe the landslide sliding process. The internal surface of the model box was uniformly coated with lubricant to minimize boundary friction and simulate infinite boundary conditions. Graded loading was applied by stacking materials at the top of the slope, using lead blocks in the lower layer and sandbags in the upper layer, as shown in Figures 1D, 2. Of course, if a pressure tester was available in the laboratory, it would be more convenient to use hydraulic servo loading.
2.3 Experiment material
2.3.1 Material of landslide
The soil used for the test was collected from the northern suburbs of Xian, Shanxi Province, China. The 2 mm sieve was used to filter out large clods of soil, gravel particles, and plant roots. After air-drying, the soil was mixed with water using a spray bottle until the water content reached approximately 16% to ensure its plasticity. The physical and mechanical parameters of the soil are shown in Table 2.
The sliding bed and sliding body were prepared using the layered tamping method. To ensure that the sliding bed had sufficient strength and stability for multiple repetitive tests, the soil was mixed with appropriate gravel. The sliding surface was designed as a circular arc, so it was necessary to shape the filled landslide. To ensure a sufficiently smooth sliding surface, an appropriate thickness of cement mortar was applied. Before filling the landslide, two layers of plastic sheeting were placed on the slip surface to reduce sliding resistance. The landslide was then filled above the slip surface. The design dry density of the landslide was 15 kN/m³. Before constructing the landslide model, a compaction test was conducted to determine the number of compactions needed to achieve this density (Figures 1B, C).
2.3.2 Material of micropile
Micropiles can be categorized into root piles, prefabricated piles, and grouted steel pipe piles based on their type and construction process. From the perspective of model testing, prefabricated piles were easier to operate and had more engineering applications, making them more convenient and quicker to construct. Consequently, hollow aluminum tubes were selected as the model materials for steel pipe precast piles in this study.
Strict similarity conditions must address geometrical, physical, and material similarities simultaneously. However, completely satisfying the similarity index was challenging, so only certain primary factors were considered, while secondary factors were ignored. In this test, the micropiles primarily bear lateral forces, so deformation characteristics were prioritized when selecting pile materials to ensure that relevant parameters, such as geometry and modulus of elasticity, meet the similarity requirements. The Chinese technical code for ground treatment of buildings (JGJ79-2012) stipulates that the section size of prefabricated steel pipe piles must be between 100 mm and 300 mm. If the similarity parameter was set too large, the model piles would have a small diameter and lack stiffness, making it difficult to satisfy bending stiffness requirements.
For example, consider the DN125 steel-pipe micropiles used in the actual project: the outer diameter (D) was 133 mm, the inner diameter (d) was 125 mm, the wall thickness was 4 mm, the length was 9 m, and the modulus of elasticity (E) was 210 GPa. The model test selected the soft alloy aluminum pipe as the pile material, with an outer diameter (D) of 12 mm, an inner diameter (d) of 8.4 mm, a wall thickness of 1.8 mm, a length of 90 mm, and a modulus of elasticity (E) of 22 GPa.
The similarity factors for length, mean diameter, and modulus of elasticity were 10, 12.6, and 9.5, respectively, indicating that a similarity parameter of 10 was more appropriate. The micropiles were pre-embedded in the landslide and placed on the horizontal platform, as shown in Figure 2.
2.4 Design of loading method
Vertical loads were applied in a graded manner at the top of the landslide during the test (Figure 1D). The loading area on the top of the landslide model measured 1.8 m wide and 0.6 m long in the direction of landslide sliding. To ensure uniform vertical loading on the top of the landslide model, a 1.8 m × 0.6 m × 30 mm wooden board was placed in the loading area. Loading materials included rectangular iron blocks, channel steel, and sandbags. Following each load level application, the static resistive strain analysis system recorded real-time test data including micropile strain, pile top displacement, and landslide foot displacement (Figure 1E). Once the landslide was significantly stabilized, additional load levels were applied until the landslide failed.
2.5 Experimental program
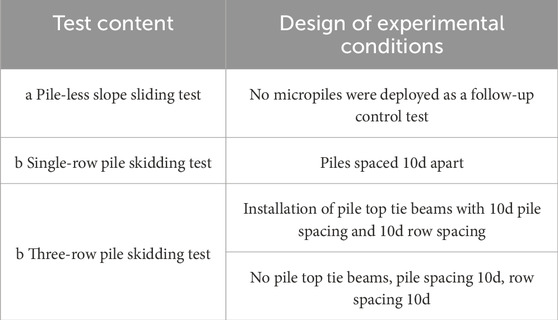
Prior to this test, a literature review was conducted to determine the suitable range of pile spacing for creating the soil arch effect, which enabling pile-soil stressed together (Fang et al., 2020; Fang et al., 2023c; Pei et al., 2023; Fang et al., 2024). The test was designed for three conditions: (a) Unpiled landslide failure test; (b) Single-row pile reinforced landslide test; and (c) Three-row pile reinforced landslide test, as illustrated in Table 3.
2.6 Modeling steps
(a) Micropile strain gauges affixed and wires soldered; (b) Sliding bed constructed; (c) Double-layer plastic film laid to simulate a smooth sliding surface; (d) Micropiles fixed and embedded; (e) Landslide model filled in layers; (f) Displacement sensors installed at designated locations.
2.7 Measuring system
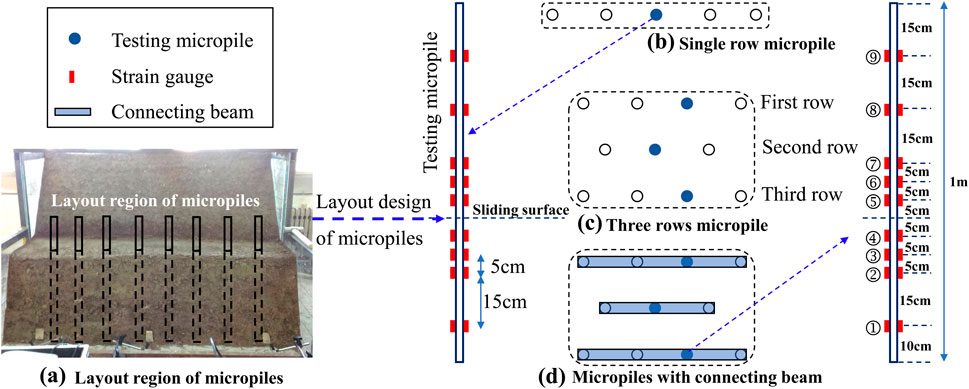
Experimental tests involved pile strains, pile top displacements, and landslide toe displacements (Figure 1E). The resistance displacement meter was YHD-100 (range 0–100 mm, accuracy 0.001 mm); the strain gauge was BF120-4AA (ultimate strain 2%, accuracy 0.05); and data collection utilized the CM-2B-64 static strain gauge measurement and analysis system (measurement range: ±19999με, measurement error: 0.3% of the measured value ± 2με). Sensor deployment locations are illustrated in Figure 3.
3 Results and discussion
3.1 Failure of pile-less landslide
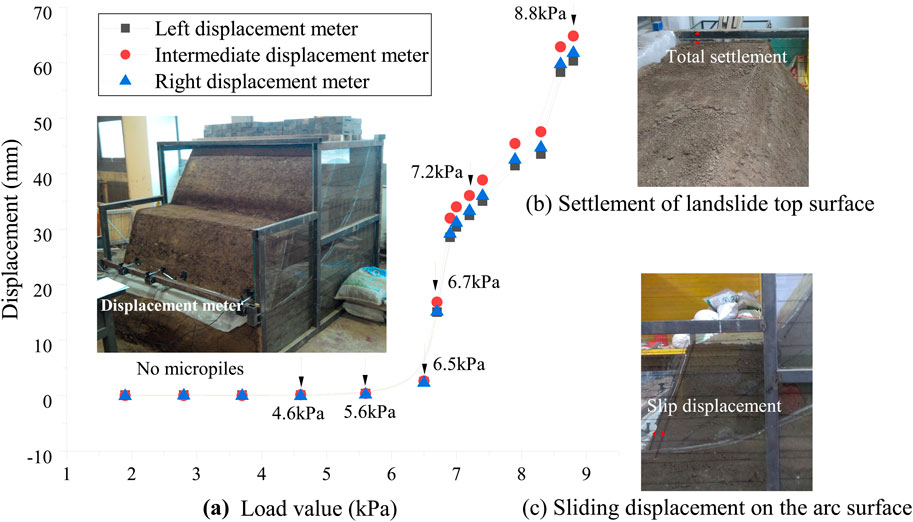
Figure 4A shows the displacement changes at the foot of the landslide at the shear exit of the model when no micropiles were deployed. The landslide slided forward along the preset slip zone when no micropiles were present. The three displacement curves measured at the left, middle, and right of the foot of the landslide were nearly identical, indicating that the boundary confinement effect on the contact surface between the landslide model and the lateral toughened glass had little impact on the landslides sliding behavior. At the beginning of loading, the displacement at each measurement point was small. When the pile load was 4.6 kPa, the average shear displacement at the three measurement points was only 0.3 mm. After increasing the load to 5.6 kPa, the displacement change rate at each point at the foot of the slope accelerated significantly, and when the landslide stabilized, the shear displacement reached 2.5 mm. With a further load increase to 6.5 kPa, the displacement change rate at each measurement point suddenly increased and did not stabilize, continuously rising. Subsequently, as the load increased to 6.7 kPa, 6.9 kPa, 7.0 kPa, and 7.2 kPa, the shear exit displacements continued to grow rapidly, despite each load increment being only about 3%. The average shear displacement corresponding to the load of 7.2 kPa was 33.9 mm. The final loading level before the experiment ended was 8.8 kPa, at which the shear displacement had reached 62.3 mm. Therefore, it can be concluded that the landslide model without micropiles was at the critical-slip limit equilibrium when loaded to 5.6 kPa. At this point, the displacement values of the three gauges at the foot of the slope were 0.35 mm, 0.38 mm, and 0.36 mm from left to right. When the load exceeded 7.0 kPa, the measurements from the middle gauge became progressively larger than those from the left and right gauges. This was due to the weaker lateral constraints in the middle region of the landslide.
Figures 4B, C show that, at the end of the test, removing the loads from the top of the landslide, the significant subsidence at the top and substantial shear-sliding displacement at the shear exit could be observed.
3.2 Displacement of pile top and foot of slope
Figure 5 shows the displacement variation of the landslide under different working conditions. The no-micropile landslide model monitored only the sliding displacement at the toe of the landslide; the single-row and three-row micropile model tests monitored the displacement of the toe of the landslide and the top of the micropiles. From an overall point of view, under different working conditions, with the increase of load, the landslide sliding damage existed in three stages: basic stabilization, gradual sliding, and continuous sliding.
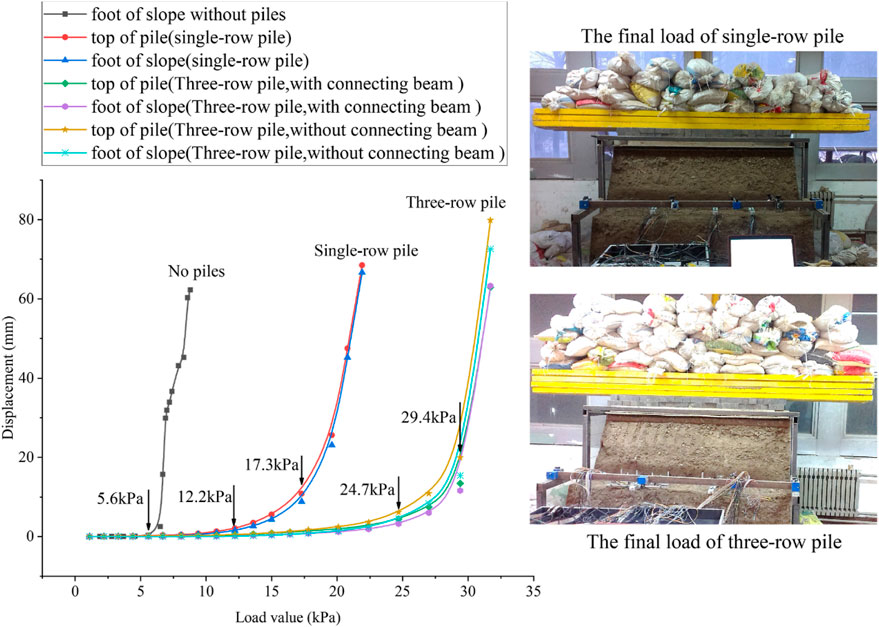
Figure 5. The changes of slope toe displacement and pile top displacement under different working conditions.
Stabilization stage corresponding to the load was small, the landslide was in a steady state, the sliding displacement of the landslide with the increase of the load change was very small; the landslide displacement in gradual sliding stage began to increase significantly, the sliding rate gradually increased; In the continuous sliding stage, with the further increase of the load, the sliding rate was basically maintained at a larger amount of value without growing anymore, and sliding displacement continued to increase rapidly.
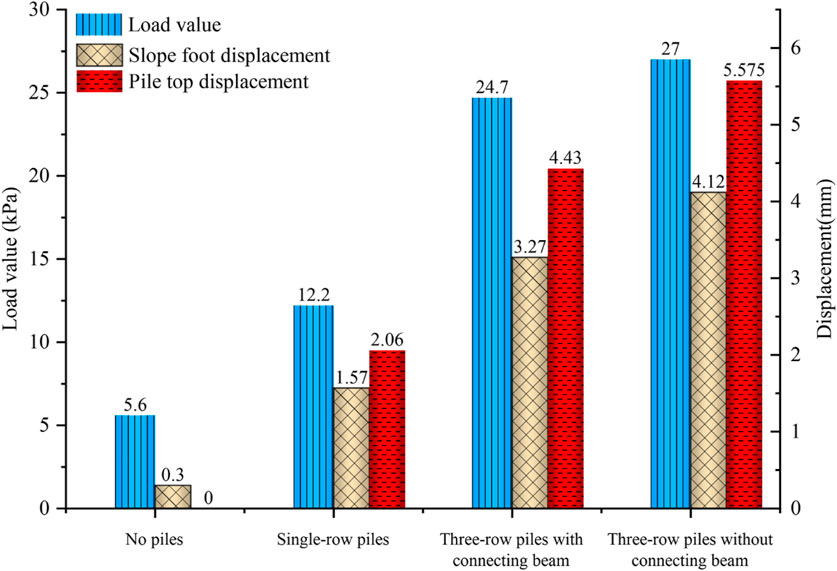
By analyzing the growth rate of displacement with loading, it could be seen that the sliding damage of the pile-less landslide had only one obvious mutation point, i.e., after loading up to 5.6 kPa, the landslide was no longer stabilized, and by continuing to apply the loading, the sliding displacement continued to grow at a large growth rate. There were two mutation change points in the displacement change curves of single-row and three-row piles. The first mutation point of the single row of piles corresponding to a load of 12.2 kPa, after which the rate of increase of the displacement increased continuously with the increase of the load, and the rate of increase of the load tended to stabilize after loading to 17.3 kPa, and the landslide entered into the stage of continuous sliding. For the three rows of piles, since both conditions with and without connecting beams were set in the same landslide, the corresponding two mutation points were basically the same for these two conditions, which were 24.7 kPa and 29.4 kPa, respectively. In fact, before the first mutation point corresponded to the stage of landslide stabilization, after the second mutation point corresponded to the stage of continuous landslide sliding, and between the two mutation points corresponded to the stage of progressive sliding with a gradual increase in the sliding rate. The load corresponding to the first mutation point increased by 117% and 341% in the single-row and three-row pile tests compared to the no-pile test, which showed that the micropiles could effectively improve the stability of the landslide.
As shown in Figure 6, the displacement of the foot of the landslide and the top of the pile when the load reached the first yield point under different working conditions. Both the single-row piles and the third-row (close to the critical surface) piles in the three-row micropiles had slightly larger displacements at the top of the piles compared to the foot of the landslide. The displacements of the foot and top of the three rows of piles with connecting beams were smaller than those without connecting beams, and the presence of connecting beamscould effectively reduce the sliding displacement of the landslide. Therefore, the stability of the landslide could be judged based on the displacement of the pile top in the actual project, and a more conservative and safe evaluation result could be obtained, in addition, the pile top also had the advantage of clear location and convenient monitoring. Dastgerdi et al. (2023) evaluated the performance of micropiles in stabilizing slopes using Plaxis software. They concluded that micropiles increased the factor of safety of landslides. Furthermore, it was observed that the safety coefficients of the three-dimensional model were 10% higher than those of the two-dimensional model.
3.3 Stress distribution of micropiles
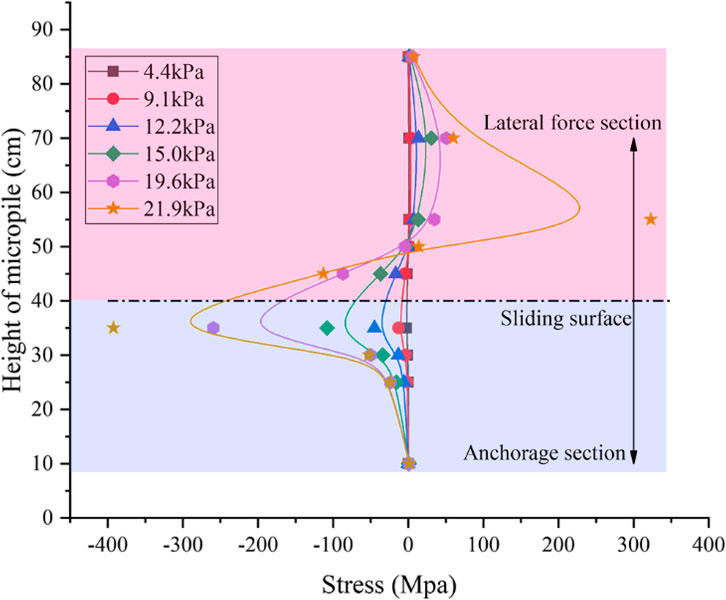
Figure 7 illustrates the stress distribution curves of the pile for different loading values under single-row conditions. The pile stress distribution curve exhibited an inverse S shape. Evidence of an inverse S-shaped distribution of pile stresses along the micropiles could also be found in the field monitoring data of micropile-reinforced landslide projects (Sun et al., 2013). When the loading was below the first yield point of 12.2 kPa, the sliding displacement analysis indicated that the system was in the stabilization stage, and the pile stress was relatively low. When the loading exceeded 12.2 kPa, the landslide entered the progressive destruction stage, and the pile stress near the sliding surface began to rise rapidly. The maximum positive stress in the pile within the landslide, where the micropile experiences lateral soil forces, occurs 15 cm above the sliding surface, while the maximum negative stress within the anchorage zone occurs 5 cm below it. Above the sliding surface, there are five strain gauges: gauges No. 5–7 were located 5 cm, 10 cm, and 15 cm away from the sliding surface, in the area where micropile deformation was concentrated and thus subjected to considerable force.
Strain gauges No. 8 and No. 9 were situated in the straight section of the micropile, experiencing a smaller force. Additionally, strain gauge No. 9 was located near the critical surface at the top of the landslide slope, where its stress approaches zero.
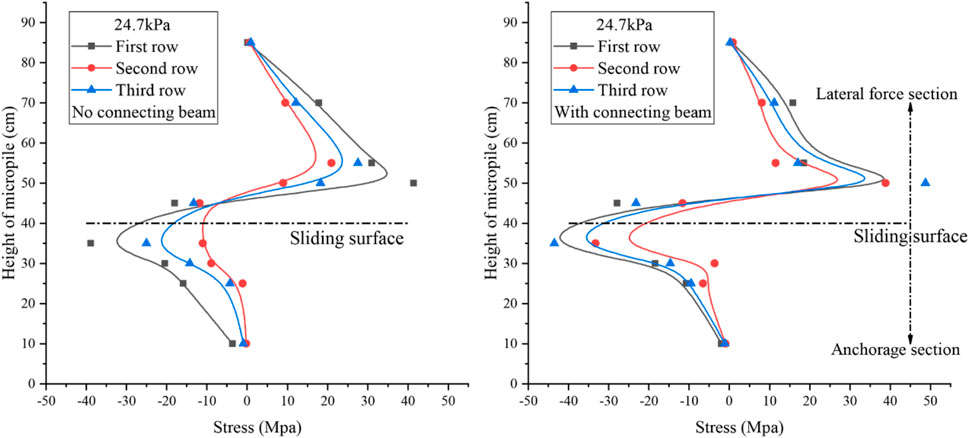
Figure 8 illustrates the stress distribution in the pile when loaded to the first yield point of 24.7 kPa in the three-row pile model test. The stress distribution in the pile also exhibits an inverse S shape; the maximum stress occurs near the sliding surface, and the maximum positive stress in the landslide is greater than the absolute value of the maximum negative stress in the anchorage zone. The first row of micropiles exhibited the highest stress values, followed by the third row, while the middle row had the lowest values. This occurred because the first row of piles was the first to bear the load, the third row was close to the critical surface, and the stresses in the middle row resulted from the downward thrust of the soil and the resistance offered by the third row. From the values of pile stresses, it could be seen that the maximum stress values of the three rows of piles with connecting beams were greater than those without connecting beams, which was due to the fact that the connecting beams could allow the micropiles to work together as a whole to exert higher load carrying capacity under the condition of smaller pile displacement.
3.4 Morphology of micropiles after destruction
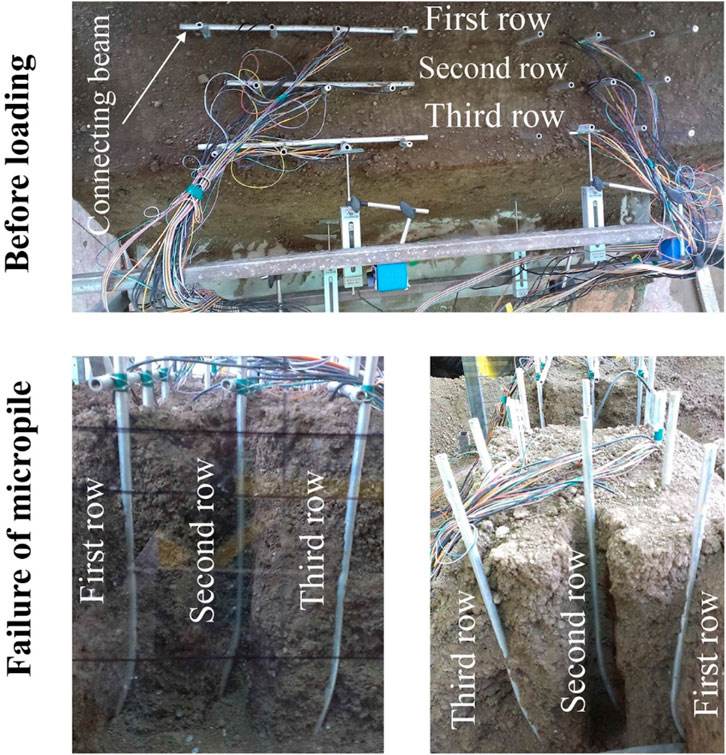
At the conclusion of the test, the landslide was excavated to observe the morphology of the destroyed micropiles. As depicted in Figure 9, along the direction of the landslide, only the micropiles near the sliding surface were bent; the remaining portions of the micropiles remained straight, with an overall forward tilt. The damage pattern of the micropiles was consistent with the findings of Yang et al. (2021). Under the restraining effect of the connecting beams, the inclination of the micropile group was less pronounced than without them. Without the connecting beams, the degree of pile inclination and top displacement were most pronounced in the third row adjacent to the critical face. Pei et al. (2023) used the pile top platform to restrain the displacement of the micropile groups in model experiments. Their test results showed that the platform limited 75% of the pile top displacement of the micropile groups. It could be seen that restraining the top of the micropiles was advantageous for reducing horizontal displacement.
The brief and essential information in the test was summarized in Figure 10, which was convenient to compare with similar existing experimental settings and results.
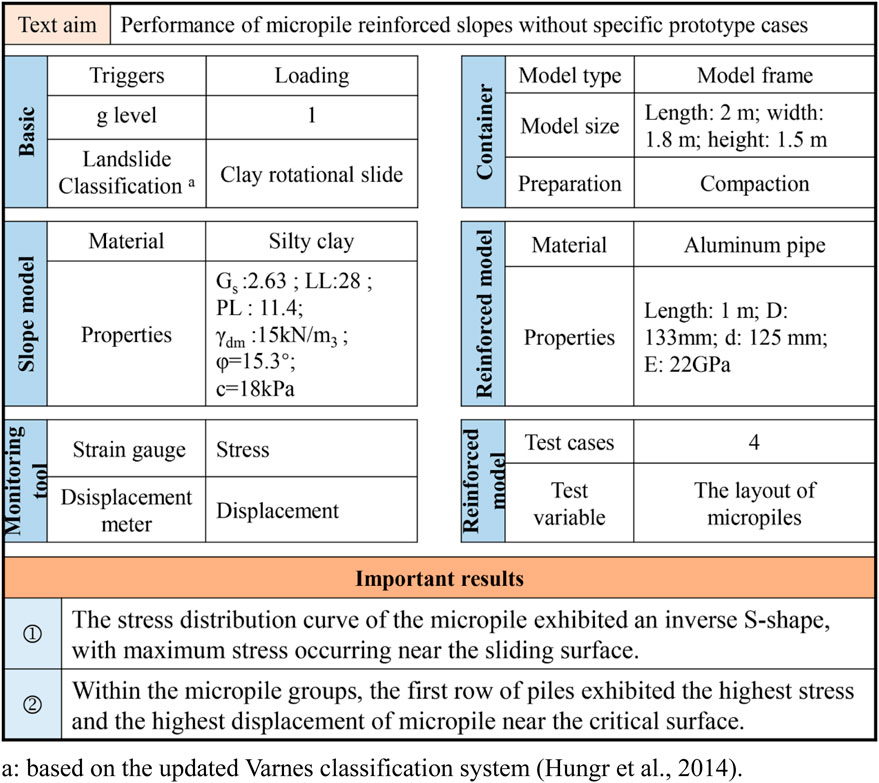
Figure 10. Summarized protocol for the physical model test. a: based on the updated Varnes classification system (Hungr et al., 2014).
3.5 Further work
Although the width of the model test box had reached 1.8 m, we found that the displacement in the middle of the landslide was slightly larger than on the left and right sides. It could be seen that the frictional resistance between the landslide soil and the glass plate on the side of the model box limited the sliding deformation in the contact area. Therefore, we arranged all the test piles in the middle of the landslide to weaken the effect of boundary friction constraints. In fact, if the restraining effects of the boundaries in the test were considered, the slip resistance of the micropiles needed to be appropriately discounted. The landslides in the test had the same dry density, and the soil was more homogeneous, which was not in harmony with the inhomogeneity of natural soil. Additionally, this indoor test did not take into account the effect of changes in natural environmental conditions.
In the next study, we would focus on the anti-slip effects of micropile groups and their reasonable deployment under various parameters, including the inclination angle of micropiles, pile spacing, row spacing, anchoring depth, and others. This would be analyzed under natural environmental conditions such as soil type, rainfall infiltration, and wet/dry cycles, to provide references and guidance for the application of micropiles in anti-slip engineering on site.
In engineering practice the damage patterns of the micropiles revealed that maximum pile force and deformation concentration occured near the sliding surface, with the highest displacement at the pile tops above this surface. In engineering practice, initially, it is crucial to determine the location and depth of the sliding surface to establish the anchoring depth and length of the micropiles. Suitable pile and row spacing should then be selected to enable synergistic pile-soil stress. For the stability of the reinforced slope, monitoring the pile top displacement, which is maximal above the sliding surface and easy to observe, is a viable evaluation method.
4 Conclusion
(1) The soil landslide model in the test exhibited three distinct damage patterns: the stabilization stage, the progressive destruction stage, and the continuous slip stage. Displacement curves at the landslides foot and the piles top indicated a prolonged stabilization in the first stage. However, upon entering the progressive destruction stage, the landslides stability rapidly deteriorated under load.
(2) The stress distribution curve of the micropile exhibited an inverse S-shape, with maximum stress occurring near the sliding surface. Correspondingly, the pile experienced significant bending deformation in this area, while the remainder of the micropile remained straight.
(3) Within the micropile groups, the first row of piles exhibited the highest stress and the highest displacement of micropile near the critical surface. The connecting beam enhanced the micropiles synergistic stress effect, increased skid resistance, and minimized displacement at the pile top and slope toe.
(4) The composite structure of three micropile rows and intervening soil significantly enhanced landslide stability, demonstrating a notable anti-slip effect. Given that the pile top experiences the greatest displacement and is easily monitored, evaluating slope stability in the project can be achieved by tracking this displacement.
Data availability statement
The raw data supporting the conclusions of this article will be made available by the authors, without undue reservation.
Author contributions
ML: Conceptualization, Data curation, Methodology, Writing–original draft. PL: Data curation, Methodology, Writing–original draft. DL: Conceptualization, Investigation, Writing–review and editing.
Funding
The author(s) declare that no financial support was received for the research, authorship, and/or publication of this article.
Acknowledgments
The laboratory portion of this study was carried out in the Soil Mechanics Laboratory of the School of Civil & Architecture Engineering, Xian Technological University. The authors sincerely thank the authority of the School of Civil & Architecture Engineering and the help provided by Prof. He Hui and Prof. Li Baoping.
Conflict of interest
The authors declare that the research was conducted in the absence of any commercial or financial relationships that could be construed as a potential conflict of interest.
Publisher’s note
All claims expressed in this article are solely those of the authors and do not necessarily represent those of their affiliated organizations, or those of the publisher, the editors and the reviewers. Any product that may be evaluated in this article, or claim that may be made by its manufacturer, is not guaranteed or endorsed by the publisher.
References
Abdollahi, A. H., and Ghanbari, A. (2022). A field study on the behaviour of driven and drilled micropiles implemented in clay. Proc. Inst. Civ. Eng. Geotech. Eng. 16, 376–391. doi:10.1680/jgeen.22.00006
Aboutabikh, M., Soliman, A. M., and El Naggar, M. H. (2020). Performance of hollow bar micropiles using green grout incorporating treated oil sand waste. J. Build. Eng. 27, 100964. doi:10.1016/j.jobe.2019.100964
Al-Dabagh, A., and Al-Omari, A. (2024). The role of footing reinforcement by micropiles: an experimental and numerical study. Transp. Infrastruct. Geotechnol. 29, 2319–2347. doi:10.1007/s40515-024-00373-y
Alizadeh, M., Khodaparast, M., and Rajabi, A. M. (2021). Simulation of the interaction of micropiles and a fault rupture. Ksce J. Civ. Eng. 25 (12), 4620–4630. doi:10.1007/s12205-021-0068-z
An, P., Yong, R., Song, J., Du, S., Wang, C., Xu, H., et al. (2024). Exploring the potential of smartphone photogrammetry for field measurement of joint roughness. Measurement 225, 114055. doi:10.1016/j.measurement.2023.114055
Bayesteh, H., Fakharnia, M. A., and Khodaparast, M. (2021). Performance of driven grouted micropiles: full-scale field study. Int. J. Geomech. 21 (2), 17. doi:10.1061/(asce)gm.1943-5622.0001905
Bernardes, H. C., da Cruz, A. J., Dias, D. C., da Cunha, R. P., and Rebolledo, J. F. R. (2022). Comparison between load tests performed in a root micropile executed six years apart. Int. J. Geotech. Eng. 16 (10), 1268–1275. doi:10.1080/19386362.2022.2117350
Borthakur, N., and Dey, A. K. (2020). Evaluation of group capacity of micropile in soft clayey soil from experimental analysis using SVM-based prediction model. Int. J. Geomech. 20 (3), 17. doi:10.1061/(asce)gm.1943-5622.0001606
Casagrande, B., Saboya, F., McCartney, J. S., and Tibana, S. (2022). Investigation of a field-scale energy micropile in stratified soil under cyclic temperature changes. Geomech. Energy Environ. 29, 100263. doi:10.1016/j.gete.2021.100263
Choi, W., Kim, G., Kim, I., Kyung, D., and Lee, J. N. (2020). Compressive load-carrying behavior of inclined micropiles installed in soil and rock layers. Int. J. Geomech. 20 (9), 13. doi:10.1061/(asce)gm.1943-5622.0001768
Dastgerdi, R. H., Khalatbari, M., Rezaeipour, A., Fard, A. K., Waqar, M. F., and Malinowska, A. (2023). Investigating the efficiency of micropiles in the stability of soil slopes: a case study. J. Comput. Appl. Mech. 54 (1), 127–139. doi:10.22059/jcamech.2023.354284.802
Deng, D. P., Li, L., and Zhao, L. H. (2017). Limit-equilibrium method for reinforced slope stability and optimum design of antislide micropile parameters. Int. J. Geomech. 17 (2). doi:10.1061/(asce)gm.1943-5622.0000722
Elsawwaf, A., El Sawwaf, M., Farouk, A., Aamer, F., and El Naggar, H. (2023a). Restoration of tilted buildings via micropile underpinning: a case study of a multistory building supported by a raft foundation. Buildings 13 (2), 422. doi:10.3390/buildings13020422
Elsawwaf, A., El Sawwaf, M., Nazir, A., Azzam, W., Farouk, A., and Etman, E. (2023b). Consolidation effect on the behavior of micropiled rafts under combined loading: case study. Arabian J. Sci. Eng. 48 (10), 13429–13448. doi:10.1007/s13369-023-07806-9
Fang, K., Dong, A., Tang, H. M., An, P. J., Zhang, B. C., Miao, M. H., et al. (2023a). Comprehensive assessment of the performance of a multismartphone measurement system for landslide model test. Landslides 20 (4), 845–864. doi:10.1007/s10346-022-02009-z
Fang, K., Jia, S., Tang, H., Zhou, R., Kong, Z., Fu, Y., et al. (2024). Arching effect in slopes under excavation: classification and features. Eng. Geol. 337, 107563. doi:10.1016/j.enggeo.2024.107563
Fang, K., Miao, M. H., Tang, H. M., Jia, S. X., Dong, A., An, P. J., et al. (2023b). Insights into the deformation and failure characteristic of a slope due to excavation through multi-field monitoring: a model test. Acta Geotech. 18 (2), 1001–1024. doi:10.1007/s11440-022-01627-0
Fang, K., Tang, H. M., Li, C. D., Su, X. X., An, P. J., and Sun, S. X. (2023c). Centrifuge modelling of landslides and landslide hazard mitigation: a review. Geosci. Front. 14 (1), 101493. doi:10.1016/j.gsf.2022.101493
Fang, K., Tang, H. M., Su, X. X., Shang, W. T., and Jia, S. L. (2020). Geometry and maximum width of a stable slope considering the arching effect. J. Earth Sci. 31 (6), 1087–1096. doi:10.1007/s12583-020-1052-0
Fiscina, L. F. G., Barbosa, Y., de Albuquerque, P. J. R., and de Carvalho, D. (2021). Field study on axial behavior of instrumented post-grouted steel pipe micropiles in tropical lateritic soil. Innov. Infrastruct. Solutions 6 (2), 56. doi:10.1007/s41062-020-00411-x
Gupta, R. K., and Chawla, S. (2022). Performance evaluation of micropiles as a ground improvement technique for existing railway tracks: finite-element and genetic programming approach. Int. J. Geomech. 22 (3), 15. doi:10.1061/(asce)gm.1943-5622.0002270
Hong, S., Kim, G., Kim, I., Lee, J., and Lee, J. (2022). Characterizing optimum casing configuration for laterally loaded micropiles with inclined condition. Ksce J. Civ. Eng. 26 (9), 3776–3788. doi:10.1007/s12205-022-1516-0
Hungr, O., Leroueil, S., and Picarelli, L. (2014). The Varnes classification of landslide types, an update. Landslides 11 (2), 167–194. doi:10.1007/s10346-013-0436-y
Kamura, A., Kaneko, T., Sato, N., and Kazama, M. (2023). Case study on viability of using head-separated micropiles as foundation system for check dams. Soils Found. 63 (1), 101275. doi:10.1016/j.sandf.2023.101275
Khidri, M., and Deng, L. J. (2021). Field axial cyclic loading tests of screw micropiles in cohesionless soil. Soil Dyn. Earthq. Eng. 143, 106601. doi:10.1016/j.soildyn.2021.106601
Khidri, M., and Deng, L. J. (2024). Field lateral behaviour of full-scale screw micropiles in cohesive and cohesionless soils. Geotech. Geol. Eng. 42 (5), 3711–3730. doi:10.1007/s10706-024-02753-0
Kong, G. Q., Wen, L., Liu, H. L., Zheng, J. J., and Yang, Q. (2020). Installation effects of the post-grouted micropile in marine soft clay. Acta Geotech. 15 (12), 3559–3569. doi:10.1007/s11440-020-00993-x
Lee, K., Kim, M., and Hwang, T. (2024). Reinforcement effect of micropile and bearing characteristics of micropiled raft according to the cohesion of soil and stiffness of pile. Geomech. Eng. 37 (5), 511–525. doi:10.12989/gae.2024.37.5.511
Malik, B. A., Shah, M. Y., and Sawant, V. A. (2021). Plate load tests to analyze the load-settlement response of shallow foundations on sand beds reinforced with micropiles. Environ. Sci. Pollut. Res. 28 (47), 67657–67666. doi:10.1007/s11356-021-15390-4
Neto, J. R. C., de Albuquerque, P. J. R., Barbosa, Y., and Fiscina, L. F. G. (2022). Experimental study on the behavior of a new post-grouted micropile in a tropical soil. Soils Rocks 45 (4), 11. doi:10.28927/sr.2022.005322
Pei, Z. W., Zhang, Y. J., Nian, T. K., Song, X. L., and Zhao, W. (2023). Performance investigation of micropile groups in stabilizing unstable talus slopes via centrifuge model tests. Can. Geotech. J. 60 (3), 351–365. doi:10.1139/cgj-2021-0681
Shah, I. A., Zaid, M., Farooqi, M. A., and Ali, K. (2021). Numerical study on micropile stabilized foundation in flyash. Indian Geotech. J. 51 (5), 1099–1106. doi:10.1007/s40098-020-00476-6
Sun, S. W., Zhu, B. Z., and Wang, J. C. (2013). Design method for stabilization of earth slopes with micropiles. Soils Found. 53 (4), 487–497. doi:10.1016/j.sandf.2013.06.002
Yang, T., Men, Y. M., Rutherford, C. J., and Zhang, Z. (2021). Static and dynamic response of micropiles used for reinforcing slopes. Appl. Sci. Basel 11 (14), 6341. doi:10.3390/app11146341
Keywords: micropile, landslide, model experiments, stress distribution in micropile, slope stabilization
Citation: Li M, Li P and Li D (2024) Experimental study on modeling of shallow soil landslide reinforced by micropiles. Front. Earth Sci. 12:1475594. doi: 10.3389/feart.2024.1475594
Received: 04 August 2024; Accepted: 21 October 2024;
Published: 30 October 2024.
Edited by:
Haijun Qiu, Northwest University, ChinaReviewed by:
Kun Fang, Hong Kong University of Science and Technology, Hong Kong SAR, ChinaPengju An, Ningbo University, China
Copyright © 2024 Li, Li and Li. This is an open-access article distributed under the terms of the Creative Commons Attribution License (CC BY). The use, distribution or reproduction in other forums is permitted, provided the original author(s) and the copyright owner(s) are credited and that the original publication in this journal is cited, in accordance with accepted academic practice. No use, distribution or reproduction is permitted which does not comply with these terms.
*Correspondence: Dongdong Li, bGRkQGh1ZWwuZWR1LmNu
†ORCID:Pengju Li, orcid.org/0009-0002-4328-2338
 Ming Li
 Pengju Li2†
 Dongdong Li