- 1State Key Laboratory of Tropical Oceanography, South China Sea Institute of Oceanology, Chinese Academy of Sciences, Guangzhou, China
- 2University of Chinese Academy of Sciences, Beijing, China
- 3Key Laboratory of Science and Technology on Operational Oceanography, South China Sea Institute of Oceanology, Chinese Academy of Sciences, Guangzhou, China
- 4School of Marine Sciences, Sun Yat-sen University, Guangzhou, China
An atmospheric duct is an anomalous atmospheric structural phenomenon that causes trap refraction in the troposphere to change the propagation paths and ranges of electromagnetic waves, thereby increasing the detection distances of radar and other communications. Atmospheric ducts include evaporation, surface, and elevated ducts. Evaporation ducts are commonly found near the sea surface and can impact electromagnetic wave propagation, radar communication, and livelihood applications at low altitudes. The meteorological environment of the Indian Ocean is complex, and the characteristics of its evaporation duct are still poorly understood. We validate four select atmospheric duct models using the observed evaporation duct height (EDH) in the Indian Ocean and present their spatial as well as temporal characterizations in spring using in situ meteorological variables. The results show that the EDH derived using the Babin model has the lowest bias with the observed value; thus, the Babin model can be used by researchers in the future to study changes to the EDHs in sea areas with similar seasonal conditions. The EDH in the Indian Ocean has diurnal variations, with higher (lower) values during the daytime (nighttime). The EDH has a negative correlation with the relative humidity, and the standard deviation of the EDH is largest when the relative humidity is 90%. The EDH has the maximum value when the wind speed is in the range of 8–14 m/s and when the air–sea temperature difference is zero, i.e.,
1 Introduction
Atmospheric ducts are refractive layers occurring in the troposphere that affect the propagation of electromagnetic waves and greatly disturb radar detection (Mosczkowicz et al., 1994; Mesnard and Sauvageot, 2010). Hence, they have been important subjects of study since World War II (Kerr, 1951; Kirby and Sofaer, 1966; Vilar et al., 1993; Adel et al., 1996; Heemskerk and Boekema, 1993; Sarma, 1993). Atmospheric ducts are associated with inverse temperatures or sharp decreases in the water vapor content (Yang et al., 2023). Atmospheric ducts include evaporation, surface, and elevated ducts. The evaporation duct is formed as a result of evaporation near the sea surface, where the water content decreases with increasing height (Yang et al., 2023); this duct type usually has a height of less than 40 m, with an offshore occurrence probability of up to 80% at low latitudes (Liu et al., 1996). Moreover, meteorological variables can influence the evaporation duct, such as the sea surface evaporation rate, high-pressure subsidence, frontal processes, nocturnal radiation inversion, and advection. Zhu et al. (2022) categorized the surface duct type into temperature-induced (T-type) and humidity-induced (H-type) ducts.
Direct measurement of the evaporation duct height (EDH) is difficult, so several models have been proposed by researchers based on meteorological variables, such as the structural model based on Monin–Obukhov similarity theory (Jeske, 1973), Fairall model based on the flux coefficient algorithm (Fairall et al., 1978), P-J model proposed by Paulus (1985), MGB model proposed by Météo France based on the mesoscale forecasting system using the analytical method (Musson-Genon et al., 1992), refractivity from clutter (RFC) atmospheric duct inversion technique (Tabrikian et al., 1999), NPS model proposed by the U.S. Naval Postgraduate School (Babin and Dockery, 2002), RSHMU model proposed by the Russian State Hydrometeorological University (Dinc and Akan, 2015), and parabolic model (Zhu et al., 2018). The pseudorefractive index model for the evaporation duct was proposed by Liu et al. (2001) based on the Monin–Obukhov similarity theory. Some other advanced models have also been developed using optimal methods (Gerstoft et al., 2004). The accuracy of the EDH is important for characterizing the strength of the duct and is a key factor in determining the degree of influence on the observations of radar and other electronic devices (Cai et al., 2020); hence, we aim to examine the accuracies of traditional EDH evaluation models using in situ observations.
The EDH observations are mainly obtained from methods such as low-altitude sounding balloon detection, meteorological gradient tower detection, and microwave refractometer detection (Liu, 2002; Zhao et al., 2013). Low-altitude sounding balloon detection can be used to collect and store real-time and parametric measurements, but it suffers from inaccuracies due to hysteresis and calculation formula errors (Lin, 2002); although microwave refractometer detection is capable of detecting the atmospheric refractive index values at different altitudes for evaporation duct detection, it is more difficult to build towers at sea (Fan, 2015). Both the sounding balloon and microwave refractometer detection methods are suitable for single-point detection. Although meteorological gradient tower detection can provide time-series information of the EDH, the vertical resolution of its sampling points is low and tends to produce large errors. Evaporation duct prediction is helpful for radar detection. Liao et al. (2023) reported that accurate EDH prediction can be achieved using the deep forest method. Other scientists have used a new non-linear prediction algorithm called the Darwinian evolutionary algorithm (DEA) to realize short-term prediction of the EDH (Mai et al., 2020). Therefore, real-time observations of the EDH are necessary to compensate for the limitations of single-point detection methods when predicting the EDH.
The Indian Ocean has a unique geographical location and is surrounded by land on three sides. The Indian Ocean is a typical monsoon region owing to sea–land interactions; in contrast to the equatorial Pacific and Atlantic Oceans, the annual mean surface winds over the Indian Ocean are westerlies (Chen et al., 2015a). The tropical Indian Ocean circulation system includes equatorial and near-equatorial circulations, marginal sea circulation, and eddies. The Indian Ocean is a typical monsoon region with complex marine meteorological activities and multiscale oceanic motions, such as the Indian Ocean dipole (IOD) that is capable of influencing and potentially varying the seasonal climate phenomena like rainfall in the vicinity through sea–air interactions (Saji et al., 1999; Abram et al., 2008). The Madden–Julian oscillation (MJO) affects various types of weather and weather systems (Zhang, 2005). These meteorological variations and oceanic motions result in complex EDH characteristics. The accuracies of EDH models and spatial variations of the EDH are still unclear for the Indian Ocean.
In this study, we used ship-based equipment to derive the real-time EDH. The accuracies of several EDH models and the spatial distribution of the EDH in the Indian Ocean were also investigated based on a domestic evaporation duct system installed on the ship to achieve real-time detection. The data collection procedures and methods are outlined in Section 2. The characteristics and mechanisms of the EDH are discussed in Section 3 and Section 4. The conclusions of this study are presented in Section 5.
2 Data and methodology
2.1 Data
The “Shiyan 1” Research Vessel undertook a cruise from 10 March 2021 to 4 May 2021. The evaporation duct system in the vessel detects hydrometeorological elements automatically, including the sea surface skin temperature, sea surface temperature, barometric pressure, relative humidity, wind speed, wind direction, and EDH data, with a time resolution of 5 min. The real-time EDH was designed based on the Babin model. The specific sailing routes and experimental zones are shown in Figure 1. Four zones (i.e., E1, E2, E3, and E4) were chosen to investigate the spatial variations of the EDH, and these were individually investigated from Mar. 22–25, Mar. 29–Apr. 1, Apr. 3–6, and Apr. 20–23, respectively. To detect the temporal variations of the EDH, two replicate transects R1 and R2 were selected in the E1 zone.
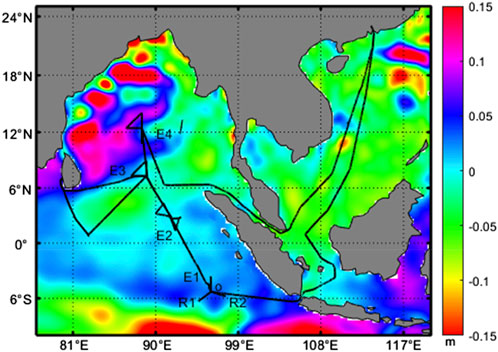
Figure 1. Background field data showing the mean sea level height anomalies for the time period from 10 March 2021 to 4 May 2021, where the specific navigation routes are shown in black line segments. The red boxes are the study zones E1, E2, E3, and E4. The repeat sections R1 and R2 are located in the E1 experimental area. The starting point of the repeated sections is point O, and the ending points are point 1 and point 2.
2.2 Methods
2.2.1 Evaporation duct refractive index profile calculation
The in situ EDH is based on the atmospheric refractivity distribution obtained from the air pressure, temperature, and humidity profiles (Babin and Rowland, 1992; Babin, 1996; Brooks et al., 1999; Mentes and Kaymaz, 2007; Cheng et al., 2015). The atmospheric refractive index
where p is the pressure, q is the specific humidity, and
2.2.2 Four models for EDH
2.2.2.1 P-J model
The P-J model was proposed by Paulus (1985), and the EDH according to this model is dependent on the air temperature, relative humidity, and wind speed.
The Monin–Obukhov length L is obtained as
The refractive index
The refractive index of the air just above the sea surface
where hm is the humidity.
The refractive index of the water at the sea surface
The stability of the ocean–atmosphere interface is related to the value of the Richardson number. The steady state is represented by
where
where
2.2.2.2 Babin model
The tropical ocean global atmosphere coupled ocean–atmosphere response experiment (TOGA COARE) model was used to solve for the characteristic scale parameters, Monin–Obukhov length
In Equation 9
From Equation 1, Equation 10 can be derived,
From the relationship between the potential temperature and temperature, we have
In Equation 11 Cpa is the specific heat of dry air, Ra is the gas constant of dry air,
Babin used the salinity revision proposed by Sverdrup et al. (1943) to calculate the specific humidity of saturation at the sea surface
The saturated water vapor pressure at the sea surface
Under stable and neutral conditions, the EDH
Under unstable lamination conditions, the EDH
2.2.2.3 NPS model
The NPS model also uses the TOGA COARE model and Monin–Obukhov length:
In Equation 16
The dimensional and roughness parameters of the sea surface were calculated using the COARE 3.0 algorithm, and the stability correction function
where
In this model, the air pressure is expressed as Equation 18
where
In Equation 19 ε is the ratio of the dry-air gas constant to the water vapor constant (0.622).
2.2.2.4 RSHMU model
In this model, the wind speed and temperature profile stability functions are expressed as Equation 20:
where
3 Results
3.1 Temporal variation in the EDH
Figure 2 shows the diurnal variations of the in situ EDH values from 0:00 UTC on April 5 to 0:00 UTC on April 9 as measured using the evaporation duct system. It is noted that the EDH value is greater during daytime and lower at night. The EDH first increases and then decreases, with mean values of 15.1 m and 14.8 m during the daytime and nighttime, respectively. There is an obvious opposite trend between the EDH and relative humidity.
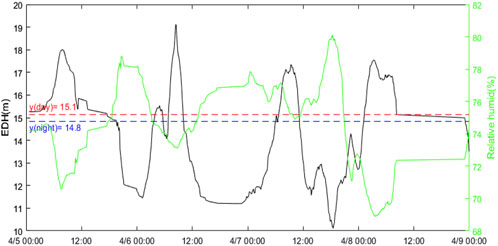
Figure 2. Diurnal variations in the EDH (black) and relative humidity (green). The red dashed line is the mean EDH during daytime (LT 6:00–18:00), and the blue dashed line is the mean EDH at night (LT 18:00–6:00).
Figure 3 shows the in situ EDH variations at two repeated cross sections R1 and R2 having different observation times; these durations are divided into t1 (from 2:35 on March 22 to 01:30 on March 23) and t2 (from 01:30 to 13:10 on March 23) for the R1 transection as well as t3 (from 13:10 to 22:15 on March 23) and t4 (22:15 on March 23 to 13:40 on March 24) for the R2 transection. In the R1 area, the EDH increased from south to north during both t1 and t2. Excluding the spatial trends, the oscillation of EDH during t1 is more significant than that during t2, which may be induced by the high temporal interval during t1. There is no obvious trend from 5.8° S to 5.5° S at the R2 transection, which may be attributed to the limited zonal area. In the R2 area, the EDH is greater during t3 than t4.
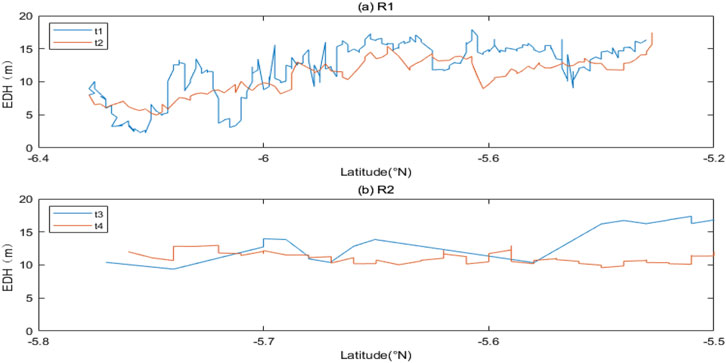
Figure 3. EDH variations at the (A) R1 and (B) R2 transections. The blue and red lines indicate the t1 (t3) and t2 (t4) periods, respectively.
3.2 Spatial variation in the EDH
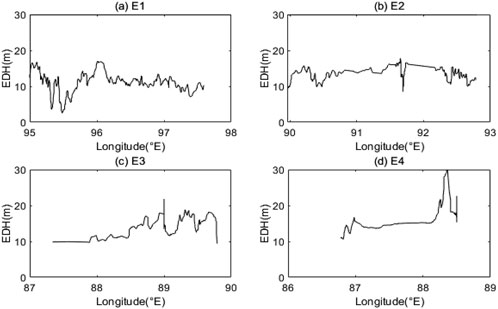
The variations of the EDH in the different zones are shown in Figure 4. E1 has the lowest EDH value of 5 m, while E4 has the largest EDH value of 30 m. The EDH in the entire experimental area of E2 does not have obvious variations; this may be induced by the oceanic motions below the atmosphere. Note that a low sea level anomaly zone with low temperature develops to the east of the E4 zone (Figure 1), which could increase the EDH owing to the low evaporation rate.
3.3 Validation of the modeled EDH
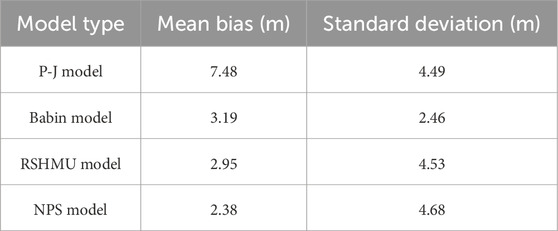
Figure 5 shows the EDH variations from the four models along with the in situ value measured using the evaporation duct system. It is observed that the Babin model curve is the best fit for the actual curve. Compared to the in situ value, the mean biases and standard deviations (in parentheses) of the P-J, Babin, RSHMU, and NPS models are 7.48 (4.49), 3.19 (2.46), 2.95 (4.53), and 2.38 (4.68) m, respectively (Table 1). Therefore, the accuracy of the Babin model is the highest among the four models and can be used by researchers to study the EDH in the corresponding sea area. However, it remains to be seen whether this model is applicable to other sea areas and times, which would need to be validated in future studies.
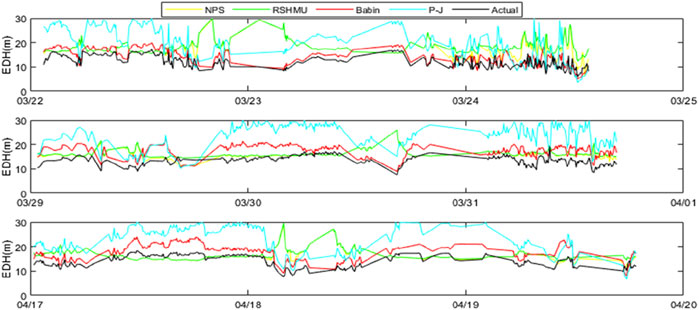
Figure 5. EDH variations for March 22–25, March 29 to April 1, and April 17–20 during the study period. The black, red, green, blue, and yellow lines are the EDH values from the in situ, Babin, RSHMU, P-J, and NPS measurements, respectively.
4 Discussion
There are obvious spatial and temporal differences in the EDH. In addition to the basic conditions of the ocean, meteorological variables like wind speed, humidity, and atmospheric temperature may influence the EDH (Ding et al., 2015). We used the EDH measurement obtained using an evaporation duct system to study the relationship of the actual EDH to the meteorological variables.
The scatter plots between the EDH and meteorological variables are shown in Figure 6. As the relative humidity increases, the EDH decreases gradually, which is consistent with the conclusions of Twigg (2007). When the relative humidity is 90%, the standard deviation of the EDH is maximum, which could be attributed to the sparse samples. The EDH has the maximum value when the wind speed is in the range of 8–14 m/s, which could be explained by the stability of the atmospheric boundary layer; when the wind speed exceeds 14 m/s, the relative humidity is reduced. Ding et al. (2015) found that the EDH increases as the wind speed increases from 0–10 m/s, and they attributed this to the developing mechanical turbulence. Meanwhile, the mixing effect of the wind speed can change the air temperature, relative humidity, and vapor pressure, further affecting the EDH. The air–sea temperature difference
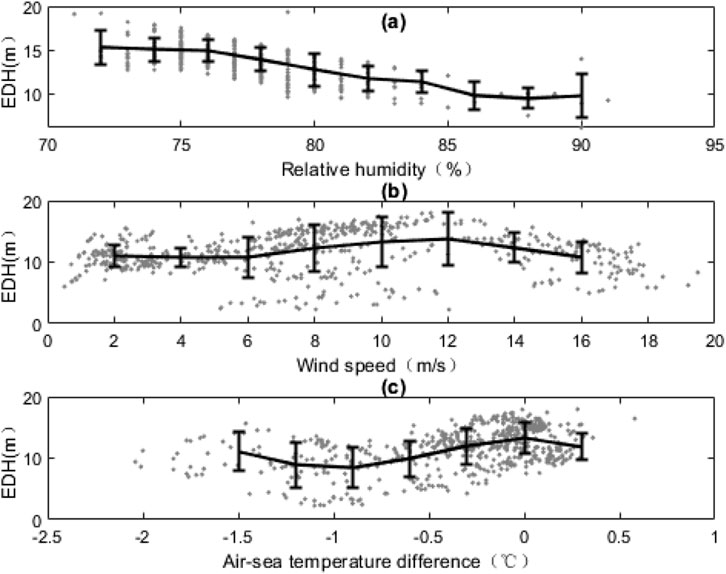
Figure 6. Scatter plots between the meteorological variables and EDH: (A) relative humidity, (B) wind speed, and (C) air–sea temperature difference. The error bars represent the standard deviations of the EDH for every 2% change in relative humidity, 2 m/s change in wind speed, and 0.3°C difference in air–sea temperature.
5 Conclusion
Using the observations obtained with an evaporation duct system onboard a research vessel, we present the spatial and temporal variations in the EDH and its possible mechanisms based on evaluations using four EDH models. The findings of this work are as follows:
(1) Based on the in situ EDH measurement in the Indian Ocean, we validated four models of EDH, namely the Babin, P-J, RSHMU, and NPS models. We found that the Babin model has the smallest standard deviation compared to the obtained measurements.
(2) The EDH has a significant diurnal variation, with higher values during the daytime. Spatially, the EDH has a minimum value of 5 m in the south (E1 zone) and a maximum value of 30 m in the north (E4 zone).
(3) The EDH is closely related to meteorological variables like the relative humidity, wind speed, and air–sea temperature difference. The relative humidity is negatively correlated with the EDH, and the standard deviation of EDH value is largest when the relative humidity is 90%. Greater values of the EDH correspond to wind speeds of 8–14 m/s, which may be attributed to the stability of the atmospheric boundary layer. Larger EDH values may also be observed under neutral conditions (when
Based on a new real-time observation system, we measured the EDH to provide a reliable value and determine the most suitable model applicable to the evaporation duct in the Indian Ocean. Moreover, we provide viable data to predict the EDH. This study not only broadens our knowledge of the marine atmospheric boundary layer but also supports research efforts on marine radar, electromagnetic wave propagation, and marine combat.
Data availability statement
The raw data supporting the conclusions of this article will be made available by the authors without undue reservation.
Author contributions
ZQ: conceptualization, investigation, methodology, software, supervision, writing–original draft, and writing–review and editing. HM: funding acquisition, resources, and writing–review and editing. CQ: writing–review and editing, conceptualization, and methodology. YQ: conceptualization, software, and writing–review and editing.
Funding
The authors declare that financial support was received for the research, authorship, and/or publication of this article. This study was suported by the Strategic Priority Research Program of the Chinese Academy of Sciences, Grant No. XDC0190101, the National Key R&D Plan of China, Grant Nos. 2021YFC2803104, 2021YFC3101301, and 2022YFC3104403, the National Natural Science Foundation of China, Grant No. 42276193.
Acknowledgments
The authors thank the crew of the research vessel “Shiyan 1,” as well as other scientists and technicians available during the cruise. The authors also acknowledge the scholars and organizations who helped with this research.
Conflict of interest
The authors declare that the research was conducted in the absence of any commercial or financial relationships that could be construed as a potential conflict of interest.
Publisher’s note
All claims expressed in this article are solely those of the authors and do not necessarily represent those of their affiliated organizations, or those of the publisher, the editors, and the reviewers. Any product that may be evaluated in this article, or claim that may be made by its manufacturer, is not guaranteed or endorsed by the publisher.
References
Abram, N., Gagan, M., Cole, J., Hantoro, W. S., and Mudelsee, M. (2008). Recent intensification of tropical climate variability in the Indian Ocean. Nat. Geosci. 1, 849–853. doi:10.1038/ngeo357
Adel, A. S., Abo, S., and Samila, T. (1996). Transient electromagnetic field of a vertical electric dipole above an atmospheric surface duct. Radio Sci. 31 (4), 833–840. doi:10.1029/96rs00283
Babin, S. M. (1996). Surface duct height distributions for Wallops Island, Virginia, 1985-1994[J]. Appl. Meteorology 35 (1), 86–93. doi:10.1175/1520-0450
Babin, S. M., and Dockery, G. D. (2002). LKB-based evaporation duct model comparison with buoy data[J]. Appl. Meteor.Climatol. 41, 434–446. doi:10.1175/1520-0450(2002)041<0434:lbedmc>2.0.co;2
Babin, S. M., and Rowland, J. R. (1992). Observation of a strong surface radar duct using helicopter acquired fine-scale radio refractivity measurements. Geophys. Res. Lett. 19 (9), 917–920. doi:10.1029/92GL00562
Brooks, I. M., Goroch, A. K., and Rogers, D. P. (1999). Observations of strong surface radar ducts over the Persian Gulf[J]. Appl. Meteorology 38 (9), 1293–1310. doi:10.1175/1520-0450(1999)038<1293:oossrd>2.0.co;2
Buck, A. L. (1981). New equations for computing vapor pressure and enhancement factor. J. Appl. Meteorology Climatol. 20 (12), 1527–1532. doi:10.1175/1520-0450(1981)020<1527:nefcvp>2.0.co;2
Cai, X., Wang, J., He, X., Zhang, S., Zhu, Q., and Hu, J. (2020). Research on change features of evaporation duct over the East China Sea. Chin. J. radio Sci. 35 (3), 372–376. doi:10.13443/j.cjors.2019111901
Chen, G., Han, W., Li, Y., Wang, D., and McPhaden, M. (2015a). Seasonal-to-interannual time-scale dynamics of the equatorial undercurrent in the Indian ocean. J. Phys. Oceanogr. 45, 1532–1553. doi:10.1175/JPO-D-14-0225.1
Cheng, Y., Zhou, S., Wang, D., Lu, Y., and Yao, J. (2015). Statistical characteristics of the surface ducts over the South China Sea from GPS radiosonde data. Acta Oceanol. Sin. 34 (11), 63–70. doi:10.1007/s13131-015-0749-x
Dinc, E., and Akan, O. B. (2015). Channel model for the surface ducts: large-scale path-loss, delay spread, and AOA. IEEE Trans. Antennas Propag. 63 (6), 2728–2738. doi:10.1109/TAP.2015.2418788
Ding, J., Fei, J., Huang, X., Cheng, X., Hu, X., and Ji, L. (2015). Development and validation of an evaporation duct model. Part I: model establishment and sensitivity experiments. J. Meteorol. Res. 29, 467–481. doi:10.1007/s13351-015-3238-4
Fairall, C. W., Houlihan, T. M., Davidson, K. L., and Schacher, G. E. Evaporation duct height measurements in the mid-atlantic[J]. prepared for naval oceanographic office, 1978.
Gerstoft, P., Hodgkiss, W., Rogers, L., and Jablecki, M. (2004). Probability distribution of low altitude propagation loss from radar sea-clutter data. Radio Sci. 39, 1–9. doi:10.1029/2004RS003077
Heemskerk, H. J. M., and Boekema, R. B. (1993) “The influence of evaporation duct on the propagation of electromagnetic waves low above the sea surface at 3-94 GHz[C]//Antennas and Propagation,” in Eighth international conference on. IET. doi:10.1007/s00606-006-0489-7
Jeske, H. (1973) State and limits of prediction methods of radar wave propagation conditions over sea, 36. Netherlands: Springer, 130–148.
Kang, S., Zhag, Y., and Wang, H. (2014). Atmospheric duct in troposphere environment. 1st ed. Beijing, China: Science Press, 85–86.
Kerr, D. E. (1951). Propagation of short radio waves. New York: MIT Radiation Laboratory Series, 1–22. doi:10.1126/science.114.2964.425
Kirby, R. S., and Sofaer, E. (1966) “Radiowaves: Tropospheric Radiowave Propagation beyond the Horizon. François du Castel,”. New York: tr. Pergamon, 183–184. Science155. doi:10.1126/science.155.3759.183.b
Liao, Q., Mai, Y., Sheng, Z., Wang, Y., Ni, Q., and Zhou, S. (2023). The comparison of long short-term memory neural network and deep forest for the evaporation duct height prediction. IEEE Trans. Antennas Propag. 71 (5), 4444–4450. doi:10.1109/TAP.2023.3254201
Lin, F. (2002). The measurements of atmospheric duct near sea surface and its comparison with other study results. Chin[J]. Radio Sci. doi:10.1007/s11769-002-0041-9
Liu, C., Pan, Z., and Guo, L. (1996) Statistical analysis of occurrence and characteristics of atmospheric ducts in China. Chin[J]. Radio Sci., 11(2):60–66.
Liu, C.-G. (2002). The occurrence of tropospheric ducts over the south-eastern coast of China. Chin[J]. Radio Sci.
Liu, C.-G., Huang, J., Jiang, C., and Lin, F. (2001). Modeling evaporation duct over sea with pseudo-refractivity and similarity theory[J]. Acta Electron. Sin. 29(7): 970–972.
Mai, Y., Sheng, Z., Shi, H., Li, C., Liao, Q., and Bao, J. (2020). A new short-term prediction method for estimation of the evaporation duct height. IEEE Access 8, 136036–136045. doi:10.1109/ACCESS.2020.3011995
Mentes, S. S., and Kaymaz, Z. (2007). Investigation of surface duct conditions over Istanbul, Turkey [J]. Appl. Meteorology Climatol. 46 (3), 318–337. doi:10.1175/JAM2452.1
Mesnard, F., and Sauvageot, H. (2010). Climatology of anomalous propagation radar echoes in a coastal area [J]. Appl. Meteorology Climatol. 49 (11), 2285–2300. doi:10.1175/2010JAMC2440.1
Mosczkowicz, S., Ciach, G. J., and Krajewski, W. F. (1994). Statistical detection of anomalous propagation in radar reflectivity patterns [J]. Atmos. Ocean. Technol. 11 (4), 1026–1034. doi:10.1175/1520-0426(1994)011<1026:sdoapi>2.0.co;2
Musson-Genon, L., Gauthier, S., and Bruth, E. (1992). A simple method to determine evaporation duct height in the sea surface boundary layer. Radio Sci. 27 (5), 635–644. doi:10.1029/92rs00926
Paulus, R. A. (1985). Practical application of an evaporation duct model. Radio Sci. 20 (4), 887–896. doi:10.1029/rs020i004p00887
Saji, N., Goswami, B., Vinayachandran, P., and Yamagata, T. (1999). A dipole mode in the tropical Indian Ocean. Nature 401, 360–363. doi:10.1038/43854
Sarma, S. B. S. S. (1993). Airborne microwave refractometer studies over the Indian subcontinent for exploiting electromagnetic propagation effects[J].
Sverdrup, H. U., Johnson, M. W., and Fleming, R. H. (1943). The oceans: their physics, chemistry, and general biology. Copeia 1943, 261. doi:10.2307/1438154
Tabrikian, J., Krolik, J., and Vasudevan, S. (1999). “Estimating tropospheric refractivity parameters from radar sea clutter,” in Proceedings of the IEEE signal processing workshop on caesarea (Israel), 345–348.
Twigg, K. (2007). “A smart climatology of evaporation duct height and surface radar propagation,” in The Indian ocean.
Vilar, E., Austin, J., and Tawfik, A. N. (1993) Narrow and wide band transhorizon propagation studies at X B and [C].
Yang, N., Su, D., and Wang, T. (2023). Atmospheric ducts and their electromagnetic propagation characteristics in the northwestern south China sea. Remote Sens. 15, 3317. doi:10.3390/rs15133317
Zhao, X., Wang, D., Huang, S., Huang, K., and Chen, J. (2013). Statistical estimations of atmospheric duct over the South China Sea and the tropical eastern Indian Ocean. Chin. Sci. Bull. 58, 2794–2797. doi:10.1007/s11434-013-5942-8
Zhu, J., Zou, H., Kong, L., Zhou, L., Li, P., Cheng, W., et al. (2022). Surface atmospheric duct over Svalbard, Arctic, related to atmospheric and ocean conditions in winter. Arct. Antarct. Alp. Res. 54 (1), 264–273. doi:10.1080/15230430.2022.2072052
Keywords: atmospheric duct, evaporation duct, Babin model, correlation analysis, Madden–Julian oscillation
Citation: Qi Z, Mao H, Qiu C and Qi Y (2024) Validation of atmospheric evaporation duct in the eastern Indian Ocean. Front. Earth Sci. 12:1472383. doi: 10.3389/feart.2024.1472383
Received: 13 August 2024; Accepted: 18 November 2024;
Published: 18 December 2024.
Edited by:
Donald B. Olson, University of Miami, United StatesReviewed by:
Tien Anh Tran, Seoul National University, Republic of KoreaLiao Qixiang, Changsha Central Hospital, China
Copyright © 2024 Qi, Mao, Qiu and Qi. This is an open-access article distributed under the terms of the Creative Commons Attribution License (CC BY). The use, distribution or reproduction in other forums is permitted, provided the original author(s) and the copyright owner(s) are credited and that the original publication in this journal is cited, in accordance with accepted academic practice. No use, distribution or reproduction is permitted which does not comply with these terms.
*Correspondence: Huabin Mao, bWFvaHVhYmluQHNjc2lvLmFjLmNu
 Zhe Qi
 Huabin Mao
 Chunhua Qiu
 Yongfeng Qi