 Weixin Yang
 Yonggang Zhang
 Lei Zhang3*
 Ning An
- 1Gansu Institute of Engineering Geology, Lanzhou, Gansu, China
- 2Engineering Research Institute, China Construction Eighth Engineering Division Corp., Ltd., Shanghai, China
- 3Yunnan Institute of Water and Hydropower Engineering Investigation, Design and Research, Kunming, China
Landslides and geological disasters occur frequently in the mountainous areas of northwest China, seriously threatening people’s life and property of the region. In this study, we investigated the Lijie Beishan landslide as a typical case and combines the results of on-site geological surveys to conduct two-dimensional and three-dimensional numerical simulations of the landslide, evaluating its stability under self-weight, rainfall, and earthquake action. By analyzing the generalized shear strain, displacement, and stability coefficient of the landslide, it is determined that the stability of the landslide shows a decreasing trend under static, rainfall, and earthquake conditions. Landslides exhibit tension controlled failure modes under normal static and rainfall conditions, and translational failure modes under earthquake conditions. Compared with static and rainfall conditions, landslides have the largest volume and sliding distance under earthquake conditions. By combining the transfer coefficient method and the simplified Bishop method, a comparative analysis was conducted on the stability of the landslide. It was found that the stability coefficients under different working conditions were consistent with the simulation results, which verified the reliability of the simulation results. The research results of this paper will assist in clarifying the development mechanism of this type of landslides and provide valuable references for the stability evaluation of landslides in the northwest mountainous areas.
1 Introduction
Landslide hazards are characterized by sudden occurrences and complex causes, resulting in extensive devastation and harm (Tian And Lan, 2023; Flentje And Chowdhury, 2018; Wang et al., 2018; Huang et al., 2024a). Landslides not only destroy land resources and engineering structures, but also lead to catastrophic mountain collapses (Luo et al., 2021; Shah et al., 2023; Huang et al., 2024b). It has been studied that the key triggering factors of landslide include rainfall (Bogaard and Greco, 2018; Conte et al., 2022) and seismic (Chen et al., 2021; Chang et al., 2023). Generally, the stability of slope may change under the action of the above factors, even leading to the occurrence of landslide.
Over the last decades, three main research approaches to address the slope stability and landslide failure mechanisms, i.e., analog, coefficient transfer, and numerical simulation, are well-accepted and extensively applied. Due to a limited number of tests and the adverse impact of subjective factors, the analog method, which manipulates geological or mathematical models to build the stability analysis, demonstrates an unmitigated flaw in accurate representation of actual strength parameters (Süzen and Kaya, 2012; Tsangaratos and Benardos, 2014; Lombardo and Mai, 2018; Huang et al., 2024c; Huang et al., 2024d). To further investigate the stability state of the slope under different rainfall conditions, Ye et al. (2018) built a 1:100 scale analog model that was verified with field survey results, and they identified three kinetic stages of sand slope, i.e., dry sand, wet sand, and water-sand flow. Besides, the limit equilibrium method is a well-established approach for engineering applications to analyze slope stability (Bi et al., 2012; Xiao, 2019; Zhang et al., 2021), and it can accurately calculate the stability of landslides under clear geological conditions. Gao et al. (Gao Y. et al., 2023)used the transfer coefficient method to evaluate the landslide stability. The calculated results showed the slope is unstable under rainstorm, which is agree with the numerical simulation results. In recent years, the high-performance computing techniques and the numerical simulation method allow for the visual observation of deformation and stress distribution in the potential sliding area of the slope through model analysis (Jiao et al., 2013; Zhou et al., 2019; Zhang et al., 2020), and they have been widely employed in slope stability analysis to investigate the failure mechanism of landslides. By constructing a well-designed numerical model and analyzing stress concentration within the landslide body, it is possible to infer the position of sliding surface and the degree of deformation, thus providing further verification of the stability status of landslide deposit. Therein, many advanced numerical techniques have been emerged to predict the run-out distance and the evolution of landslide, such as the smoothed particle hydrodynamics method (SPH) (Tayyebi et al., 2022; Gao L. et al., 2023), the material point method (MPM) (Troncone et al., 2023; Troncone et al., 2022), and the coupled Eulerian-Lagrangian method (CEL) (Wang et al., 2021), etc. To incorporate the influence of moisture content into landslide stability analysis, Liu and Su (2023) proposed a new simulated approach considering the influence of moisture content. An USDFLD subrountine of ABAQUS program was used to evaluate the landslide stability of Azhuoluo slope. The results indicated that this proposed double strength discounting method reflected major features of landslide instability. Meanwhile, Ma et al. (2021) proposed a novel approach for seismic landslide stability analysis and numerical simulation to investigate the effect of earthquakes on landslide stability. Therein, the explicit finite element method was utilized to study the stability and failure process of a 2D landslide model based on the ABAQUS platform. The simulated factor of safety and sliding distance of the landslide under earthquake condition indicated that dynamic-mechanical properties and the ground motion response were the critical influencing factor for seismic landslide stability.
However, when analyzing the stability of landslides, the research methods used were single, and the reliability of stability evaluation was low in the past. This paper will use two-dimensional and three-dimensional numerical simulations, transfer coefficient method, and simplified Bishop’s method (Xiao, 2019) to comprehensively analyze the stability of Lijie Beishan landslide under self-weight, rainfall, and earthquake, explore the failure mechanism of the landslide, and develop a quantitative evaluation plan for landslide stability. This study will contribute to improving the comprehensive evaluation method of landslide disasters in the mountainous areas of Northwest China, and provide theoretical references for the investigation of landslides induced by rainfall and earthquakes.
2 Overview of the Lijie Beishan landslides
2.1 Geological background
The research area located in Zhouqu county, Longnan city of China, is one of the regions in most severely affected by landslides. The most typical geological hazards in this area is the Lijie Beishan landslide, which is located in a heavily uplifted region of Neogene period and it’s six sliding behaviors were recorded between 1997 and 2018 (Liu et al., 2024). This study area is near the active fault zone of the Bailong river and has experienced frequent geological tectonic activities (see Figure 1). Field surveys demonstrate that the landslide area is located in the middle and upper parts of Beishan mountains, with a rear elevation of 2,547 m and a front elevation of 1742 m. It consists of a complex landslide system that includes a previous landslide that has been deformed, an ancient landslide body, an active landslide body currently exhibiting deformation and damage, and a potential landslide area showing clear signs of deformation prior to the complete penetration of the slip surface. The landslide can be divided into seven blocks based on its deformation characteristics, rock layer distribution, topographical conditions, and sliding direction (Figure 1). The top layer of the landslide primarily consists of the H1 area of the old landslide, which includes the range of the old landslide as well as the H1-1 and H1-2 landslides where clear deformation signs are apparent. However, complete sliding has not taken place. The secondary landslides primarily belong to the H2-H7 landslides, which are characterized by significant deformation and a larger area of influence. Each landslide exhibits distinct characteristics and intricate interrelationships. This landslide has an ongoing high probability of reactivation and seriously threatens the people’s lives and property in Beishan village and Lijie town in this region.
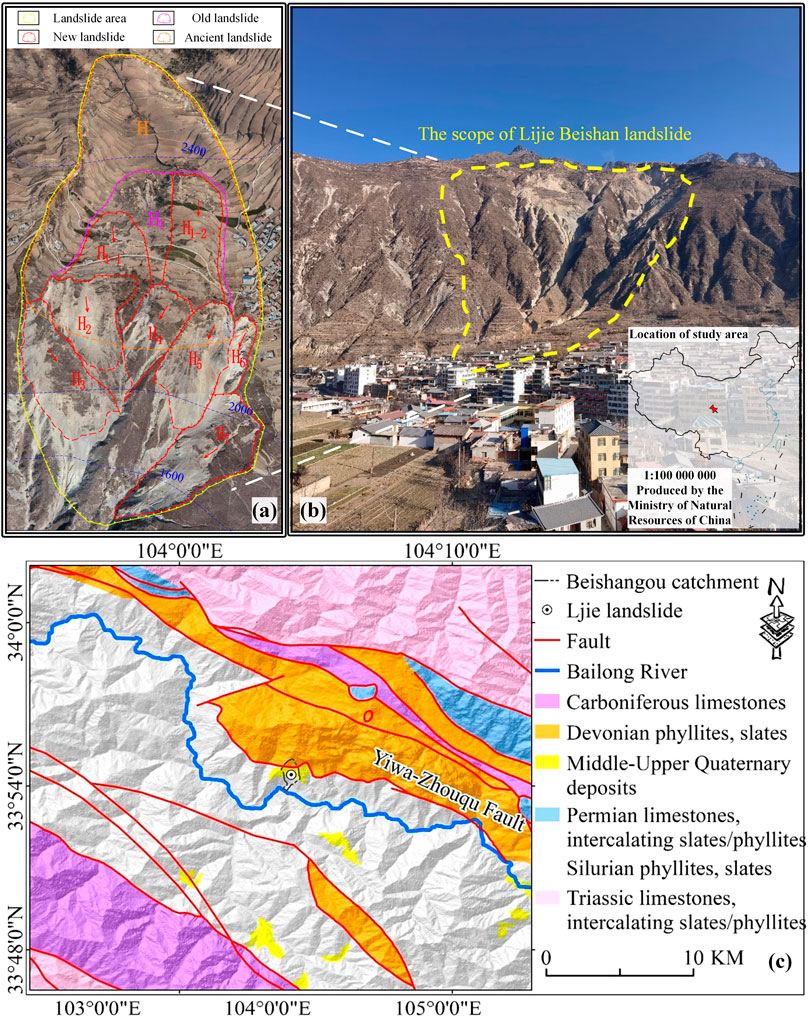
Figure 1. Location and field situation of Lijie Beishan landslide.
2.2 The triggering factors of landslide
The study area is situated in the Zhouqu-Wudu seismic subzone, which is known for its intense tectonic movements. The presence of steep mountains and well-developed river valleys in the region suggests a long-term uplift process and multiple tectonic events. More importantly, on the many accumulation zones generated by landslides in the fault region during their process of development (Qi et al., 2021), as shown in Figure 1. Also, occurrences of landslides in this area are primarily influenced by major faults, which have played a crucial role in the formation of ancient landslides. Consequently, fault activity leads to the slope’s rock and soil disintegration and the formation of minor folds and secondary faults. The intersection of various faulting and folding orientations further exacerbates the fragmentation of rock formations, which create favorable conditions for the occurrence of geological hazards.
The large amount of stockpils found in the field survey confirms that this landslide should be categorized as a deposit landslide, as shown in Figure 2. The upper layer of the slope comprises loose gravelly soil with exposed rock and soil, enabling the infiltration and flow of surface water. In contrast, the lower layer consists of fractured shale debris that is significantly influenced by fault structures and sliding disturbances. This lower layer is highly fragmented and possesses poor engineering properties, which makes it highly susceptible to sliding. The lithology of these formations plays a crucial role in the initiation and progression of landslides. The landslide has underwent long-term creep. Local villagers have extensively engaged in slope cutting for road construction, house building, and land reclamation, with unregulated discharge of domestic sewage. This continuous erosion causes an increasing collapse area on the gully edge, leading to loss of support and subsequent collapse of the upper block. As residential areas and structures continuously evolve, the locations prone to instability and sliding also change. Meanwhile, human impact on the ecological environment is an important factor in inducing landslides along with engineering construction. Inappropriate land use is another reason for the increased impact of landslide disasters (Qi et al., 2021). The deformation traces of landslides investigated in recent years are shown in Figure 2.
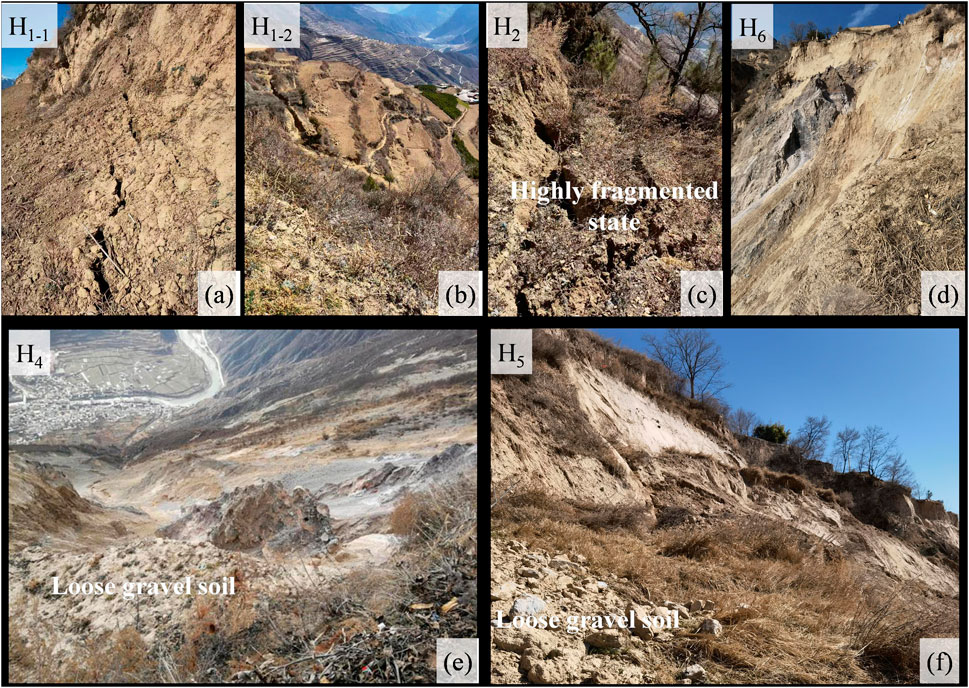
Figure 2. Field investigation photos of Lijie Beishan landslide (A) Cracks at the rear edge of H1-1 landslide; (B) Cracks of H1-2 landslide; (C) Cracks in the forest on the east side of the H2 landslide; (D) The leading edge of H6 landslide; (E) The H4 landslide surface has slipped; (F) The rear wall of H5 landslide.
3 Numerical analysis of landslide stability
This paper uses two-dimensional (2D) and three-dimensional (3D) numerical simulation methods to study the stability of landslides under static conditions, rainfall conditions, and seismic conditions, as well as the displacement changes after sliding. The two-dimensional simulation mainly analyzed the main sliding profile 1-1, while the three-dimensional simulation analyzed the overall failure mode of the landslide.
3.1 Principles of numerical simulation calculation
This study uses the finite element software ABAQUS for computational analysis. The model adopts the Hardin-Drnevich backbone loading curve model, which is able to predict the relationship between the dynamic modulus and the damping ratio of soil with dynamic strain. The dynamic shear modulus and the damping ratio of soil can be expressed as functions of dynamic shear strain, as the following Equations 1, 2:
where
where K and G are the bulk and shear moduli of the soil, respectively.
To validate the applicability of this model, a four-node reduced-integration element is employed to calculate the shear stress-strain relationship of the element, which is then compared with the experimental test data of the loess and the crushed rock soil of the Beishan landslide body. The top horizontal degree of freedom of the element is constrained, and a sinusoidal acceleration time history curve (peak acceleration of 0.04 g) is applied horizontally at the bottom of the element. Note that the above parameters were determined by the authors after extensive experiments based on the trial-error method. The loess has a maximum shear stiffness
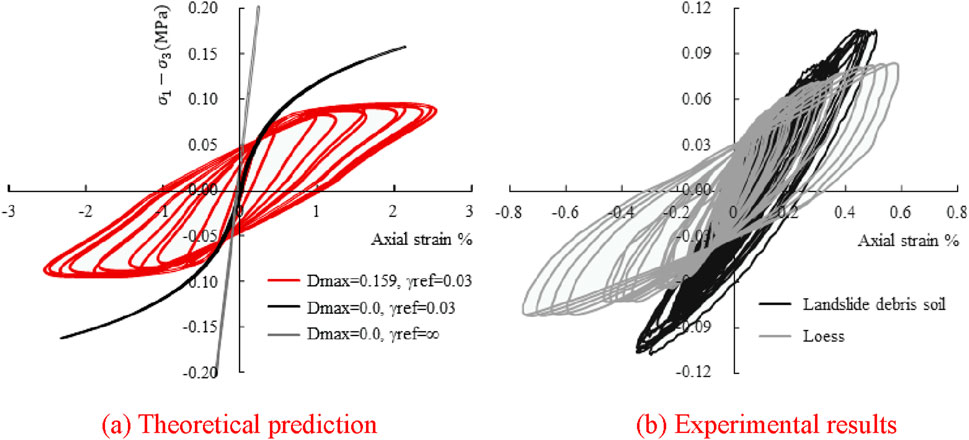
Figure 3. Comparison between theoretical prediction and experimental data of the dynamic stress-strain relationship of the loess. (A) Theoretical prediction (B) Experimental results.
The strength reduction method determines the factor of safety (Fs) by reducing the shear strength parameters, which can be expressed as the following Equation 4:
where
The reduction coefficient for a sudden increase in slope displacement (the inflection point of the relationship curve between the reduction coefficient and the maximum displacement of the slope) is determined as the Fs, and the corresponding maximum displacement is regarded as the sliding failure displacement of landslide instability.
The comprehensive trial calculation is based on the qualitative evaluation of deformation characteristics of the landslide and the stability state of the current situation. Considering the change in physical and mechanical properties of the rock and soil in the landslide area, the inversion formula can be expressed as the following Equations 5, 6:
where
The height of the slope is 1,060 m with a landslide ratio of 1:2. The calculation parameters of the landslide soil are: Elastic modulus E = 100 MPa, Poisson’s ratio
The simulations are conducted based on normal static, rainfall, and seismic conditions. The static condition only considers the self-weight, while the rainfall condition considers the influence of self-weight, strength weakening, and saturated capacity. Since the soil is nearly saturated after rainwater infiltration, the matric suction and the shear strength of the soil decreases. Therefore, the soil strength parameters are reduced by 5% based on empirical experience, and the rainfall conditions are calculated and analyzed. The seismic condition considers the influence of gravity and seismic acceleration, where the seismic waves are artificial synthetic seismic waves. The bedrock peak acceleration with a 100-year exceedance probability of 2% is used.
3.2 Numerical models and operating conditions
3.2.1 2D numerical simulation
First, the rainfall and seismic conditions are given. 1) Under heavy rainfall condition, the superficial cover layer of the slope is calculated based on the saturated unit weight (the cover layer is fully saturated). Since the soil is nearly saturated after rainfall infiltration, the matric suction decreases, leading to a reduction in shear strength (Cheng et al., 2024). Based on the strength reduction method (Liu and Su, 2023) and previous research experience (Siahkouhi et al., 2024; Mirnyy and Sidorov, 2016; Lizhong et al., 2024), the soil strength parameters are reduced by 5% for calculation and analysis (Sarkar and Chakraborty, 2021). The relative mechanical parameters obtained from previous field investigations and laboratory tests are summarized in Table 1. Note that the above parameters are obtained and calculated in strict accordance with the relevant experiment standards (https://www.astm.org/). (2) Under seismic condition, artificial synthetic seismic waves are used. The peak ground acceleration of rock with a 2% exceedance probability in a 100-year return period is used to obtain the dynamic amplification factor
where
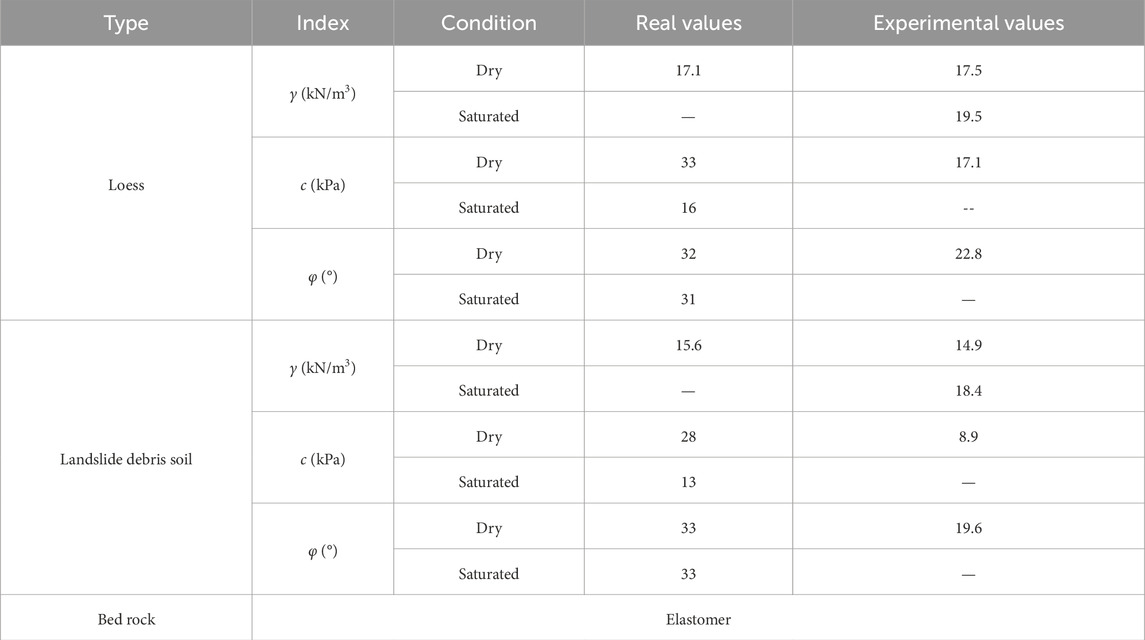
Table 1. Mechanical parameters of the soil in landslide zone.

Table 2. Design response spectrum for site bedrock.
Thereafter, the above parameters are used to study the deformation stability and failure process of the landslide under normal static, rainfall, and seismic conditions. A 2D plane strain method is adopted to evaluate and analyze the landslide. The landslide body adopts reduced integration elements (C3D8R), with a total of 7,712 nodes and 3,722 elements, as shown in Figure 4. The seismic waves are input from the bottom and sides of the landslide model in both horizontal and vertical directions, and the sides are set as non-reflective boundaries. The failure mode and process of the landslide are analyzed using a 2D finite element method.
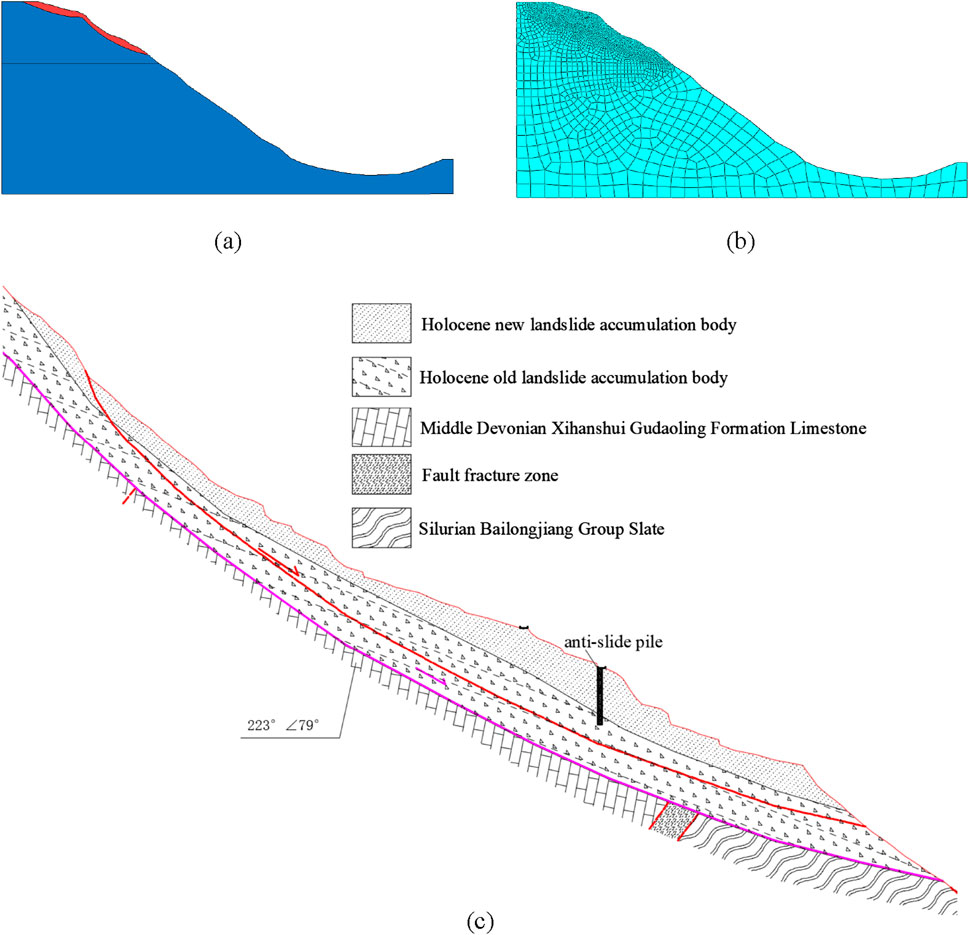
Figure 4. Landslide geological model, material partition, and meshing, (A) Stratigraphic division: 1-1’ profile of the landslide, (B) Meshing: 1-1’ profile of the landslide, (C)The geological model: 1-1’ profile of H1.
3.2.2 3D numerical simulation
This section aims to analyze the basic patterns of deformation, stability, and failure process of the landslide body under normal static, rainfall, and seismic conditions. The landslide is analyzed as a 2D plane strain problem, and the reduced integration elements (C3D8R and C3D4) are employed for simulations of the landslide body. There are a total of 283,725 nodes and 272,510 elements, as shown in Figure 5. Under seismic condition, seismic waves are input from the bottom of the landslide model in both the horizontal and vertical directions with non-reflecting boundary conditions on the sides. The stability, failure mode, and failure process of the landslide are analyzed using a 3D finite element method. The calculation follows the sign conventions in continuum mechanics, where stress is positive in compression and negative in tension. Displacement is given as a composite vector displacement (which is always positive, ignoring lateral and vertical components). The sliding surface of the landslide is determined based on the generalized shear strain (localized strain region).
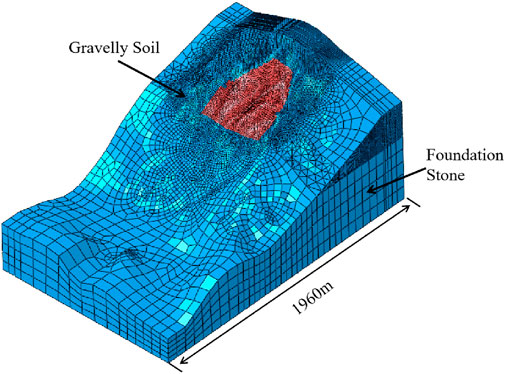
Figure 5. Meshing of the 3D landslide.
3.3 Results and analysis of numerical simulation
3.3.1 2D numerical simulation
3.3.1.1 Static condition
The stability analysis results of the landslide are presented in the form of generalized shear strain and displacement nephograms. The generalized shear strain reveals the potential sliding surface of the landslide, while the displacement determines the sliding distance of the landslide. Figures 6A, B shows the results obtained through strength reduction analysis when the landslide is in a critical sliding state. Figures 6C, D presents the displacement results for determining the Fs of the landslide (after sliding failure). Figure 7 depicts the displacement nephograms during the landslide failure process. Based on the field monitoring results, it is determined that the overall H1-1 main profile is quasi-stable under normal static condition with signs of localized deformation. Assuming a Fs of 1.03, the strength parameters of each soil layer are back-estimated and rounded to integers, as shown in Table 3.
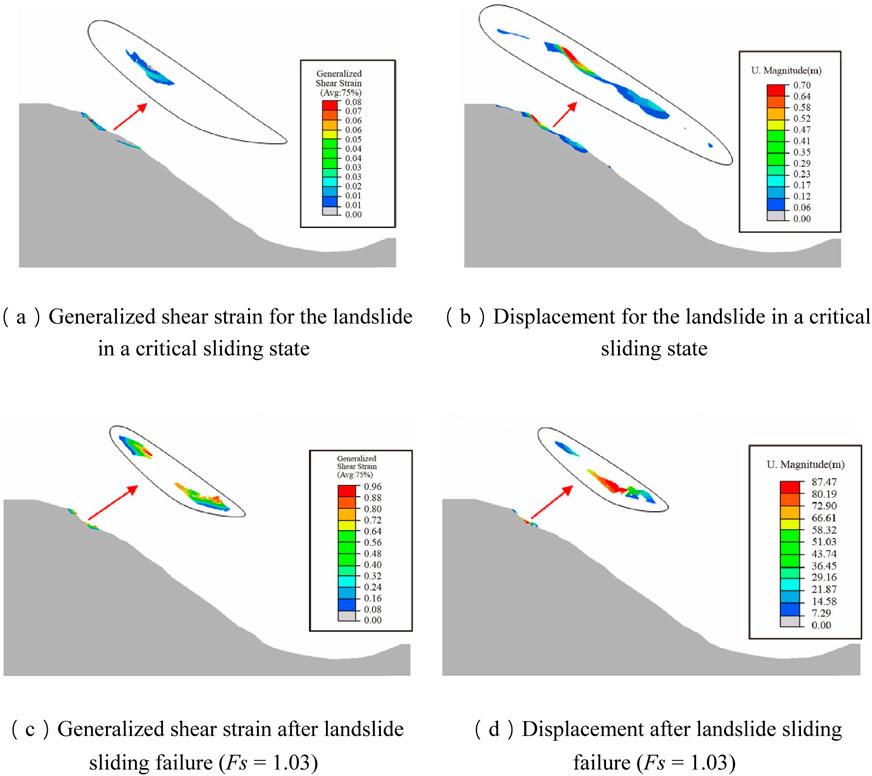
Figure 6. Results for the landslide in a critical sliding state and after landslide sliding failure (Fs = 1.03). (A) Generalized shear strain for the landslide in a critical sliding state (B) Displacement for the landslide in a critical sliding state (C) Generalized shear strain after landslide sliding failure (Fs = 1.03) (D) Displacement after landslide sliding failure (Fs = 1.03).
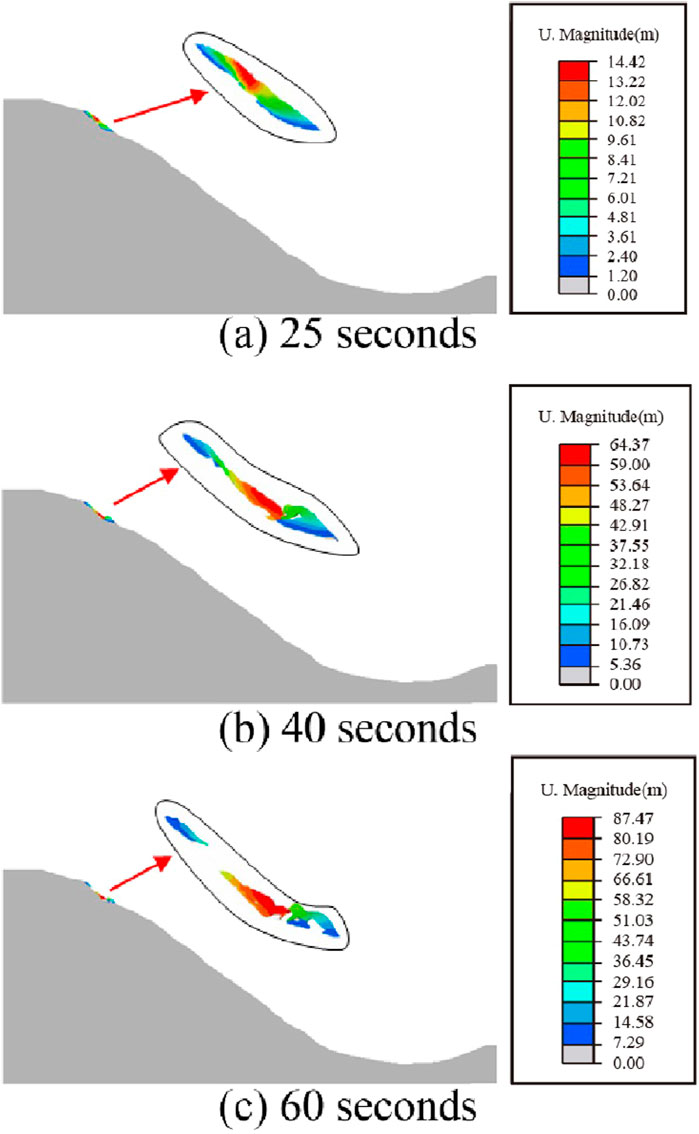
Figure 7. Displacement during the landslide failure process. (A) 25 s (B) 40 s (C) 60 s.
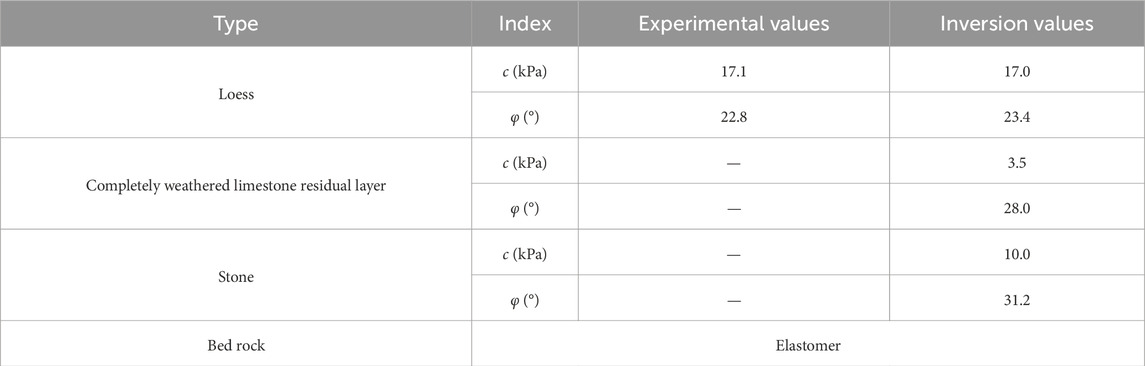
Table 3. Inversion value of strength parameters of landslide soil.
The stability analysis results of the landslide are presented in the form of generalized shear strain and displacement nephograms. The generalized shear strain indicates the potential sliding surface of the landslide, while the displacement contributes to determining the sliding distance of the landslide. The displacements and velocities during the failure process are extracted to plot the displacement and velocity transformation curves, as shown in Figure 8. The results indicate that the sliding failure initially occurs at the rear edge of the landslide. After the sliding failure at the rear edge, the front edge of the landslide also starts to slide. Under normal static condition, the maximum deformation of the landslide body is 0.78 m when the landslide is in a critical sliding state, while that is 87 m when the landslide is in an unstable sliding state. Therefore, a traction-type landslide is identified for normal static condition, where the sliding surface is predominantly along the residual layer of weathered gray sandstone.
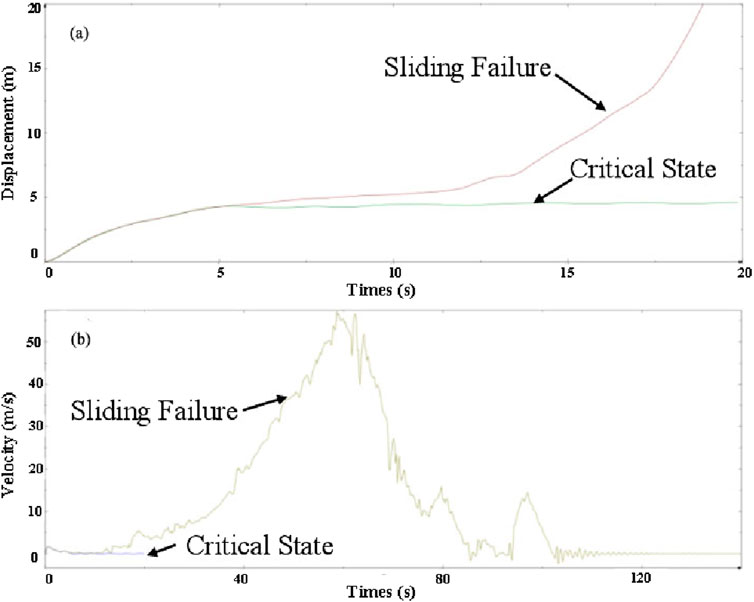
Figure 8. The curve of horizontal displacement (A) and variation of horizontal velocity (B) of the sliding body during the landslide process.
3.3.1.2 Rainfall condition
Figures 9A, B shows the results obtained through strength reduction analysis when the landslide is in a critical sliding state. Figures 9C, D shows the displacement results for determining the Fs of the landslide (i.e., sliding failure occurs). The results indicate that the final Fs of the landslide under rainfall condition considering strength reduction is 0.95.
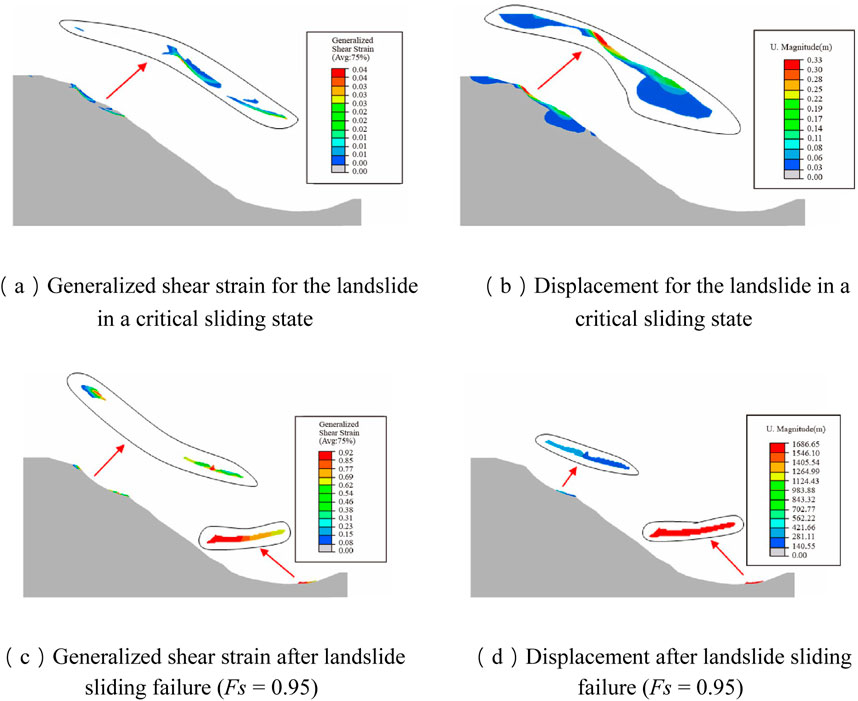
Figure 9. Results for the landslide in a critical sliding state and after landslide sliding failure (Fs = 0.95). (A) Generalized shear strain for the landslide in a critical sliding state (B) Displacement for the landslide in a critical sliding state (C) Generalized shear strain after landslide sliding failure (Fs = 0.95) (D) Displacement after landslide sliding failure (Fs = 0.95).
Figure 10 shows the displacement nephograms during the landslide failure process. The displacements and velocities during the failure process are extracted to plot the displacement and velocity transformation curves, as displayed in Figure 11. The results indicate that the sliding failure initially occurs at the rear edge of the landslide. After the sliding failure at the rear edge, the front edge of the landslide also starts to slide. Under rainfall condition, the maximum deformation of the landslide body is 0.33 m when the landslide is in a critical sliding state, while that is 1,687 m when the landslide is in an unstable sliding state. Therefore, the failure mode of the landslide under rainfall condition is characterized as a tension-controlled type, where the sliding surface is mainly along the weathered residual layer of the tuffaceous limestone.

Figure 10. Displacement during the landslide failure process. (A) 25 s (B) 40 s (C) 60 s.
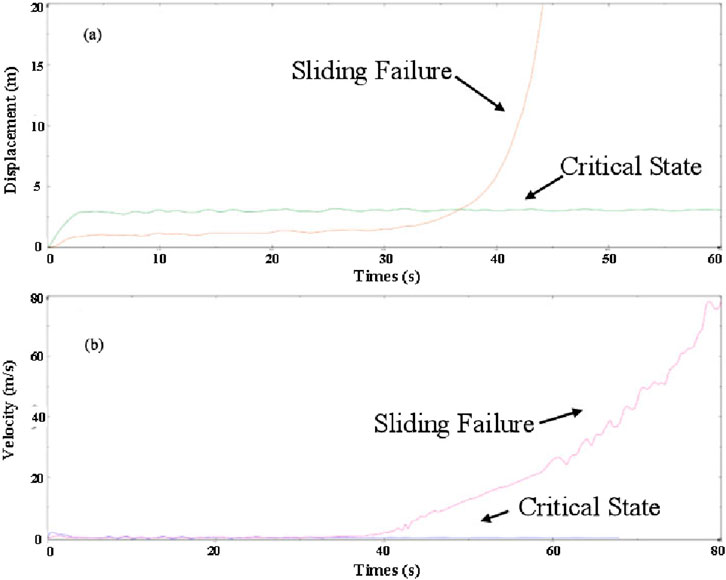
Figure 11. The curve of horizontal displacement (A) and variation of horizontal velocity (B) of the sliding body during the landslide process.
3.3.1.3 Seismic condition
Figures 12A, B illustrates the results obtained through strength reduction analysis when the landslide is in a critical sliding state. Figures 12C, D shows the displacement results for determining the Fs of the landslide (i.e., sliding failure occurs). The results indicate that the final Fs of the landslide under seismic condition considering strength reduction is 0.93.
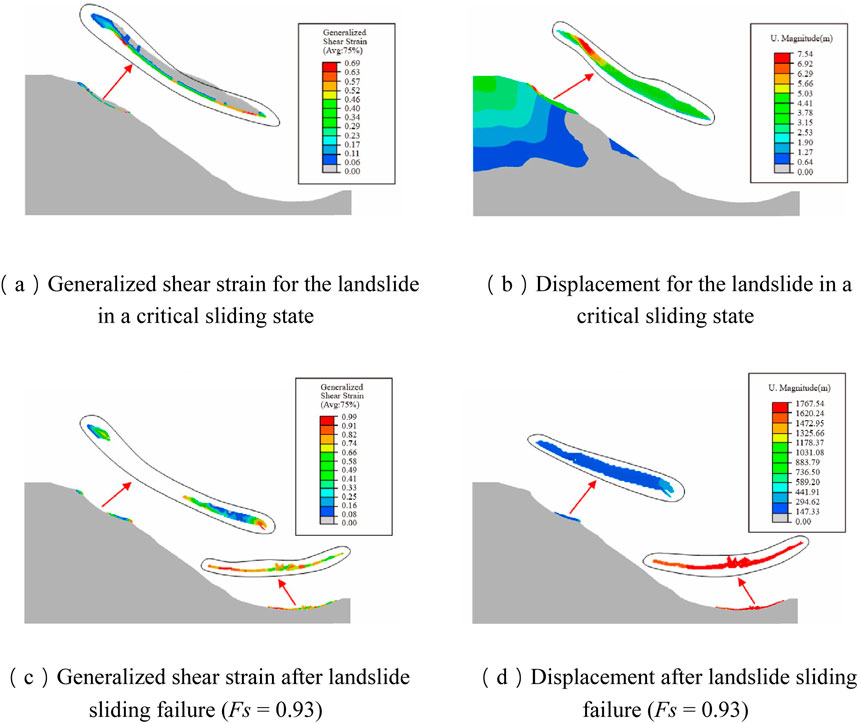
Figure 12. Results for the landslide in a critical sliding state and after landslide sliding failure (Fs = 0.93). (A) Generalized shear strain for the landslide in a critical sliding state (B) Displacement for the landslide in a critical sliding state (C) Generalized shear strain after landslide sliding failure (Fs = 0.93) (D) Displacement after landslide sliding failure (Fs = 0.93).
Figure 13 shows the displacement nephograms during the landslide failure process under seismic condition. The displacements and velocities during the failure process are extracted to plot the displacement and velocity transformation curves, as depicted in Figure 14. The maximum deformation of the landslide body is 7.64 m when the landslide is in a critical sliding state, while that is 1764 m when the landslide is in an unstable sliding state. Therefore, the failure mode of the landslide under seismic condition is characterized as a translational type, with multiple sliding surfaces. It primarily slides along the weathered residual layer of the tuffaceous limestone and the bottom of the gravelly soil layer during the early and late stages of the earthquake. Comparison with static condition and rainfall condition shows that the maximum deformation of landslide body when the landslide is in critical sliding state is the largest, then rainfall condition and static condition in that order. However, the above law does not apply in the case of a critical sliding state.
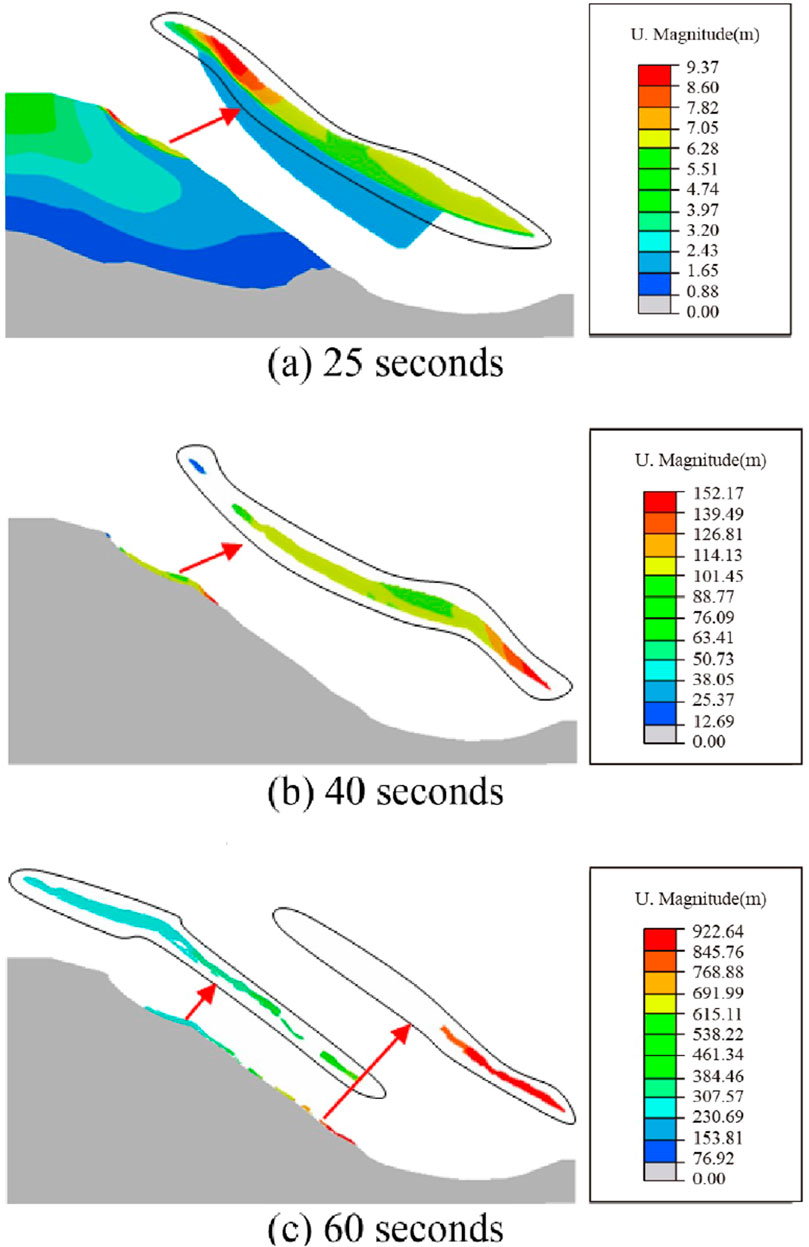
Figure 13. Displacement during the landslide failure process. (A) 25 s (B) 40 s (C) 60 s.
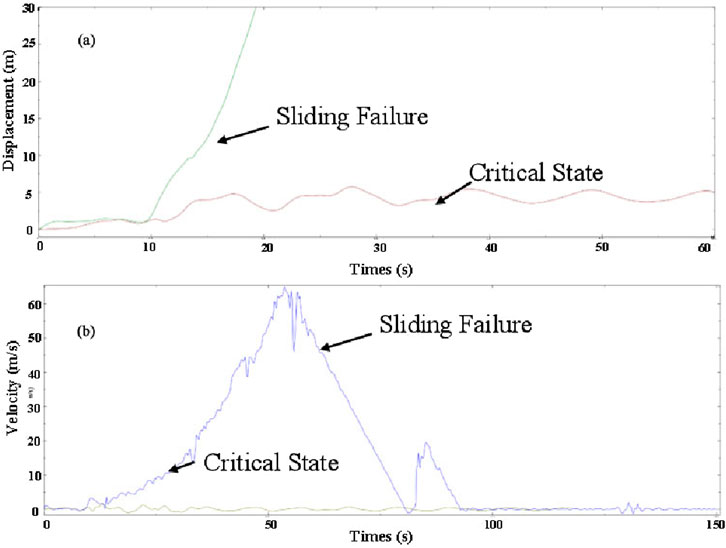
Figure 14. The curve of horizontal displacement (A) and variation of horizontal velocity (B) of the sliding body during the landslide process.
Following this approach, the calculated extreme values of stability for various slope profiles can be obtained under static, rainfall, and seismic conditions, as shown in Table 4. The critical sliding state (CS) and unstable sliding state (SF) are measured using the maximum deformation (m) and maximum sliding distance (m), respectively.
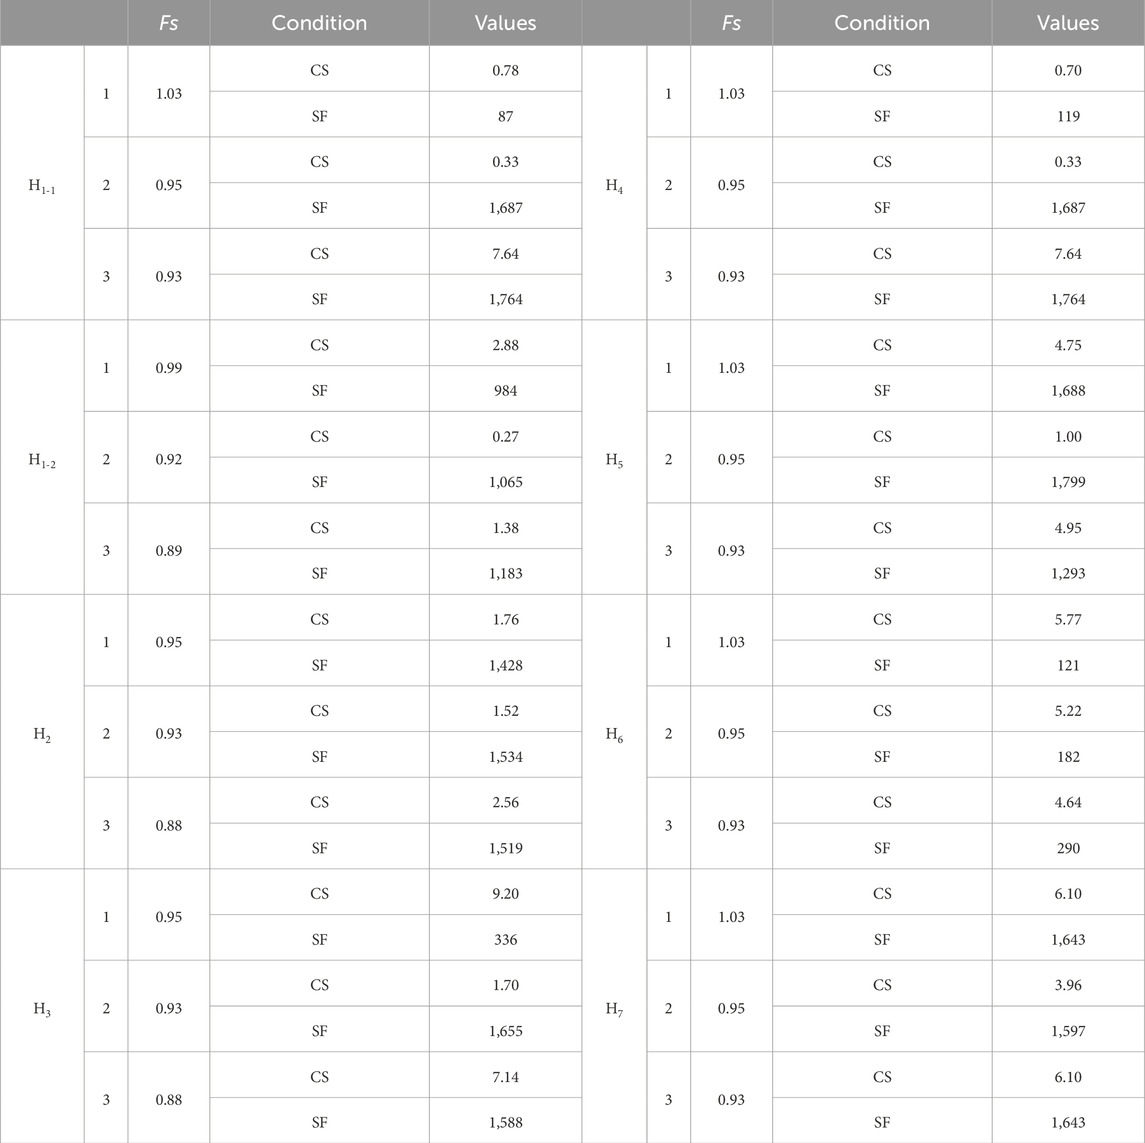
Table 4. Extreme values of slope stability.
3.3.2 3D numerical simulation
The final stability analysis results of the landslide under different conditions are shown in Figures 15A–D–17A–D–––D–D, which are presented in the form of generalized shear strain and displacement nephograms. The results indicate that the determined Fs values of the landslide considering strength reduction under static, rainfall, and seismic conditions are 1.04, 0.98, and 0.96, respectively, showing a decreasing trend. As for the failure process, the displacement results of the landslide under different conditions are illustrated in Figures 15E–H–17E–H–––H–H. Under normal static condition, the maximum deformation of the landslide body is 36.1 m when the landslide is in a critical sliding state, while that is 1,412 m when the landslide is in an unstable sliding state. Under rainfall condition, the maximum deformation is 53.94 m in the critical sliding state and 1,658 m in the unstable sliding state. Under seismic condition, the maximum deformation is 38.26 m in the critical sliding state and 2081 m in the unstable sliding state. Comparison with static condition and rainfall condition shows that the maximum deformation of landslide body when the landslide is in critical sliding state is the largest, then rainfall condition and static condition in that order. It is interesting that the max deformation of greatest under the rainfall condition, followed by seismic condition and normal static condition ini that order. However, the above phenomenon is also confirmed by 2D numerical simulation results, as shown in section 3.3.1. A trustworthy explanation is that rainfall conditions change the strength parameters of the geotechnical body of the slope, making the slope more susceptible to deformation and sliding under rainwater infiltration.
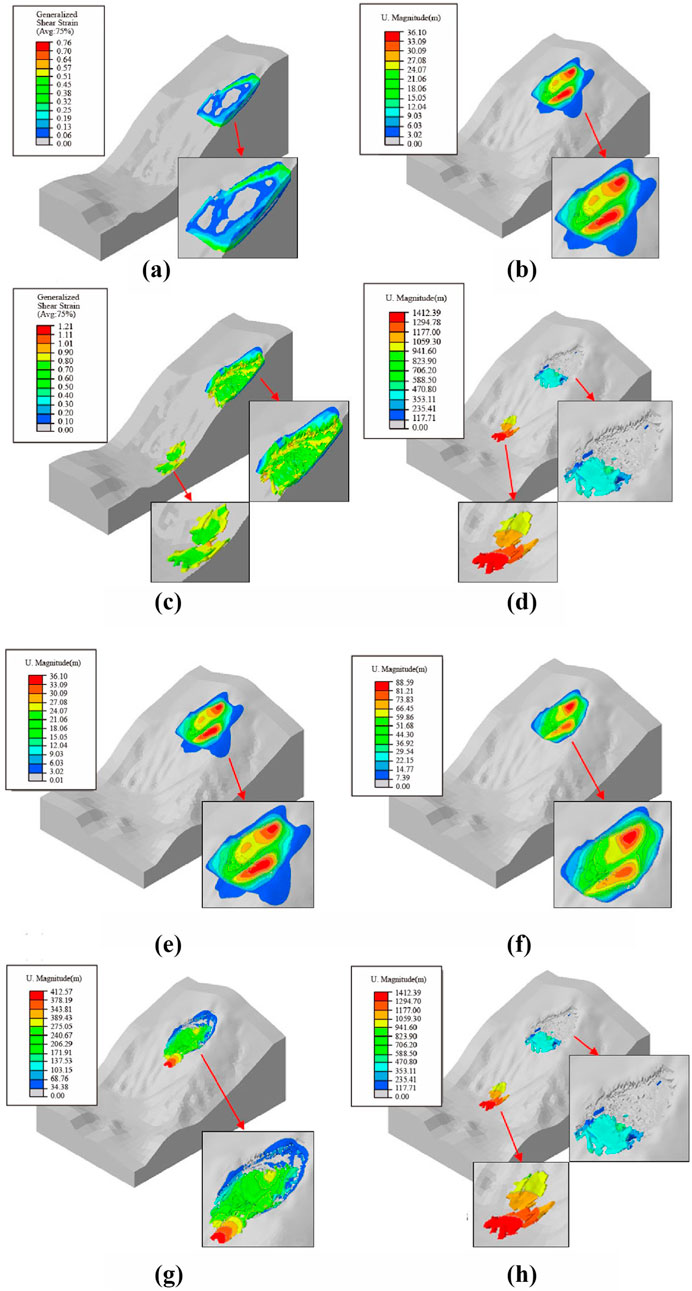
Figure 15. Generalized shear strain and displacement in the critical sliding state and the sliding failure state under static condition (the Fs is 1.04), and displacement during the landslide failure process under static condition. (A) is the generalized shear strain in the critical sliding state under static condition. (B) is the displacement in the critical sliding state under static condition. (C) is the generalized shear strain in the sliding failure state under static condition. (D) is the displacement in the sliding failure state under static condition. (E–H) is the displacement during the landslide failure process under static condition of 10 s, 20 s, 30 s and 50 s respectively.
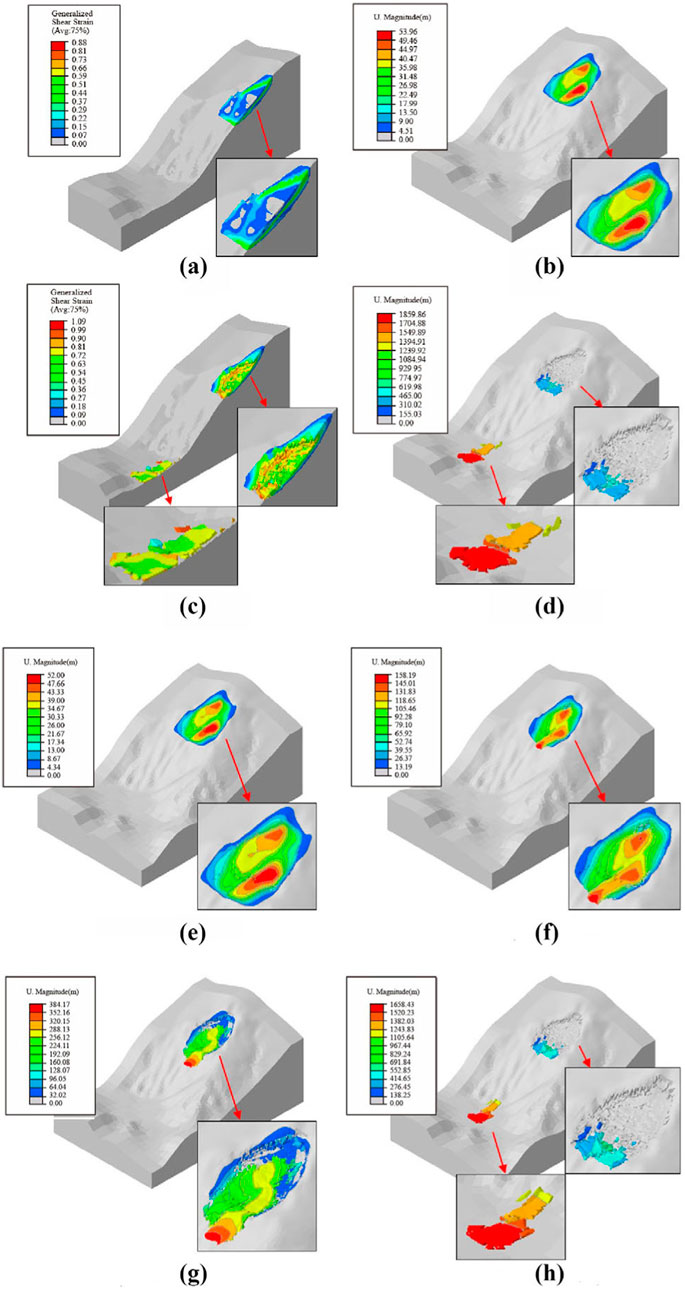
Figure 16. Generalized shear strain and displacement in the critical sliding state and the sliding failure state under rainfall condition (the Fs is 0.98), and displacement during the landslide failure process under rainfall condition (A) is the generalized shear strain in the critical sliding state under rainfall condition. (B) is the displacement in the critical sliding state under rainfall condition. (C) is the generalized shear strain in the sliding failure state under rainfall condition. (D) is the displacement in the sliding failure state under rainfall condition. (E–H) is the displacement during the landslide failure process under rainfall condition of 10 s, 20 s, 30 s, and 50 s respectively.
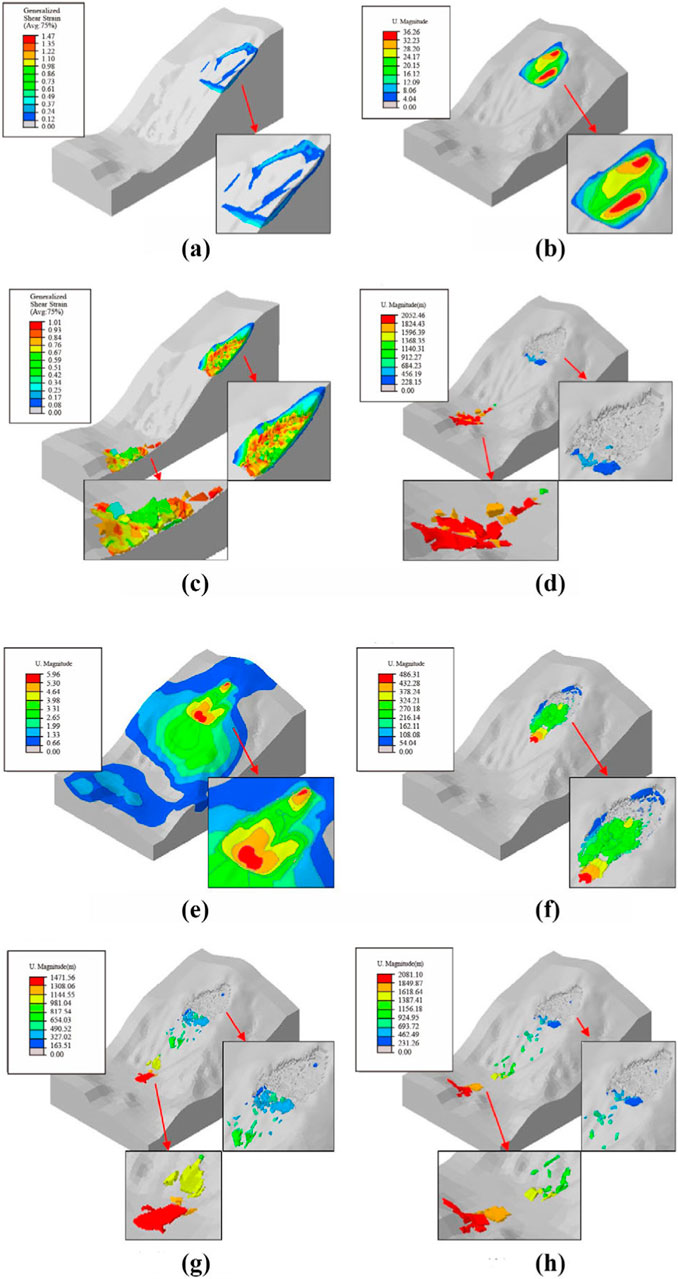
Figure 17. Generalized shear strain and displacement in the critical sliding state and the sliding failure state under seismic condition (the Fs is 0.96), and displacement during the landslide failure process under seismic condition (A) is the generalized shear strain in the critical sliding state under seismic condition. (B) is the displacement in the critical sliding state under seismic condition. (C) is the generalized shear strain in the sliding failure state under seismic condition. (D) is the displacement in the sliding failure state under seismic condition. (E–H) are the displacement during the landslide failure process under seismic condition of 10 s, 20 s, 30 s, and 50 s respectively.
4 Discussion
4.1 Limit equilibrium analysis of Lijie Beishan landslides
4.1.1 Calculation methods and operating conditions
As two significant and easily-applied approaches for slop stability analysis (Xiao, 2019; Zhang et al., 2017), the transfer coefficient method and the simplified Bishop method are used to quantitatively evaluate the stability of each model under static, rainfall, and earthquake conditions. The possible locations of shear and the most hazardous sliding surfaces for H1, H2, H3, H4, and H5 have been identified based on the principles of cross-section calculation and block division, as well as the findings from field surveys. However, it is not possible to determine the potential locations of shear and backward sliding for H6 and H7. Therefore, the calculated profiles are based on the automatic search results of shear location and backward position (Jia et al., 2024; Shi et al., 2023). There is no overlap between the different landslide blocks, and the cross-sections are divided by considering factors such as the terrain, block positions, and division principles, as demonstrated in Figure 18.
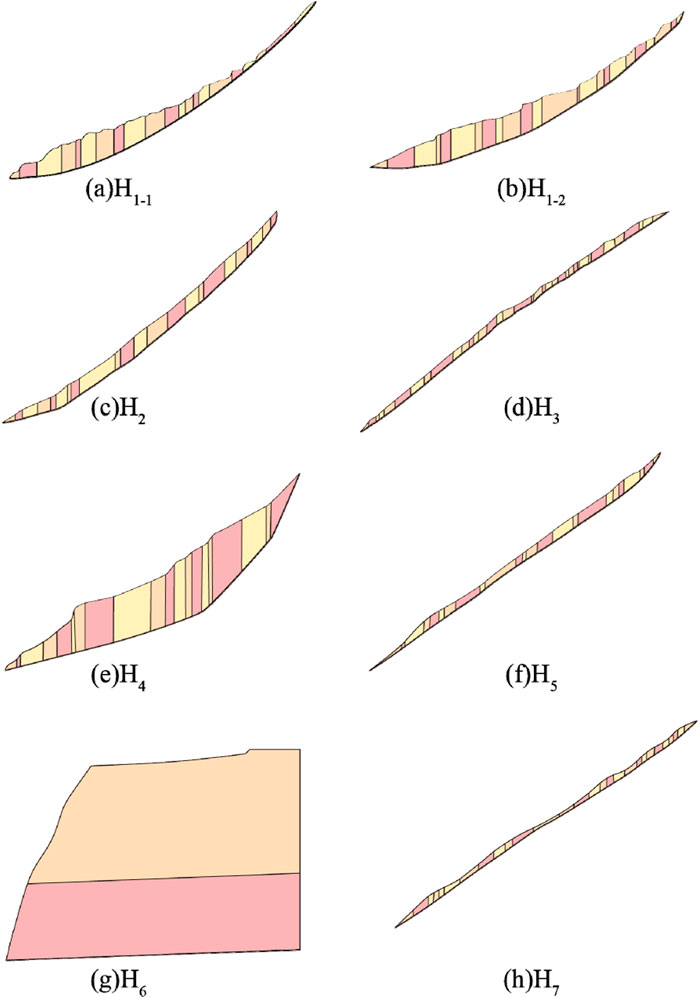
Figure 18. Cross-sections for quantitative evaluation of landslide stability. (A) Sliding surface position of H1-1 profile. (B) The sliding surface position of H1-2 profile. (C) Position of sliding surface of H2 profile. (D) The sliding surface position of H3 profile. (E) The sliding surface position of H4 profile. (F) Sliding surface position of H5 profile. (G) Sliding surface position of H6 profile. (H) The sliding surface position of H7 profile.
The stability of colluvial landslides with broken sliding surfaces is evaluated by the transfer coefficient method. This method is applied to calculations of H1, H2, H3, H4, H5, and H7 , which is expressed as the following Equations 8–12:
where K is the stability factor, Wi is the weight of the i-block (kN/m), ci is the cohesion of the i-block (kPa), φi is the angle of shearing resistance of the i-block (°), Li is the length of the i-block (m), A is the earthquake acceleration, rv is the ratio of pore water pressure, which is not calculated in this case because the local water content of the sliding body has not yet formed a uniform water level.
where yi is the transfer coefficient (j =1) when the residual sliding force of the i-block is transferred to the (i+1)-block:
The simplified Bishop method that evaluates the stability of the colluvial landslide with a single plane or arc sliding surface is applied to the calculation of H6, as the following Equations 13, 14:
where K is the stability factor of the residual sliding force calculation of the whole sliding body, b is the length of the single block (m), W is the weight of the single block (KN), θ is the angle between the gravity line of the block and the radius of the midpoint passing through the bottom of the block, C and φ are the cohesion and internal friction angle, respectively, Since no groundwater is identified in the slope area, the groundwater hydrodynamic pressure is not considered in the calculation Pwi.
Calculation conditions: 1) Self-weight, 2) Self-weight + rainfall, and 3) Self-weight + earthquake. Rainfall intensity: the rainfall intensity recurrence period is 100 years. Earthquake load standard:the seismic fortification intensity in Zhouqu County is 8°, the design basic seismic acceleration is 0.20 g, and the design seismic group is the third group. Furthermore, After analyzing the test results of the current samples, parameters of samples collected from neighboring sites, and combining them with the back-calculation of the physical and mechanical parameters of the soil under the current conditions, the calculated values are used as the comprehensive values for the soil investigation of this study, as shown in Table 5.
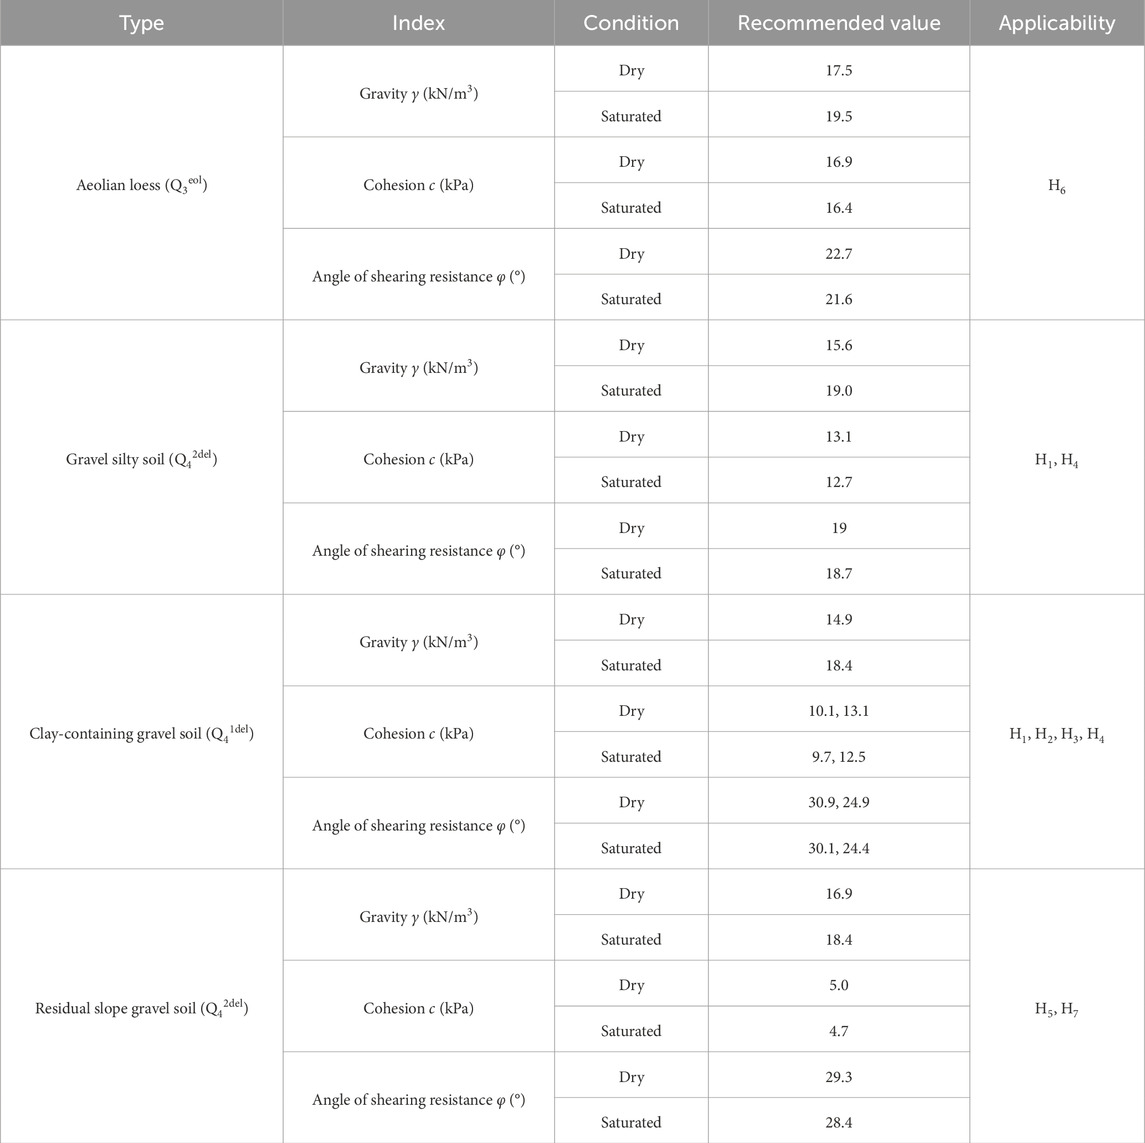
Table 5. Calculated values of the soil in landslide sliding zone.
4.1.2 Results of stability analysis
The stability factor value used to determine the stability state of landslide are the most crucial factor that prompted several authors to use it to classify the slope stability and evaluate the landslide disasters (Kamal et al., 2023; Huang et al., 2018). The stability state of landslides can be classified into four categories based on the stability factor. K < 1.00, 1.0 ≤ K < 1.05, 1.05 ≤ K < 1.15, and K ≥ 1.15 indicates that the slope is unstable, slightly stable, essentially stable, and stable, respectively. Based on the back-calculated soil parameters, typical profiles corresponding to each landslide body are selected for stability calculations. The results are listed in Table 6.
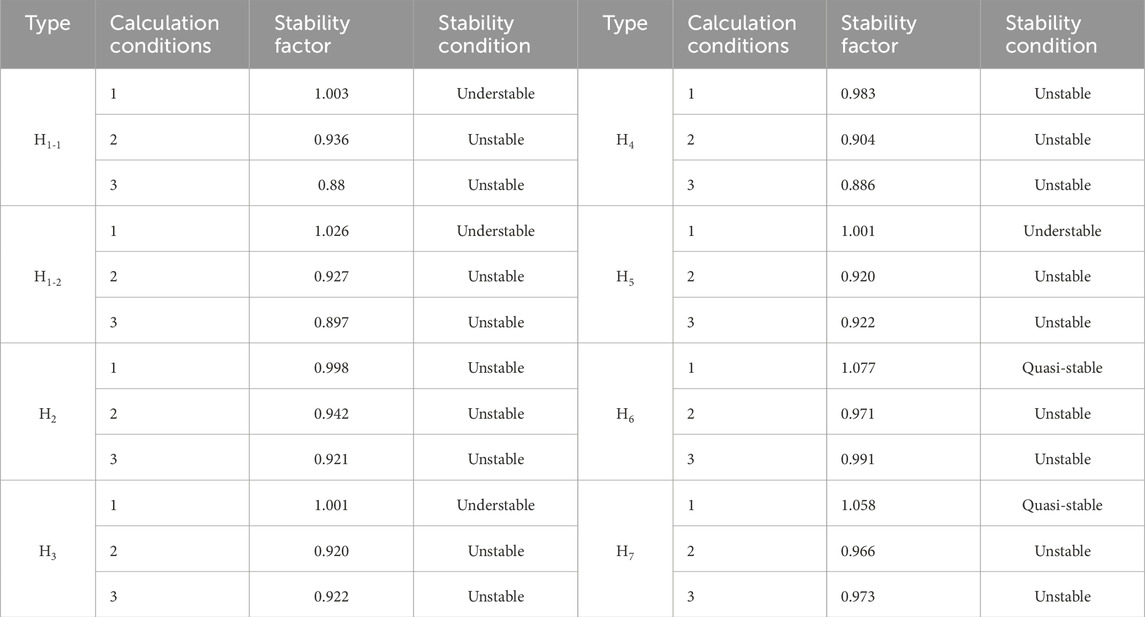
Table 6. Stability results of the landslide.
4.2 The difference between limit equilibrium method and numerical simulation method
The safety factor calculation results of the transfer coefficient method and numerical simulation method both show that the landslide is in an unstable state. The comparison of slope safety factors under the three working conditions is shown in Figure 19. From Figure 19, it can be seen that the safety factor calculation results of the two methods are basically consistent, with a calculation error of less than 0.5. The transfer coefficient method is used to calculate the sliding surface given by the on-site investigation results, while the finite element method is used to calculate the landslide terrain and material strength. The calculation principles of the two methods are different, which leads to subtle differences in the division of sliding surfaces and the calculation results of safety factors. In conclusion, the landslide exhibits a tension-controlled failure mode under normal static and rainfall conditions, while it exhibits a translational failure mode under seismic condition. The above results are in good agreement with the findings of the field survey. As shown in Figure 19, there are visible tensile cracks at the trailing edge of the landslide. Also, it is interesting that the shaking table tests carried by Feng et al. (2024). Indicated that the slope exhibits less stability and many cracks after rainfall, and the development of cracks and the potential sliding surfaces of landslide remained consistent under the seismic condition. It exhibits a translational failure mode controlled by the seismic condition. More importantly, the Fs is the lowest under seismic condition, indicating a higher susceptibility to instability during seismic. Under seismic condition, the landslide has two sliding surfaces along the interface between the loess and the weathered residual layer and the interface between the gravelly soil layer and the bedrock. The landslide has the largest volume and the largest sliding distance under seismic condition compared to the other two conditions. The above findings are in good agreement with the findings of Yunus et al. (2023)’s study, which built the scaling relationship to determine the volume of landslide based on pre- and post- event LiDAR elevation models for 2018 Hokkaido-lburi seimic epicentral region. Similar results have been demonstrated by Valagussa et al. (2021) and Wang et al. (2023). The calculation results of the two methods in this article show high consistency, and the above two methods show that the landslide is in an unstable state.
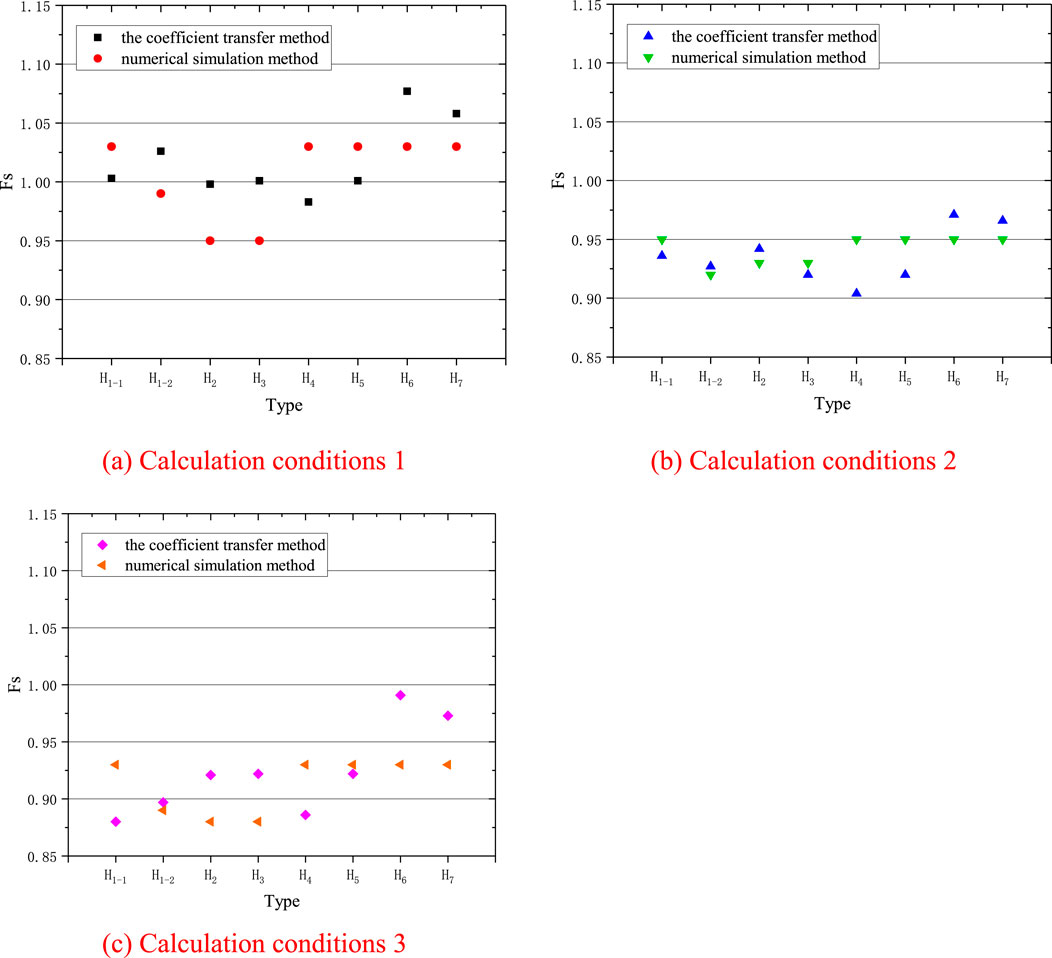
Figure 19. Comparison of safety factor calculation results. (A) Calculation conditions 1 (B) Calculation conditions 2 (C) Calculation conditions 3.
4.3 Comprehensive evaluation of stability
The investigation of the landslide indicates that it has undergone years of creep deformation. The local rainstorm and domestic water have a great impact on the landslide. The interaction between continuous precipitation and drainage erosion and human engineering activities is intensifying the deformation of the landslide. The current trend is in an unstable state. Under extreme climatic conditions such as rainstorm, the landslide is in an unstable state as a whole, which may lead to overall shear slip. Meanwhile, the results obtained from the coefficient transfer method and numerical modeling are also in good accordance with the findings of field observation. These two approaches employed in combination with traditional tools and filed investigations, as well as the relationship among the findings from the above methods, are helpful for probing the stability state of the slope under the rainfall and seismic conditions (Xu et al., 2018). Hence, Comprehensive evaluation of slope stability under complex conditions can be attempted by considering the advantages of multiple methods and combining them to form a comprehensive evaluation method to reveal the stability of landslides and predict the intensity of landslide hazards.
5 Conclusion
In this study, we presented a comprehensive evaluation of Lijie Beishan landslide based on slope stability analysis and numerical simulation under static, rainfall, and seismic conditions. 2D and 3D numerical modelling were used to reproduce the failure process of this landslide. The coefficient transfer method and the simplified Bishop method are used for verification analysis.
The old landslide (H1) and secondary landslide (H2-7) are spread throughout the Lijie Beishan landslide region. Progressively increasing rainwater, intense tectonic movements driven by the Zhouqu – Wudu seismic subzone and high-intensity human engineering activities (e.g., road construction, buildings, drainage ditches) are the key factor that triggered the landslide disaster.
The 2D numerical simulation results indicate that Fs of landslide considering strength reduction under static, rainfall, and seismic conditions are 1.04, 0.98, and 0.96. The maximum deformation for the critical sliding state and the unstable sliding state is 36.1 m and 1,412 m, 53.94 m and 1,658 m, 38.26 m and 2081 m. The 3D numerical simulation results indicate that final Fs of landslide under normal static, rainfall and seismic conditions is 1.03, 0.95 and 0.93 for Lijie Beishan landslide, respectively. The landslide will be unstable sliding state when the maximum deformation of landslide body reaches 87 m, 1,687 m and 1764 m. The calculation results of The coefficient transfer method and the simplified Bishop method are consistent with the numerical simulation results.
Lijie Beishan landslide exhibits a tension-controlled failure mode under normal static and rainfall conditions, while it exhibits a translational failure mode under seismic condition. The landslide has the largest volume and the largest sliding distance under seismic condition compared to the other two conditions.
With increased geologic and human engineering activities, the area may create more unstable slopes in the future under the influence of climatic factors such as precipitation. Although the stability of the landslide was well evaluated with the help of the method proposed in this paper, and then limited by the complex and variable geological conditions and the limitations of various methods. In the future, it is necessary to comprehensively consider the advantages of a variety of methods, and combine them to form a comprehensive evaluation method for revealing the stability of landslides and predicting the intensity of landslide disasters, which can try to comprehensively evaluate the stability of slopes under complex conditions.
Data availability statement
The original contributions presented in the study are included in the article/supplementary material, further inquiries can be directed to the corresponding authors.
Author contributions
WY: Conceptualization, Formal Analysis, Funding acquisition, Writing–original draft. YZ: Conceptualization, Data curation, Writing–review and editing. LZ: Investigation, Methodology, Writing–original draft. GB: Investigation, Methodology, Writing–review and editing. BW: Investigation, Methodology, Writing–review and editing. NA: Investigation, Methodology, Software, Writing–original draft.
Funding
The author(s) declare that financial support was received for the research, authorship, and/or publication of this article. This research is funded by Special Fund for Geological Disaster Prevention and Control of Gansu Provincial Department of Natural Resources (20230209GYY).
Conflict of interest
Author YZ was employed by China Construction Eighth Engineering Division Corp., Ltd.
The remaining authors declare that the research was conducted in the absence of any commercial or financial relationships that could be construed as a potential conflict of interest.
Publisher’s note
All claims expressed in this article are solely those of the authors and do not necessarily represent those of their affiliated organizations, or those of the publisher, the editors and the reviewers. Any product that may be evaluated in this article, or claim that may be made by its manufacturer, is not guaranteed or endorsed by the publisher.
References
Bi, R., Ehret, D., Xiang, W., Rohn, J., Schleier, M., and Jiang, J. (2012). Landslide reliability analysis based on transfer coefficient method: a case study from Three Gorges Reservoir. J. Earth Sci. 23 (2), 187–198. doi:10.1007/s12583-012-0244-7
Bogaard, T., and Greco, R. (2018). Invited perspectives: hydrological perspectives on precipitation intensity-duration thresholds for landslide initiation: proposing hydro-meteorological thresholds. Nat. Hazards Earth Syst. Sci. 18 (1), 31–39. doi:10.5194/nhess-18-31-2018
Chang, Z., Huang, F., Huang, J., Jiang, S. H., Liu, Y., Meena, S. R., et al. (2023). An updating of landslide susceptibility prediction from the perspective of space and time. Geosci. Front. 14 (5), 101619. doi:10.1016/j.gsf.2023.101619
Cheng, H., Wu, Z., Chen, H., and Zhou, X. (2024). Stability analysis of unsaturated–saturated soil slopes under rainfall infiltration using the rigorous limit equilibrium method. Bull. Eng. Geol. Environ. 83 (4), 147. doi:10.1007/s10064-024-03623-y
Chen, X., Chuan, Y., and Wei, Y. (2021). Calculation of the coseismic landslide volume using DEMs: an example from the yingxiu area, wenchuan, sichuan, China. Adv. Civ. Eng., 1–9. doi:10.1155/2021/6646709
Conte, E., Pugliese, L., and Troncone, A. (2022). A simple method for predicting rainfall-induced shallow landslides. J. Geotechnical Geoenvironmental Eng. 148 (10), 1–12. doi:10.1061/(ASCE)GT.1943-5606.0002877
Feng, H., Jiang, G., He, Z., Guo, Y., He, X., He, B., et al. (2024). Dynamic response and failure characteristics of a slope with bedrock subjected to earthquakes and rainfall in shaking table tests. Bull. Eng. Geol. Environ. 83 (7), 265. doi:10.1007/s10064-024-03748-0
Flentje, P., and Chowdhury, R. (2018). Resilience and sustainability in the management of landslides. Proc. Institution Civ. Eng. - Eng. Sustain. 171 (1), 3–14. doi:10.1680/jensu.16.00045
Gao, L., Pastor, M., Li, T., Moussavi Tayyebi, S., Hernandez, A., Liu, X., et al. (2023b). A framework coupled neural networks and SPH depth integrated model for landslide propagation warning. Acta Geotech. 18 (7), 3863–3888. doi:10.1007/s11440-022-01774-4
Gao, Y., Zhang, Y., Ma, C., Zheng, X., Li, T., Zeng, P., et al. (2023a). Failure process and stability analysis of landslides in Southwest China while considering rainfall and supporting conditions. Front. Environ. Sci. 10, 1084151. doi:10.3389/fenvs.2022.1084151
Huang, F. M., Li, R. H., Catani, F., Zhou, X. T., Zeng, Z. Q., and Huang, J. S. (2024d). Uncertainties in landslide susceptibility prediction: influence rule of different level of errors in landslide spatial position. J. Rock Mech. Geotechnical Eng. doi:10.1016/j.jrmge.2024.02.001
Huang, F. M., Mao, D. X., Jiang, S. H., Zhou, C., Fan, X., Zeng, Z., et al. (2024c). Uncertainties in landslide susceptibility prediction modeling: a review on the incompleteness of landslide inventory and its influence rules. Geosci. Front. 15, 101886. doi:10.1016/j.gsf.2024.101886
Huang, F. M., Teng, Z. K., Yao, C., Jiang, S. H., Catani, F., Chen, W., et al. (2024b). Uncertainties of landslide susceptibility prediction: influences of random errors in landslide conditioning factors and errors reduction by low pass filter method. J. Rock Mech. Geotechnical Eng. 16 (1), 213–230. doi:10.1016/j.jrmge.2023.11.001
Huang, F. M., Xiong, H. W., Jiang, S. H., Yao, C., Fan, X., Catani, F., et al. (2024a). Modelling landslide susceptibility prediction: a review and construction of semi-supervised imbalanced theory. Earth-Science Rev. 250, 104700. doi:10.1016/j.earscirev.2024.104700
Huang, H. W., Wen, S. C., Zhang, J., Chen, F. Y., Martin, J. R., and Wang, H. (2018). Reliability analysis of slope stability under seismic condition during a given exposure time. Landslides 15 (11), 2303–2313. doi:10.1007/s10346-018-1050-9
Jiao, Y. Y., Wang, Z. H., Wang, X. Z., Adoko, A. C., and Yang, Z. X. (2013). Stability assessment of an ancient landslide crossed by two coal mine tunnels. Eng. Geol. 159 (July 2010), 36–44. doi:10.1016/j.enggeo.2013.03.021
Jia, X., Jiang, X., Huang, J., Yu, S., and Liu, B. (2024). Slope stability analysis based on the explicit smoothed particle finite element method. Sustainability 16 (2), 702. doi:10.3390/su16020702
Kamal, A. S. M. M., Hossain, F., Ahmed, B., Rahman, M. Z., and Sammonds, P. (2023). Assessing the effectiveness of landslide slope stability by analysing structural mitigation measures and community risk perception. Nat. Hazards 117 (3), 2393–2418. doi:10.1007/s11069-023-05947-6
Liu, M., Yang, W., Xu, C., Yang, Y., Taylor, L., and Shi, P. (2024). Impact of precipitation on Beishan landslide deformation from 1986 to 2023. Front. Earth Sci. 11. doi:10.3389/feart.2023.1304969Available at: https://www.frontiersin.org/journals/earth-science/articles/10.3389/feart.2023.1304969/full.
Liu, X., and Su, M. (2023). Double strength reduction method for slope stability analysis based on water content variation: a study and engineering application. Water 15 (6), 1194. doi:10.3390/w15061194
Lizhong, Y., Shiyang, L., and Lianghua, M. (2024). Numerical simulation analysis of slope stability from rainwater utilizing the Civil3D+Flac3D coupling. Desalination Water Treat. 319, 100517. doi:10.1016/j.dwt.2024.100517
Lombardo, L., and Mai, P. M. (2018). Presenting logistic regression-based landslide susceptibility results. Eng. Geol. 244 (July), 14–24. doi:10.1016/j.enggeo.2018.07.019
Luo, G., Ren, G., Bao, X., Yang, X., and Liu, T. (2021). Stability analysis of the shiliushubao landslide based on deformation characteristics and external trigger factors in the three gorges reservoir. Adv. Civ. Eng. 2021, 1–12. doi:10.1155/2021/2714918
Ma, Z., Liao, H., Dang, F., and Cheng, Y. (2021). Seismic slope stability and failure process analysis using explicit finite element method. Bull. Eng. Geol. Environ. 80 (2), 1287–1301. doi:10.1007/s10064-020-01989-3
Mirnyy, A., and Sidorov, V. (2016). Impact of strength parameters choice on slope stability coefficient value for numerical simulation. Procedia Eng. 165, 1353–1358. doi:10.1016/j.proeng.2016.11.864
Qi, T., Zhao, Y., Meng, X., Shi, W., Qing, F., Chen, G., et al. (2021). Distribution modeling and factor correlation analysis of landslides in the large fault zone of the western qinling mountains: a machine learning algorithm. Remote Sens. 13 (24), 4990. doi:10.3390/rs13244990
Sarkar, S., and Chakraborty, M. (2021). Stability analysis for two-layered slopes by using the strength reduction method. Int. J. Geo-Engineering 12 (1), 24. doi:10.1186/s40703-021-00153-4
Shah, N. A., Shafique, M., Ishfaq, M., Faisal, K., and Van der Meijde, M. (2023). Integrated approach for landslide risk assessment using geoinformation tools and field data in hindukush mountain ranges, northern Pakistan. Sustainability 15 (4), 3102. doi:10.3390/su15043102
Shi, C., Ma, J. C., Zhou, Y. X., Zhang, Y. P., and Pian, J. B. (2023). Three-dimensional slope stability analysis method based on perturbation displacement isosurface[J/OL]. Nat. Hazards 116 (2), 2157–2171. doi:10.1007/s11069-022-05758-1
Siahkouhi, M., Pletzer, C., Marcher, T., and Schneider-Muntaua, B. (2024) Investigation on shear strength parameters of soil and soft rock material in the low stress range[J/OL]. Int. J. Geotechnical Eng. 1–9. doi:10.1080/19386362.2024.2314893
Süzen, M. L., and Kaya, B. Ş. (2012). Evaluation of environmental parameters in logistic regression models for landslide susceptibility mapping. Int. J. Digital Earth 5 (4), 338–355. doi:10.1080/17538947.2011.586443
Tayyebi, S. M., Pastor, M., Stickle, M. M., Yagüe, Á., Manzanal, D., Molinos, M., et al. (2022). SPH numerical modelling of landslide movements as coupled two-phase flows with a new solution for the interaction term. Eur. J. Mech. - B/Fluids 96, 1–14. doi:10.1016/j.euromechflu.2022.06.002
Tian, N., and Lan, H. (2023). The indispensable role of resilience in rational landslide risk management for social sustainability. Geogr. Sustain. 4 (1), 70–83. doi:10.1016/j.geosus.2022.11.007
Troncone, A., Pugliese, L., Parise, A., and Conte, E. (2022). A simple method to reduce mesh dependency in modelling landslides involving brittle soils. Géotechnique Lett. 12 (3), 167–173. doi:10.1680/jgele.22.00023
Troncone, A., Pugliese, L., Parise, A., and Conte, E. (2023). A practical approach for predicting landslide retrogression and run-out distances in sensitive clays. Eng. Geol. 326 (October), 107313. doi:10.1016/j.enggeo.2023.107313
Tsangaratos, P., and Benardos, A. (2014). Estimating landslide susceptibility through a artificial neural network classifier. Nat. Hazards 74 (3), 1489–1516. doi:10.1007/s11069-014-1245-x
Valagussa, A., Frattini, P., Valbuzzi, E., and Crosta, G. B. (2021). Role of landslides on the volume balance of the Nepal 2015 earthquake sequence. Sci. Rep. 11 (1), 3434. doi:10.1038/s41598-021-83037-y
Wang, C., Hawlader, B., Perret, D., Soga, K., and Chen, J. (2021). Modeling of initial stresses and seepage for large deformation finite-element simulation of sensitive clay landslides. J. Geotechnical Geoenvironmental Eng. 147 (11), 1–15. doi:10.1061/(ASCE)GT.1943-5606.0002626
Wang, S., Xu, W., and Liu, J. (2018). Stability and failure mechanism analyses of the zhenggang landslide in southwestern China. Adv. Civ. Eng. 2018, 1–16. doi:10.1155/2018/6128401
Wang, X., Huang, X., Chen, P., Xu, L., Wang, H., Deng, W., et al. (2023). Effects of mass entrainment on the estimation of landslide parameters from long-period seismic inversion. J. Seismol. 27 (4), 753–767. doi:10.1007/s10950-023-10165-5
Xiao, S. (2019). Improved transfer coefficient method for stability analysis of a landslide with polyline slip surface. Indian Geotechnical J. 49 (6), 595–602. doi:10.1007/s40098-018-0331-5
Xu, N., Wu, J., Dai, F., and Fan, Y. (2018). Comprehensive evaluation of the stability of the left-bank slope at the Baihetan hydropower station in southwest China. Bull. Eng. Geol. Environ. 77 (4), 1567–1588. doi:10.1007/s10064-017-1018-3
Ye, T., Xie, Q., Wang, Y., An, Y., and Jin, J. (2018). Analog modeling of sand slope stability with different precipitation conditions. J. Mod. Transp. 26 (3), 200–208. doi:10.1007/s40534-018-0163-0
Yunus, A. P., Xinyu, C., Catani, F., Subramaniam, S. S., Fan, X., Jie, D., et al. (2023). Earthquake-induced soil landslides: volume estimates and uncertainties with the existing scaling exponents. Sci. Rep. 13 (1), 8151. doi:10.1038/s41598-023-35088-6
Zhang, T., Cai, Q., Han, L., Shu, J., and Zhou, W. (2017). 3D stability analysis method of concave slope based on the Bishop method. Int. J. Min. Sci. Technol. 27 (2), 365–370. doi:10.1016/j.ijmst.2017.01.020
Zhang, Y., Zhu, S., Tan, J., Li, L., and Yin, X. (2020). The influence of water level fluctuation on the stability of landslide in the Three Gorges Reservoir. Arabian J. Geosciences 13 (17), 845. doi:10.1007/s12517-020-05828-3
Zhang, Z., Wang, W., and Zhang, Y. (2021). Improvement of transfer coefficient method under the consideration of hydrodynamic pressure. Eng. Fail. Anal. 124 (February), 105321. doi:10.1016/j.engfailanal.2021.105321
Zhou, H., Wang, Y., Shen, T., and Feng, Q. (2019). The comprehensive treatment of the ancient landslide deformable body in the giant deep rock bedding based on the FLAC analysis model. Earth Sci. Res. J. 23 (4), 303–308. doi:10.15446/esrj.v23n4.84008
Keywords: rainfall, earthquake, landslide, numerical simulation, stability
Citation: Yang W, Zhang Y, Zhang L, Bai G, Wan B and An N (2024) Comprehensive study on the stability and failure mechanism of landslides under rainfall and earthquake in northwest mountainous areas. Front. Earth Sci. 12:1470083. doi: 10.3389/feart.2024.1470083
Received: 25 July 2024; Accepted: 27 August 2024;
Published: 13 September 2024.
Edited by:
Faming Huang, Nanchang University, ChinaReviewed by:
Thapthai Chaithong, Kasetsart University, ThailandSong Changho, Pukyong National University, Republic of Korea
Noor Sheena Herayani Harith, Universiti Malaysia Sabah, Malaysia
Copyright © 2024 Yang, Zhang, Zhang, Bai, Wan and An. This is an open-access article distributed under the terms of the Creative Commons Attribution License (CC BY). The use, distribution or reproduction in other forums is permitted, provided the original author(s) and the copyright owner(s) are credited and that the original publication in this journal is cited, in accordance with accepted academic practice. No use, distribution or reproduction is permitted which does not comply with these terms.
*Correspondence: Yonggang Zhang, ZGVtb256aGFuZ3lnQDE2My5jb20=; Lei Zhang, Z2VvemwyMDI0QDEyNi5jb20=