- 1School of Civil Engineering, Beijing Jiaotong University, Beijing, China
- 2Beijing Urban Rail Transit Safety and Disaster Prevention Engineering and Technology Research Center, Beijing, China
- 3Beijing Institute of Geology and Mineral Exploration, Beijing, China
Managed Aquifer Recharge (MAR) has been implemented in the upper alluvial plain of the Chaobai River, significantly affecting the groundwater level and causing it to rise. However, the effects of the MAR on land subsidence,remain largely unknown. To elucidate the effects of MAR on land subsidence, a comprehensive analysis was undertaken, integrating interferometric synthetic aperture radar (InSAR) data, extensometer measurements, and groundwater level observations.Our analysis revealed a discernible land rebound phenomenon, with rates escalating from 2.3 mm/a in 2015 to 20 mm/a in 2021. This rebound extends southwestward, following a dispersion pattern that aligns with pre-existing fault structures, suggesting their controlling influence. The groundwater level changes caused by the MAR can cause land rebound, especially near fault footwalls. However,low permeability in fault zones hinders groundwater flow in the hanging wall resulting in slight land deformation. Lithology also affects rebound, with sandy soils showing more significant land rebound, while low-sand areas exhibit limited or delayed rebound. These findings offer crucial insights into the interplay between MAR, groundwater dynamics, and land subsidence in the studied region. They provide a foundation for informed decision-making in groundwater replenishment strategies and precise subsidence prevention and control measures. Future research should maintain a vigilant monitoring of the long-term consequences of MAR on land subsidence to ensure sustainable regional development.
1 Introduction
The groundwater over-exploitation has change the original stress state in the aquifer system, resulting in a decrease in pore pressure and an increase in the effective stress (Lofgren, 1968). When the stress exceeds the preconsolidation stress that the soil has previously endured, inelastic consolidation occurs in the clay layer and as the deformation gradually increases, land subsidence begins to form (Holzer, 1981; Galloway and Burbey, 2011). Land subsidence poses a significant threat in the world (Bagheri-Gavkosh et al., 2021; Negahdary, 2022; Ao et al., 2024), According to UNESCO International Initiative on Land Subsidence Working Group, land subsidence is projected to affect 19% of the global population by 2040 (Herrera-García et al., 2021).
A variety of groundwater management strategies, which are based on water allocation, are being implemented to mitigate the land subsidence (Roose and Starks, 2006; Calderhead et al., 2012; Zhu et al., 2020). These strategies have resulted in a shift in the groundwater level from a decline to a rise, and some regions found the land subsidence relief and, even land rebound (Castellazzi et al., 2021; Tang et al., 2022). The state of land deformation was intricate in the region with pre-existing fault (Parker et al., 2021; Zhao et al., 2021). Many research found that the pre-existing faults serve as boundaries for land deformation and control the developed of the land deformation (Burbey, 2002; Hu et al., 2019; Salehi Moteahd et al., 2019). Unfortunately, the effect mechanism of pre-existing faults on the land deformation was relatively weak, which restrict scientific replenishment of regional groundwater.
The study area, situated in the northern region of Beijing, has been affected by severe land subsidence, with maximum cumulative settlement above 80 cm (1955–2014). The pre-existing in the study area has resulted in rapid formation of uneven subsidence and earth fissures. Since 2015, the MAR has been operational, and land rebound appeared in some area, offering a valuable opportunity to gain a better understanding of this mechanism. Here, RadarSAT-2 SAR data in the study area from 2015 to 2021 is utilized to present the promising effects of the MAR on land subsidence. The effect mechanism of geological structure on the land deformation is analysed.
2 Description of the study area
2.1 Geological setting
The study area is in the upper and middle part of the Chaobai River’s alluvial fan, which was formed in the Pleistocene by the alluvial-diluvial action of the Chaobai and Wenyu Rivers (Lei et al., 2022a). The geological environment in this area is highly complex due to the heterogeneous distribution of alluvial deposits (Wei, 2008). The thickness of the Quaternary deposits varies between 50 m in the northeastern region and extends up to 1,100 m in the southwestern region, change from an coarse sand in the piedmont areas to fine clay in the floodplain zones (Zhu et al., 2020).
Two buried geological faults are located: the northern section of the Gaoliying (GLY) fault (Figure 1A) and the northern section of the Shunyi (NSY) fault (Figure 1A). The GLY fault is a tension normal fault with a length of 40 km, a strike of 70°–80°, and a SE trend (Wei, 2008). The GLY fault has experienced multiple periods of activity since the Cretaceous Period and has been very active since the Cenozoic in controlling the Palaeocene, Neoproterozoic, and Quaternary deposits (Wei, 2008). The average activity rates of the Early Pleistocene, Middle Pleistocene, Late Pleistocene and Holocene faults were 0.07 mm/a, 0.04 mm/a, 0.23 mm/a and 0.10 mm/a, respectively (Zhang et al., 2016).
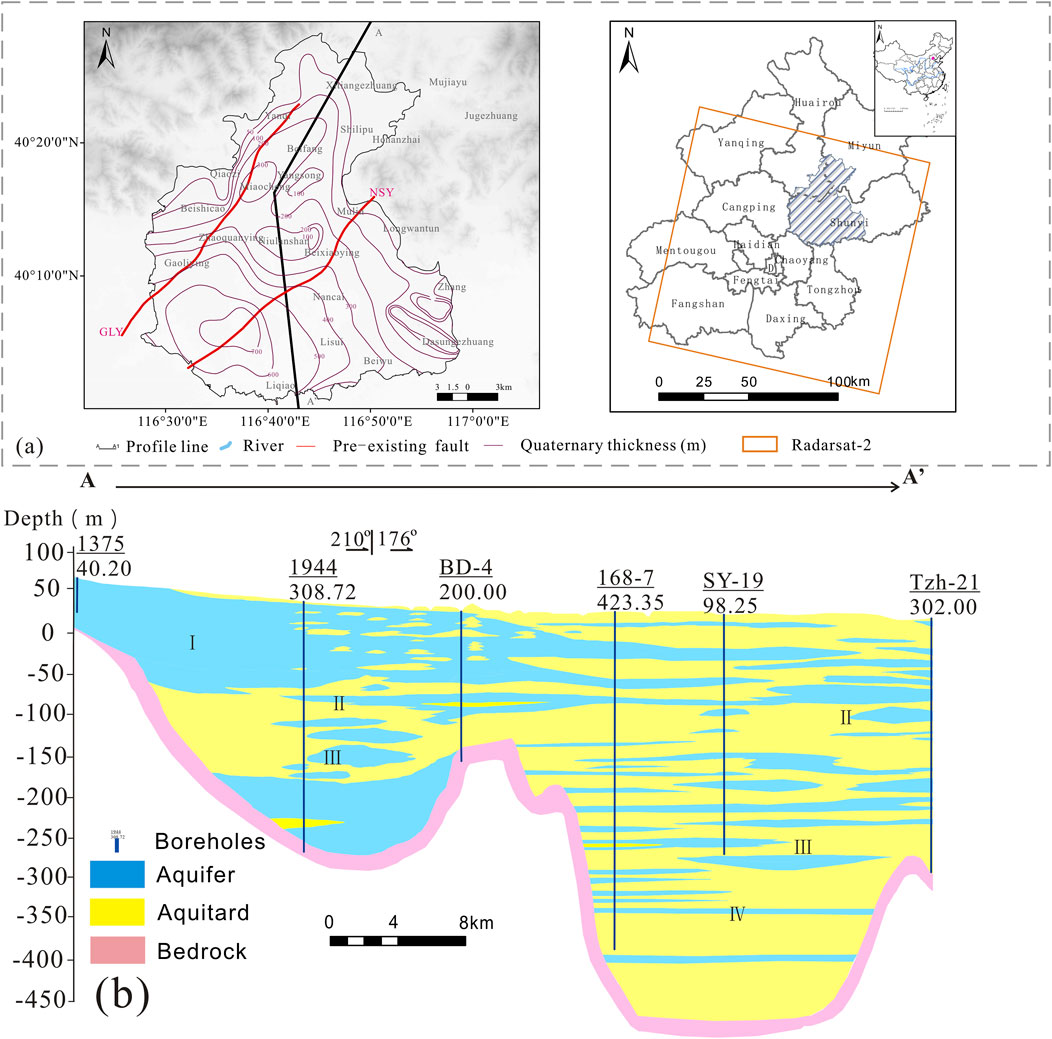
Figure 1. Location and geology of the study area: (A) The distribution and descriptions of the Quaternary sediments and preexisting faults in the study area. (B) Hydrogeological cross-section A–A1 (the location is displayed in (A). The Ⅰ-Phreatic aquifers, the Ⅱ-The first confined aquifers, the Ⅲ-The second confined aquifer, and the Ⅳ-The third confined aquifer.
The NSY fault is a tension normal fault with a length of 40 km, a strike of 40° and a SE trend (Wei, 2008). According to the measurements and geochronological results, the average activity rates of the Early Pleistocene, Middle Pleistocene, Late Pleistocene and Holocene faults were 0.23 mm/a, 0.03 mm/a, 0.29 mm/a and 0.51 mm/a, respectively (Qi et al., 2020).
2.2 Hydrogeological setting and manged aquifer recharge
The aquifers in the study area can be divided into four groups (Figure 1B). Phreatic aquifers (PAs), the first confined aquifers (FCAs), the second confined aquifer (SCA), and the third confined aquifer (TCA). Phreatic aquifers (PAs) originated in the Holocene and late Pleistocene and are widely distributed in the study area with thicknesses varying from 40 m to 50 m. Medium-coarse sands with gravel were deposited along the PA layers. The PA is supplied by atmospheric precipitation, infiltration from agricultural irrigation and river water, and its own abundant groundwater resources. The first confined aquifers (FCAs) were formed in the mid-Pleistocene, with depths ranging from 80 to 120 m. The second confined aquifer (SCA) is mainly distributed in the middle of the alluvial fan. Its layers were formed in the lower Pleistocene. The bottom depth of this group ranges from 150 to 180 m. The third confined aquifer (TCA) is distributed south of Mapo village. It was formed in the Lower Pleistocene, and the bedrock comprises the bottom of this group.
The MAR commenced in 2015, with recharge operations conducted annually from April to June. By the end of 2020, a total of 501, 508, 900 cubic meters of groundwater had been recharged. The South-to-North Water Diversion water, after being released through the Lishishan Diversion Gate on the Jingmi Diversion Canal, flows through the Xiaozhong River, Mangniu River, and Huaihe River before entering the upstream groundwater recharge site at the Chaobai River Niulanshan Rubber Dam (Lei et al., 2022a).
3 Data set
In this paper, The InSAR data, extensometer data and groundwater level data have been gathered. Those multi-source monitoring datasets were used to analyze the changes of the land deformation in the study area before and after the MAR, and the effects of the pre-exising fault, and lithology on land deformation under the background of groundwater level rise were also studied.
3.1 Interferometric synthetic aperture radar (InSAR) data
Since its launch in 2007, the Radarsat-2 satellite has been in operation. With a revisit period of 24 days, it employs a C-band Synthetic Aperture Radar (SAR) featuring a 56 mm wavelength. The satellite boasts a spatial resolution of 30 m, making the data it collects ideal for monitoring regional subsidence (Ng et al., 2017; Samsonov et al., 2017).
In this study, 70 scenes of the Radarsat-2 dataset in W1 mode between October 2014 and October 2021 were collected to acquire the regional subsidence of the study area. Persistent scatterer InSAR (PS-InSAR) technology was adopted to process the SAR dataset and extract subsidence information. The basic principle of the PS-InSAR technique is to use several SAR images of the same area to find permanent scatterers (such as buildings, bridges, roads, etc.,) that are not subject to temporal and spatial baseline deconvolution and atmospheric effects by statistically analysing the magnitude information of the images and then to separate the errors from the differential interference phases one by one using the network formed by connecting these PS points and the spatiotemporal characteristics of each phase component (Ferretti et al., 2001). Using the network of these PS points and the spatial and temporal characteristics of each phase component, the errors are separated from the differential interference phase one by one, and the surface deformation phase of each PS point is finally obtained (Ferretti et al., 2001). It can overcome the factors of spatial and temporal incoherence and atmospheric delay in conventional differential interferometry and thus obtain continuous and reliable surface deformation information (Ferretti et al., 2001). The accuracy of the annual average deformation rate obtained by the PS-InSAR method can reach the millimetre level (Lei et al., 2022b). The data were processed via the following steps:
The master image is determined based on information such as the spatial and temporal baseline, the Doppler shift and the number of datasets. The remote sensing images are then cropped according to the extent of the study area to determine the processing area of the remote sensing images. The coordinate mapping relationship between the master image and all SAR imagery in the distance and azimuth directions is calculated, and the mapping relationship is used to perform coordinate mapping on all SAR imagery. Then, the image is resampled to a new image to align all the SAR images to the master image. The 30 m resolution SRTM data are resampled into the SAR image coordinate system, and an amplitude image is generated from the reference SRTM data. The aligned images were then subjected to differential interferometry to obtain N differential interferograms, with each image element of each differential interferogram containing five components. To avoid calculation errors caused by low coherence points, the high coherence points in the differential interferograms were selected for calculation. In this paper, the amplitude deviation index is used for screening, and the time series amplitude extreme deviation values are obtained by calculating the mean and standard deviation of the PS points in each period and the ratio of the two. The threshold value of the amplitude deviation index is set to filter the PS points, and then the Delaunay triangulation network is used to construct the point network of the PS point analysis. Once the PS points are selected, strong reflection points with zero phase components of deformation and elevation, high coherence and stable reflection characteristics are selected as the reference points. Then, the phase distributions of all other pixels are calculated based on the current reference points, and the phase values are improved based on the above phase distribution. The surface deformation of the study area and the physical and statistical properties of the components of the interferometric phase are used to establish an entangled phase function model with the elevation error, linear deformation, thermal deformation and other factor parameters. The atmospheric phase is analysed according to the pixel network using the phase difference relationship between adjacent permanent scattering targets, and the function model is solved based on the inverse residuals algorithm. The phase of the elevation error, linear deformation and other contributing factors of each pixel is solved, the phase of nonlinear deformation and incoherent noise in the residuals is decomposed, and finally, the entangled phase values of atmospheric delay components such as the elevation difference and linear deformation rate are accurately calculated. The above steps were completed using the SARPROZ tool.
3.2 In-situ deformation data
The J1 land subsidence monitoring station is equipped with extensometers of varying depths. Data from these extensometers, spanning from 2004 to 2021, have been selected for analysis to discern the characteristics of soil deformation and to explore the correlation between the deformation of stratified soil layers and groundwater levels. The extensometer data at varying depths can be analyzed by deducting the cumulative deformation of the underlying layer from the total deformation. The monitoring layers of the extensometers and the corresponding groundwater wells at the monitoring station are detailed in Table 1. The geographical location of the monitoring station is depicted in Figure 1.
3.3 Groundwater level data
Data collected from monitoring wells in groundwater level directly reflect the hydraulic parameters of the aquifer. In this study, GWL was collected from 53 monitoring wells. The data is gathered on a monthly basis by the Beijing Institute of Geo-Environmental Monitoring from 2014 to 2021. In addition, time series analysis was conducted using data from 6 observation wells at both sides of the NSY fault. W1, W2, S1, S2, S3 and S4 wells. The depths of the wells are 111 m, 102 m, 60 m, 50 m, 80 m, and 102 m, respectively. In this study, the groundwater level refers to the elevation of groundwater, and the calculation method is to subtract the groundwater depth from the surface elevation.
4 Result and discussion
4.1 Accuracy assessment
Fifteen levelling benchmarks evenly distributed across the study regions were measured to verify the reliability of the PS-InSAR processing results (Figure 2A). Owing to the absence of permanent scatterers (PS) at the reference points, the average displacement of PS points within a 100-m buffer zone surrounding these leveling points was employed as the land deformation value in the reference point during the calibration process.
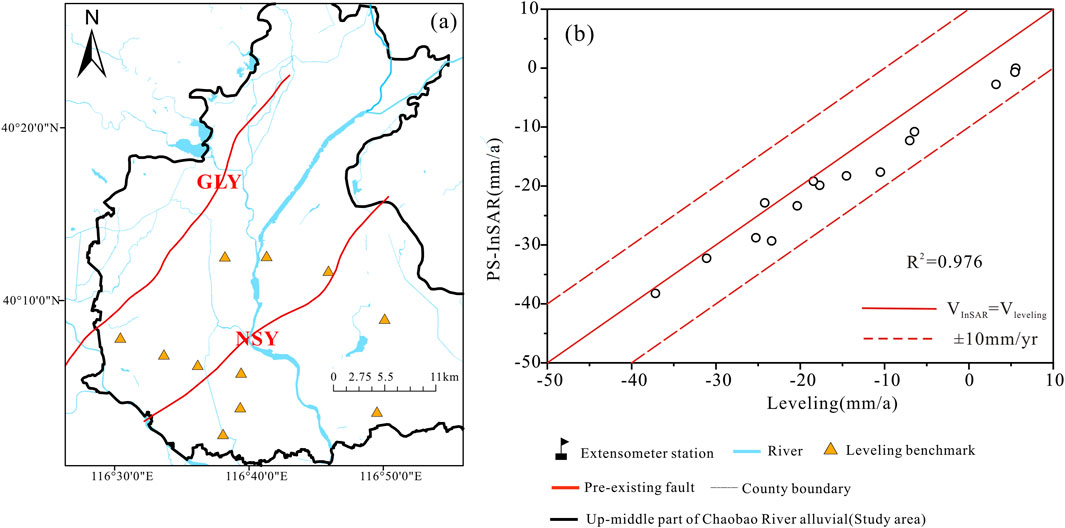
Figure 2. The location of the study sites (A) and comparisons of the PS-derived land subsidence rates and levelling measurement rates (B). The orange triangle indicates the levelling benchmark used in this study. The black triangle indicates the extensometer monitoring stations.
As shown in Figure 2B, a cross-comparison levelling result in 2014 and 2021 and the PS-InSAR data was obtained via linear regression analysis. The assessment results reveal that the PS-InSAR data matched the levelling results, and the error ranged from 1 to 7.5 mm. The R-squared value was 0.976. The comparison validated the PS-InSAR data, and the data could be used for further analysis of the spatial pattern of land deformation.
4.2 Spatial pattern of land deformation
As depicted in Figure 3, a comparison of the velocity maps from 2014 to 2021 reveals that both land subsidence relief have been observed within the study area. The deformation values higher than 0 indicate uplift, while the values lower than 0 indicate land subsidence.
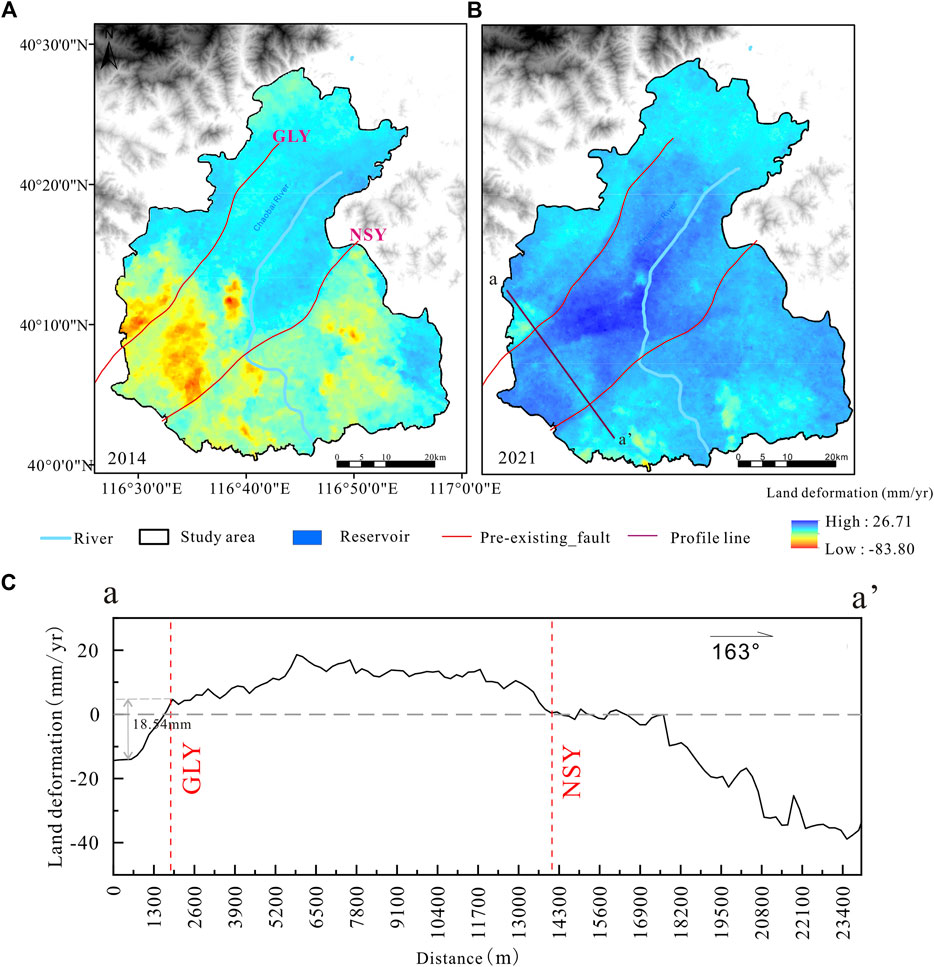
Figure 3. Maps of land displacements (vertical magnitude in mm) in 2014 and 2021 and the profile cross the pre-exising faults.
Significant land subsidence has been detected in the southern region of the study area, with a maximum deformation rate of −83.8 mm/yr. Conversely, in 2021, widespread uplift was documented in the Shunyi district, with rates varying between +10 and +20 mm/yr (Figure 3). The PS (Persistent Scatterer) data within the land subsidence funnel indicate subsidence rates exceeding −50 mm/yr in 2014. By 2021, the region experienced land uplift at a rate as high as +5 cm/yr. The maximum land rebound was observed in the region around 2021, amounting to ten percent of the land subsidence recorded in 2014.
Interesting, the visible uplift zone, the rebound rate above 20 mm/yr, is dominated spreading in a fan area striking approximately NE‒SW. By jointly preexisting faults and land deformation driven by the InSAR, the uplift zone is mainly developed in the depression bounded by the GLY fault in the northwest and the NSY fault in the southeast.
For further reveal the effect of pre-existing fault on the land deformation, We drew a profile a-a (marked as the brown dashed line in Figure 3B) perpendicular to the pre-existing fault. We plotted the trend of vertical displacement (black line) and the gradient of subsidence (brown line) based on the points (600 points total) within the profile. As shown in Figure 3C, the deformation rate reveals an decreasing trend at the hangingwall of NSY and footwall of GLY. The maximum value of the vertical displacementis 38.89 mm. A visible land rebound area were generated at the foot wall of NSY, with a maximum rebound of 18.54 mm. The deformation rate exhibits a distinct uneven changes crossing the GLY Fault and NSY fault, with a maximum uneven deformation of 18.7 mm.
4.3 Influences of groundwater on the spatial extent of land rebound
Previous studies have shown that land uplift could result from the expansion of the granular skeleton due to the increase in pore pressure associated with recovery of the groundwater level (Waltham, 2002; Wang et al., 2017). This phenomenon is referred to as elastic or poroelastic rebound (Chen et al., 2007). Therefore, we consider the change in groundwater levels on both sides of the preexisting faults to likely be triggering factors that influence the spatial extent of land rebound.
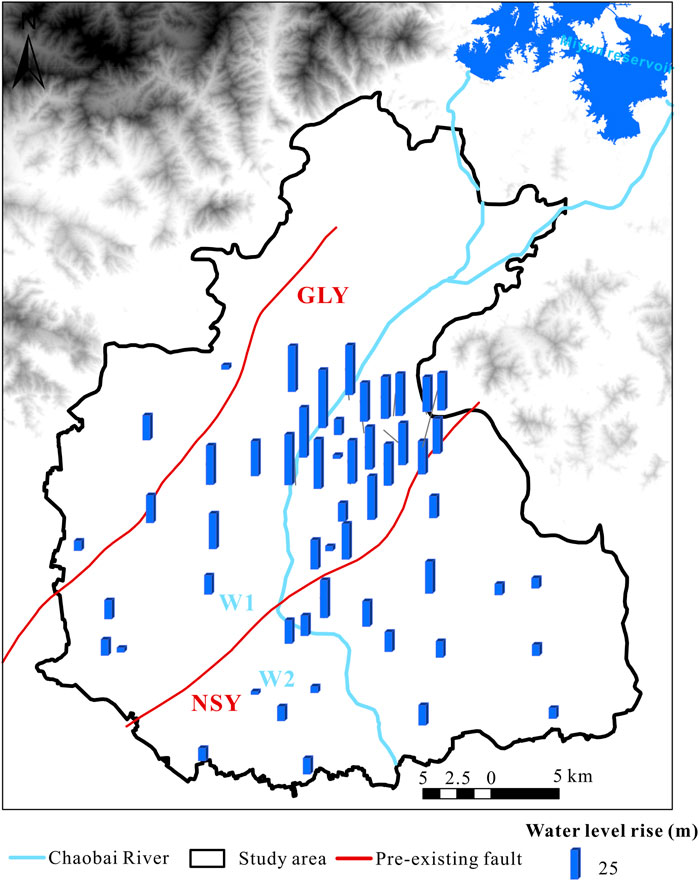
53 automatically monitored wells were used to investigate the groundwater level changes from 2014 to 2021 at both sides of the preexisting faults. As shown in Figure. During the MAR operation, Groundwater levels exhibited a relative increase at 90% of the monitoring well sites. Groundwater levels in the footwall of the NSY fault have been observed to rise, with a peak increase of nearly 50 m. In contrast, the groundwater levels at the hanging wall of the NSY fault exhibited a relatively minor upward trend. As the distance from the fault increased, no discernible changes in groundwater levels was observed.
To further examine groundwater level changes at both sides of the preexisting fault, The monitoring wells, located at at both sides of the fault, was selected. The location of the wells are shown in Figures 4, 6 respectively. The groundwater level exhibited significant difference on either side of the NSY fault. For instance, monitoring well 3 showed an visible increase in response to the MAR with 10.71 increase after the MAR operation in 2018. While W1 record seasonal variations associated with changes in precipitation throughout the observation period Figure 5A.

Figure 5. Time series of groundwater levels on both sides of the NSY fault. See the well locations of (A) in the Figure 4 and (B) in the Figure 6.
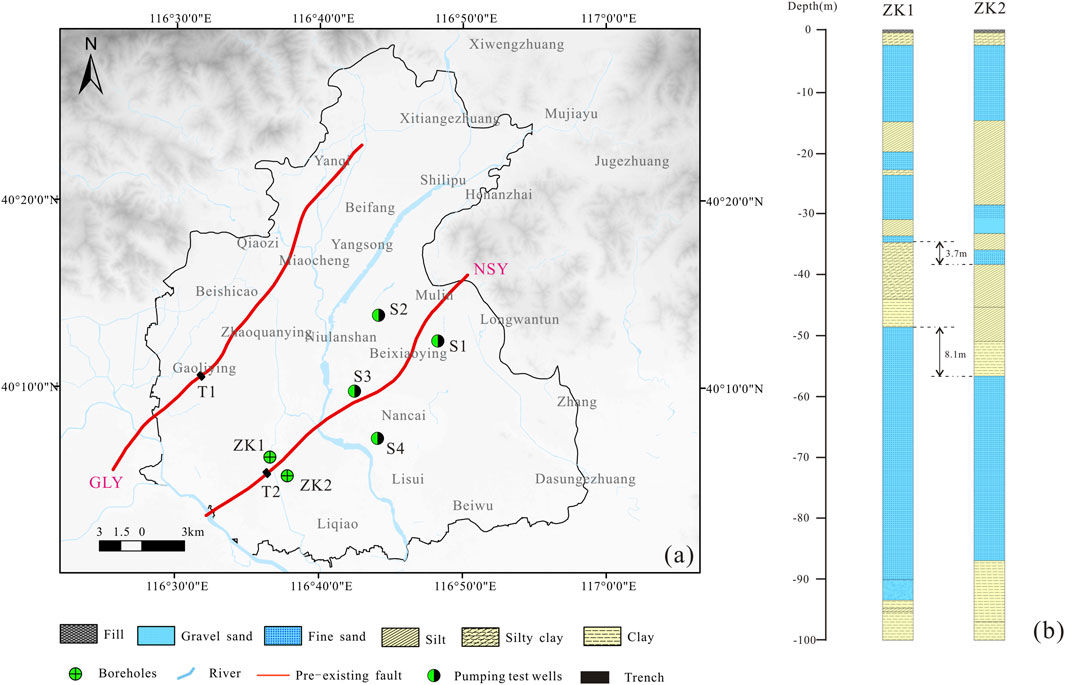
Figure 6. (A) The locations of the boreholes, the trenching, and the pumping test well. (B) The geological cross-section of the NSY fault.
A similar finding was made by Lapperre et al. (2022) for the Peel Boundary Fault. They concluded that this effect may caused by low normal permeability of the preexisting fault zone. Previous studies have shown that the most direct cause of the low permeability around the fault zone is because of fault throwing, which can juxtapose low-permeability confining units against well-permeability aquifers (Lapperre et al., 2019; Zhao et al., 2021).
The geological section of the NSY fault at a depth of 0–100 m was revealed by drilling. As shown in Fig, notable stratigraphic dislocation begins at a depth of 35 m, and the vertical throw of the strata gradually increases, displaying a juxtapose of low-permeability confining units against well-permeability aquifers (Figure 6). The geophysical prospecting profiles also show that the stratigraphic dislocation propagates downward into the sediments and may extend to depths of more than 100 m (Qi et al., 2020).
The earth fissure trenches reveal the shallow characteristics of pre-existing faults. There is a clear vertical offset of strata within the trench’s range, resulting in the development of a clay smear along the fault zone that cuts through the clay beds (Figure 7).
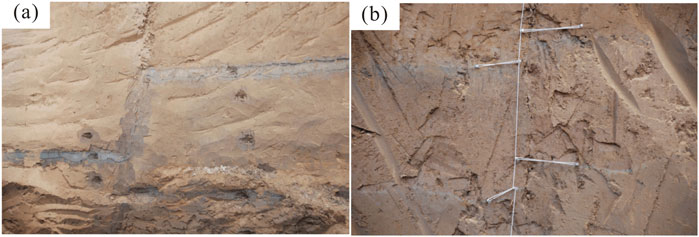
Figure 7. Trench profile of the preexisting fault. (A) Trench profile excavated perpendicular to the GLY fault in Xiwanglu town. (B) Trench profile excavated perpendicular to the NSY fault Shunyi petroleum company.
Based on the results of the trenching and geological section analysis, significant stratigraphic displacement and distinct fault surfaces were observed. The results indicates that the NSY Fault displays pronounced brittle fault characteristics. As shown in Fig, under the effect of the MAR, the water level rise was occurred in the foot wall of NSY fault Figure 5B. The juxtapose of low-permeability confining units against well-permeability aquifers caused by the throwing lead to a gradual decrease in the hydraulic conductivity of the fault zone. An obvious reduction in the permeability of half the magnitude in the hanging wall of the NSY fault zone compared to the aquifer in the footwall of the NSY fault zone was found (Table 2).
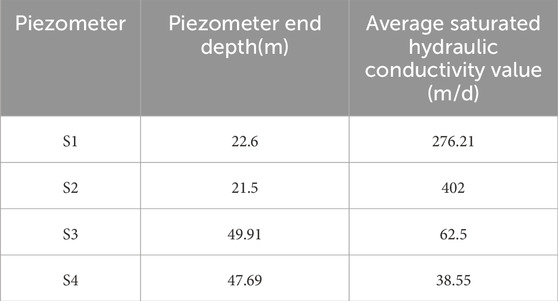
Table 2. Results of the pumping test on both sides of the NSY fault. See Figure 6A for a map of the pumping test well locations.
As shown in Figure 8B The presence of a low-permeability layer diminishes the hydraulic connection between the hanging wall and footwall of the NSY fault, the groundwater in the deep aquifers located in the footwall of the NSY fault have to circumvent the aquiclude by moving upward and downward through aquifers situated above and below it,resulting in reduced water transmission from the MAR to the hanging wall of the NSY fault, as compared to the natural state Figure 8A. Consequently, this results in a hysteresis effect or a lack of groundwater level rise in response to the MAR.

Figure 8. Conceptual model of groundwater flow dynamics (A) Natural groundwater flow patterns. (B) Groundwater flow behavior across pre-existing fault.
According to the principle of effectiveness, MAR leads to an obvious rebound of the aquifers located at the footwall of the NSY fault. On the other hand, due to the sluggish recharge of water from the footwall to the hangingwall aquifers, there was few rebound in contrast to the deformation observed in the footwall of the NSY fault.
4.4 Influences of lithology on the spatial extent of land rebound
Ground surface deformation is a result of the total deformation of deep soil layers (Liu et al., 2019; Zhang et al., 2015). It can be inferred that the spatial variation may be caused by the complex loading and unloading in deep soil deformation caused by the groundwater level rise. To better understand the relationship between the groundwater level and the deep soil deformation, the deformation of the soil layer measured at extensometer station, located at the foot wall of the NSY fault, is plotted in Figure 9.
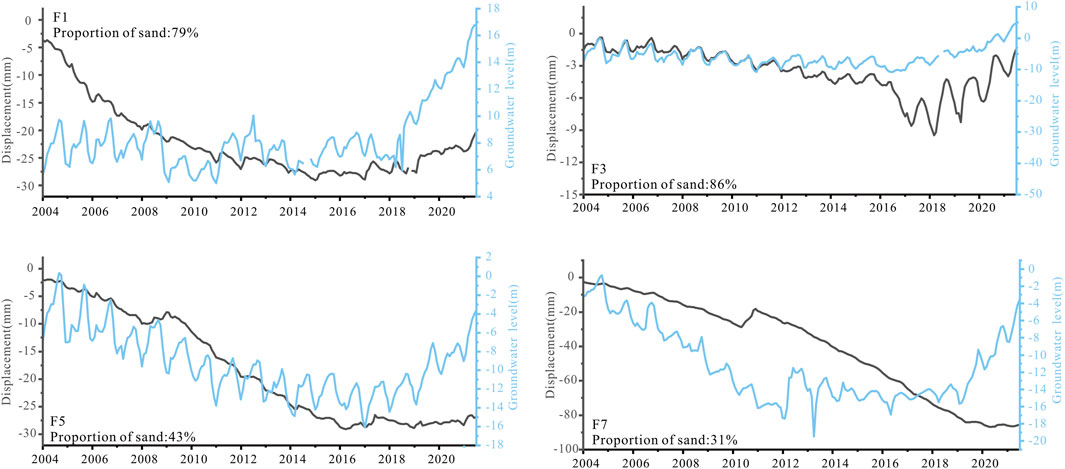
Figure 9. Time series curve of the relationship between cumulative layer deformation and groundwater level at extensometer station. F1, F3, F5, and F7 represent the monitoring data captured at various depth levels. See Figure 2A for a map of the monitoring station locations.
As shown in Figure 9, the land rebound responds differently to a rise in groundwater level. Land rebound can be broadly grouped into two deformation modes.
Firstly, as the groundwater level rises, the deformation of the aquifer is closely related to the change in the groundwater level and exhibited the soil rebound. Secondly, the deformation of the aquifer is no closely related to the change in the groundwater level. The relieve of soil compaction was found during the monitoring period following the rise in water levels. Based on the boreholes data, the former mainly occurred in the soil with higher proportion of sand layer, while the latter mainly occurred in the soil with higher proportion of the clay layer.
We made comparisons of the lithology at both sides of the NSY fault to assess the effect of the lithology on the land rebound. As shown in Figure 10, The fairly high proportion of sand layer, suggested that this area may occurred significant elastic or poroelastic rebound in soil during the groundwater level rise. In contrast, lower proportion of sand layer was identified in hanging wall of NSY fault. The information indicates that this area can not experience the rebound immediately when the groundwater level rise.
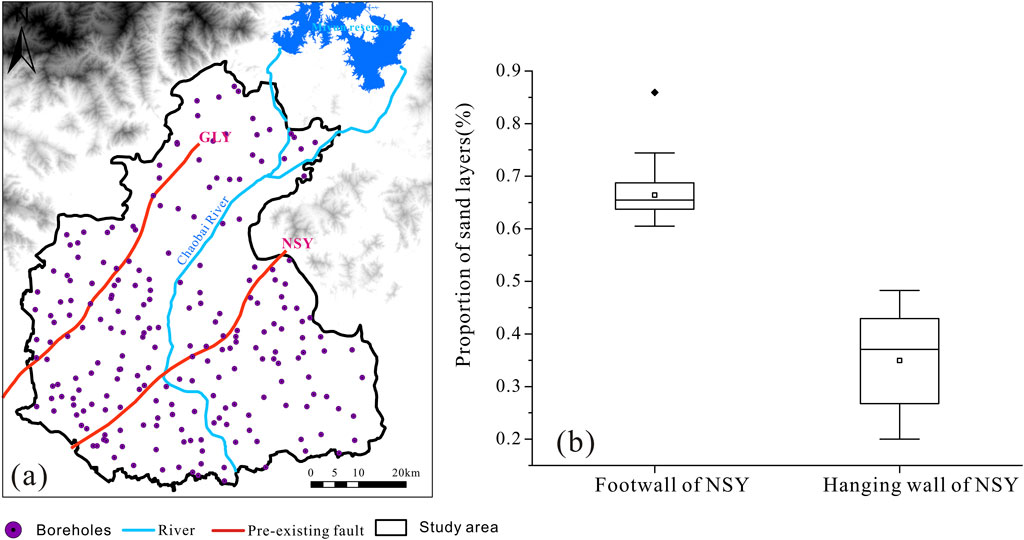
Figure 10. Lithology at both sides of pre-existing faults (A) Borehole locations (B) Proportion of sand layers on both sides of pre-existing faults.
5 Conclusion
In summary, the most important new insight from our analysis is that MRP is an effective measure for controlling land subsidence. A certain deceleration of the process of land subsidence has been detected in the MRP area.
The InSAR reveal a significant shift from land subsidence to land uplift in the study area between 2014 and 2021. The uplift zones, particularly those exceeding 20 mm/yr, exhibit a fan-shaped pattern striking approximately NE-SW, closely mirroring the preexisting fault.
The study highlights the influence of groundwater level changes on land rebound. The MAR process led to a noticeable rise in groundwater levels, particularly at the footwall of the faults. The low permeability across the fault zone weakened the hydraulic connection between the hanging wall and footwall, further inhibiting groundwater flow and land deformation in the hanging wall.
The study underscores the significance of lithology in determining the spatial extent of land rebound. Soils with a higher proportion of sand layers were found to exhibit more pronounced rebound in response to groundwater level rise. Conversely, areas with lower sand content, such as the hanging wall of the NSY fault, demonstrated delayed or limited rebound.
Data availability statement
The original contributions presented in the study are included in the article/supplementary material, further inquiries can be directed to the corresponding authors.
Author contributions
SL: Conceptualization, Data curation, Formal Analysis,Investigation, Methodology, Software, Writing–original draft,Writing–review and editing. MB: Conceptualization, Data curation, Funding acquisition, Resources, Supervision, Validation,Writing–review and editing.
Funding
The author(s) declare financial support was received for the research, authorship, and/or publication of this article. This research is supported by the Natural Science Foundation of China (Grant No. 42172311), Beijing Natural Science Foundation (Grant No. 8242018).
Acknowledgments
We greatly thank the editors, as well as the reviewers for their helpful or valuable comments on the paper.
Conflict of interest
The authors declare that the research was conducted in the absence of any commercial or financial relationships that could be construed as a potential conflict of interest.
The reviewer BB declared a shared affiliation with the authors to the handling editor at time of review.
Publisher’s note
All claims expressed in this article are solely those of the authors and do not necessarily represent those of their affiliated organizations, or those of the publisher, the editors and the reviewers. Any product that may be evaluated in this article, or claim that may be made by its manufacturer, is not guaranteed or endorsed by the publisher.
References
Ao, Z., Hu, X., Tao, S., Hu, X., Wang, G., Li, M., et al. (2024). A national-scale assessment of land subsidence in China’s major cities. Science 384, 301–306. doi:10.1126/science.adl4366
Bagheri-Gavkosh, M., Hosseini, S. M., Ataie-Ashtiani, B., Sohani, Y., Ebrahimian, H., Morovat, F., et al. (2021). Land subsidence: a global challenge. Sci. Total Environ. 778, 146193. doi:10.1016/j.scitotenv.2021.146193
Burbey, T. J. (2002). The influence of faults in basin-fill deposits on land subsidence, Las Vegas Valley, Nevada, USA. Hydrogeology J. 10, 525–538. doi:10.1007/s10040-002-0215-7
Calderhead, A. I., Martel, R., Garfias, J., Rivera, A., and Therrien, R. (2012). Sustainable management for minimizing land subsidence of an over-pumped volcanic aquifer system: tools for policy design. Water Resour. Manag. 26, 1847–1864. doi:10.1007/s11269-012-9990-7
Castellazzi, P., Garfias, J., and Martel, R. (2021). Assessing the efficiency of mitigation measures to reduce groundwater depletion and related land subsidence in Querétaro (Central Mexico) from decadal InSAR observations. Int. J. Appl. Earth Observation Geoinformation 105, 102632. doi:10.1016/j.jag.2021.102632
Chen, C. T., Hu, J. C., Lu, C. Y., Lee, J. C., and Chan, Y. C. (2007). Thirty-year land elevation change from subsidence to uplift following the termination of groundwater pumping and its geological implications in the Metropolitan Taipei Basin, Northern Taiwan. Eng. Geol. 95, 30–47. doi:10.1016/j.enggeo.2007.09.001
Ferretti, A., Prati, C., and Rocca, F. (2001). Permanent scatterers in SAR interferometry. IEEE Trans. geoscience remote Sens. 39 (1), 8–20. doi:10.1109/36.898661
Galloway, D. L., and Burbey, T. J. (2011). Review: regional land subsidence accompanying groundwater extraction. Hydrogeology J. 19 (8), 1459–1486. doi:10.1007/s10040-011-0775-5
Herrera-García, G., Ezquerro, P., Tomás, R., Béjar-Pizarro, M., López-Vinielles, J., Rossi, M., et al. (2021). Mapping the global threat of land subsidence. Science 371, 34–36. doi:10.1126/science.abb8549
Holzer, T. L. (1981). Preconsolidation stress of aquifer systems in areas of induced land subsidence. Water Resour. Res. 17 (3), 693–703. doi:10.1029/WR017i003p00693
Hu, L., Dai, K., Xing, C., Li, Z., Tomás, R., Clark, B., et al. (2019). Land subsidence in Beijing and its relationship with geological faults revealed by Sentinel-1 InSAR observations. Int. J. Appl. Earth Observation Geoinformation 82, 101886. doi:10.1016/j.jag.2019.05.019
Lapperre, R. E., Bense, V. F., Kasse, C., and van Balen, R. T. (2022). Temporal and spatial variability of cross-fault groundwater-level differences: the impact of fault-induced permeability reduction, precipitation and evapotranspiration. Hydrogeol. J. 30, 1233–1257. doi:10.1007/s10040-022-02465-w
Lapperre, R. E., Kasse, C., Bense, V. F., Woolderink, H. A. G., and Van Balen, R. T. (2019). An overview of fault zone permeabilities and groundwater level steps in the Roer Valley Rift System. Neth. J. Geosciences 98, e5. doi:10.1017/njg.2019.4
Lei, K., Ma, F., Chen, B., Luo, Y., Cui, W., Zhao, L., et al. (2022a). Effects of South-to-North water diversion Project on groundwater and land subsidence in Beijing, China. Bull. Eng. Geol. Environ. 82, 18. doi:10.1007/s10064-022-03021-2
Lei, K., Ma, F., Chen, B., Luo, Y., Cui, W., Zhou, Y., et al. (2022b). Characteristics of land-subsidence evolution and soil deformation before and after the Water Diversion Project in Beijing, China. Hydrogeology J. 30, 1111–1134. doi:10.1007/s10040-022-02489-2
Liu, Y., Li, J., and Fang, Z. N. (2019). Groundwater level change management on control of land subsidence supported by borehole extensometer compaction measurements in the houston-galveston region, Texas. Geosciences 9, 223. doi:10.3390/geosciences9050223
Lofgren, B. E. (1968). Analysis of stresses causing land subsidence. US: Geological survey research, B219–B225.
Negahdary, M. (2022). Shrinking aquifers and land subsidence in Iran. Science 376 (6599), 1279. doi:10.1126/science.add1263
Ng, A. H. M., Ge, L., Du, Z., Wang, S., and Ma, C. (2017). Satellite radar interferometry for monitoring subsidence induced by longwall mining activity using Radarsat-2, Sentinel-1 and ALOS-2 data. Int. J. of App. Earth Observation and Geoinformation 61, 92–103.
Parker, A. L., Pigois, J. P., Filmer, M. S., Featherstone, W. E., Timms, N. E., and Penna, N. T. (2021). Land uplift linked to managed aquifer recharge in the Perth Basin, Australia. Int. J. Appl. Earth Obs. Geoinf 105, 102637. doi:10.1016/j.jag.2021.102637
Qi, B., Pan, Z., Feng, C., Tan, C., Zhang, P., Meng, J., et al. (2020). Application of comprehensive geophysical-drilling exploration to detect the buried Shunyi active fault belt in Beijing. Acta Geol. Sin. 94, 1315–1329. doi:10.19762/j.cnki.dizhixuebao.2020002
Roose, D., and Starks, D. (2006). “The California state water Project - asset management and condition assessment,” in Proceedings of the Operations Management Conference, Sacramento, California, 1–13. doi:10.1061/40875(212)1
Salehi Moteahd, F., Hafezi Moghaddas, N., Lashkaripour, G. R., and Dehghani, M. (2019). Geological parameters affected land subsidence in Mashhad plain, north-east of Iran. Environ. Earth Sci. 78, 405–412. doi:10.1007/s12665-019-8413-y
Samsonov, S. V., Feng, W., and Fialko, Y. (2017). Subsidence at cerro prieto geothermal field and postseismic slip along the Indiviso fault from 2011 to 2016 RADARSAT-2 DInSAR time series analysis. Geophysical Research Letters 44, 2716–2724.
Tang, W., Zhao, X., Motagh, M., Bi, G., Li, J., Chen, M., et al. (2022). Land subsidence and rebound in the Taiyuan basin, northern China, in the context of inter-basin water transfer and groundwater management. Remote Sens. Environ. 269, 112792. doi:10.1016/j.rse.2021.112792
Waltham, T. (2002). Sinking cities. Geol. Today 18 (3), 95–100. doi:10.1046/j.1365-2451.2002.00341.x
Wang, G. y., Zhu, J. Q., You, G., Yu, J., Gong, X. L., Li, W., et al. (2017). Land rebound after banning deep groundwater extraction in Changzhou, China. Eng. Geol. 229, 13–20. doi:10.1016/j.enggeo.2017.09.006
Wei, W. (2008). 3D geological survey based on multiparameter of geological body in Beijing plain. Beijing, China: Beijing Geology and Mineral Resources Exploration and Development Bureau.
Zhang, L., He, J., Bai, L., Cai, X., Wang, J., and Yang, T. (2016). The response relationship between the variation characteristics of deposition rate of Quaternary depression basin on the northern margin of Beijing depression and the activity of Shunyi fault. Geol. China 43, 511–519. doi:10.12029/gc20160212
Zhang, Y., Wu, J., Xue, Y., Wang, Z., Yao, Y., Yan, X., et al. (2015). Land subsidence and uplift due to long-term groundwater extraction and artificial recharge in Shanghai, China. Hydrogeol. J. 23, 1851–1866. doi:10.1007/s10040-015-1302-x
Zhao, L., Li, Y., Luo, Y., Liu, J., Cui, W., Zhang, Y., et al. (2021). An extension-dominant 9-km-long ground failure along a buried geological fault on the eastern Beijing Plain, China. Eng. Geol. 289, 106168. doi:10.1016/j.enggeo.2021.106168
Keywords: land rebound, pre-existing fault, low permeability, aquifer recharge, Beijing
Citation: Liu S-M and Bai M-Z (2024) Groundwater level rise and geological structure influences on land deformation dynamics: insights from managed aquifer recharge operations in Beijing, China. Front. Earth Sci. 12:1469772. doi: 10.3389/feart.2024.1469772
Received: 24 July 2024; Accepted: 27 September 2024;
Published: 11 October 2024.
Edited by:
Chong Xu, Ministry of Emergency Management, ChinaReviewed by:
Bing Bai, Beijing Jiaotong University, ChinaJiewei Zhan, Chang’an University, China
Yuandong Huang, Ministry of Emergency Management, China
Jiansheng Chen, Hohai University, China
Copyright © 2024 Liu and Bai. This is an open-access article distributed under the terms of the Creative Commons Attribution License (CC BY). The use, distribution or reproduction in other forums is permitted, provided the original author(s) and the copyright owner(s) are credited and that the original publication in this journal is cited, in accordance with accepted academic practice. No use, distribution or reproduction is permitted which does not comply with these terms.
*Correspondence: Shao-Min Liu, bGl1c20yMDIzQDEyNi5jb20=; Ming-Zhou Bai, Mjc5NDU5MjYwQHFxLmNvbQ==
 Shao-Min Liu
 Ming-Zhou Bai1,2*
