 E. Spain
 R. J. Carey
 J. M. Whittaker
 V. L. Lucieer
 J. M. Fox
 S. J. Watson
 F. Caratori Tontini
- 1National Institute of Water and Atmospheric Research (NIWA), Wellington, New Zealand
- 2Centre for Ore Deposit and Earth Sciences, University of Tasmania, Hobart, TAS, Australia
- 3Institute for Marine and Antarctic Studies (IMAS), University of Tasmania, Hobart, TAS, Australia
- 4National Museum for Nature and Science, Tsukuba, Japan
- 5Department of Earth, Environmental and Life Sciences, University of Genova, Genova, Italy
Monitoring active seafloor processes requires repeated, comparable surveys to enable change detection. The change detection of the deep ocean floor, however, is rare due to a paucity of repeat data at an appropriate resolution. In this study, we use an exceptional suite of bathymetric surveys across a spatiotemporal range at the submarine Havre volcano, Kermadec arc, Southwest Pacific, to investigate geomorphic change over 13 years (2002, 2012, and 2015). The integration of bathymetric observations with remotely operated vehicle (ROV) observations and sampling data refined geomorphic boundaries, and four geomorphic groups at varying scales are interpreted: (i) large-scale tectonic and volcanic features, e.g., faults and calderas; (ii) coherent volcanic products, e.g., lavas; (iii) clastic primary volcanic products, e.g., giant pumice deposits; and (iv) mass-wasting features and products, e.g., landslide scarps. Three 25-m resolution geomorphic maps for broad-scale feature change and high-resolution 1-m autonomous underwater vehicle (AUV) bathymetry are used to develop a fine-scale geomorphic map that reveals additional landforms and processes. We integrate bathymetric data with sampling data and ROV video footage of the seafloor to refine geomorphic boundaries. We also integrate the results of previous geological studies of Havre to inform the geomorphic interpretation. Our map reveals a variety of geomorphic forms from a range of volcanic and mass-wasting processes that aid in the interpretation of the growth and evolution of submarine volcanoes. One new observation reveals a significantly larger scale of cryptodome emplacement than recognized previously recognized, accounting for an additional volume of 0.0055 km3 to the 2012 eruption products. This emplacement took place along two linear southern caldera ring faults and likely continued after the formation of the giant pumice raft on 18 July 2012. A key result is the extension of the timeline for the emplacement of volcanic products associated with the 2012 eruption, revealing an additional volume growth of 0.001 km3 on the primary dome (dome OP) between 2012 and 2015. This additional emplacement is documented in this study for the first time and extends the known volcanic emplacement timeline from 3 months to a maximum of 3 years. Our work reveals seafloor modification continuing long after an observed volcanic eruption event as lingering lava emplacement and mass wasting remobilize newly erupted and older products that comprise the edifice.
1 Introduction
Tectonic and volcanic processes sculpt and re-shape submarine volcanic terrains. Relict forms are modified by fresh events or ongoing processes, resulting in a mix of geomorphologies at varying spatial and temporal scales (Thouret, 1999). Growth, or constructional features (i.e., lava domes and lobes and volcaniclastic deposits), and decay, or destructional features (i.e., slope failures, debris avalanches, scarp retreat, and gullies) of submarine volcanic terrains exhibit distinct geometries and textures (Lipman, 1997; Thouret, 1999; Branney and Kokelaar, 2002; Favalli et al., 2005; Whelley et al., 2014; Whelley et al., 2017; Korzeniowska et al., 2018). These geometries and textures can be used to delineate forms and geomorphic units, which are crucial for interpreting submarine volcanic evolution. The paucity of deep-marine bathymetric data and the often single-pass nature of marine surveys, however, yield only a static view of a dynamic environment (Wright et al., 2008; Watts et al., 2012; Paduan et al., 2016; Chadwick et al., 2018). Without precise, repeated, multi-sensor surveys, change detection is impossible, and accurately modeling the extent and frequency of change in seafloor processes and events is limited.
The submarine Havre volcano, on the Kermadec arc in the Southwest Pacific, is a well-surveyed exception, unlike most submarine volcanoes (Figure 1). The volcano has been surveyed numerous times, initially in 2002, most notably in 2012 by the RV Tangaroa after the largest observed deep-marine silicic eruption on record, and again in 2015 by the RV Roger Revelle and the autonomous underwater vehicle (AUV) Sentry. The four bathymetry datasets provide both low (25 m)- and high (1 m)-resolution bathymetry over 13 years, encompassing a large-scale complex eruption that included modification of the caldera and its features. The Havre volcano data provide a rare high-resolution and high-density view of a submarine volcanic environment that surpasses many terrestrial examples in detail and allows a unique view of submarine caldera evolution.
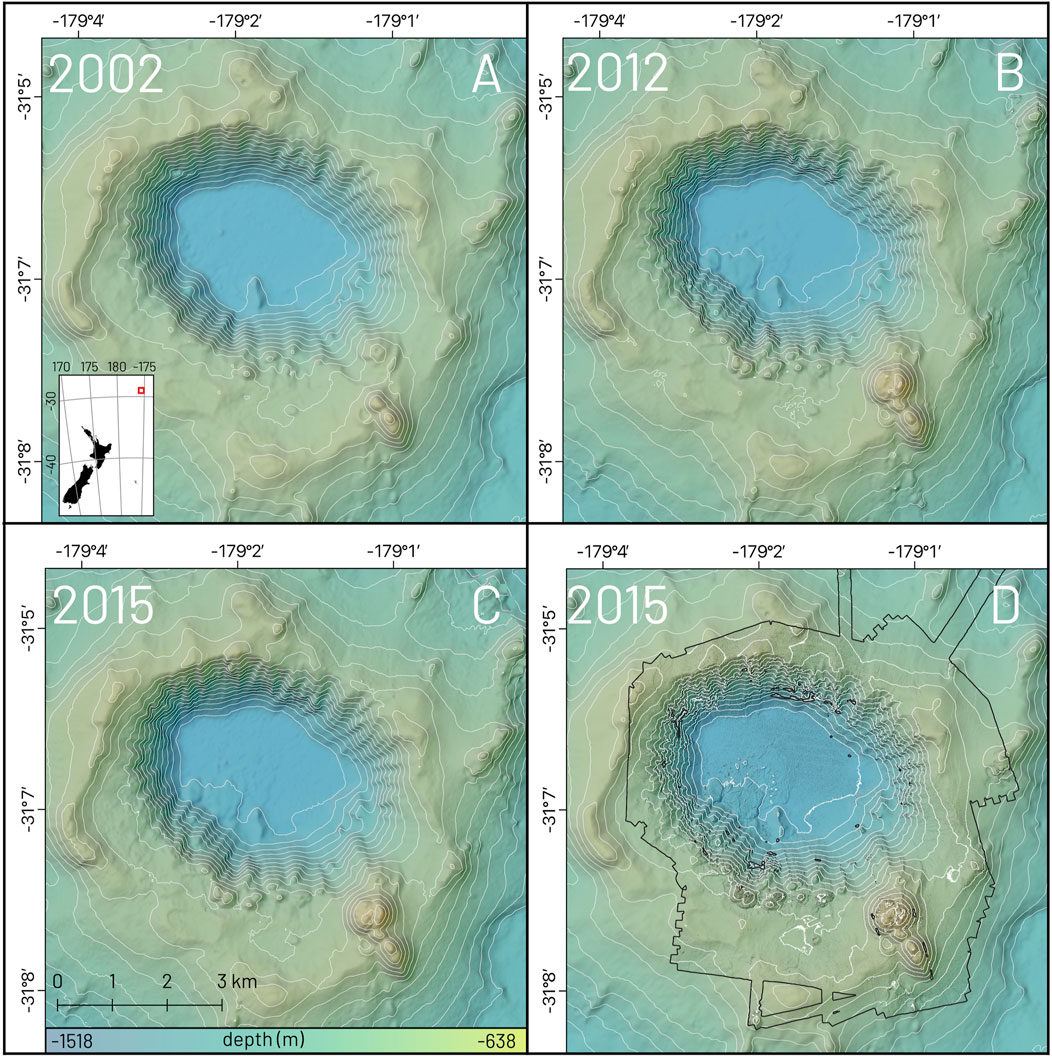
Figure 1. Digital elevation models of the Havre volcano, from the (A) 2002 RV Tangaroa survey (30-kHz EM 300 MBES, 25 m resolution); (B) 2012 RV Tangaroa survey (30-kHz EM 302 MBES, 25 m resolution); (C) 2015 RV Roger Revelle survey (12-kHz EM 122 MBES, 25 m resolution); and (D) 2015 Sentry survey (400-kHz Reson SeaBat 7125, 1 m resolution). Contours at 50-m intervals. Inset in (A) shows the regional location of the Havre volcano, ∼840 km north–northeast from Aotearoa/New Zealand, along the Kermadec arc, with the exaggerated red square indicating the survey area. Sun illumination at 315°, WGS84 UTM 1S projection.
We examine geomorphometric variables of pre- and post-eruption multibeam bathymetry across a continuum of spatial and temporal scales at the Havre volcano to
1. Build large-scale (25 m resolution) geomorphological maps and a fine-scale (1 m resolution) detailed geomorphological map, combining high-resolution AUV bathymetry, remotely operated vehicle (ROV) video footage, and a synthesis of previous work.
2. Provide a time-series geomorphic analysis and identify the persistent submarine volcanic geomorphological features.
3. Undertake a change detection analysis to reveal which areas of the deep-marine caldera have undergone substantial constructional and/or destructional processes pre-, syn-, and post-eruption.
2 Geological setting
The Havre volcano is a submarine silicic caldera ∼840 km northeast of Aotearoa/New Zealand, along the Kermadec Arc (Figure 1). The Kermadec Ridge lies ∼35 km to the east, while the rifted back-arc basin seafloor lies ∼10 km to the west. This fabric abuts the 37 km × 21-km Havre volcano edifice, which is situated ∼1,040 m above the surrounding seafloor at a water depth of ∼900 m and has a constructional volume of 93 km3 (Wright et al., 2006). The caldera rim proper is near-circular, with a ∼5 km diameter NW-SE and a 4 km diameter NE-SW, with a slight dominant lengthwise orientation of 305°. Steep (up to 40° slope) caldera walls, with a mean water depth of ∼930 m (w.d.), encircle a 585-m-deep bowl from the rim (1,520 m mean w.d.).
The volcano erupted in July 2012, producing a pumice raft of >400 km2 on the sea surface. The raft volume was calculated at 1 km3 (up to a dense rock equivalent [DRE] of 0.25 km3) (Jutzeler et al., 2014). The eruption produced 15 new silicic lava domes and lobes, emplaced along the southwestern (SW) caldera wall and southern caldera rim, including a large dome (dome OP) on the southeast (SE) rim. Volume estimates of 0.21 km3 (DRE) for lavas and domes, of which 0.11 km3 was contributed by the combined dome OP, and 0.1 km3 (bulk) for giant pumice (GP) were calculated (Carey et al., 2018; Ikegami et al., 2018). An earthquake swarm, reaching up to M4.9, was also recorded before and during the event but was poorly located at the time (Carey et al., 2014). Mittal and Delbridge (2019) describe a swarm of M > 3.5 earthquakes that accompanied the eruption. A comprehensive geological background of the Havre volcano is outlined by Wright et al. (2006); Carey et al. (2018); Ikegami et al. (2018); and McPhie et al. (2020); the eruptive timeline is well described by Ikegami et al. (2018).
3 Data and methods
3.1 Bathymetry
Four different multibeam echosounders (MBESs) acquired data during the four repeat surveys of the Havre volcano (Table 1): the 2002 pre-eruption survey used a Kongsberg EM 300 (30 kHz) echosounder on RV Tangaroa (Figure 1A); the post-main eruption response survey in October 2012 used a Kongsberg EM 302 (30 kHz) echosounder, again on RV Tangaroa (Figure 1B); and the 2015 targeted survey used both a Kongsberg EM 122 (12 kHz) on RV Roger Revelle (Figure 1C) and a Reson SeaBat 7125 (400 kHz) on the AUV Sentry (Figure 1D). Bathymetry data were processed following the best practices outlined in respective voyage reports or published articles, including those by Wright et al. (2006) for 2002 data, Wysoczanski et al. (2013) for 2012 data, and the MESH Voyage Report for 2015 data. Data processing includes standard sound speed and position corrections and acoustic artifact (“ping error”) cleaning.
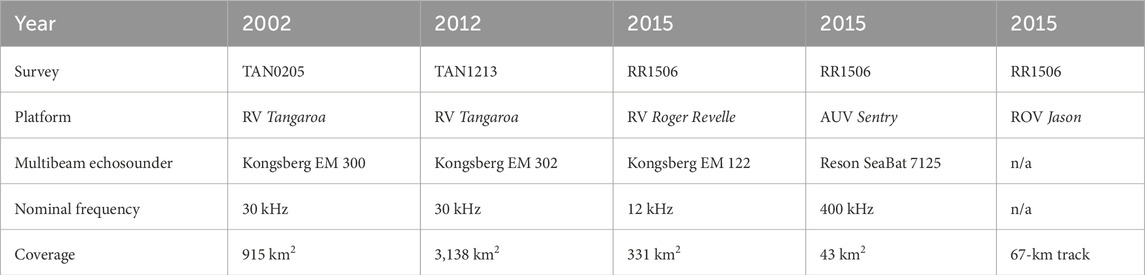
Table 1. Details of the four repeat surveys over the Havre volcano examined within this paper.
All digital elevation models (DEMs) of the Havre volcano were projected into WGS84 UTM Zone 1S. All DEMs, excluding the high-resolution (1 m) AUV DEM, were resampled down to 25 m to fit the coarsest resolution surface, using QGIS v3.16. All DEM extents were matched and aligned along eastings and northings. The DEM pixel numbers were also matched to ensure that rasters were dimensionally divisible to allow for accurate change detection (Wheaton et al., 2009).
3.2 Magnetic anomaly data
AUV Sentry collected vector magnetic data using an APS three-axis flux gate magnetometer at an average altitude of ∼50 m above the seafloor. The three-component magnetic data (x, y, and z) were transformed into a total-intensity magnetic field. The measured magnetic field was then corrected for the magnetic effect originating from the vehicle itself by fitting the sinusoidal variation in the magnetic field data observed as the AUV spins during its descent/ascent to/from the seafloor (Tivey et al., 2003). Following the magnetometer spiral calibration, residual noise from the AUV was less than 0.2% of the magnetic anomaly magnitude. Magnetic anomalies were obtained by subtracting the International Geomagnetic Reference Field (IGRF; Thebault et al., 2015). The resulting magnetic anomaly data were then interpolated onto a 20-m-spaced grid using a minimum-curvature algorithm. The magnetic anomaly grid was then inverted to correct for topographic effects and the uneven track of the AUV. We used a discrete set of juxtaposed prisms with 50-m horizontal resolution, with tops defined by the bathymetric level and bottoms at a constant depth of 2,000 m. The resulting crustal magnetization of each block was then determined by least-squares linear optimization.
3.3 Derivatives
Spatial analysis toolboxes in QGIS v3.16 and System for Automated Geoscientific Analyses (SAGA) algorithms were used to create bathymetric derivatives for all four DEMs, including the slope, standard deviation of the slope, and topographic position index (TPI) (Conrad et al., 2015) (Figure 2 shows the slope and standard deviation of the slope). The slope was used to delineate obvious changes in the slope between large-scale features and contacts or boundaries of various volcanic products and geomorphological features at all scales. Broad and fine-scale TPIs were used to note areas of discrete high and low topography to delineate fault features, ridge lines, and gullies.

Figure 2. Slope (left column) and standard deviation of slope (right column) derivatives of surveys (A, E) 2002 RV Tangaroa, (B, F) 2012 RV Tangaroa, (C, G) 2015 RV Tangaroa 25 m, and (D, H) 2015 Sentry 1 m DEMs. Geological changes, sensor differences, and artifacts become apparent in the derivatives, particularly areas with a standard deviation of slope >5 (bright yellow). Sun illumination at 315°, WGS84 UTM 1S projection.
The standard deviation of the slope is a robust proxy for seafloor texture that has been used to delineate various lava products, both submarine and subaerially (Whelley et al., 2014; Whelley et al., 2017; Korzeniowska et al., 2018). The textures of giant pumice (GP) are emphasized by the 1-m resolution standard deviation of the slope layer, which was used to extract GP coverage maps. Areas with >4 standard deviation of the slope were re-classified as GP and converted to a binary class, and footprints of the GP areas were extracted. Polygons >1 m and <10 m were retained, with polygons >10 m excluded from the analysis to remove stacked clasts and limit the analysis to observed maximum GP sizes (Carey et al., 2018; Ikegami et al., 2018; Mitchell et al., 2019). The resulting polygons were used as a proxy for individual clasts. Areas of known acoustic artifacts or features were also removed, e.g., extruded fresh lavas, caldera walls, and ping errors. The standard deviation of the slope also emphasizes a known artifact in the 2012 EM 302 data along the southwestern wall. This artifact was perpetuated through all analyses; any interpretation within that area is treated with due caution.
3.4 ROV video footage and temperature sampling
Approximately 250 h of video footage was collected over 12 dives during the 2015 survey using the ROV Jason (Figure 3). Stills were analyzed using both a forward-looking Insite SuperScorpio Sony Camera and a downward looking MISO-OSI 16 MP camera. The video was analyzed from the three Insite Mini Zeus 1080i Camera video footages. Water temperature values were recorded underway using a miniature autonomous plume recorder (MAPR); discrete seafloor and sub-seafloor temperature values were recorded using a stand-alone heat flow (SAHF) meter. Extensive event logs were recorded during the twelve 2015 ROV dives by onboard scientists and technicians.
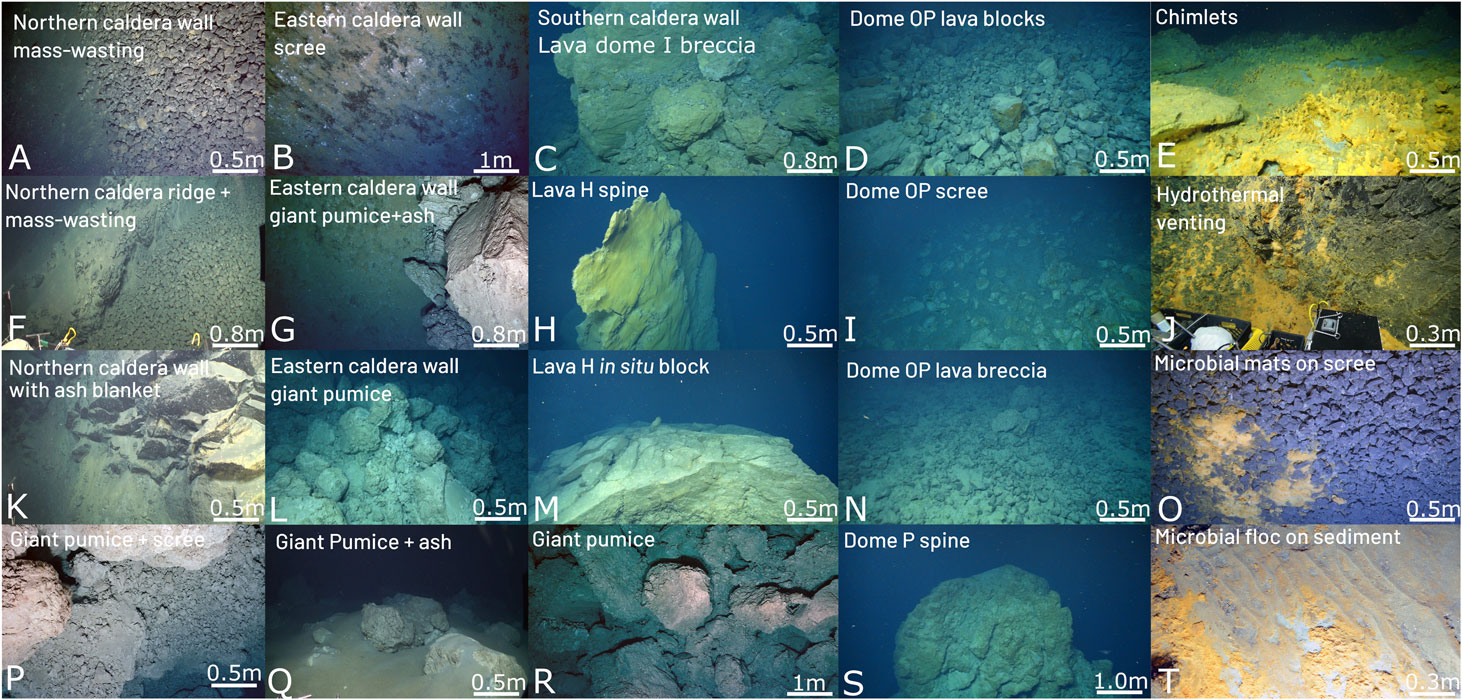
Figure 3. ROV footage showing seafloor features described by Carey et al. (2018), Ikegami et al. (2018), and McPhie et al. (2020). (A) Northern caldera wall mass-wasting fine and coarse (cobble- or boulder-sized) pumice scree; (B) eastern caldera wall mass-wasting scree; (C) lava dome I breccia on the southern caldera wall; (D) dome OP lava blocks; (E) hydrothermal chimlets along the southern caldera rim; (F) northern caldera wall ridge and scree; (G) eastern caldera wall ash and GP boundary; (H) lava H spine; (I) dome OP scree; (J) hydrothermal fluid venting; (K) northern caldera wall topography showing transition into steep wall features; (L) eastern caldera wall GP deposit showing multiple stacked clasts; (M) fractured in situ lava H block; (N) dome OP lava breccia; (O) microbial mat and hydrothermal venting on scree deposit along the northern caldera wall; (P) GP and scree boundary; (Q) ash with scattered and buried GP; (R) multiple stacked clasts of GP; (S) lava dome P spine; and (T) orange flocculent microbial mat.
Post-survey, voyage event logs were cleaned (removing erroneous entries, fixing spelling, and consolidating terms) and re-coded in QGIS to indicate where key features were observed. These logs helped guide video footage interrogation and geomorphic boundary refining. Using these logs, we analyzed the video footage for regional and local topographic, geomorphic, and lithic composition to verify surface slope, roughness, and textures observed in bathymetric derivatives.
3.5 Geomorphic change detection
Initial geomorphic change detection (GCD) calculations were conducted by Carey et al. (2018) and Ikegami et al. (2018), with volumetric calculations undertaken only on lava and dome regions between the three datasets. In this section, we expand the GCD to analyze all three lower-resolution (25 m) DEMs, including both geomorphic increase and decrease. We estimate and incorporate a uniform 10-m detection limit threshold into all GCD analyses to account for assumed sensor differences and vertical uncertainty in deep water (>1,000 m w.d.) and uncertainty in the three grids (Brasington et al., 2003; Wheaton et al., 2009; Schimel et al., 2018). Any observed change that occurs within this 10-m threshold is deemed untrustworthy and excluded from further analysis; a change above this threshold is deemed trustworthy. A detection limit threshold was chosen as the grids were provided in processed form; uncertainty estimations were based on known sensor uncertainties between systems and certainty loss with depth.
Three difference rasters were created to compare the periods 2002–2012, 2012–2015, and 2002–2015. All different rasters were then overlain with the high-resolution 1-m grid to determine whether volumetric changes correspond with observable morphological features in the high-resolution (1 m) DEM. Volume calculations were made by multiplying the height change (increase or decrease) per pixel of change. Volume change estimates in areas with high degrees of slope were treated with caution.
3.6 Geomorphic maps
Geomorphic units of lower-resolution (25 m) DEMs were delineated in QGIS (v3.16) based on the slope, roughness, topographic position metrics, and the GCD analysis. Geomorphic units of the high-resolution (1 m) DEM were identified and hand-drawn in QGIS based on the slope, roughness, topographic position metrics, the large-scale GCD, and observable morphological features cross-referenced with video footage. The fine-scale map units were also based on a synthesis of previous geological analyses undertaken by Wright et al. (2006), Carey et al. (2014), Carey et al. (2018), Ikegami et al. (2018), McPhie et al. (2020), and Murch et al. (2020). Criteria for allocation to specific geomorphic units, along with statistical and geometric measures of each unit, are described in Supplementary Material Table 1. The definitions and naming conventions of geological facies from the previous literature (Carey et al., 2018; Ikegami et al., 2018; McPhie et al., 2020) predominantly remain unchanged, including the alphabetization of lava lobes and domes.
Four geomorphic groups encompassing both constructional and destructional processes are interpreted in the large- and fine-scale maps: (1) large-scale tectonic features, e.g., faults and ridges; (2) large-scale volcanic features, e.g., calderas and craters; (3) coherent volcanic products, e.g., lava lobes and domes; (4) clastic volcanic products, e.g., ash–lapilli–block and GP deposits; and (5) mass-wasting features, e.g., debris deposits, scarps, and mega-blocks. Geomorphic units are given in Table 2. The spatial characteristics of units are given in Supplementary Material Table 1.
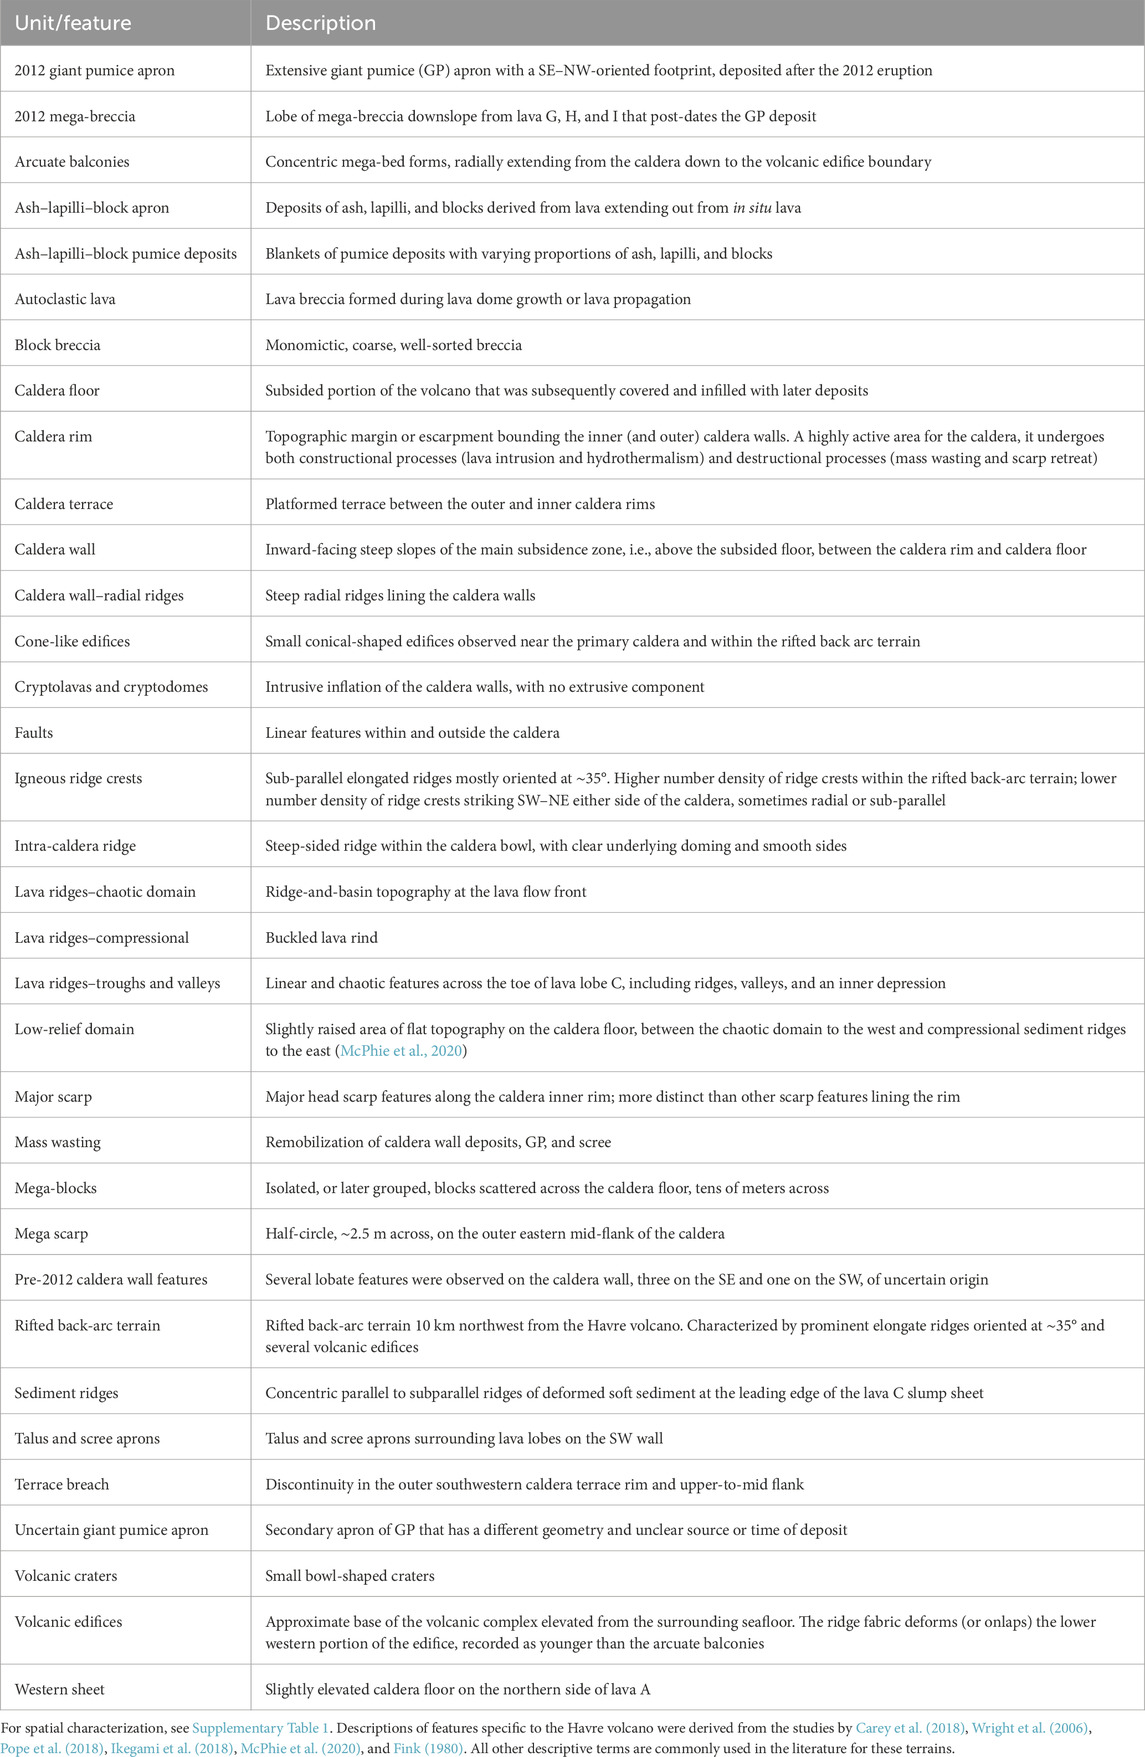
Table 2. Summary of the Havre volcano geological and geomorphological features.
The fine-scale map produced from the 1-m AUV bathymetry allowed us to define broad-scale unit boundaries more precisely, record geological facies, and interpret geomorphological processes obscured in the lower-resolution data. The scale of the high-resolution bathymetry means any geomorphic units that feature volcanic material <1 m in size, including ash, ash–block–lapilli, or scree deposits, were largely unresolvable. These deposits are defined for locations where video footage is available but cannot be robustly defined elsewhere. Mass-wasting evidence along steep slopes (i.e., scarps, scars, and debris deposits) could be delineated in some areas. Similarly, hydrothermal venting areas were recorded and included both diffuse and point-source fluid venting, hydrothermally altered material and sediment, and ecology suggestive of nearby venting (i.e., extensive bacterial mats) (Figures 3E, J, O, T).
4 Results
4.1 Large-scale geomorphic and geologic time-series maps of the Havre volcano
The large-scale geomorphic and geologic (Figure 4A) and Havre volcano maps (Figures 4B–D) show tectonic and volcanic features, including the volcanic edifice of Havre, the edifice surrounding Havre rock to the SE, a partial edifice to the NE, the rifted back-arc terrain to the NW, arcuate balconies (also called “concentric escarpments” by Wright et al. (2006)), numerous cone-like edifices (i.e., volcanic cones and small seamounts) distributed across both the rifted zone and the Havre volcano edifice, igneous ridge crests [“fissure ridges” as described by Wright et al. (2006)], the terrace breach feature, and a mega-scarp on the SE [interpreted as a sector collapse by Wright et al. (2006)].
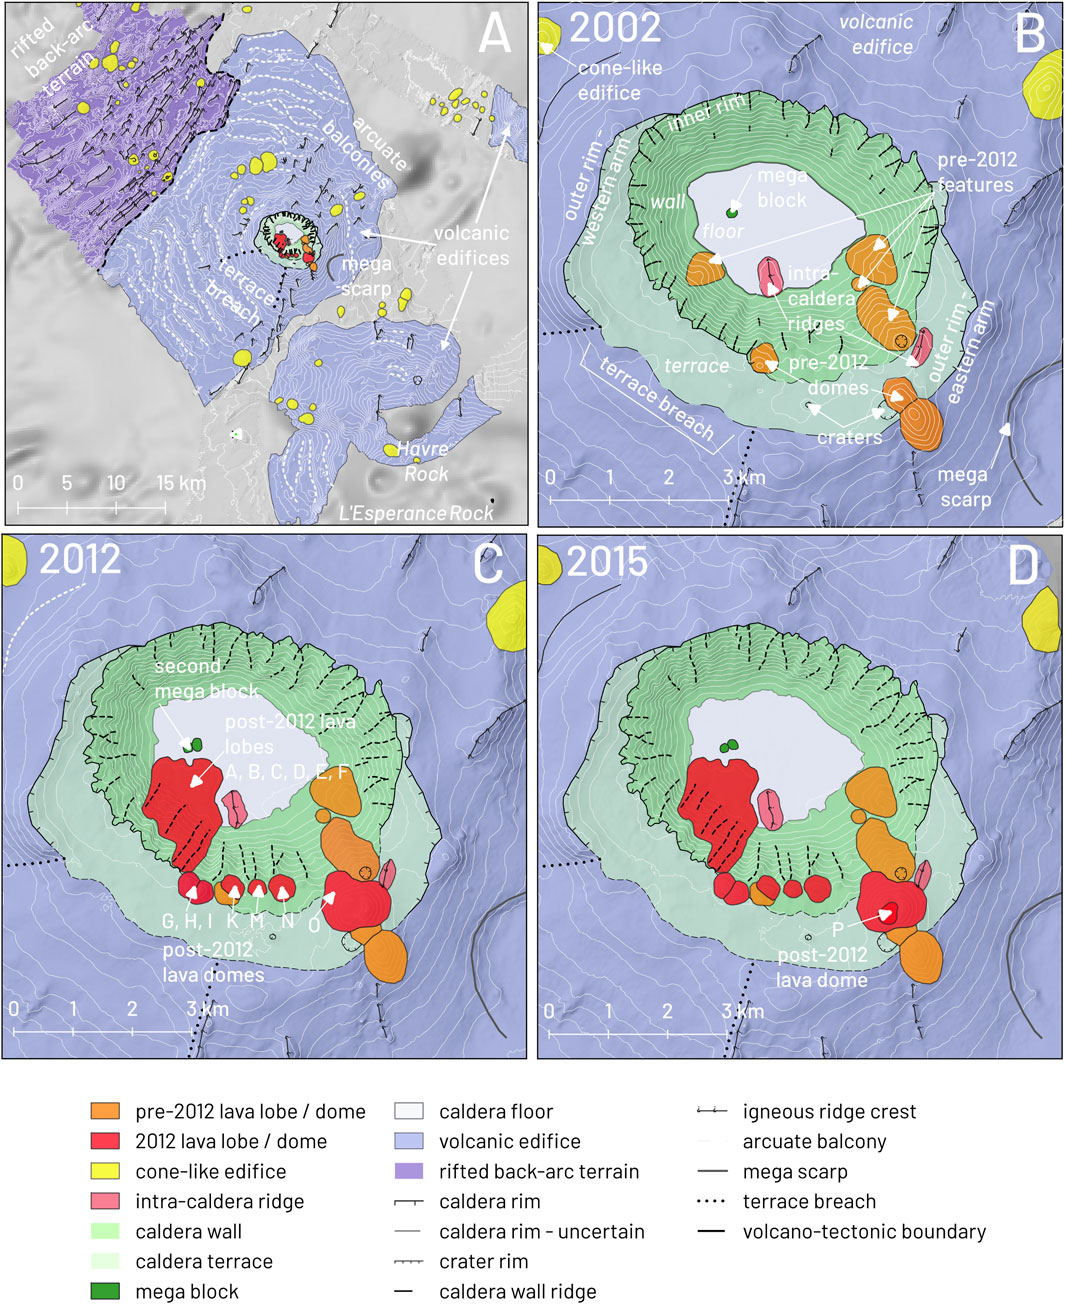
Figure 4. (A) Geomorphic and geologic map of the Havre volcano region as captured by bathymetry collected in 2012. Arcuate balconies, relict lava domes, intra-caldera ridges, and vent-like edifices mark episodes of past volcanism outboard of the caldera. Post-2012 eruption products are shown in red. Descriptions of features are given in Table 2. The Havre volcano as captured by bathymetry observations collected in (B) 2002, (C) 2012, and (D) 2015. Large-scale features from 2002 (A and B), such as the caldera outer rim and terrace, terrace breach, mega scarp outboard of the rim, and pre-2012 domes on the inner rim and outer eastern rim arm, maintained a consistency of form for over 13 years. Post-2012 eruption products, lava lobes and domes, and an additional mega-block are shown in (C). The emplacement of lava dome P is shown in (D). Descriptions of features are given in Table 2.
All large-scale features observable in the lower-resolution datasets outboard of the outer rim did not change over the time-series analysis, with no recent observable foundering of the edifice, new cone growths, or other volumetric changes (Figure 4D). This stasis is also noted for some features inboard of the outer rim, including the caldera terrace, outer-rim arms, intra-caldera ridges (“elongated fissure cone”; Wright et al. (2006)), and volcanic craters. Several features within the caldera rim show significant changes (Figures 4B–D). Descriptions of all broad-scale features outside the caldera rim reflect a synthesis of bathymetric surveys conducted in 2002, 2012, and 2015.
4.1.1 Regional volcano–tectonic features
Rifted back-arc basin terrain abuts the northwestern (NW) boundary of the Havre volcano edifice (Figure 4A). The fabric hosts numerous sub-parallel elongated ridge crests (1,100 m of mean length), mostly oriented at ∼035°, consistent with the orientation of faults from the Kermadec back-arc region (Wright et al., 2006). Here, 32 cone-like volcanic edifices dot the rifted fabric (Figure 4A; n.b.: some cones lie outside the map frame), ranging from 260 to 1,500 m in diameter (measured lengthwise when elongated). Several of these are cross-cut by faults, which may indicate that the cones predate more recent tectonic deformation of the rifted back-arc basin. Seven kilometers southeast of the Havre volcano rim lies the edifice edge that hosts Havre and L′ Esperance Rock (Figure 4A). Here, seven cone-like features dot the edifice, ranging from 650 to 1,740 m in diameter.
4.1.2 Havre volcano
The Havre volcano is quasi-circular, 5.4 km lengthwise from NW to SE, 4.4 km width-wise from NE-SW, and encircled by two overlapping caldera rims (Figures 4A, D). The 17-km circumference inner rim has well-defined boundaries except in the SE, where it is overprinted by recent volcanism. The W outer arm has a steep face (up to 35°) toward the inner rim, while the SE arm is bounded to the south by a gradual slope (∼15°) outboard of the rim (Figure 4D). The 21-km circumference outer rim connects with the inner rim along its northern boundary and has two well-defined arms extending to SW and SE (Figure 4D). Along the southern rim between the outer arms, the caldera boundary is poorly defined and grades smoothly into the caldera flank (Figure 4D).
4.1.3 Caldera terrace
Constructional volcanic products line the southern caldera rim and extend, in places, from the caldera terrace to the caldera floor. A 10-km2 caldera terrace lies between the inner and outer rims, encompassing all the boundaries except the northern boundary (Figure 4B). The terrace maintained a consistent areal extent over the time series, with no foundering or lava accretion. In 2002, the terrace hosted two conjoined lava domes, one inside the SE terrace boundary (550 m basal diameter lengthwise and 120 m relief) and the second outside the SE outer caldera rim on the caldera flank (Figure 4B). Abutting the conjoined domes is a partially buried ∼340-m-diameter bowl-shaped volcanic crater; a smaller crater (0.06 km edifice) lies buried mid-terrace, ∼1 km W of the conjoined lava domes. An intra-caldera ridge, with 010° orientation, lies NE of the inboard lava dome. A third volcanic crater (190 m diameter) lies within the gently sloping (15°) SE side of the caldera wall, at the head of a caldera wall feature of unknown genesis (Figure 4D). A pre-2012 lava dome, referred to as “lava J,” situated on the southern inner rim of the caldera and spans an area of 0.19 km2 (Figures 4B, C).
4.1.4 Caldera walls and floor
Steep (>40° slope in areas) walls line the caldera bowl, marked with radial ridges and deep gullies, except for the SE boundary, which has a mean slope of 20° (Figure 4B). Three lava lobe-shaped features (age unknown) were recorded in 2002 as a break in slope and areas of increased roughness at the gently sloping SE caldera wall, at top- and mid-slopes (Figure 4B). A fourth lava lobe-shaped feature (age unknown) lies at the SW mid-slope caldera wall, extending down to the caldera floor (Figure 4B). These features are likely relict lava lobes; however, they are difficult to interpret in low-resolution data as caldera walls are active environments with complex fault-related movement and surface processes. The 4.4-km2 caldera floor has <5° slope, except in areas where a 650-m-long intra-caldera ridge protrudes from the southern caldera wall into the caldera bowl and where a solitary 0.025-km2 mega-block rests on the floor, ∼560 m from the western wall (Figure 4B). The W caldera inner rim showed ∼100 m of scarp retreat by 2012, while the NW caldera floor perimeter also retreated by ∼90 m. In 2012, a second mega-block (0.021 km2) abutted the previously solitary 0.025-km2 mega-block observed in 2002 (Figure 4B). The caldera rim, walls, and floor showed no significant morphological changes between 2012 and 2015 (Figures 4C, D).
4.1.5 Lava domes
Features along the inner caldera rim experienced multiple morphological changes observable in the low-resolution bathymetry between 2002, 2012, and 2015. The 2012 survey, undertaken in response to the observed pumice raft, revealed the emplacement of a 0.9-km2 lava dome, “dome O” (Carey et al., 2018; Ikegami et al., 2018), on the SE caldera terrace (Figure 4C). The dome, with a 1,160-m basal diameter lengthwise west to east, overlaps the pre-2012 inboard conjoined lava dome and the nearby intra-caldera ridge, while its northern edge descends the SE caldera wall ∼290 m (Figure 4C). The dome has a spoon-shaped amphitheater ∼380 m across its center. The 2015 survey revealed one notable morphological change: the emplacement of lava P (0.09 km2) in the dome O amphitheater (Figure 4D).
Five domes (0.07–0.15 km2 area) line the southern inner caldera rim on the top slopes of the caldera wall: lava domes H, I, K, M, and N ((Carey et al., 2018; Ikegami et al., 2018) (Figure 4D)), with lava dome K overlapping the pre-2002 dome (lava dome J). Lava dome G (Carey et al., 2018; Ikegami et al., 2018) was not discernible in the lower-resolution bathymetry of 2002, 2012, or 2015. No significant morphological changes to the caldera terrace, apart from lava P emplacement, were recorded between 2012 and 2015.
4.1.6 Lava lobes
The post-eruption 2012 survey revealed the emplacement of several lava lobes on the caldera wall, originating from the SW top- and mid-slopes, spreading laterally on the caldera floor, as investigated by Carey et al. (2018), Ikegami et al. (2018), and McPhie et al. (2020). In the low-resolution 2012 data, these lava lobes appear to entirely subsume the previously described pre-2012 wall feature as it is no longer discernible (Figure 4C). The lava lobes show no significant changes in the low-resolution data between 2012 and 2015 that could not be attributed to the artifact.
4.2 Fine-scale geomorphic and geologic map of the Havre volcano
The fine-scale geomorphic and geologic map of the Havre volcano produced from 1-m resolution AUV bathymetry and ROV video footage has allowed us to resolve deposition products and emplacement processes to a level of detail not achievable with low-resolution data (Figure 5). Over 4,070 events recorded during video transects revealed a variety of geologic and geomorphic features, including mass-wasting features (scree, rubble, debris, and scarps) (Figures 3A, B, F, G), lava (Figures 3D,M), lava spines (Figures 3H, S), pumice (Figure 3L), GP (Figures 3G, L, P, Q, R), breccia (Figures 3C, N), lapilli (Figures 3D, I), ash (Figures 3G, K, Q, R), scarps, cliffs (Figure 3K), contacts, boundaries, hydrothermally altered rocks and sediment, and hydrothermal venting evidence (water discharge, hydrothermal vents, and microbial and bacterial mats) (Figures 3E, J, O, T). Dominant geomorphic and geologic units are described below, focusing on the constructional and destructional differences compared to the pre-eruption survey. The following sections discuss the work by Carey et al. (2018), Ikegami et al. (2018), and McPhie et al. (2020), followed by new observations.
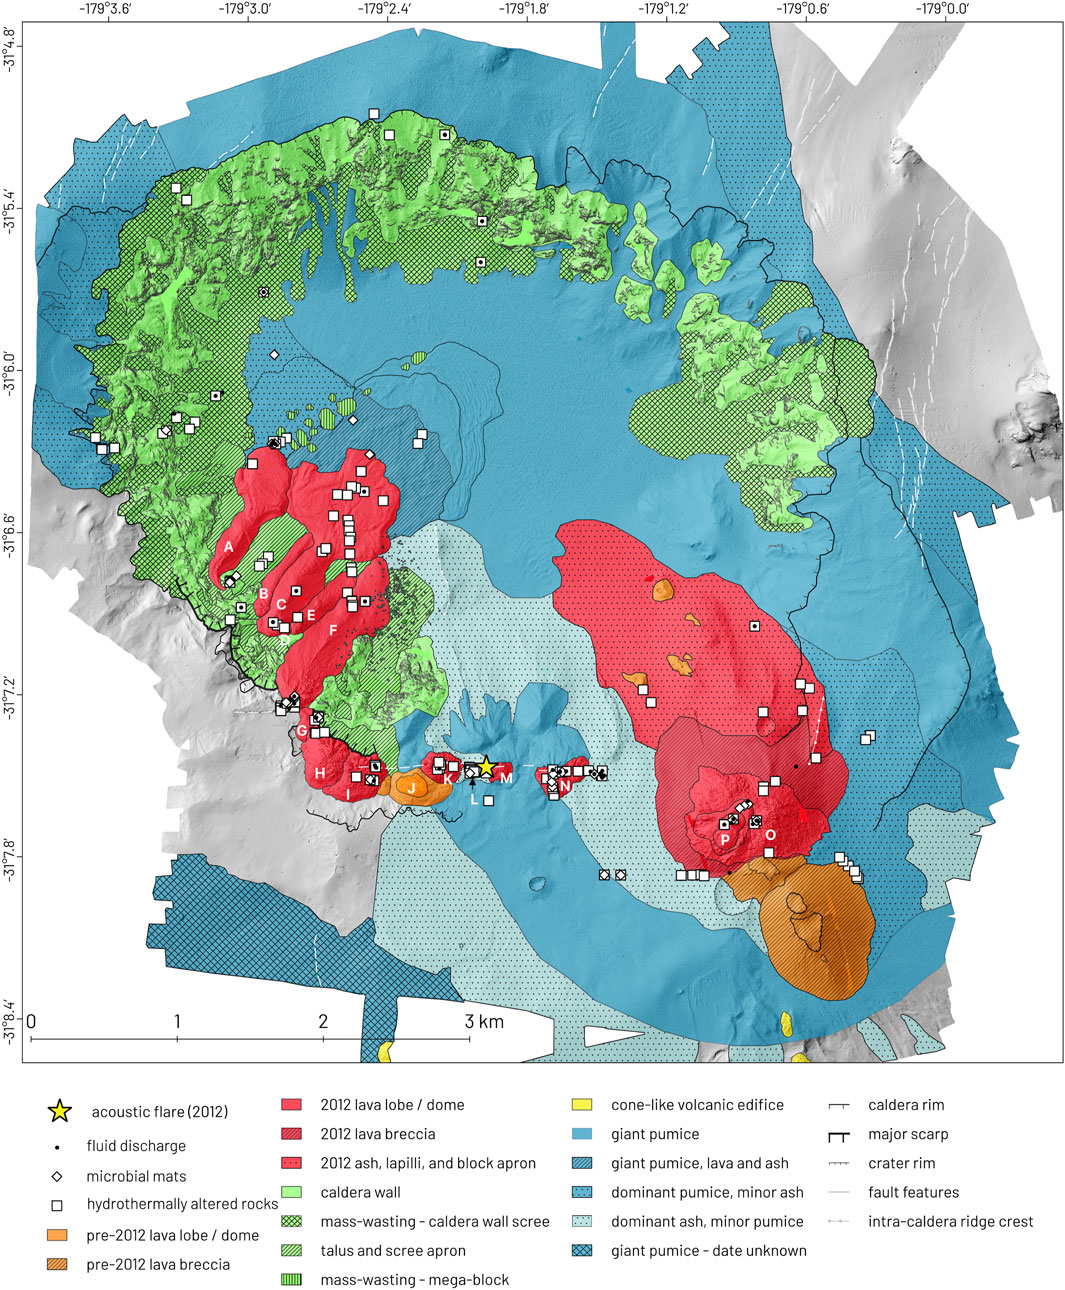
Figure 5. Fine-scale geomorphic and geologic map from 1-m resolution bathymetry, showing both large- and small-scale features across the Havre volcano and resolving features not possible in low-resolution bathymetry. Details are given in Figure 6.
4.2.1 Lava lobes
Lava lobes were emplaced along the mid-slopes of the SW caldera wall during the 2012 eruption, where lava extruded into the caldera and flowed downslope following relict gullies (Figures 5, 6A). Local topographic features of the caldera walls (steep scarps, caldera wall ridges, and relict lobes) control the lobe morphologies observed at the mid-slopes and the caldera floor (Ikegami et al., 2018). Lava A (0.24 km2), B (0.058 km2), C (0.57 km2), E (0.073 km2), and F (0.34 km2) have narrow upper lobes and are near-triangular in cross-section; A, B, and C have compressional ridges along their spines caused by stalled downslope flow that has buckled the outer lava crust (Fink, 1980; Ikegami et al., 2018; McPhie et al., 2020) (Figures 5, 6A, B). Late-stage breakout lobes extend from lobes A and C (Ikegami et al., 2018). Lobes A and C exhibit a rough outer surface, composed of chaotic, blocky lava clasts, except on the lower flanks where they are bounded by small grain-sized talus and scree aprons (Figures 5, 6L). At the caldera wall base, lava lobes A and C laterally spread into flat, broad lobes that contact the sedimented caldera floor (Figures 5, 6B). Here, high surface roughness on flat surfaces is generated by some large lava clasts and giant pumice clasts. Smooth, steep slopes bound the toe of lava A, clearly demarcating its contact with the caldera floor, while sub-parallel compressional ridges cover the entire toe (Figures 5, 6J).
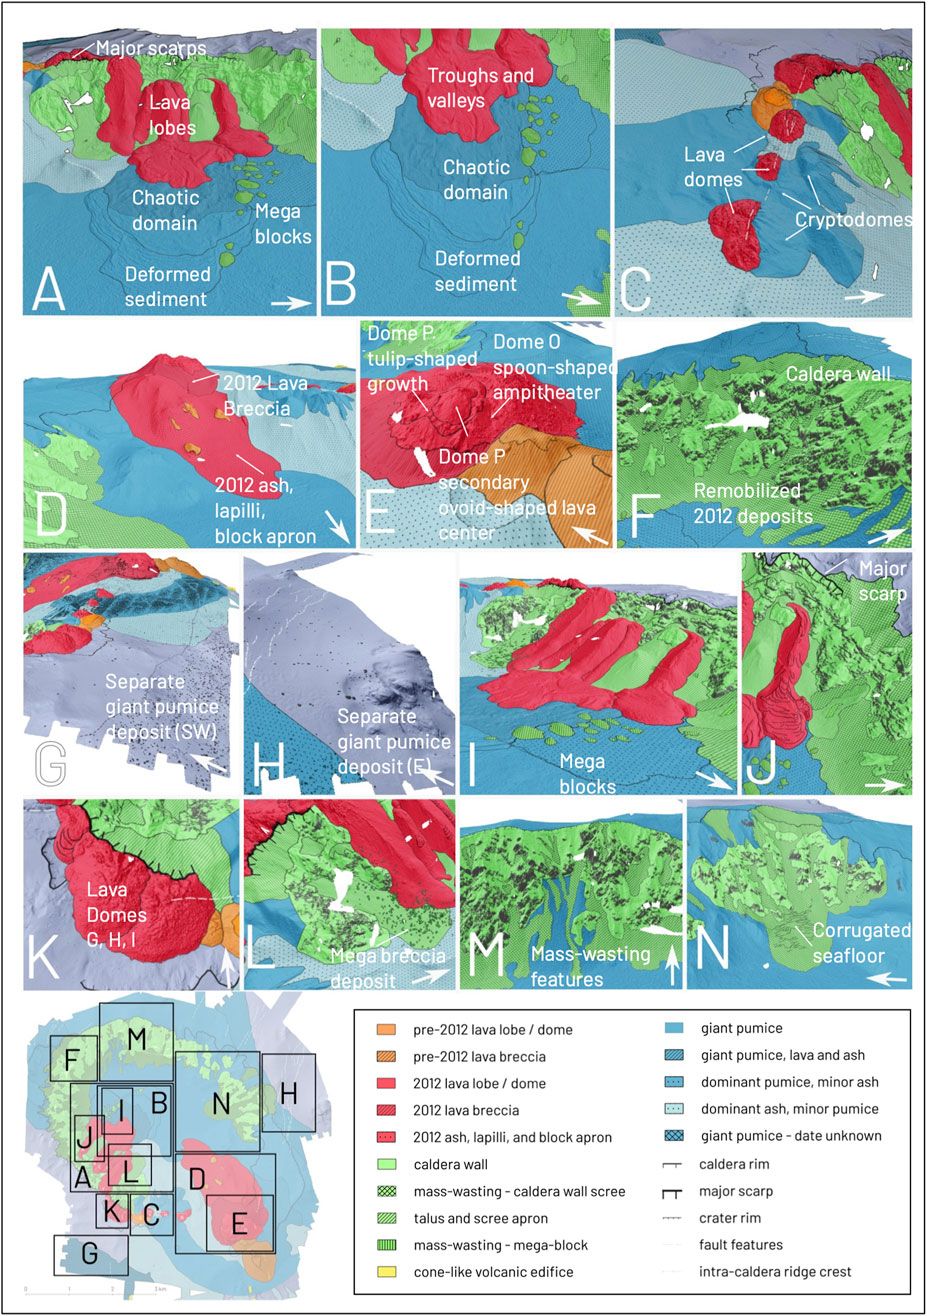
Figure 6. Highlights of the fine-scale geomorphic and geologic map: (A) lava lobes A–F along the southwestern caldera wall; (B) chaotic, low-relief, and deformed sediment domains of lava C; (C) lava domes I–N along the southern caldera wall, aligning with fault features and underlain by cryptodomes; (D) pumice, ash, lapilli, and block apron of dome OP; (E) lava dome OP and clastic lava apron; (F) steep caldera wall and remobilized 2012 deposits on the NW rim; (G) SW uncertain giant pumice apron; (H) eastern outer giant pumice apron; (I) mega-blocks; (J) major scarp above lava A; (K) lava dome (G, H, and I), looking north downslope to the mega-breccia deposit; (L) mega-breccia deposit; (M) mass-wasting features of the northern caldera wall; (N) mass-wasting features of the eastern caldera wall. Inset shows approximate locations.
The toe of lava C spreads from a width of ∼170 m at the caldera floor perimeter to ∼860 m at its widest across the seafloor (Figure 6B). Linear and chaotic features combine into trough and valley morphology with an inner depression, as noted by McPhie et al. (2020). NE of the lava C toe is the basin-and-ridge morphology of the chaotic domain. Here, the seafloor, from video footage, exhibits a combination of GP, pumice (<1 m diameter), lava, and ash. At the flow front of the chaotic domain lies the undeformed flat topography in the low-relief domain, where the seafloor is dominated by GP (Figure 6B). Concentric sub-parallel ridges form the deformed sediment domain. This sediment wave zone front was discussed in detail by Ikegami et al. (2018) and McPhie et al. (2020). Lava C has an obvious contact demarcation on its SE border, while the NE lava toe front has less defined borders. The intra-caldera ridge on the southern caldera floor controls the southern boundary of the lava C chaotic domain (Figure 6A). Lava B is covered at its toe by the dominant lava C; lava D is covered by both lava C and E (Figure 6A). Lava F has a small toe demarcated by a moderate slope that abuts the extensive lava C toe.
This paper also notes that the pre-2012 caldera wall lava lobe, located mid-slope on the SW caldera wall observed in 2002 (Figure 4A in orange), is still visible in the fine-scale geomorphology map (Figures 6A,I,J); it was previously observed as being subsumed by lava in the large-scale, low-resolution bathymetry maps (Figure 4B) by Carey et al. (2014). This relict feature formed a barrier and gully from which lava A, exiting above the relict source, flowed NW and then NE down the wall (Figure 6J).
The pre-2012 low-relief lava lobes observed in 2002 on the SE caldera quadrant (Figure 4B) exhibit similar features in the fine-scale maps (Figure 6D). They have a typical downslope flow appearance with dendritic zones of high roughness. The largest low-relief feature begins at the crater rim and is highlighted with areas of high roughness, resembling small lava lobes and ridges (Figure 6D). These are confirmed on two of the smaller features, to the west and north of the larger feature, as small lava emplacements in the video footage, lying on gentle slopes mantled with poorly sorted polymictic breccia.
4.2.2 Lava domes
The 2012 lava domes line the southern caldera rim, where relict lava dome J was emplaced prior to 2002 (Carey et al., 2018; Ikegami et al., 2018) (Figure 6C). Sub-circular, with rough surfaces and lava spines (Figure 3H), these domes align with fault features striking EW along the southern rim (Figure 6K). These fault features have been interpreted as the surface expression of dikes controlling the emplacement of the southern wall (Carey et al., 2018; Ikegami et al., 2018). Lava domes G (0.023 km2), H (0.10 km2), I (0.095 km2), K (0.062 km2), M (0.022 km2), and N (0.062 km2) all exhibit rough carapaces relative to the surrounding seafloor, with video footage confirming the presence of significant lava spines and lava blocks (Figure 3). The smooth-sided relict lava dome J (0.10 km2), noted between I and K (Carey et al., 2018; Ikegami et al., 2018), abuts lava K. Another relict dome to the west of J (0.0085 km2) is buried by lava I, indicating a previously unnamed relict dome (Figures 5, 6C). In the video footage, lava J also has distinct lava spines that coincide with the central portion (0.026 km2), which has higher roughness than its surroundings. Lava dome L, noted between K and M by Ikegami et al. (2018), is minimally detectable in the bathymetry, derivatives, or change detection; however, it is within a circular depression of ∼500 m2 (Figures 5, 6C).
The original dome O is demarcated by steep sides covered in autoclastic lava breccia aprons. A jagged carapace covers the central portion of the dome, marked by increased roughness. Nested within the original dome O’s spoon-shaped amphitheater, observed in 2012, is a smooth tulip-shaped lava extrusion (lava P) and a secondary ovoid-shaped lava center with notable lava spines near its core (Figure 5E). The video footage shows a fresh carapace and spines with no ash or GP on top.
4.2.3 Cryptodomes
Ikegami et al. (2018) interpreted a feature north and downslope of lava dome N as a cryptodome, formed by magma intruding into the surrounding sediments but never surfacing as lava. In this section, we describe five additional mounds that are likely cryptodomes (Figures 5, 6C).
The newly identified mounds occur downslope from lava dome J (0.079 km2); north and downslope of lava dome K (0.064 km2); north and downslope of lava L on the caldera rim (0.025 km2); north and downslope of lava dome M (0.075 km2); and between the lava dome M and N mounds (0.018 km2). All six mounds are notable for their smoothness relative to their associated adjacent lavas (which exhibit high roughness) and a distinct change in slope, which well demarcates their boundaries. Five of the six mounds appear as areas of notable gain in the geomorphic change detection analysis between 2002 and 2015 (Figure 7A). The mound beneath J, while smooth relative to the J dome lava and with a clearly demarcated boundary, showed no geomorphic change between 2002 and 2015, suggesting an earlier genesis (Figure 7A). We observed that the GP density on the cryptodomes of lava domes J–N is lower than the surrounding seafloor.
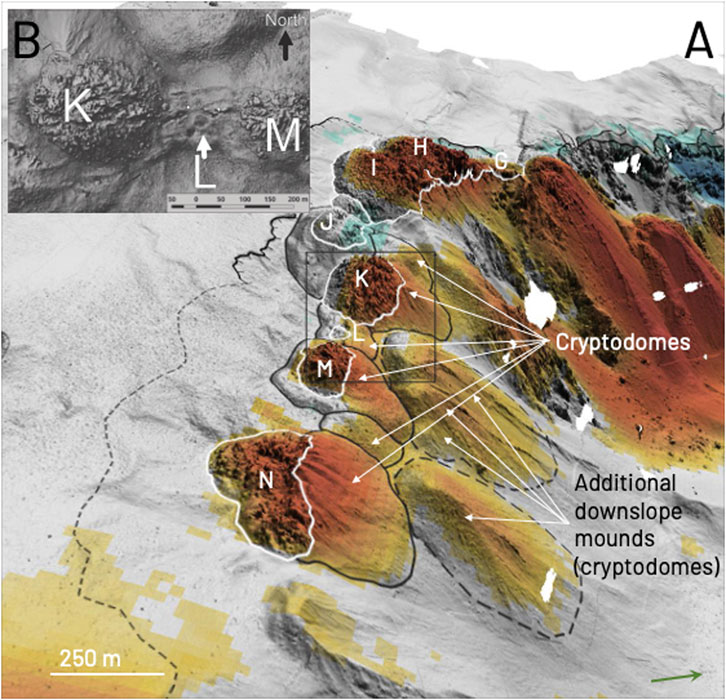
Figure 7. (A) Geomorphic change detection, overlain with outlines of smooth, bulbous features (cryptodomes) associated with the 2012 lava dome emplacements and additional downslope mounds. White outline: extrusive lava domes; black outline: cryptodomes; dashed outline: downslope likely cryptodomes. Green arrow shows north. (B) High-resolution image of the circular depression from which lava L was collected.
Two additional areas of geomorphic increase are also noted: one north and 150 m downslope of lava L and M (0.19 km2) and another north and 150 m downslope of lava dome N (0.17 km2) (Figure 7A). These features exhibit dendritic ridge lines and smooth mounds at their upslope source and notable geomorphic change between 2002 and 2015. No footage was obtained to determine their surface expression.
4.2.4 Lava-dome breccia aprons
We observed that aprons of dome OP debris, consisting of sub-meter facies such as ash, lapilli, and lava block fragments in video footage (Figures 3D, I, N), are indistinguishable in the 1-m grid. These coarse and poorly sorted deposits are oriented SE–NW, radial from the dome center and toward the caldera floor (Figures 6D, E). The deposits on the two pre-2012 lava domes south of dome OP on the caldera terrace consist of sub-meter lava blocks (Figure 6E).
4.2.5 Ash and ash–lapilli aprons
We observed an apron of pumiceous ash and lapilli deposits located around dome OP in the video footage (Figures 3I, Q). This apron lies stratigraphically above the GP but below the dome OP debris apron. These deposit facies are unobservable in the 1-m bathymetry as a distinct texture because the clast sizes are of the sub-meter scale. For finer-scale mapping of ash and surface facies, seafloor backscatter at a relevant scale would be required. As such, sub-meter deposits are not discussed further, although they are thoroughly explored in the recent literature (Murch, 2018; Murch et al., 2019; Murch et al., 2020).
4.2.6 Caldera walls
Normal faults strike SW–NE along the upper outer flanks of the caldera and near the inner rim. Stacked lava sequences and consolidated deposits form the steep cliffs and ridges of the caldera wall, while scree and talus form the lower slopes (Figure 5; Figures 6F, J). Caldera wall outcrops and cliffs (Figure 6K), demarcated as being >40° slope, comprise ∼16% of the total caldera wall area. Above the 2012 lava lobes that line the SW mid-caldera wall (A-E) are layers of sediment, ash, and scoria from previous eruptions. On the western caldera rim, stacked sequences of dark and light ash and lapilli layers also record past volcanic eruptions.
4.2.7 Giant pumice deposit
GP covers most of the caldera floor (∼30 km2), as well as discrete areas of the caldera walls, terrace, lava domes A–E, and areas further outside the 1-m surveyed area, with an NW dispersal orientation (Carey et al., 2018; Murch et al., 2019; Murch et al., 2020) (Figure 8). The volume of the GP deposit was estimated at 0.1 km3 (Carey et al., 2018), has an orientation that aligns with the sea-surface pumice raft observed in 2012 (Jutzeler et al., 2014; Jones et al., 2018; Fauria et al., 2020), and is assumed to be contemporaneous, originating from a vent in the location of dome OP that was active before the emplacement of dome O. The GP clasts are assumed to have settled out of suspension in the water column, with most pumice drifting with the dominant NW current.
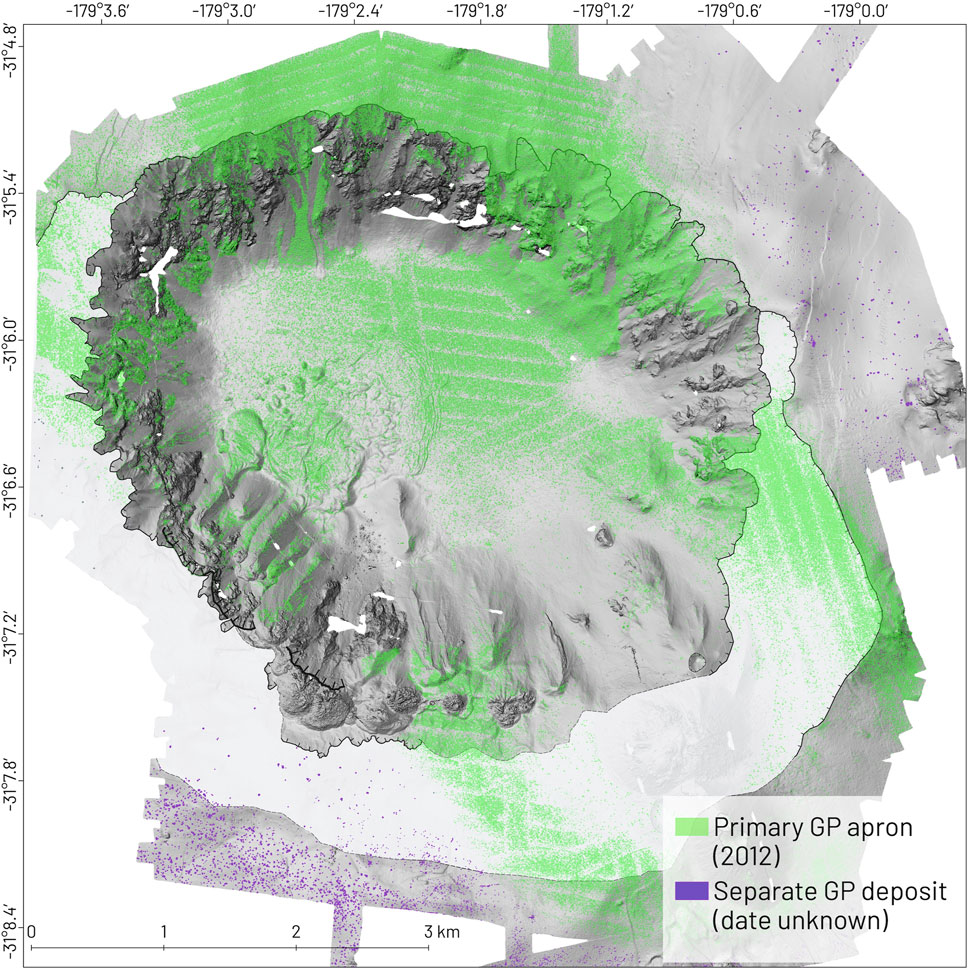
Figure 8. GP distribution map showing primary GP apron and separate uncertain GP deposit. The bottom detection algorithm artifacts of the AUV bathymetry are emphasized in the GP apron on the caldera floor.
In this study, we note for the first time a separate GP deposit (date unknown) on the SW and NE of the 1-m AUV bathymetry (Figures 5, 8). The mean clast area from the SW deposit is 2.7 m2 (from >4,015 picked clasts), and for the NE deposit, it is 2.9 m2 (from 890 picked clasts). This compares to the 2.9 m2 mean clast size for the primary GP apron (from 114,000+ picked clasts). The maximum clast size for the separate uncertain deposit that could reasonably be associated with a single clast is ∼100 m2, comparable to that for a primary GP apron. The aspect ratio of the background GP clasts ranged from 0.6 to 10, comparable to the primary apron GP clasts. The density of clasts in the primary GP apron is higher, with multiple stacked clasts making it difficult to pick individual GP blocks; the density in the separate uncertain GP deposit is, however, much lower, enabling more individual clasts to be observed in the bathymetry. No video footage was collected over the separate uncertain GP deposit to confirm composition, origin, or timing.
These observations expand the footprint of the GP apron; however, its full extent is unknown as it extends beyond the 1-m bathymetry coverage. We were also unable to determine whether the uncertain GP apron has the same source (dome OP) as the primary GP apron (Figure 8). We observe, however, that the deposition pattern of the background GP deposit aligns with the break of slope of the caldera terrace (Figures 6G, H; Figure 8). The primary GP apron and surrounding ash blanket have settled on flat topographic areas, giving a ringed appearance to the primary GP apron and background clast deposit (Figure 8). The background GP deposit has few clasts within the terrace boundary and higher density on the SW downslope of the Havre edifice. The NE background GP deposit has a lower density of clasts than the SW group (1,200 versus 5,400 individual clasts, respectively); however, it also has a similar association with the edifice downslope.
4.2.8 Scarps, mega-blocks, and mega-breccia
A major arcuate scarp (∼600 m in length) is situated 260 m above lava A along the SE caldera rim (Figures 5, 6A). The first mega-block of 17 mega-blocks (clasts ranging 35–160 m across lengthwise) lies ∼1,300 m downslope from the major scarp above lava A, while the furthest lies 2,240 m from the head scarp (Figure 6B). Most (13 of 17) of these mega-block “hills” (McPhie et al., 2020), including the original mega-blocks(s) recorded in the large-scale 2002, 2012, and 2015, lie on an area elevated ∼3 m from the surrounding caldera floor, with lobate toes along its northern perimeter [“western sheet;” McPhie et al. (2020)] (Figure 6I). Five mega-blocks abut the chaotic domain (McPhie et al., 2020) of the lava C toe, while one lies on top of this region. One mega-block is situated 150 m apart from the others, lying near the base of the western caldera wall on top of mass-wasting deposits. One mega-block lies on the boundary between the lava C chaotic domain and the low-relief domain. Two mega-blocks lie 2,801 m from the primary group, abutting the northern edge of the deformed sediment domain (Figure 6B).
A second major arcuate scarp (∼640 m in length) is situated 300 m above lava domes B, C, D, and E (Figure 6I). Lava domes G, H, and I are bounded on the north by a third major scarp ∼610 m in length, as recorded by Ikegami et al. (2018) and McPhie et al. (2020) (Figures 6C, I, K, L). The start of a poorly sorted deposit of 375+ mega-breccia blocks (all >1 m across) was observed ∼540 m downslope from the second scarp, between lava lobe F and the southern intra-caldera ridge, extending ∼1,450 m from the major scarp at lava G, H, and I (Figure 6L). The mega-breccia deposit lies on the surface of both lava lobe F and talus and scree aprons bounding the SE side of lava C.
4.2.9 Mass wasting of the caldera wall mid- and lower slopes
We observe that mass-wasting features (head scarps, lateral scarps, debris deposits, and scars) dominate the lower flanks of the northern and NW caldera walls (Figure 5; Figure 6M). ROV footage here confirms the lack of a GP, with a jumbled pile of talus (<1 m diameter) and ash deposits (Figures 6A, F, K). These poorly sorted debris aprons are finer than the 1-m bathymetry; however, the overall movement of material downslope is observable at the base of the caldera walls (Figure 5; Figure 6M). Evidence of mass wasting was previously noted as small andesite pebbles observed on the seafloor at a slump toe (Wright et al., 2006). We also note a smaller area of mass wasting on the eastern wall, with numerous sub-parallel sediment lobes and ripples observable in the bathymetry. Video footage confirms the remobilization of fine-grained sediment and areas of well-sorted pumice blocks (Figures 6B, G, L).
4.3 Geomorphic change detection
The geomorphic change detection (GCD) recorded a total area of 24.7 km2 that experienced a geomorphic height increase and an area of 5.1 km2 that experienced a height decrease between 2002 and 2012 (Figure 9A). This translates to a 0.6-km3 volume estimate of material gained and a 0.1-km3 volume estimate of material lost. A much smaller area of geomorphic height increase (3.7 km2) was recorded between 2012 and 2015. This translates to an estimated volume gain of 0.1 km3. A large area of deficit was also recorded in the 2012–2015 analysis; however, this aligns with a grid artifact from initial data collection in 2012 and is not a genuine geomorphic change (Figure 9B). The geomorphic change recorded between 2002 and 2015 is a more realistic representation. Here, an 8.6 km2 area of geomorphic increase and 11.47 km2 of geomorphic decrease were recorded, translating into an estimated volume growth of 0.3 km3 and a volume deficit of 0.23 km3.

Figure 9. Geomorphic change detection maps of low-resolution bathymetry, overlain high-resolution bathymetry to highlight areas of change. (A) 2002–2012; (B) 2012–2015; (C) 2002–2015. (D) Voluminous constructional growth areas across the lava lobes and domes from the 2002–2012 analysis. Arrow indicates travel direction from major scarps to deposit areas; (E) observable additional volume (yellow orange) across dome P and across the flanks of dome O from the 2012–2015 analysis; (F) extensive areas of geomorphic decrease are detected on the northern wall from the 2002–2012 analysis, with no corresponding deposit area observable; (G) less extensive areas of geomorphic decrease are detected on the eastern caldera wall from the 2002–2015 analysis.
Lava lobes and domes in total comprise a total volume of 0.2 km3, with half (0.1 km3) attributed to the combined dome OP emplacement; these volumes accord with calculations made by Carey et al. (2018) and Ikegami et al. (2018). Most notably, an additional volume growth of 0.001 km3 was recorded on dome OP, occurring after the 2012 survey (Figures 9B, E). This change aligns with the tulip-shaped growth emplacement of dome P in the spoon-shaped amphitheater of dome O, as discussed in Section 4.2. Profiles and contours of dome OP also support this volume change between 2012 and 2015 (Figure 10A). Growth patterns between 2002 and 2012 extend radially from the boundary of dome OP downslope toward the caldera floor in an NW orientation (Figure 9A); these are reduced in the 2002–2015 analysis (Figure 9C). The smooth-flanked pre-2012 lava dome J, between K and M, shows evidence of volume deficit on its northern side: an area of 0.03 km2 underwent an estimated 0.005 km3 volume deficit between 2002 and 2012 (Figures 7, 9C).
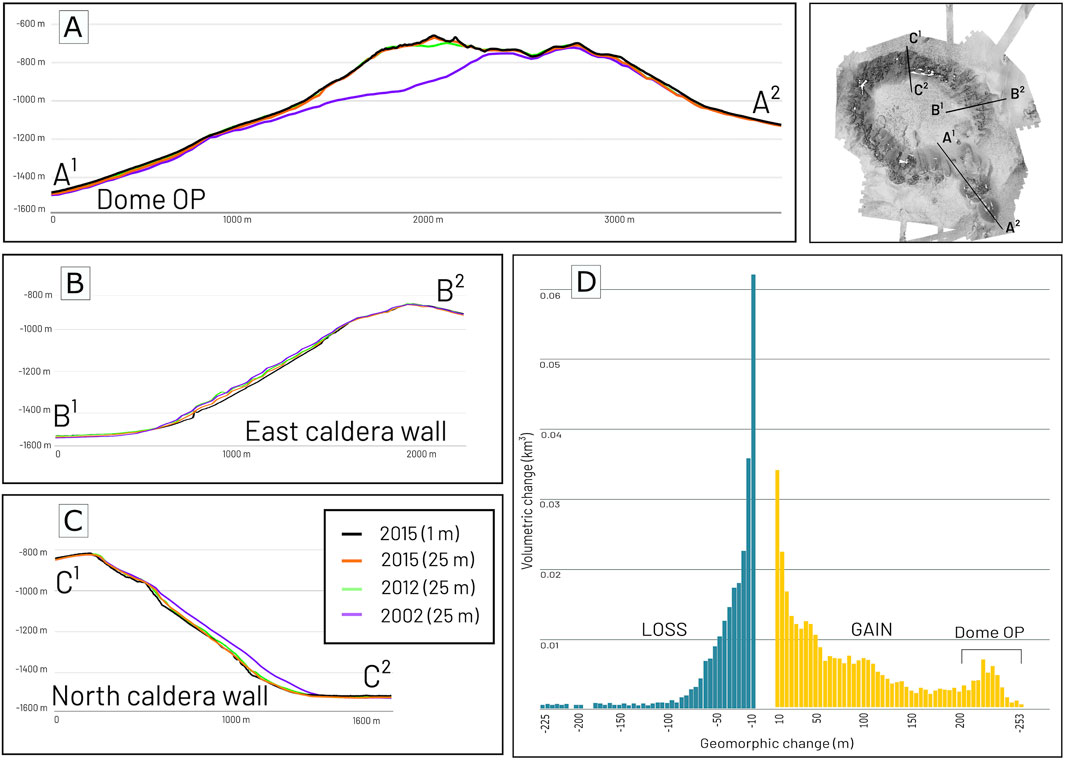
Figure 10. Profiles across features of interest: (A) lava dome OP growth; (B) eastern caldera wall; (C) northern caldera wall; and (D) geomorphic change detection plot of 2002–2015 showing geomorphic increase and decrease. Y-axis shows the volume of change at specific depth bands, ranging from −225 m (decrease) to >250 m (increase). Dome OP growth is highlighted due to the significant change in height in the >200-m growth bands.
Growth patterns between 2002 and 2012 also trace the full extent of lava C laterally spread toe across the caldera floor, including the ridge-swale chaotic domain and the soft sediment deformation domain (Figure 9A). The toe, including chaotic, low-relief, and deformed sediment domains, has an extent of 0.94 km2, translating into a volume of 0.014 km3. In addition to the 0.03-km3 volume of lava C proper (Carey et al., 2018), this results in a total volume estimate for lava C-transported materials of 0.044 km3. These growth patterns are less obvious in the 2002–2015 GCD (Figure 9C). Notably, no volume change was observed for the western sheet (McPhie et al., 2020) in any of the three GCDs (Figure 5; Figure 9). An additional 0.0055-km3 geomorphic volume gain was also estimated downslope and inboard of lava domes K, M, and N (Figures 9A, C), aligning with pre-2012 lobe-shaped features along the southern caldera wall. Nearby, growth was also recorded ∼400 m NE of the major scarp that bounds lava G, H, and I (Figures 9A, C).
The largest degree of geomorphic decrease was observed along the northern caldera wall, with a total area of 2.6 km2 undergoing change between 2002 and 2015 (Figures 9F, 10C), translating into a volume estimate of a 0.08 km3 deficit. No equivalent volume of deposition that corresponds to this deficit was observed within the caldera bowl, although evidence of remobilization and mass wasting is noted in the 1-m bathymetry (Figure 6M). A notable area of geomorphic decrease (0.17 km2), translating into a 0.005-km3 volume deficit estimate, was also observed immediately upslope of lava A occurring prior to 2012, as discussed by McPhie et al. (2020) (Figures 9A, D). This deficit lies beneath a major scarp (see Section 4.4.2), and the mega-blocks resting on the caldera floor downslope from the scarp comprise an area of 0.065 km2.
When the GCD analysis from 2002–2012 is applied to the mega-blocks, they translate into a 0.0006 km3 volume addition. The other scarp noted on the southern caldera rim, bounding lava domes G, H, and I on their northern side (Figure 9D), shows no comparable geomorphic decrease in the GCD. The observable mega-breccia has an area of 0.03 km2; these clasts are too small to compare to the GCD (25 m resolution). A small 0.004-km3 volume deficit between 2012 and 2015 was also recorded on the eastern caldera wall between several prominent ridges; evidence of remobilization and mass wasting is noted below this area of geomorphic decrease (Figures 9G, 6N). Most of this estimated erosion formed post October 2012 as there is little observable evidence of mass wasting along the eastern caldera wall between 2002 and 2012.
4.4 Hydrothermal observations and data
Our analysis of the video footage reveals that 11 of the 12 ROV dives show evidence of hydrothermalism in a variety of forms (Figure 11): fluid venting, “chimlets” (small spires of sulfur-colored deposits; Figure 3E), mass bacterial mat growth, and hydrothermally altered sediments and rocks (Figures 3J, O, T). The dive on the eastern wall showed no hydrothermal evidence. Active hydrothermalism was observed in 7 of the 12 ROV dives in 2015 as active fluid discharge or shimmer (Figure 11). Fluid flow was observed in several different environments, including the margins of lava flows, at cracks along the caldera rim, and in the center of lava domes. This highlights the diversity of heat and fluid gradients across the caldera.
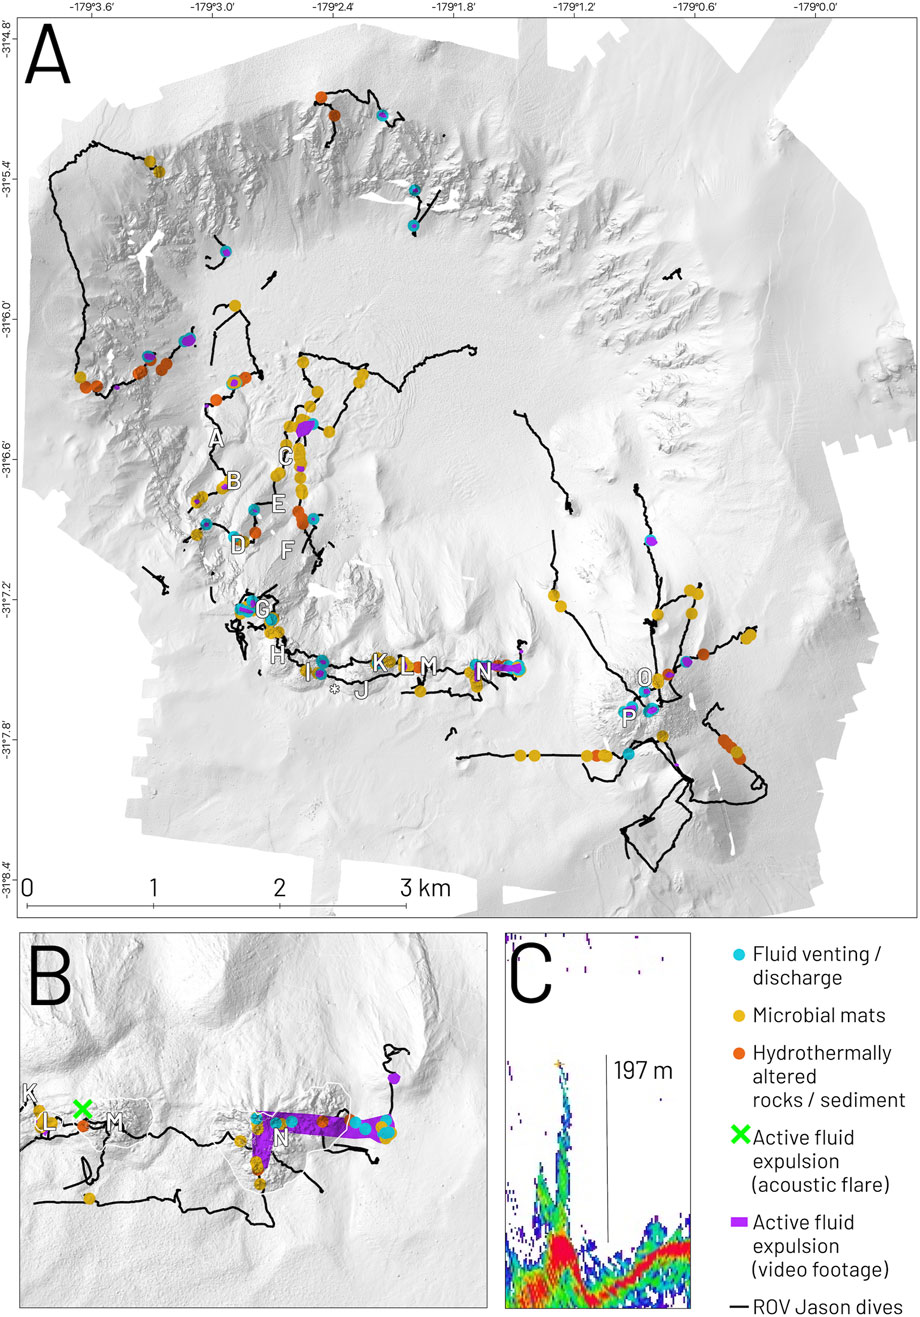
Figure 11. Locations with evidence of hydrothermal activity or influence (A), either active fluid expulsion (observed in video footage or as acoustic flares in water-column backscatter), hydrothermally emplaced ecology (microbial mats), or hydrothermally altered sediments (sulfur-colored). (B) Location of acoustic flare observed in 2012, escaping the seafloor at lava M, next to the most active hydrothermal area observed in 2015, at lava N. (C) 2012 acoustic flare in MBES data. The seafloor is shown in red, with the acoustic flare rising in green blue from a bathymetric mound.
A maximum temperature of ∼69°C was recorded by the temperature probe at lava dome N, where one of the more active fluid expulsions was observed in 2015 (Figure 11B). This active vent field was the location of fluid expulsion and numerous chimlets and miniature Fe-oxidizing bacterium-blanketed chimneys (Figure 3E) with a dominant colony of crabs (unknown species). These 10–20-cm tall spiers rise from a centimeter-thick yellow deposit (likely Fe-oxidizing bacteria) that lies on top of ash deposits. Active fluid expulsion, in the form of observable shimmer (due to contrasts in the refractive index, temperature, and/or salinity anomalies) or liquid flow, was observed across the apex of dome P, near the bounding scarp of both lava domes I and G, mid-slope of the western caldera wall, and on the inner rim of the northern wall. Active fluid venting was also recorded acoustically in 2012 as a 197-m tall flare in water-column backscatter data of the EM 302 echosounder (Figure 11C) (Lamarche et al., 2016). This acoustic flare was aligned with lava dome N (Figure 11B). Evidence for past hydrothermal activity was observed as altered lavas in the northern section of the caldera wall (Wright et al., 2006) and elevated 3He concentrations (de Ronde et al., 2007).
4.5 Magnetic data
The crustal magnetization distribution shown in Figure 12 is characterized by large values (up to 10 A/m) on the north wall of the caldera. A broad circular structure with similar large values is observed extending northward from the lava lobes to the caldera floor, encompassing the areas of positive geomorphic change. Domes O and P have smaller magnetization, i.e., not exceeding 2 A/m. An area of significantly low magnetization (<0.3 A/m) is observed in proximity to the large region of geomorphic deficit located at the base of the N caldera wall. Other areas of significantly low magnetization (<0.3 A/m) are observed north and west of domes O–P.
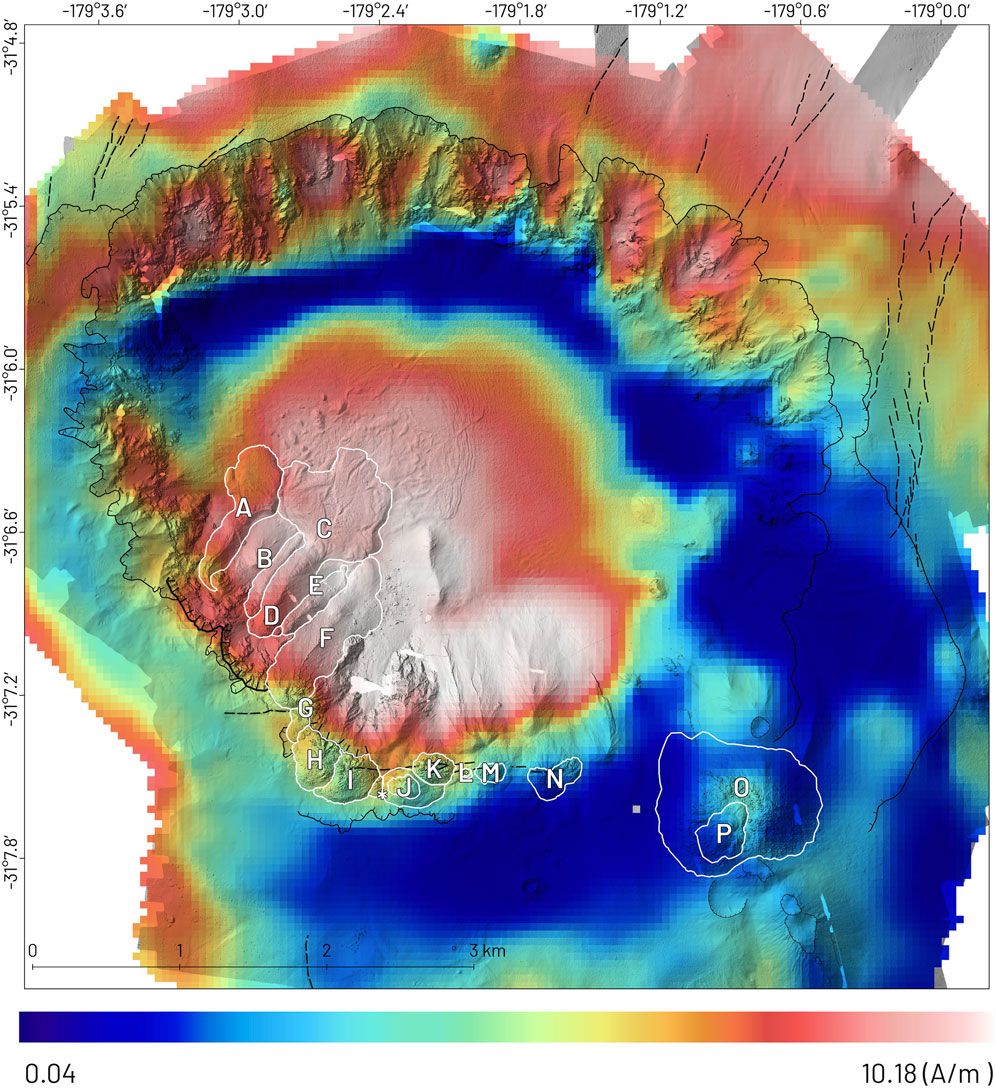
Figure 12. Crustal magnetization map from the inversion of Sentry magnetic data. Outlines of lava lobes and domes are given in white. Caldera structures are given in black.
5 Discussion
Nesting low- and high-resolution data provides insights into submarine eruption processes and the evolution of the Havre volcano. The 1-m AUV bathymetry has been crucial in identifying constructional volcanic products and destructional mass-wasting features, which are not detectable with lower-resolution data. Low-resolution data over multiple years have helped examine broader geomorphic changes.
5.1 New insights into the processes, products, and timescales of the 2012 Havre silicic caldera eruption
The 1-m resolution bathymetry maps have shown smooth, bulbous mounds associated with the northern sides of lava domes K–L–M, which we interpret as shallow intrusions, or cryptodomes. These newly discovered cryptodomes are comparable to the partially intrusive mechanism described for lava dome N by Ikegami et al. (2018). The smooth texture of the bulbous mounds reflects the intrusion into and subsequent uplift of the unconsolidated water-saturated sediment pile. The interactions between high-level intrusions with water-saturated sediment could be expected to trigger explosive magma–water interactions and associated clastic products and features. One newly identified feature on the seafloor is a small circular depression around the site where lava L was visited and sampled by the ROV in 2015. It is plausible that this circular depression is a crater, although more video and sediment analysis is required to test this idea. Giant pumice clasts are observed on top of the extrusive components of domes K–L–M–N; however, the GP density on the observed sediment above the cryptodomes of these domes is lower. These observations suggest that the GP clasts were remobilized downslope as the intrusions grew, indicating a post-GP deposition timing for the cryptodome growth.
In addition to cryptodomes associated with domes K–L–M–N, we suggest the geomorphic height increase of mounds, ∼150 m downslope and inboard of lavas K, L, M, and N (Figures 7, 9C), are cryptodomes. Although volcanoclastic deposits or mass wasting from lava domes K, M, and N may contribute some of the 0.0055-km3 volume addition, the high aspect ratio of these bulbous and even flat-topped mounds matches those of K–M–N that spread laterally downslope (Figures 7, 9C). We observe a lower GP density on these interpreted cryptodomes, which also suggests that these cryptodomes grew post-GP emplacement.
The domes/cryptodomes of K–L–M–N and wholly intrusive cryptodomes 150 m downslope indicate structural controls on emplacement, with similarly oriented caldera wall faults and dikes in the upper and mid-slope region of the southern caldera wall. The intrusive component of all domes K, L, M, and N is asymmetrical and always on the downslope side, indicating that dike-related intrusion was pushing the southern caldera wall northward at a shallow level to accommodate intrusive growth. In contrast, no cryptodomes were observed on the SW side of the caldera near the vents of lavas A–E, perhaps related to the effusion rate, structure, or lithology of the caldera and walls or complex history.
These new discoveries indicate that the 2012 Havre silicic caldera eruption included more significant shallow-level intrusion than has been identified in the past. The volume of the new cryptodomes was ∼0.0055 km3, which is approximately equivalent to the extrusive volume of domes K, L, M, and N. Their emplacement likely took place prior to and after the deposition of the GP apron, inferred to be from 18 July 2012. The longer-term cryptodome growth along faults in the caldera walls identified in this paper highlights that submarine caldera eruptions can be of long durations, similar to terrestrial analogs, and that walls could be unstable during growth.
An extended timeline of intrusion and lava effusion for this eruption is also indicated by the observation of dome P growth filling the spoon-shaped cavity of dome O between the post-eruption October 2012 survey data and the survey in 2015. This late-stage emplacement of dome P extends the known volcanic emplacement timeline from 3 months (Carey et al., 2018) to a maximum of 3 years. The presence of fresh spines and the absence of ash or lapilli on dome P suggest that it was emplaced after all ash in the water column had been deposited. Such prolonged, low-volume dome growth is common after paroxysmal eruptions of terrestrial arc volcanoes (Thouret, 1999; Gómez-Vazquez et al., 2016; Burchardt et al., 2019). The absence of GP clasts on dome P suggests that any deposited clasts were either moved downslope from mass movement or buried by the subsequent lava emplacement.
The source of the newly identified background GP deposit and its dispersal direction remain unclear (Figure 8). Possibilities include (1) a non-Havre volcano source; (2) a Havre pre-2012 eruption product; (3) a later deposit from the Havre 2012 pumice raft as ribbons of the raft were observed moving back over the caldera weeks later (Jutzeler et al., 2014); and (4) a deposit derived from sedimentation of water-logged 2012 GP from the mid-water column that had a different current direction. We were unable to speculate on the most likely option for the genesis and timing of the background GP deposit without the analysis of the physical samples or the video footage. ‘
5.2 New insights into syn- and post-eruption mass-wasting processes and volcano evolution
We propose the small-scale geomorphic deficit noted along the eastern caldera wall occurred after the 2012 survey and before the 2015 survey and is the result of mass-wasting remobilizing material from the caldera wall to the floor. Geomorphic change is most obvious when comparing the 2002 and 2015 datasets and closely traces the caldera wall ridges and gullies observed in the 1-m AUV bathymetry (Figure 9G). An M3.5 earthquake occurred on 29 March 2013, ∼1.5 km N of this zone of deficit (International Seismological Centre, 2022). Although the eastern deficit has no comparable geomorphic deposition zone, a large portion of this geomorphic is likely within the <10-m detection limit threshold (Figure 10B), particularly at the toe. Here, mass-wasting lobes and sediment waves in the 1-m bathymetry provide evidence of remobilization.
The mega-breccia deposit on the southern caldera wall, draped on top of lava F and the lower western slopes of the intra-caldera ridge, provides an updated timeline for the emplacement of F relative to G, H, and I (Figure 6L). The proposed mechanism that generated the mega-breccia is the intrusion of a rhyolite dike beneath G, H, and I, which destabilized early dome growth and triggered collapse across the major scarp (McPhie et al., 2020). As a portion of the mega-breccia rests on top of lava F, the emplacement events of G, H, and I occurs post-date F, separated by an interval of time. The steep and linear headwall scarp makes it likely that the collapse occurred after the emplacement of these domes.
The source for the mega-blocks on the southwestern portion of the caldera floor (excluding the original solitary block) has been proposed to be the major scarp upslope, observed as a geomorphic deficit area upslope of lava A (McPhie et al., 2020) (Fig. j). We support this hypothesis, given that the volume of deficit and volume of mega-blocks are comparable, and the direction of flow aligns with the scarp. As no mega-blocks rest on top of lava A or C and the lava shows flow morphology around the blocks, the mega-blocks are inferred to pre-date the lava lobe emplacement.
We propose two factors contributing to the volume deficit observed along the northern caldera wall between 2002 and 2015, including (1) a high degree of slope across the steep cliffs introducing elements of inaccuracy from the multibeam echosounders (depth and system dependent), particularly the initial 2002 bathymetry survey and (2) subtle mass wasting of material that comprises the caldera wall.
The EM 302 (2012), EM 122 (2015), and Reson SeaBat 7,125 (2015) bathymetry is comparable in this area (Figures 9F, 10C); however, a minimum ∼40 m deficit from the 2002 bathymetry was observed. Areas of high slope are known to yield inaccurate bathymetric values (Lurton, 2003). A 6-m bathymetric difference on the caldera floor was previously noted, with the 2002 and 2015 low-resolution grids both offset ∼6 m from the 2012 and 2015 1-m AUV bathymetry. Bottom detection algorithms vary significantly between systems, affecting their ability to locate the seafloor in the presence of multiple stacked clasts of GP. Given the comparable bathymetry from 2012 to 2015, the older multibeam echosounder used in 2002 may have been unable to accurately rectify this area of high slope.
While mass-wasting features noted in the 1-m bathymetry, such as head scarps, lateral scarps, scars, and debris deposits, reveal that extensive remobilization of material along the steep caldera wall area likely contributes to some of the observable deficit, no corresponding area of deposition is noted on the caldera floor. A portion of the erosion deposit that corresponds to these mass-wasting features may be spread across the caldera floor but obscured due to the 10-m detection limit threshold applied in GCD processing; however, this would not account for the 0.08-km3 volume deficit. However, crustal magnetization in this region (Figure 12) shows a broad area of very low values (<0.3 A/m). This could represent an expression of the chaotic redistribution of magnetized blocks following remobilization along the caldera wall. This breaks down the coherent orientation of the magnetized blocks, inducing a random distribution of the blocks and a significant reduction in the crustal magnetization (Lerner et al., 2022).
5.3 Hydrothermal activity
The most active field of hydrothermalism observed in the video footage aligns with the dominant WE fault features that pierce lava N (Figure 11B). This vent field lies ∼270 m from the location of the only active fluid expulsion evidence noted in the 2012 survey (from the 197-m-tall acoustic flare in the 30-kHz echosounder). This flare resembles those with a gas phase, suggestive of CO2 gas or liquid-phase CO2 or sulfur, as observed by Konno et al. (2006); Linke et al. (2014); Nakamura et al. (2015); and Stucker et al. (2017), which would have a high enough impedance contrast to seawater to be observable.
Evidence of hydrothermalism observed across all videos and terrain during the 2015 survey indicates that hydrothermalism is widespread across the Havre volcano. The hydrothermalism observed in 2015, however, suggests a diffuse or ephemeral system, lacking voluminous black smokers or associated endemic biota (e.g., Bathymodiolus mussels, stalked barnacles, and alvino caridina shrimps) commonly observed at other caldera volcanoes along the Kermadec arc (de Ronde et al., 2007; Wysoczanski and Clark, 2012). Furthermore, in proximity to the observed vent fields, we do not find clear evidence of magnetic “burn holes” in the magnetic anomaly data (Figure 12), i.e., localized areas of demagnetization caused by a hydrothermal alteration (Caratori Tontini et al., 2019). The broad area of observed negative magnetic anomalies shown in Figure 12 is likely too large to be caused by hydrothermal alteration effects, particularly considering the limited hydrothermal manifestations observed on the northern caldera wall. On the other hand, the area of lobes A–F, where several active hydrothermal manifestations occur, shows intense magnetization values. This may indicate that the current active hydrothermal system at the Havre volcano may be young, possibly post-2012 eruption, where the hydrothermal system may have not altered a significant volume of rocks yet as the time scale of such an effect on magnetic data is >∼100–1,000 years (Caratori Tontini et al., 2019). However, the demagnetized areas located west and north of domes O–P lie in proximity to hydrothermal manifestations. These regions were not affected by the 2012 eruption, and they could be related to the presence of a pre-existing and still ongoing hydrothermal system.
We have no pre-2015 video footage, so we were unable to speculate whether the Havre volcano hydrothermal system is persistently diffuse or whether the 2012 eruption disrupted a formerly fulsome hydrothermal system. Re-surveying the area using towed or ROV cameras would shed light on the colonization or recolonization habits of these vents or their change in the flow regime.
6 Conclusion
The morphology of the Havre volcano is the product of a complex interplay of constructive volcanic eruption and deposition events, with destructive mass wasting and remobilization of the caldera walls, floor, lavas, and sediments. The 1-m AUV bathymetry provides the context for understanding areas of mass wasting that could not be resolved in the lower-resolution bathymetry.
Integrating repeat MBES/magnetics/video footage data and synthesizing previous work, we
1. Developed the first fine-scale geomorphic map of the Havre volcano caldera;
2. Determined that dome P was emplaced after the 2012 post-eruption survey, not during the initial eruption as originally thought, extending the eruption timeline from 3 months to a maximum of 3 years.
3. Revealed an additional apron of giant pumice outside the primary apron, which indicates either a previously unknown deposit or a wider depositional area than previously calculated.
4. Determined additional cryptodome growth for domes K, L, and M; newly formed cryptodomes 150 m downslope of domes J–M, which indicate dike-related intrusion on another EW fault on the mid-southern caldera wall; and, lastly, the scarcity of GP on the sediment blanket above the cryptodomes, suggesting intrusion and remobilization occurred post-GP deposition.
5. Proposed a small-scale mass-wasting remobilizing material from the caldera wall to floor along the eastern caldera wall, occurring after the 2012 survey and before the 2015 survey.
Geomorphic change detection in deep-marine terrains is rare and fraught with accuracy and precision limitations due to depth and sensor arrangements. In this study, however, we leveraged high-resolution 1-m bathymetry to improve confidence that the change detection revealed genuine products and processes of the caldera. High-resolution bathymetry does not solve all problems posed by low-resolution data as proximity to the seafloor often reveals more complicated questions to resolve. Fine-scale maps, however, enhance our interpretation of obscured seafloor processes and provide a more nuanced understanding of submarine volcanic evolution. Repeated, high-resolution surveys provide essential context for submarine volcanic eruptions. In the future, applying change detection approaches to water-column acoustic data, using echo-integration snapshots of near-seabed and midwater reaches, will improve our understanding of hydrothermal system evolution over time, further improving our fine-scale and nuanced understanding of deep-marine volcanic systems.
Data availability statement
The original contributions presented in the study are included in the article/Supplementary Material; further inquiries can be directed to the corresponding author.
Author contributions
ES: conceptualization, data curation, formal analysis, funding acquisition, investigation, methodology, project administration, resources, software, supervision, validation, visualization, writing–original draft, and writing–review and editing. RC: conceptualization, investigation, project administration, resources, supervision, writing–original draft, and writing–review and editing. JW: conceptualization, funding acquisition, investigation, methodology, project administration, resources, software, supervision, writing–original draft, and writing–review and editing. VL: conceptualization, data curation, formal analysis, funding acquisition, investigation, methodology, resources, software, supervision, validation, visualization, writing–original draft, and writing–review and editing. JF: investigation, resources, supervision, writing–original draft, and writing–review and editing. SW: formal analysis, investigation, methodology, software, supervision, validation, writing–original draft, and writing–review and editing. FT: formal analysis, methodology, software, validation, visualization, writing–original draft, and writing–review and editing.
Funding
The author(s) declare that financial support was received for the research, authorship, and/or publication of this article. This research was supported by the New Zealand Ministry of Business, Innovation and Employment (MBIE) Strategic Science Investment Fund (SSIF) Marine Geological Processes Programme, Oceans Centre at National Institute of Water and Atmospheric research (NIWA)/Taihoro Nukurangi. This research was funded by an Australian Research Council (DE150101190), and US National Science Foundation grants OCE1357443 and OCE1357216. E.S.' PhD research is supported by the Australian Research Council's Special Research Initiative Antarctic Gateway Partnership (Project ID SR140300001) and by an Australian Government Research Training Program Scholarship. JF was supported by a Japanese Society for the Promotion of Science Post Doctoral Fellowship during the preparation of this manuscript. FCT was supported by University of Genova Research Funds – Fondi di Ricerca di Ateneo (FRA2022).
Acknowledgments
The authors thank the captain, crew, and science teams of both RV Roger Revelle and RV Tangaroa voyages TAN0205, TAN1213, and RR1506. The authors also thank the scientists whose work was foundational to this project, in particular, the geological work of J. McPhie and F. Ikegami. We thank Ken Tani and Adam Soule who provided detailed feedback on earlier versions of this manuscript, and Karoly Nemeth and Salvatore Passaro who provided helpful suggestions and comments of the draft journal article.
Conflict of interest
The authors declare that the research was conducted in the absence of any commercial or financial relationships that could be construed as a potential conflict of interest.
Publisher’s note
All claims expressed in this article are solely those of the authors and do not necessarily represent those of their affiliated organizations, or those of the publisher, the editors, and the reviewers. Any product that may be evaluated in this article, or claim that may be made by its manufacturer, is not guaranteed or endorsed by the publisher.
Supplementary material
The Supplementary Material for this article can be found online at: https://www.frontiersin.org/articles10.3389/feart.2024.1463257/full#supplementary-material
References
Branney, M. J., and Kokelaar, P. (2002). Pyroclastic density currents and the sedimentation of ignimbrites. Geol. Soc. Lond. doi:10.1144/GSL.MEM.2003.027
Brasington, J., Langham, J., and Rumsby, B. T. (2003). Methodological sensitivity of morphometric estimates of coarse fluvial sediment transport. Geomorphology 53, 299–316. doi:10.1016/s0169-555x(02)00320-3
Burchardt, S., Mattsson, T., Palma, J. O., Galland, O., Almqvist, B., Mair, K., et al. (2019). Progressive growth of the cerro bayo cryptodome, chachahuén volcano, Argentina—implications for viscous magma emplacement. J. Geophys. Res. Solid Earth 124, 7934–7961. doi:10.1029/2019jb017543
Caratori Tontini, F., Tivey, M. A., DE Ronde, C. E. J., and Humphris, S. E. (2019). Heat flow and near-seafloor magnetic anomalies highlight hydrothermal circulation at brothers volcano caldera, southern Kermadec Arc, New Zealand. Geophys. Res. Lett. 48, 8252–8260. doi:10.1029/2019gl083517
Carey, R. J., Wysoczanski, R., Wunderman, R., and Jutzeler, M. (2014). Discovery of the largest historic silicic submarine eruption. Eos, Trans. Am. Geophys. Union 95, 157–159. doi:10.1002/2014eo190001
Carey, R., Soule, S. A., Manga, M., White, J. D. L., Mcphie, J., Wysoczanski, R. J., et al. (2018). The largest deep-ocean silicic volcanic eruption of the past century. Sci. Adv. 4, e1701121–e1701126. doi:10.1126/sciadv.1701121
Chadwick, W. W., Merle, S. G., Baker, E. T., Walker, S. L., Resing, J. A., Butterfield, D. A., et al. (2018). A recent volcanic eruption discovered on the central mariana back-arc spreading center. Front. Earth Sci. 6. doi:10.3389/feart.2018.00172
Conrad, O., Bechtel, B., Bock, M., Dietrich, H., Fischer, E., Gerlitz, L., et al. (2015). System for automated geoscientific Analyses (SAGA) v. 2.1.4. Geosci. Model. Dev. Discuss. 8, 1991–2007. doi:10.5194/gmd-8-1991-2015
DE Ronde, C. E. J., Baker, E. T., Massoth, G. J., Lupton, J. E., Wright, I. C., Sparks, R. J., et al. (2007). Submarine hydrothermal activity along the mid-kermadec arc, New Zealand: large-scale effects on venting. Geochem. Geophys. Geosystems 8. doi:10.1029/2006gc001495
Fauria, K., Jones, M., Soule, S. A., Manga, M., and Carey, R. (2020). Dynamics of giant pumice dispersal in deep sea eruptions. American Geophysical Union, Fall Meeting.
Favalli, M., Karátson, D., Mazzuoli, R., Pareschi, M. T., and Ventura, G. (2005). Volcanic geomorphology and tectonics of the Aeolian archipelago (Southern Italy) based on integrated DEM data. Bull. Volcanol. 68, 157–170. doi:10.1007/s00445-005-0429-3
Fink, J. (1980). Surface folding and viscosity of rhyolite flows. Geology 8, 250–254. doi:10.1130/0091-7613(1980)8<250:sfavor>2.0.co;2
Gómez-Vazquez, A., DE LA Cruz-Reyna, S., and Mendoza-Rosas, A. T. (2016). The ongoing dome emplacement and destruction cyclic process at popocatépetl volcano, Central Mexico. Bull. Volcanol. 78, 58. doi:10.1007/s00445-016-1054-z
Ikegami, F., Mcphie, J., Carey, R., Mundana, R., Soule, A., and Jutzeler, M. (2018). The eruption of submarine rhyolite lavas and domes in the deep ocean – Havre 2012, Kermadec Arc. Front. Earth Sci. 6. doi:10.3389/feart.2018.00147
INTERNATIONAL SEISMOLOGICAL CENTRE (2022). On-Line Bull. Int. Seismol. Cent. Available at: http://www.isc.ac.uk.
Jones, M., Soule, S. A., Fauria, K., Carey, R., Perron, J. T., and Manga, M. (2018). Modeling submarine pyroclast dispersal using the distribution of giant pumice at Havre volcano. American Geophysical Union, Fall Meeting.
Jutzeler, M., Marsh, R., Carey, R. J., White, J. D., Talling, P. J., and Karlstrom, L. (2014). On the fate of pumice rafts formed during the 2012 Havre submarine eruption. Nat. Commun. 5, 3660. doi:10.1038/ncomms4660
Konno, U., Tsunogai, U., Nakagawa, F., Nakaseama, M., Ishibashi, J.-I., Nunoura, T., et al. (2006). Liquid CO2 venting on the seafloor: yonaguni knoll IV hydrothermal system, okinawa trough. Geophys. Res. Lett. 33. doi:10.1029/2006gl026115
Korzeniowska, K., Pfeifer, N., and Landtwing, S. (2018). Mapping gullies, dunes, lava fields, and landslides via surface roughness. Geomorphology 301, 53–67. doi:10.1016/j.geomorph.2017.10.011
Lamarche, G., Wysoczanski, R. J., and Barton, S. (2016). “Latest geophysical investigation in the Kermadec Arc back-arc system,” in Proceedings of Kermadec - discoveries and connections. Editors B. GOLDER, and A. CONNELL (Wellington, New Zealand: The Pew Charitable Trusts).
Lerner, G. A., Pilspa, E. J., Bowles, J. A., and Ort, M. H. (2022). Paleomagnetism and rock magnetism as tools for volcanology. Bull. Volcanol. 84, 24–34. doi:10.1007/s00445-022-01529-9
Linke, P., Haeckel, M., Schneider VON Deimling, J., Vielstädte, L., Schmidt, M., Sommer, S., et al. (2014). Fluxes of CO2 from natural seep sites and Sleipner storage site. GEOMAR.
Lipman, P. W. (1997). Subsidence of ash-flow calderas: relation to caldera size and magma-chamber geometry. Bull. Volcanol. 59, 198–218. doi:10.1007/s004450050186
Lurton, X. (2003). Theoretical modelling of acoustical measurement accuracy for swath bathymetric sonars. Int. Hydrogr. Rev. 4, 17–30.
Mcphie, J., Jutzeler, M., Ikegami, F., and Carey, R. (2020). Syn-eruptive soft-sediment deformation structures in a deep submarine caldera: Havre, 2012. Mar. Geol. 430, 106373. doi:10.1016/j.margeo.2020.106373
Mitchell, S. J., Houghton, B. F., Carey, R. J., Manga, M., Fauria, K. E., Jones, M. R., et al. (2019). Submarine giant pumice: a window into the shallow conduit dynamics of a recent silicic eruption. Bull. Volcanol. 81, 42. doi:10.1007/s00445-019-1298-5
Mittal, T., and Delbridge, B. (2019). Detection of the 2012 Havre submarine eruption figure plume using Argo floats and its implications for ocean dynamics. Earth. Plane. Sci. Lette. 511, 105–116.
Murch, A. P. (2018). Ash generation in the 2012 eruption of Havre Volcano, Kermadec Arc: the largest deep subaqueous eruption of the last century. New Zealand: University of Otago. PhD.
Murch, A. P., White, J. D. L., Barreyre, T., Carey, R. J., Mundana, R., and Ikegami, F. (2020). Volcaniclastic dispersal during submarine lava effusion: the 2012 eruption of Havre Volcano, Kermadec Arc, New Zealand. Front. Earth Sci. 8. doi:10.3389/feart.2020.00237
Murch, A. P., White, J. D. L., and Carey, R. J. (2019). Characteristics and deposit stratigraphy of submarine-erupted silicic ash, Havre Volcano, Kermadec Arc, New Zealand. Front. Earth Sci. 7. doi:10.3389/feart.2019.00001
Nakamura, K., Kawagucci, S., Kitada, K., Kumagai, H., Takai, K., and Okino, K. (2015). Water column imaging with multibeam echo-sounding in the mid-Okinawa Trough: implications for distribution of deep-sea hydrothermal vent sites and the cause of acoustic water column anomaly. Geochem. J. 49, 579–596. doi:10.2343/geochemj.2.0387
Paduan, J. B., Clague, D. A., Caress, D. W., and Thomas, H. (2016) “High-resolution AUV mapping and ROV sampling of mid-ocean ridges,” in Oceans 2016 mts/IEEE. Monterey: IEEE.
Pope, E. L., Jutzeler, M., Cartigny, M. J. B., Shreeve, J., Talling, P. J., Wright, I. C., et al. (2018). Origin of spectacular fields of submarine sediment waves around volcanic islands. Earth Planet. Sci. Lett. 493, 12–24. doi:10.1016/j.epsl.2018.04.020
Schimel, A. C. G., Beaudoin, J., Parnum, I. M., LE Bas, T., Schmidt, V., Keith, G., et al. (2018). Multibeam sonar backscatter data processing. Mar. Geophys. Res. 39, 121–137. doi:10.1007/s11001-018-9341-z
Stucker, V. K., Walker, S. L., DE Ronde, C. E. J., Caratori Tontini, F., and Tsuchida, S. (2017). Hydrothermal venting at hinepuia submarine volcano, Kermadec Arc: understanding magmatic-hydrothermal fluid chemistry. Geochem. Geophys. Geosystems 18, 3646–3661. doi:10.1002/2016gc006713
Thebault, E., Finlay, C. C., Beggan, C. D., Alken, P., Aubert, J., Barrois, O., et al. (2015). International geomagnetic reference field: the 12th generation. Earth, Planets Space 67, 79. doi:10.1186/s40623-015-0228-9
Thouret, J.-C. (1999). Volcanic geomorphology - an overview. Earth-Science Rev. 47, 95–131. doi:10.1016/s0012-8252(99)00014-8
Tivey, M. A., Schouten, H., and Kleinrock, M. C. (2003). A near-bottom magnetic survey of the Mid-Atlantic Ridge axis at 26°N: implications for the tectonic evolution of the TAG segment. J. Geophys. Res. 108, 2277. doi:10.1029/2002jb001967
Watts, A. B., Peirce, C., Grevemeyer, I., Paulatto, M., Stratford, W., Bassett, D., et al. (2012). Rapid rates of growth and collapse of monowai submarine volcano in the Kermadec Arc. Nat. Geosci. 5, 510–515. doi:10.1038/ngeo1473
Wheaton, J. M., Brasington, J., Darby, S. E., and Sear, D. A. (2009). Accounting for uncertainty in DEMs from repeat topographic surveys: improved sediment budgets. Earth Surf. Process. Landforms 35, 136–156. doi:10.1002/esp.1886
Whelley, P. L., Garry, W. B., Hamilton, C. W., and Bleacher, J. E. (2017). LiDAR-derived surface roughness signatures of basaltic lava types at the muliwai a pele lava channel, Mauna Ulu, Hawai‘i. Bull. Volcanol. 79, 75. doi:10.1007/s00445-017-1161-5
Whelley, P. L., Glaze, L. S., Calder, E. S., and Harding, D. J. (2014). LiDAR-derived surface roughness texture mapping: application to Mount St. Helens pumice plain deposit analysis. IEEE Trans. Geoscience Remote Sens. 52, 426–438. doi:10.1109/tgrs.2013.2241443
Wright, I. C., Chadwick, W. W., DE Ronde, C. E. J., Reymond, D., Hyvernaud, O., Gennerich, H.-H., et al. (2008). Collapse and reconstruction of monowai submarine volcano, Kermadec Arc, 1998-2004. J. Geophys. Res. Solid Earth 112. doi:10.1029/2007jb005138
Wright, I. C., Worthington, T. J., and Gamble, J. A. (2006). New multibeam mapping and geochemistry of the 30°–35° S sector, and overview, of southern Kermadec arc volcanism. J. Volcanol. Geotherm. Res. 149, 263–296. doi:10.1016/j.jvolgeores.2005.03.021
Wysoczanski, R. J.shipboard science crew (2013). Nirvana – TAN1213 R. V. Tangaroa research voyage report, NIWA internal report. New Zealand: NIWA Wellington.
Keywords: submarine-eruption change detection, geomorphology, multibeam bathymetry, remotely operated vehicle, eruption
Citation: Spain E, Carey RJ, Whittaker JM, Lucieer VL, Fox JM, Watson SJ and Tontini FC (2025) Geomorphic time series reveals the constructive and destructive history of Havre caldera volcano, Kermadec arc. Front. Earth Sci. 12:1463257. doi: 10.3389/feart.2024.1463257
Received: 11 July 2024; Accepted: 25 November 2024;
Published: 15 January 2025.
Edited by:
Yosuke Aoki, The University of Tokyo, JapanReviewed by:
Karoly Nemeth, Institute of Earth Physics and Space Science (EPSS), HungarySalvatore Passaro, National Research Council (CNR), Italy
Copyright © 2025 Spain, Carey, Whittaker, Lucieer, Fox, Watson and Tontini. This is an open-access article distributed under the terms of the Creative Commons Attribution License (CC BY). The use, distribution or reproduction in other forums is permitted, provided the original author(s) and the copyright owner(s) are credited and that the original publication in this journal is cited, in accordance with accepted academic practice. No use, distribution or reproduction is permitted which does not comply with these terms.
*Correspondence: R. J. Carey, cmViZWNjYS5jYXJleUB1dGFzLmVkdS5hdQ==