 Xiufeng Zhang1
 Haikuan Zhang
- 1Research Center for Rock Burst Control, Shandong Energy Group Co., LTD., Jinan, Shandong, China
- 2Deep Mining and Rock Burst Research Branch, Chinese Institute of Coal Science, Beijing, China
The rockburst risk prediction based on microseismic (MS) data is an important research task in deep mine safety prevention. However, the lack of systematic research on explicit prediction indexes and the waste of a large amount of unlabeled data are still two main problems that hinder the development of rockburst prediction. In this paper, the acoustic emission (AE) event distribution at each coal rock deformation and failure stage is studied based on the laboratory experiment. The spatial-temporal evolution of rockburst in MS data of coal mine fields is explored. Based on systematic research of the AE and MS distribution features considering the physical logic of coal rock mass failure, nine different rockburst prediction indexes are employed to describe the MS data features before rockburst. Then, according to the rockburst prediction indexes, a new self-supervision rockburst risk prediction algorithm is constructed, consisting of the pre-trained model and fine-tuning model with the same encoder and decoder structure. The pre-trained model is trained with unlabeled MS data to automatically learn rockburst prediction index features by reconstructing the masked indexes. Based on the pre-trained encoder and decoder parameters, the fine-tuning model is trained with the labeled MS data to predict rockburst risk. A large number of experiments show that the proposed rockburst prediction self-supervision algorithm is far superior to previous algorithms, by effectively utilizing unlabeled data. The ablation experiment also proves the validity of the studied rockburst prediction indexes.
1 Introduction
Coal mine rockburst is characterized by its sudden occurrence and severe destruction (Aydan et al., 2017; Basnet et al., 2023), which can cause extensive damage to roadways and even casualties, which is one of the most serious disasters threatening the safe production of coal mines. The accuracy of rockburst risk prediction on the basis of reliable data is of great significance in effectively preventing and controlling rockburst. Currently, scholars mainly evaluate the risk of the special area by empirical analytical (Yang et al., 2018), experimental (Cheng et al., 2023), numerical (Manouchehrian and Cai, 2018; Wang et al.,2021), intelligent (Adoko et al., 2013; Adoko and Zvarivadza, 2018; Xue et al., 2023), expert system (Li et al., 2020) and data mining (Askaripour et al., 2022; He et al., 2023; Pu et al., 2019; Li et al., 2019; He et al., 2018) methods. Rockburst predictions are generally categorized into long-termand short-term types (Liang et al., 2020). Long-term predictions emphasize the utilization of rock mechanical parameters to develop a prediction model that assesses the likelihood of rockburst occurrences across varying surrounding rock masses and field conditions (Liang and Zhao, 2022). Conversely, short-term predictions aim to predict the timing and scale of potential rockburst events by the dynamic and continuous analysis of real-time monitoring data during the excavation phase (Jinqiang et al., 2021).
In the studies of short-term rockburst prediction, microseismic (MS) monitoring stands as a highly accepted and efficient tool. It can monitor rockburst occurrences by capturing significant signals that emerge from the fracturing processes within coal rock masses. Recently, a significant number of scholars have focused on rockburst prediction utilizing microseismic (MS) data and machine learning algorithms. Based on the strength of machine learning in handling nonlinear problems, researchers have employed a range of prevalent algorithms for short-term rockburst prediction, encompassing Support Vector Machines (SVM) (Ji et al., 2020; Jin et al., 2022), Convolutional Neural Networks (CNN) (Dong et al., 2023; Zhang et al., 2021; Yin et al., 2021a), diverse Recurrent Neural Network (RNN) variants (Hu et al., 2023; Di et al., 2023a; Di et al., 2023b), ConvLSTM (Chen et al., 2023; Ma et al., 2021), and ensemble-learning techniques (Liang et al., 2020; Yin et al., 2021b; Liang et al., 2021). These algorithms have shown promise in enhancing the accuracy and reliability of rockburst predictions based on MS data. To describe the spatiotemporal relationship of microseismic data and process spatiotemporal indexes of rockburst prediction, Chen et al. (2023) constructed a deep learning model based on a convolutional long short-term memory network (ConvLSTM) to predict the short-term rockburst risks. To effectively capture the progression of rockburst, Zhang et al. (2021) and Yin et al. (2021a) leverage the improved convolutional neural network (CNN) to predict rockburst occurrences. Additionally, ensemble-learning methods (Liang et al., 2020; Yin et al., 2021b; Liang et al., 2021) have been employed to integrate multiple models, resulting in a powerful and robust rockburst prediction model that leverages various MS parameters. By harnessing the strengths of both ConvLSTM and ensemble learning, these advancements are poised to enhance the accuracy and reliability of rockburst predictions significantly. Meanwhile, considering the basic principles of MS and acoustic emission (AE) are similar, the acoustic emission (AE) system is also adapted to monitor the associated AE signals during the rockburst process and to explore the characteristics of micro-cracks position and acoustic emission event distribution at different stages (Hu et al., 2019; Su et al., 2018).
In the aforementioned studies, the initial step involves a thorough analysis of the rockburst impacts on the distribution of microseismic (MS) data. Subsequently, specific and explicit rockburst prediction (ERP) indexes are extracted and calculated based on the MS data, which aims to capture the key features related to rockburst occurrence. Finally, the supervised machine learning (ML) algorithm with rockburst prediction indexes as input is constructed to predict rockburst risk. Almost all previous ML methods for rockburst prediction based on microseismic (MS) data necessitate risk targets for supervised learning. Nevertheless, the process of labeling the rockburst risks for each MS event is not only costly but also labor-intensive. As a result, a large amount of unlabeled MS data cannot be used to train the supervised rockburst prediction algorithms, which represents a significant waste of potentially valuable information for improving prediction accuracy. At present, the explicit rockburst prediction indexes based on MS data are normally analyzed at the data level. There is a lack of systematic research and summary from the physical logic view of coal rock mass failure. Simultaneously, in the deployment of a new mine, these algorithms require a considerable amount of time for training, resulting in a waste of resources and time.
In this paper, to systematically research and summarize the MS data features based on the physical logic of coal rock mass failure, distribution features of experimental acoustic emission (AE) events and spatial-temporal evolution of rockburst in field MS data are studied. A systematic study of explicit rockburst prediction indexes is presented considering the MS data spatiotemporal features and the failure mechanism of coal and rock mass. Then, a new self-supervision algorithm for predicting the rockburst risk is proposed, including self-supervision and fine-tuning models with the same encoder and decoder structure. In the self-supervision framework, the explicit rockburst predictions are randomly masked and the pre-trained algorithm is employed to reconstruct the masked indexes. Based on the pre-trained encoder and decoder weights, the fine-tuning algorithm is properly trained with a small amount of labeled data, which can be directly used for rockburst prediction in new mines. In the MS data sets of three mines, the performance of the proposed algorithm is far better than that of previous methods. Moreover, the algorithm also provides a strategy that utilizes a large amount of data for self-supervision to obtain the pre-trained encoder and decoder weights, and then quickly deploy the algorithm in new mines through fine-tuning.
2 The distribution features of AE events in laboratory experiments and MS events in the coal mine filed
Microseismic (MS) system aims to monitor small seismic events caused by stress concentration, rock rupture, or other forms of energy release in geological media, especially in coal rock mass. Acoustic emission (AE) system refers to monitoring the phenomenon of transient elastic waves caused by the initiation and development of material internal defects under the action of external forces until the rapid release of energy. Since the basic principles of MS and AE are similar, the AE events distribution of coal rock mass in the process of deformation and failure and the MS event distribution in the mining process are studied in this section.
2.1 The AE events distribution in the laboratory AE experiment
The AE event distribution features are studied based on the acoustic emission monitoring equipment of the uniaxial compression experiment. In this experiment, coal rock masses from coal mine sites are sampled. Eight 50 mm × 90 mm standard coal samples are made by sample preparation equipment and cutting machine. The uniaxial compression machine is used for loading with 0.05 mm/min displacement control. DS5-8B acoustic emission system is used to monitor the acoustic emission signal during the loading process, and the signal measurement range is 1 kHZ∼3 MHZ. The illustration of the acoustic emission monitoring experiment of coal rock sample deformation and failure is shown in Figure 1. The stress-time-AE energy-AE count curves are shown in Figure 2.
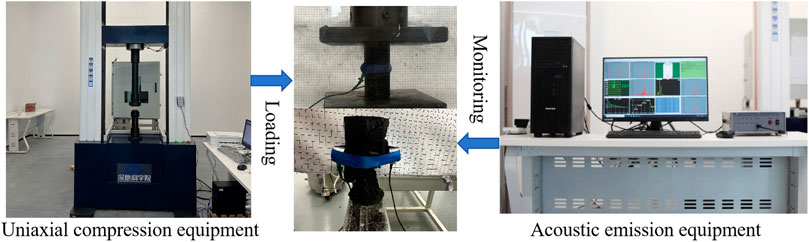
Figure 1. The illustration of the acoustic emission monitoring experiment of coal rock deformation and failure.
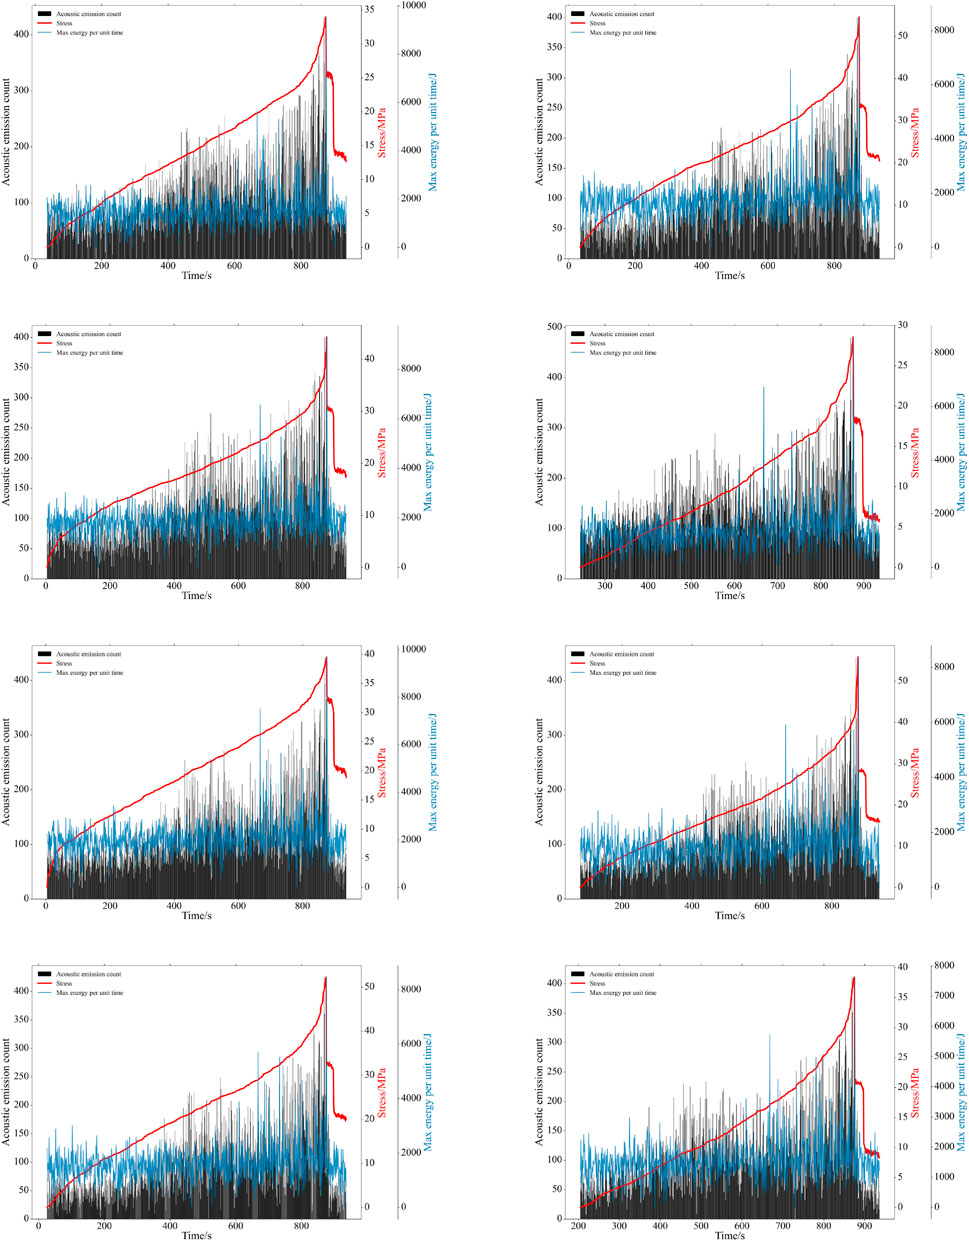
Figure 2. Stress-time-AE energy-AE count curves of different coal samples under uniaxial compression. The AE energy is the max AE energy per unit of time.
AE events gradually extend from both ends of the coal rock sample to the middle of the sample in space during the whole loading process. To more clearly explore the distribution characteristics of events, the distribution of AE events from the process of coal rock mass from loading to failure are analyzed from four stages, including compaction stage, elastic deformation stage, plastic deformation stage, failure stage, and residual deformation stage.
The AE count and the max AE energy per unit time of different coal rock samples in the compaction stage are very small, and the AE event activity is in the silent period. With the continuous increase of axial stress, coal rock samples enter the elastic deformation stage, in which microporous cracks develop stably. The acoustic emission count and the max AE energy have some increase compared with the compaction stage. Then, as the axial stress continues to grow, the coal rock samples enter the plastic deformation stage. The microporous cracks continue to develop, expand, and penetrate. In the coal rock samples, the unstable development of cracks results in plastic deformation. In this stage, the acoustic emission count and the max AE energy increase significantly and show a disordered distribution. When axial stress is loaded to peak stress, the cracks spread through to form a macro failure surface, and the coal rock samples are fractured. Meanwhile, the AE count and max energy of coal rock samples also appear to peak. In the failure stage, most AE events gather at the macro failure surface, showing an ordered distribution state. The final macroscopic damage location is basically the area where acoustic emission events are most dense.
2.2 The spatial-temporal evolution of rockburst in MS data
Microseismic monitoring (MS) data is the typical time series data reflecting the time, 3D location coordinates, and energy (intensity) of the rock failure. The MS data of a representative coal mine in the recent 3 years are studied in this section. The sequential distribution of the normalized microseismic energy is shown in Figure 3. In many long-term MS data, the fluctuation of energy gradient released by MS events is small and disordered, showing a relatively natural calm state. However, the MS event number increases obviously before the rockburst occurs from a frequency perspective. Meanwhile, the max energy of the MS event is obviously increased. During the period before the rockburst occurs, the fluctuation of the energy gradient is obviously different from the natural clam state, showing a drastic float in the energy gradient. The occurrence of dangerous events obviously causes the energy to reach its maximum during a period, resulting in an instantly sharp increase and a steep decrease in the energy fluctuation gradient.
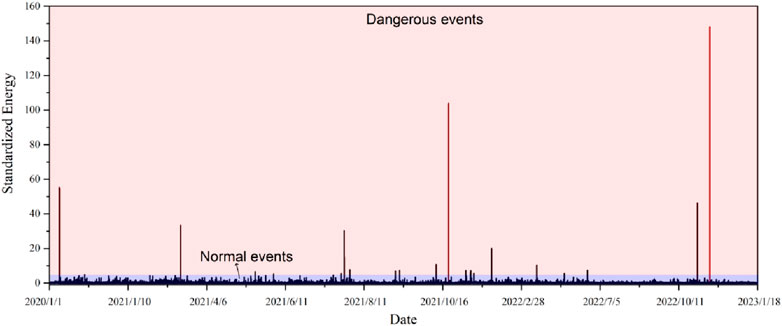
Figure 3. Microseismic energy expansion on the time sequence. The energy value is standardized. The red and blue area are the energy range of the dangerous events and normal events.
The projecting results of the MS energy on spatial coordinates are shown in Figure 4. Vast MS events are distributed in several aggregation areas. In one area, the distribution feature of several consecutive MS events is similar to the spatial distribution features of the most related events. When the stress field of the focal region reaches a limited degree, the distribution of time, space, and intensity of the MS event activity changes from disorderly to orderly state. The spatial intensity of MS events increases significantly and gathers at some special regions before the occurrence of dangerous events such as rockburst. Meanwhile, there is no large energy MS event around the rockburst event. This is because, for rockburst events, the stress in the surrounding rock increases from a steady state to a limited value within a long-term accumulation, resulting in a sudden release of energy. The release of large energy events can keep the stress of surrounding coal rock in a stable state for a certain period.
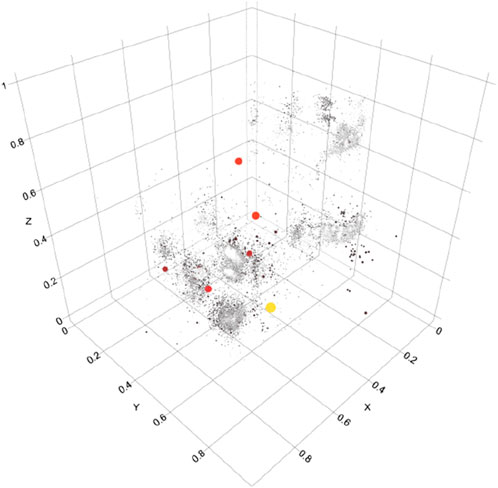
Figure 4. Spatial projection of MS energy. The three-dimensional coordinates are normalized. The size of the point represents the amount of energy.
3 Explicit rockburst prediction indexes based on microseismic data
The occurrence of rockburst is often influenced by various geological and mining conditions. The failure of coal rock mass is the result of continuous macroscopic crack formation from crack propagation to penetration, and MS monitoring technology is an effective means to observe the evolution of cracks in coal and rock.
MS data can reflect the influence of mining on surrounding rock and geological conditions. According to the previous study and the laboratory experiment in Section 2, the process of coal rock mass from loading to failure requires a compaction stage, elastic deformation stage, plastic deformation stage, failure stage, and residual deformation stage. Based on the physical logic of coal rock mass failure and AE/MS distribution features studied in Section 2, multiple rockburst prediction indexes are established to describe the time, spatial and intensity distribution features of MS data in this section.
3.1 Time sequence indexes
The time sequence rockburst prediction indexes aim to study the time distribution features of rockburst and MS events at different stages (Cai et al., 2018), whose key research object is the relationship between the occurrence time and MS event intensity. The time sequence indexes based on the MS data in this section include the temporal concentration, the time interval, and time information entropy.
According to the equipment results in Section 2, when the acoustic emission signal changes from a small number of disordered states to a large number of ordered states, it indicates that the rock mass changes from the stable state to the unstable state. For coal mine engineering, there is an obvious MS activity period before the occurrence of rockburst. This is because the surrounding coal rock mass is undergoing energy exchange with the outside system, and the surrounding rock structure is in an unstable adjustment period, which can be expressed by the temporal concentration and formalized as Equation 1.
where,
Based on the results of Figure 2 and the studies of MS event distribution in Figure 3, 4, before the coal rock mass failure and rockburst occurrence, the frequency of AE events and MS events increase significantly. Therefore, the time interval
Referring to the basic idea of dissipative structure theory, the process from gestation to the occurrence of AE signals and MS events can be regarded as an open system with energy exchange with the surrounding environment. When the stress field of the focal region reaches a limited degree, the distribution of time, space, and intensity of the MS or AE event activity will change from disorderly to orderly state. It shows that the AE signal and the MS event develop towards a certain trend and have broken away from the natural state. Therefore, the time information entropy Qt is used to describe the aggregation degree of MS events in the time series, reflecting the disorder or order in the evolution of MS time. The time information entropy can be formalized as Equation 2.
where, n is the total number of selected MS events.
3.2 Spatial indexes
The spatial index aims to study the spatial distribution features of AE and MS events before the dangerous event occurs (Tang and Xia, 2010; Lu et al., 2015), including space concentration, spatiotemporal diffusion, etc. Within the scope of the laboratory, the final macroscopic damage location is basically the area where acoustic emission events are most dense. From the macroscopic coal mine scale, when the distribution of MS events in a certain region is dense, it indicates that the region has strong MS activity and high rockburst risk. On the contrary, if the distribution of MS events in this region is scattered, it indicates that the region has low MS activity and low rockburst risk.
Similar to AE events from laboratory experiments, the spatial distribution of MS events corresponds to the occurrence and development process of microfailures in the inner space of rock mass. Therefore, the spatial distribution of MS events is important for understanding the stability of coal rock mass in the mine. The spatial intensity of MS events will increase significantly before the occurrence of dangerous events such as rockburst. Therefore, space concentration is presented as Equation 3.
where,
According to the equipment results in Section 2, the occurrence of AE events and MS events often does not exist in isolation, but occurs in a period of time. From the perspective of spatial distribution, AE and MS events tend to occur in a certain area, forming the event cluster. The spatial distribution features of these clusters can reflect the non-uniformity of stress distribution and the complexity of underground structures. The spatiotemporal diffusion is summarized to reflect the dispersion degree of MS events in time and space, which can be formalized as Equation 4.
where,
3.3 Intensity indexes
The strength index includes total stress equivalent, energy value, energy information entropy, and so on Kracke and Heinrich (2004). Laboratory-wide AE monitoring results show a rapid increase in the frequency and energy of AE events prior to macroscopic failure of loaded coal rock samples. By studying the relationship between the energy and stress during the occurrence of the engineering scale MS events, it is found that the square root of the energy released by the MS event is proportional to the stress variable in the coal rock mass. Therefore, the square root of the energy released by MS events can be used to reflect the strain state of coal and rock mass before the rockburst. The square root of the total energy of coal rock mass in the unit area and unit time is used as the energy prediction index, namely, the energy density. The energy density can be formalized as Equation 5.
where, Ei is the energy of i-th MS events. Sn and Tn are the area and statistical time window of the n consecutive MS events.
In the laboratory experiments, the peak value of AE counts means that the crack spread through to form macroscopic failure surface. Analogously, before a rockburst occurs in a coal mine, the MS stress in the coal rock mass surrounding the roadway increases from the steady state to the limit value, resulting in a sudden release of energy in the rock mass. The MS event count and energy also increase significantly. Therefore, the energy concentration index is established to reflect the energy change and MS distribution before the rockburst, which can be formalized as Equation 6.
where, QE, Var(En) and
Through the study of stress-time-AE energy-AE count curves in Figure 2, the sudden change of energy E and event activity value QS can be regarded as a sign of coal rock failure or rockburst risk. The activity value should be an index that combines the frequency, the maximum energy, the average energy and the distribution concentration of events, which is formalized as Equation 7:
where, N indicates the total number of microseismic events in the statistical period; Mi represents the energy level of the MS event in the statistical period; M is the energy level of the microseismic event in the statistical period. The AE and MS energy E mainly reflect the failure strength of coal rock mass under loads, which is also a prediction index.
Generally, MS data parameters and rockburst prediction indexes have different values and units. If they are directly input into the neural networks, the training performance will be poor. After exploring the solving principle of the neural network, the MS data parameters need to be standardized and processed after the rockburst prediction indexes are established. The standardized calculation equation is shown as Equation 8.
where, xi and yi represent the i-th data value before and after normalization. n is the total number of selected data.
4 The self-supervision method for rockburst prediction based on MS data
In order to make full use of a large amount of unlabeled MS data, this paper presents a self-supervision method for rockburst prediction based on MS data. The self-supervision algorithm consists of a pre-trained model and a fine-tuning model with the same decoder and encoder. By reconstructing the masked prediction indexes, the pre-trained model mainly learns the data features of rockburst prediction indexes based on a large number of MS monitoring data. The fine-tuning model perfectly achieves the purpose of rockburst risk prediction using pre-trained parameters and a few labeled MS data.
4.1 The pre-trained model of self-supervision method
The self-supervision pre-trained model for rockburst risk prediction is mainly trained by reconstructing the masked prediction indexes, using rockburst prediction index features based on a large number of MS data. The model consists of an encoder, a decoder, and an auxiliary task reconstruction head, as shown in Figure 5.
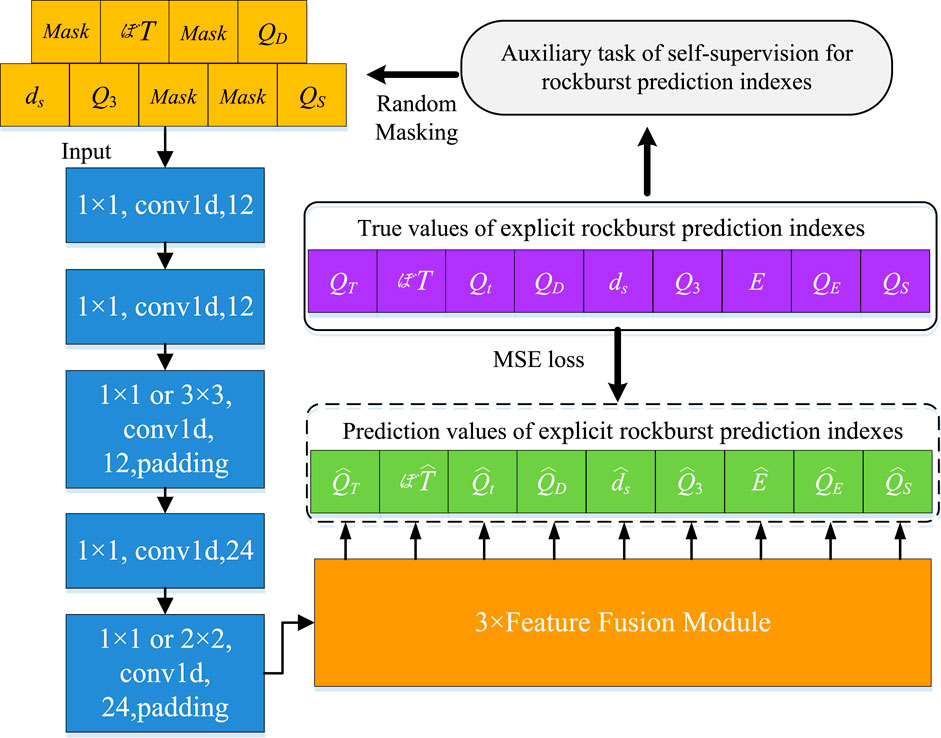
Figure 5. The pre-trained model of the self-supervision algorithm for rockburst prediction.
A large number of unlabeled MS data is first calculated to the explicit rockburst prediction indexes based on the Equation 1∼Equation 8. Then, some prediction indexes are randomly masked with a certain probability. The masked and unmasked prediction indexes are input into the encoder to obtain the encoded features. The encoder consists of a five-layer one-dimensional convolutional neural network (1D CNN). Each 1D CNN module consists of a convolution layer, a Batch Normalization layer, and a Relu activation function. The number of convolution kernels in each layer is 12, 12, 12, 24, and 24, respectively. The input and output feature dimensions of the encoder are [Batch size, 9, 1] and [Batch size, 24, 1].
The cosine positional encoding is used to encode the position of encoding features to obtain the input tokens of the decoder model. The decoder of the self-supervision algorithm consists of 3 layers of feature fusion modules, as shown in Figure 6. Each fusion module consists of a layer normalization operation, cross-attention mechanism, layer normalization operation, and a forward neural network (FNN) layer, as shown in Figure 7. In the cross-attention mechanism, the input tokens are calculated to query (Q), key (K), and value (V) vectors, seeing Figure 8. Then, these vectors are fused by the MatMul, SoftMax, and Scale operations. To speed up training, the three vectors can be divided and parallelized. The cross-attention mechanism can be shown as Equation 9.
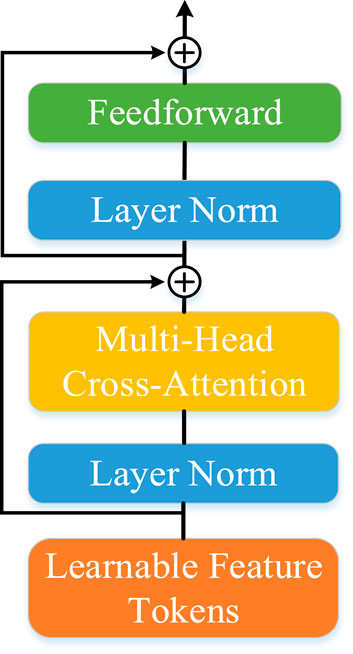
Figure 6. The structure of decoder in the self-supervision method.
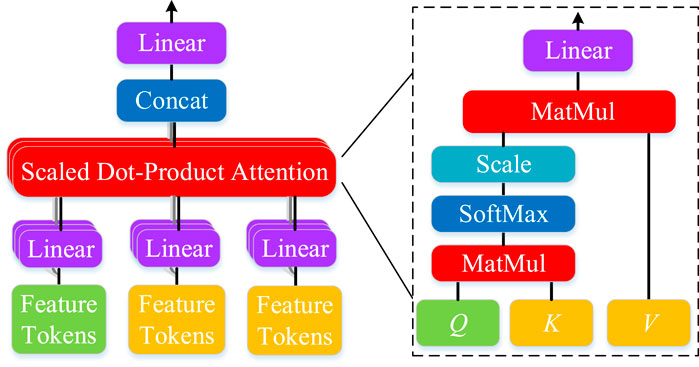
Figure 7. The illustration of cross-attention mechanism.
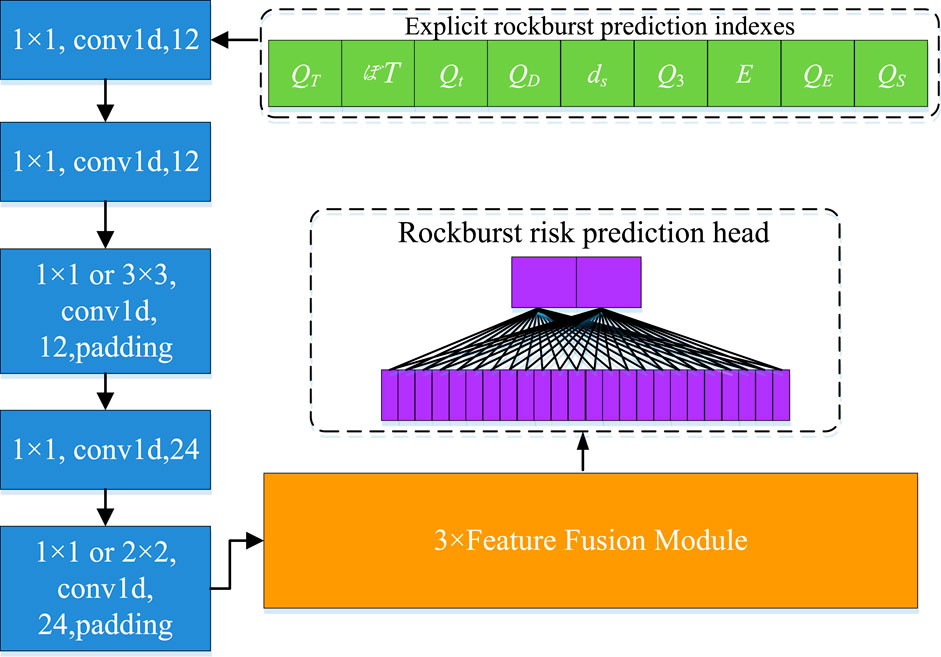
Figure 8. The fine tuning model of the self-supervision algorithm for rockburst prediction.
The output of the decoder is the decoding features. The decoding features are reconstructed using a reconstruction head composed of a double-layer forward neural network. The input and output feature dimensions of the decoder are [Batch size, 24, 1] and [Batch size, 24, 1]. Meanwhile, the input and output vector dimensions of the auxiliary task reconstruction head are [Batch size, 24, 1] and [Batch size, 9, 1].
In the pre-trained model of the self-supervision algorithm, the input is the combination of randomly masked and unmasked rockburst prediction indexes, while the label is the original rockburst prediction indexes. The MSE loss function is used to evaluate the difference between the model output and the label.
4.2 The fine-tuning model of self-supervision algorithm
The presented fine-tuning model of the self-supervision algorithm is mainly designed for the rockburst risk prediction task, which is composed of the encoder, decoder, and risk prediction head, seeing Figure 8. The structure of the encoder and decoder is the same as the pre-trained model. The encoder consists of a five-layer one-dimensional convolutional model (CNN). The decoder consists of 3 layers of feature fusion modules.
The risk output head is mainly designed according to the requirement of rockburst risk prediction task. The input and output feature dimensions of the risk output head are [Batch size, 24, 1] and [Batch size, 9, 1]. The occurrence of rockburst is affected by many factors such as overlying strata, geological structure, mining depth, ground stress, coal pillar layout, and stope layout, which can be analyzed by the decoder and encoder. The output of the rockburst prediction algorithms is only the probability of rockburst risk or no rockburst risk. For the risk prediction head of the fine-tuning model, a two-layer forward neural network with ReLU activation function and Batch Normalization layer is constructed.
During training the self-supervision rockburst risk prediction algorithm, MS data is processed based on the calculation formula in Section 3 to obtain the rockburst prediction indexes. Then, the decoder and encoder parameters in the pre-trained model are transferred to the fine-tuning model using the transfer learning method. Finally, a small number of labeled microseismic monitoring data corresponding to rockburst prediction indexes are used to complete the training of the fine-tuning model.
5 Experiment implement details
5.1 Dataset construction
The MS monitoring data of two coal mines are used to validate the performance of the proposed self-supervision rockburst risk prediction method. For the first mine, the MS monitoring data includes 13,583 events, monitoring the time, location, and energy information, and the number of dangerous events is 114. For the second mine, the MS monitoring data includes 28,371 events and the number of dangerous events is 195. Firstly, nine calculated rockburst prediction indexes, such as time series concentration, space intensity, time interval, and energy, are calculated according to the MS monitoring data of two coal mines, which are the features of the samples in the dataset. The label is whether dangerous events occur in the future. Then, the dataset is divided into a training set, validation set, and testing set according to the number of 50%, 20%, and 30% on the time scale. The calculations of temporal concentration, time information entropy, space concentration, spatiotemporal diffusion, energy density, energy concentration, and MS activity value need to be fused in consecutive MS event data. By setting n = 5, 6,., 15, thirty datasets for each coal mine are constructed.
To simulate the direct application of the model, the joint data set of the training set, the verification set, and the test set are processed with unbalanced data respectively, so that the data of the test set does not cross with other data sets. Considering the importance of the prediction of dangerous events, this paper sets three test sets, namely, the testing set of single dangerous events (dangerous set), the testing set of single non-dangerous events (non-dangerous set), and the testing set of mixed events (mixed set). In the mixed set, the number of dangerous and non-dangerous events is equal.
5.2 Comparison methods and implementation details
The comparison methods are SVM (Ji et al., 2020), CNN (Zhang et al., 2021), LSTM (Di et al., 2023b), and CNN-GRU (Ma et al., 2021) methods which are the most popular supervised deep-learning methods for rockburst prediction. For the presented self-supervision method, the pre-trained model is trained 100 epochs. Then, by employing the weights of the pre-trained model, the fine-tuning model also trained 100 epochs for rockburst prediction testing. The comparison methods are trained 200 epochs. The masked probability of the rockburst prediction indexes for the pre-trained model input of the presented self-supervision method is 50%. For the training of the pre-trained model, the unlabeled data is the entire MS data of each mine training set.
All experiments are implemented on Pytorch 1.10.2 + CUDA 11.3, in FP32 precision by using two RTX A6000 GPU. The experiments use an AdamW optimizer with a momentum of 0.9, a batch size of 256, a weight decay of 4 × 10⁻⁵, an initial learning rate of 5 × 10⁻⁴. For the supervised methods and the presented fine-tuning method, the cross-entropy (CE) loss function serves as the metric to assess the discrepancy between predictions and ground truth labels. Conversely, for the pre-trained model of the self-supervision method, the mean squared error (MSE) loss is utilized. The performance of methods is represented by precision (%).
6 Experiment results and discussion
This section mainly uses the comparison experiment on two selected mines’ MS data to show the performance of the algorithm, in Section 6.1. The structure and parameters of the algorithm are studied by ablation experiments on the MS data of the first mine, in Sections 6.2∼6.6.
6.1 Comparison studies
The comparison study results are shown in Figure 9. For the first and second mine, when fused MS event number n is 8, the proposed method achieves the best performance on the mixed event testing set with an accuracy of 84.64%/83.17%; the accuracy of the method on the dangerous event testing set is 81.78%/80.50%; the accuracy of the model on the non-dangerous event testing set is 87.50%/85.86%. These results on different type datasets are close to the accuracy of the model on the mixed test set, indicating that the model is very effective for both dangerous and non-dangerous event prediction. In contrast, the best accuracy of the comparison methods is 82.19%/79.86%/84.52% on the mixed/dangerous/non-dangerous event testing set.
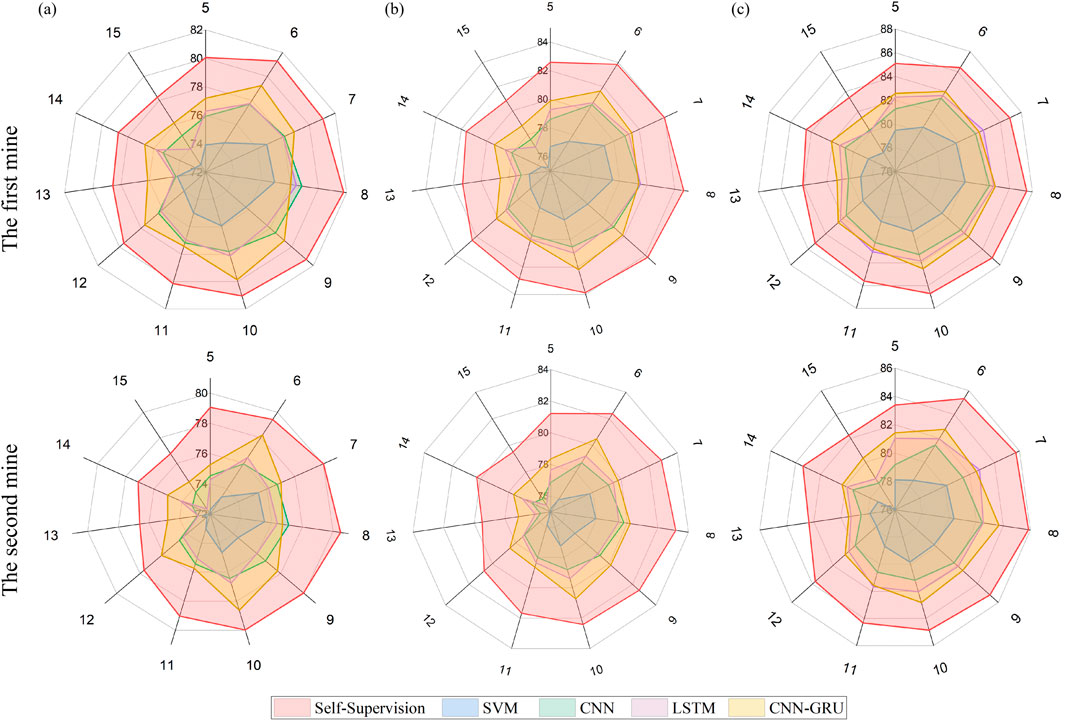
Figure 9. The performance comparison of the presented self-supervision method and different methods on the (A) dangerous set; (B) mixed set; (C) non-dangerous set. The rays of radar maps are the mixed numbers of MS events in prediction indexes.
When different models reach the highest accuracy on different data sets, the corresponding n is similar. This is because the rockburst prediction indexes are mainly physical quantity indexes presented by considering the physical logic of coal rock mass failure. For a working face or mine with the same mining situation, the description content and meaning of these indexes are the same.
6.2 The ablation experiment of rockburst prediction indexes
In order to explore the importance of different rockburst prediction indicators, the performance of the different index combinations on the mixed testing set when n=8 is shown in Figure 10. It is obvious that the energy and spatiotemporal diffusion are very important for the analysis of future rockburst risk. When respectively lack of the temporal concentration, the time interval, time information entropy, space concentration, spatiotemporal diffusion, energy density, energy concentration, energy, and MS activity value, model performance decreased by 3.12%, 1.03%, 2.56%, 2.37%, 5.31%, 3.22%, 2.75%, 6.81%, and 2.65%, respectively.
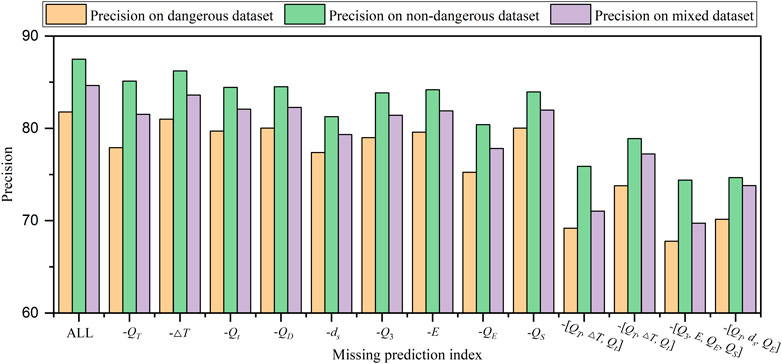
Figure 10. The ablation results of missing different rockburst prediction index.
By studying the effectiveness of different index combinations, Figure 10 shows that the impact of missing one type of index on model performance is much greater than that of missing the same number of different types of index. This is because the rockburst or MS event contains three aspects of time, space, and intensity information, and the lack of any one kind of index will result in an inadequate description of rockburst information. Meanwhile, the ablation experiment of the indicators also proved the rationality and correctness of the time-space-intensity indexes established in the paper, because no index would have a negative impact on the performance of the model.
6.3 Random mask probability for rockburst indexes
Random mask probability is a very important parameter for pre-trained models in self-supervision algorithms. In this section, the random mask probability is set as 0.3, 0.4, 0.45, 0.5, 0.55, 0.6, 0.7, 0.8, respectively. The ablation results are shown in Table 1. Obviously, when the random probability of the mask is 0.5, the method performance is the best. When the mask probability is too large or too small, the model performance will be greatly reduced. Too large or too small mask probability can cause model performance degradation. This is because when the random mask probability is too small, the pre-trained model of the self-supervision algorithm can easily complete the rockburst index reconstruction. Therefore, the pre-trained model cannot understand the distribution features of the rockburst index. However, when the random mask probability is too large, it is difficult for the pre-trained model to reconstruct the masked indexes because the useful information is too little.

Table 1. The ablation experiment results of random mask probability based on the mixed set. The bold values mean the probability and precision when the model achieve the best performance.
6.4 Training epochs of pre-trained and fine-tuning models
As mentioned in Section 3, the pre-trained model in Figure 4 can automatically explore the distribution features of prediction indexes. Therefore, the pre-trained model can learn useful information from a large number of unlabeled MS events. In this section, the self-supervision model is firstly pretrained with 50/100/150 epochs. Then, the encoder and decoder of the fine-tuning model are initialized using the pre-trained parameters. The supervised fine-tuning model is trained with 150/100/50 epochs using labeled MS data of training datasets. The performance on the mixed set is 83.37%/84.64%/82.86% based on these settings.
In Table 1, an insufficient number of fine-tuning epochs leads to a decrease in the model’s performance, as the model is unable to adequately capture the distribution features of the MS data. Conversely, when the supervised epochs exceed 100, the proposed model demonstrates superior performance, especially when utilizing a significant amount of data for self-supervision pretraining. The introduced self-supervision approach offers a viable option for offline pretraining with vast amounts of data, enabling swift deployment in engineering scenarios.
6.5 The number of unlabeled samples in the pre-trained stage
For the proposed self-supervision method, the unlabeled data is used to train the pre-trained model, and the labeled data is employed to train the fine-tuned model. For the training setting of the first mine in Figure 9, the numbers of unlabeled samples and labeled samples are 6,792 and 6,792. This section increases the number of unlabeled samples by fusing data from the dataset of the second mine. Figure 11 shows the self-supervision algorithm performance changes as the amount of unlabeled data grows from 6,792 to 20,977. The results show that the increase of the number of unlabeled data at the pre-trained stage can improve the rockburst prediction performance of the proposed self-supervision algorithm. This is mainly because a sufficient amount of MS data helps the pre-trained model to fully learn the intra-class variance of the same type of MS events and the inter-class gap of different types of MS events.
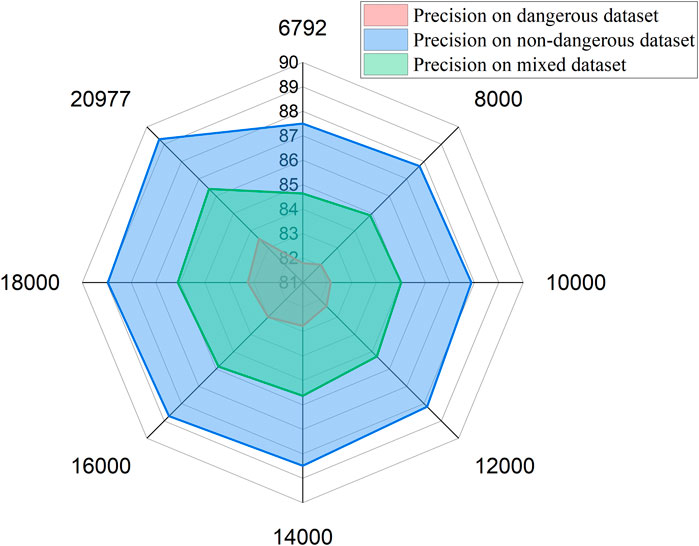
Figure 11. The ablation experiment results of unlabeled samples.
6.6 The layer number and feature dimension of decoder
In order to explore the optimal structure of the self-supervision algorithm, the layer number and feature dimension of the decoder are studied by the ablation experiments. The layer number of the decoder is set as 1∼5. The feature dimension of the decoder is set as [Batch size, 12, 1], [Batch size, 24, 1], [Batch size, 36, 1] and [Batch size, 48, 1]. The ablation results are shown in Figure 12. When the layer number is less than 3 and the feature dimension is less than 24 ([Batch size, 24, 1]), the performance degradation is significant. However, more layer numbers and feature dimensions of the decoder have limited performance gains with more computational consumption. Therefore, the decoder with the 3-layer number and [Batch size, 24, 1] feature dimension is the optimal structure for trade-off performance and computation cost.
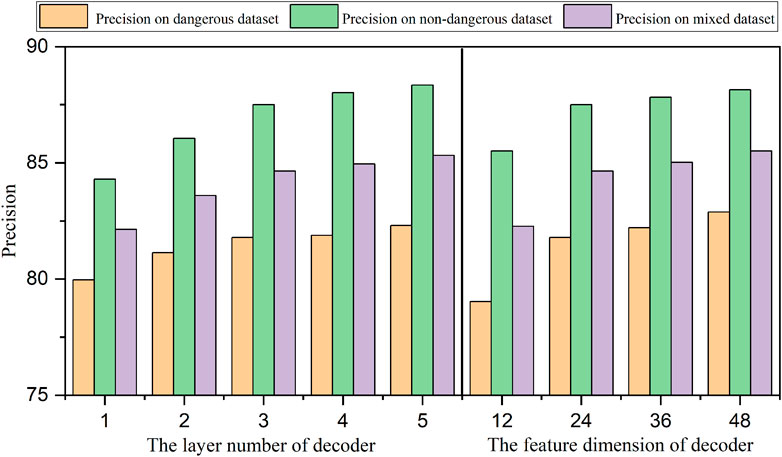
Figure 12. The ablation experiment results of the decoder layer numbers and decoder feature dimensions. 24 indicates that the feature dimension of the encoder is [Batch size, 24, 1].
7 Conclusion
This paper aims to overcome two main rockburst prediction problems, including the absence of comprehensive research on definitive prediction indices and the waste of vast amounts of unlabeled data. Therefore, the distribution features of acoustic emission (AE) events at each stage of coal rock deformation and failure are studied by the laboratory experiment. The spatial-temporal evolution of rockburst in field MS data is explored. Subsequently, nine prediction indexes of rockburst risk are established, including temporal concentration, time interval, and time information entropy, space concentration, spatiotemporal diffusion, total stress equivalent, energy value, and energy information entropy. The formulas of nine different dominant rockburst prediction indexes are summarized.
To intelligent use the unlabeled data, a new self-supervision algorithm consisting of the pre-trained and fine-tuning model is constructed according to the distribution features of MS data and the requirement of rockburst prediction. The pre-trained model of the self-supervision algorithm can automatically learn the distribution features of rockburst prediction indexes by reconstructing the masked indexes. Then, the pre-trained encoder and decoder parameters are transferred to the fine-tuned model using the transfer learning method. Finally, the fine-tuning model is trained using the labeled MS data with rockburst risk.
Abundant experiments report that the performance of the self-supervision algorithm is far superior to previous algorithms. Meanwhile, the ablation experiment also proves that the proposed rockburst prediction indexes are effective and the proposed self-supervision rockburst prediction algorithm can effectively use the unlabeled data.
Data availability statement
The original contributions presented in the study are included in the article/supplementary material, further inquiries can be directed to the corresponding authors.
Author contributions
XZ: Writing–original draft. HZ: Writing–original draft. HL: Writing–original draft. GL: Writing–original draft. SX: Writing–review and editing. HY: Writing–review and editing. YC: Writing–review and editing. FH: Writing–review and editing.
Funding
The author(s) declare that financial support was received for the research, authorship, and/or publication of this article. This work was supported by Shandong Energy Group (NOS SNKJ2023A17-R01 and SNKJ2022BJ03-R28).
Conflict of interest
Authors XZ, GL, HY, YC, and FH were employed by Shandong Energy Group Co., LTD.
The remaining authors declare that the research was conducted in the absence of any commercial or financial relationships that could be construed as a potential conflict of interest.
Publisher’s note
All claims expressed in this article are solely those of the authors and do not necessarily represent those of their affiliated organizations, or those of the publisher, the editors and the reviewers. Any product that may be evaluated in this article, or claim that may be made by its manufacturer, is not guaranteed or endorsed by the publisher.
References
Adoko, A., and Zvarivadza, T. (2018) “A bayesian approach for predicting rockburst,” in ARMA US rock mechanics/geomechanics symposium. (Seattle, Washington, USA: American Rock Mechanics Association ARMA18).
Adoko, A. C., Gokceoglu, C., Wu, L., and Zuo, Q. J. (2013). Knowledge-based and data-driven fuzzy modeling for rockburst prediction. Int. J. Rock Mech. Min. Sci. 61, 86–95. doi:10.1016/j.ijrmms.2013.02.010
Askaripour, M., Saeidi, A., Rouleau, A., and Mercier-Langevin, P. (2022). Rockburst in underground excavations: a review of mechanism, classification, and prediction methods. Undergr. Space 7 (4), 577–607. doi:10.1016/j.undsp.2021.11.008
Aydan, Ö., Geniş, M., Akagi, T., and Kawamoto, T. (2017). Assessment of susceptibility of rock bursting in tunnelling in hard rocks. Modern tunneling science and technology, London, United Kingdom: Routledge, 391–396.
Basnet, P. M. S., Mahtab, S., and Jin, A. (2023). A comprehensive review of intelligent machine learning based predicting methods in long-term and short-term rock burst prediction. Tunn. Undergr. Space Technol. 142, 105434. doi:10.1016/j.tust.2023.105434
Cai, W., Dou, L., Zhang, M., Cao, W., Shi, J. Q., and Feng, L. (2018). A fuzzy comprehensive evaluation methodology for rock burst forecasting using microseismic monitoring. Tunn. Undergr. Space Technol. 80, 232–245. doi:10.1016/j.tust.2018.06.029
Chen, F., Liang, Z., and Cao, A. (2023). ConvLSTM for predicting short-term spatiotemporal distribution of seismic risk induced by large-scale coal mining. Nat. Resour. Res. 32 (3), 1459–1479. doi:10.1007/s11053-023-10193-5
Cheng, T., He, M., Li, H., Liu, D., Qiao, Y., and Hu, J. (2023). Experimental investigation on the influence of a single structural plane on rockburst. Tunn. Undergr. Space Technol. 132, 104914. doi:10.1016/j.tust.2022.104914
Di, Y., Wang, E., Li, Z., Liu, X., Huang, T., and Yao, J. (2023a). Predicting microseismic, acoustic emission and electromagnetic radiation data using neural networks. J. Rock Mech. Geotechnical Eng. 16, 616–629. doi:10.1016/j.jrmge.2023.05.012
Di, Y., Wang, E., Li, Z., Liu, X., Huang, T., and Yao, J. (2023b). Comprehensive early warning method of microseismic, acoustic emission, and electromagnetic radiation signals of rock burst based on deep learning. Int. J. Rock Mech. Min. Sci. 170, 105519. doi:10.1016/j.ijrmms.2023.105519
Dong, L., Shu, H., Tang, Z., and Yan, X. (2023). Microseismic event waveform classification using CNN-based transfer learning models. Int. J. Min. Sci. Technol. 33, 1203–1216. doi:10.1016/j.ijmst.2023.09.003
He, M., Cheng, T., Qiao, Y., and Li, H. (2023). A review of rockburst: experiments, theories, and simulations. J. Rock Mech. Geotechnical Eng. 15 (5), 1312–1353. doi:10.1016/j.jrmge.2022.07.014
He, M., Ren, F., and Liu, D. (2018). Rockburst mechanism research and its control. Int. J. Min. Sci. Technol. 28 (5), 829–837. doi:10.1016/j.ijmst.2018.09.002
Hu, L., Feng, X.-T., Yao, Z.-B., Zhang, W., Niu, W.-J., Bi, X., et al. (2023). Rockburst time warning method with blasting cycle as the unit based on microseismic information time series: a case study. Bull. Eng. Geol. Environ. 82 (4), 121. doi:10.1007/s10064-023-03141-3
Hu, X., Su, G., Chen, G., Mei, S., Feng, X., Mei, G., et al. (2019). Experiment on rockburst process of borehole and its acoustic emission characteristics. Rock Mech. Rock Eng. 52, 783–802. doi:10.1007/s00603-018-1613-z
Ji, B., Xie, F., Wang, X., He, S., and Song, D. (2020). Investigate contribution of multi-microseismic data to rockburst risk prediction using support vector machine with genetic algorithm. IEEE Access 8, 58817–58828. doi:10.1109/access.2020.2982366
Jin, A., Basnet, P. M. S., and Mahtab, S. (2022). Microseismicity-based short-term rockburst prediction using non-linear support vector machine. Acta Geophys. 70 (4), 1717–1736. doi:10.1007/s11600-022-00817-4
Jinqiang, W., Basnet, P., and Mahtab, S. (2021). Review of machine learning and deep learning application in mine microseismic event classification. Mining of mineral deposits. 15 (1), 19–26. doi:10.1201/9780203746653
Kracke, D. W., and Heinrich, R. (2004). Local seismic hazard assessment in areas of weak to moderate seismicity—case study from eastern Germany. Tectonophysics 390 (1-4), 45–55. doi:10.1016/j.tecto.2004.03.023
Li, N., Huang, B., Zhang, X., Yuyang, T., and Li, B. (2019). Characteristics of microseismic waveforms induced by hydraulic fracturing in coal seam for coal rock dynamic disasters prevention. Saf. Sci. 115, 188–198. doi:10.1016/j.ssci.2019.01.024
Li, N., Zare Naghadehi, M., and Jimenez, R. (2020). Evaluating short-term rock burst damage in underground mines using a systems approach. Int. J. Min. Reclam. Environ. 34 (8), 531–561. doi:10.1080/17480930.2019.1657654
Liang, W., Sari, A., Zhao, G., McKinnon, S. D., and Wu, H. (2020). Short-term rockburst risk prediction using ensemble learning methods. Nat. Hazards 104, 1923–1946. doi:10.1007/s11069-020-04255-7
Liang, W., Sari, Y. A., Zhao, G., McKinnon, S. D., and Wu, H. (2021). Probability estimates of short-term rockburst risk with ensemble classifiers. Rock Mech. Rock Eng. 54, 1799–1814. doi:10.1007/s00603-021-02369-3
Liang, W., and Zhao, G. (2022). A review of long-term and short-term rockburst risk evaluations in deep hard rock. J. Rock Mech. Eng. 41, 19–39. doi:10.13722/j.cnki.jrme.2021.0165
Lu, C. P., Liu, G. J., Liu, Y., Zhang, N., Xue, J. H., and Zhang, L. (2015). Microseismic multi-parameter characteristics of rockburst hazard induced by hard roof fall and high stress concentration. Int. J. Rock Mech. Min. Sci. 76, 18–32. doi:10.1016/j.ijrmms.2015.02.005
Ma, J., Ma, C., Jun, Z., Li, T., and Wang, X. (2021). “Research on prediction of rockburst microseismic parameters based on CNN-LSTM hybrid model,” in IOP Conference Series: Earth and Environmental Science, Bristol, United Kingdom: IOP Publishing, 861, 052097.doi:10.1088/1755-1315/861/5/052097
Manouchehrian, A., and Cai, M. (2018). Numerical modeling of rockburst near fault zones in deep tunnels. Tunn. Undergr. Space Technol. 80, 164–180. doi:10.1016/j.tust.2018.06.015
Pu, Y., Apel, D. B., Liu, V., and Mitri, H. (2019). Machine learning methods for rockburst prediction-state-of-the-art review. Int. J. Min. Sci. Technol. 29 (4), 565–570. doi:10.1016/j.ijmst.2019.06.009
Su, G., Shi, Y., Feng, X., Jiang, J., Zhang, J., and Jiang, Q. (2018). True-triaxial experimental study of the evolutionary features of the acoustic emissions and sounds of rockburst processes. Rock Mech. Rock Eng. 51, 375–389. doi:10.1007/s00603-017-1344-6
Tang, L., and Xia, K. W. (2010). Seismological method for prediction of areal rockbursts in deep mine with seismic source mechanism and unstable failure theory. J. Central South Univ. Technol. 17 (5), 947–953. doi:10.1007/s11771-010-0582-5
Wang, J., Apel, D. B., Pu, Y., Hall, R., Wei, C., and Sepehri, M. (2021). Numerical modeling for rockbursts: a state-of-the-art review. J. Rock Mech. Geotechnical Eng. 13 (2), 457–478. doi:10.1016/j.jrmge.2020.09.011
Xue, Y., Li, Z., Song, D., He, X., Wang, H., Zhou, C., et al. (2023). A method to predict rockburst using temporal trend test and its application. J. Rock Mech. Geotechnical Eng. 16, 909–923. doi:10.1016/j.jrmge.2023.07.017
Yang, J., Chen, W., Tan, X., and Yang, D. (2018). Analytical estimation of stress distribution in interbedded layers and its implication to rockburst in strong layer. Tunn. Undergr. Space Technol. 81, 289–295. doi:10.1016/j.tust.2018.07.007
Yin, X., Liu, Q., Huang, X., and Pan, Y. (2021a). Real-time prediction of rockburst intensity using an integrated CNN-Adam-BO algorithm based on microseismic data and its engineering application. Tunn. Undergr. Space Technol. 117, 104133. doi:10.1016/j.tust.2021.104133
Yin, X., Liu, Q., Pan, Y., and Huang, X. (2021b). A novel tree-based algorithm for real-time prediction of rockburst risk using field microseismic monitoring. Environ. Earth Sci. 80, 504–519. doi:10.1007/s12665-021-09802-4
Keywords: rockburst prediction, rockburst prediction index, deep learning, self-supervision algorithm, microseismic data
Citation: Zhang X, Zhang H, Li H, Li G, Xue S, Yin H, Chen Y and Han F (2024) A self-supervision rockburst risk prediction algorithm based on automatic mining of rockburst prediction index features. Front. Earth Sci. 12:1459879. doi: 10.3389/feart.2024.1459879
Received: 05 July 2024; Accepted: 19 August 2024;
Published: 29 August 2024.
Edited by:
Faming Huang, Nanchang University, ChinaReviewed by:
Hao Jian, Shandong University of Science and Technology, ChinaWenquan Zhang, Shandong University of Science and Technology, China
Copyright © 2024 Zhang, Zhang, Li, Li, Xue, Yin, Chen and Han. This is an open-access article distributed under the terms of the Creative Commons Attribution License (CC BY). The use, distribution or reproduction in other forums is permitted, provided the original author(s) and the copyright owner(s) are credited and that the original publication in this journal is cited, in accordance with accepted academic practice. No use, distribution or reproduction is permitted which does not comply with these terms.
*Correspondence: Haikuan Zhang, ODIwODE4NDE0QHFxLmNvbQ==; Haitao Li, bGloYWl0YW9AbWFpbC5jY3JpLmNjdGVnLmNu