- 1College of Water Conservancy and Hydropower, Hohai University, Nanjing, China
- 2Nanjing Hydraulic Research Institute, Nanjing, China
- 3Operation and Maintenance Center of Shandong Water Diversion Project, Jinan, China
- 4Zhong Nan Engineering Corporation Limited, Changsha, China
Deformation memory effect (DME) is a common property of the rock. A method called Deformation Rate Analysis (DRA) which is based on DME provides a brand-new approach to measuring in situ stress. When rock DME is applied in engineering, it is necessary to solve the problem that which stress peak is corresponding to in situ stress. The standard square samples made of sandstone and granite were selected to investigate the rock DME under different stress paths. Then a memory theoretical model based on multi-surface sliding friction hysteresis is used to analyze the mechanisms of rock DME. The results show that: (1) Rocks always remember the maximum peak stress from preloading, regardless of the sequence of multiple preloading; (2) Multi-memory exists in tests because we found another inflection in DRA curve; (3) The memory model based on sliding friction hysteresis shows the precision of memory information formation increases as the historical maximum peak value gets closer to the measurement load, but multi-memory does not exist in theoretical analysis. The conclusion provides the rule of rock DME under different stress path which would benefits in in situ stress reconstruction.
1 Introduction
The Rock Deformation Memory Effect (DME) represents a pivotal aspect of the broader spectrum of rock memory phenomena, encapsulating the capability to retrieve stress or temperature memory information via the analysis of rock deformation data. This effect has been extensively validated across numerous studies (Yamshchikov et al., 1994; Kyamamoto et al., 1990; Vinnikov and Shkuratnik; Reed and Mcdowell, 1994). For instance, employing indoor uniaxial compression tests, the initial stress exerted on a rock sample can be discerned through analyzing strain data derived from two consecutive compressions (Yamamoto, 2009). Such a mechanism underscores the critical role of in situ stress information in understanding the failure mechanisms of underground rock engineering projects. In light of this, the Deformation Rate Analysis (DRA) Method, introduced by Yamamoto (Kyamamoto et al., 1990; Yamamoto, 2009), emerges as a contemporary, systematic approach formulated to ascertain the initial in situ stress levels by conducting indoor loading tests on core samples. Its adoption spans a diverse array of countries and regions, including Japan, the United States, Canada, Australia, Taiwan, and Finland, thereby underscoring its significant potential and the promising prospects it holds for the field (Wang et al., 2018).
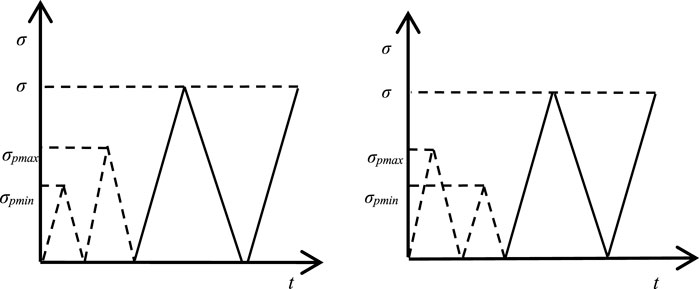
Despite the advancements in the applications of the DRA method, several challenges persist that warrant further investigation. A critical issue among these is the method’s capacity to precisely discern prior stress levels under varied stress paths and loading histories. A key question that remains unresolved pertains to whether the memory information decoded by the DRA method corresponds to the historical maximum peak stress or to the most recent maximum stress. This query is exemplified in Figure 1, which illustrates two distinct scenarios of loading sequences: (a) where the peak stress during the initial loading is lower than that of the subsequent loading; and (b) where the peak stress of the initial loading exceeds the peak stress of the later loading?
The conundrum lies in determining which stress peak will be identified by the DRA curve under these divergent stress paths. Specifically, it raises questions about the potential for larger stresses to obscure the memory of smaller stresses or for more recent stresses to overshadow the memory of original stresses. Furthermore, it remains to be established whether the DRA method is capable of retaining memory of both stress peaks simultaneously. Addressing these inquiries is imperative for enhancing the precision and reliability of the DRA method in capturing and interpreting the complex memory signatures inherent in rock deformation under diverse loading conditions.
Addressing the aforementioned issues, a series of pertinent studies have been conducted by various researchers. Holmes (2004) applied the DRA methodology to gauge in situ stresses, identifying two distinct inflection points on the axial DRA curve. He posited that the DME possesses multi-period memory capabilities, enabling it to retain information about different stress peaks. Similarly, Utagawa et al. (1997) employed Kamechi sandstone in their experiments and observed two inflection points as well, interpreted as corresponding to the axial and lateral stresses of prior loadings. Dight, (2006) reported three types of inflection points in his experiments, akin to Holmes’ findings, suggesting that different inflections on the DRA curve represent maximum stress information from various periods, thereby affirming the multi-period memory characteristics of DME. Although the aforementioned researchers observed the phenomenon of multi-memory effects in their experiments, they did not conduct any specific studies on this phenomenon.
In Yamamoto et al. (1995) study on in situ stress measurement, experimental results indicated that significant stresses applied in a laboratory setting do not obliterate the memory information. This observation was corroborated by Yabe et al. (2010), illustrating that in certain instances, the initial stress remains measurable. However, Wang (2012) through theoretical analysis, identified a “covering” phenomenon associated with internal fractures, a finding that was also noted in additional studies by Yamamoto. (2009), thus highlighting discrepancies in the conclusions of the same researcher. Fujii et al. (2018) explored in situ stress measurement via the tangent modulus method, focusing on the stress concentration path, they discovered that while the memory of concentrated stress was lost, the creep stress remained detectable. These researchers observed the phenomenon of stress overprinting in their researches. However, they did not reach a consensus on whether the initial stress would be overridden by subsequent stress and did not conduct an in-depth investigation into this issue.
In summary, extensive empirical and theoretical investigations have been undertaken to explore the memory effect of rocks under varied stress paths, a foundational issue in the study of DME. To address this challenge how stress is remembered under different stress path, experiments have been designed across five different stress paths involving various rock types and stress levels, accompanied by numerical analyses grounded in a theoretical memory model. The synthesis of experimental and theoretical insights has elucidated the behavior of rock DME across different stress paths, providing crucial empirical support for the identification of DME memory information and the preliminary measurement of in situ stresses.
2 Experimental work
2.1 DRA method
Within the graphical representation in Figure 2A, dotted lines delineate the external stresses (σp) responsible for instilling memory information, whereas the solid lines depict the process of successively repeating cyclic loading within a laboratory setting to acquire necessary stress and strain data for the retrieval of said memory information. This process is referred to as “measurement loading” (σm). Initially, a strain differential function is delineated as follows.
Wherein εi(σ) and εj(σ) indicate axial strains in the ith and jth loading, respectively, and σ are corresponding axial stresses. Positive values are taken for both strains and stresses in compression.
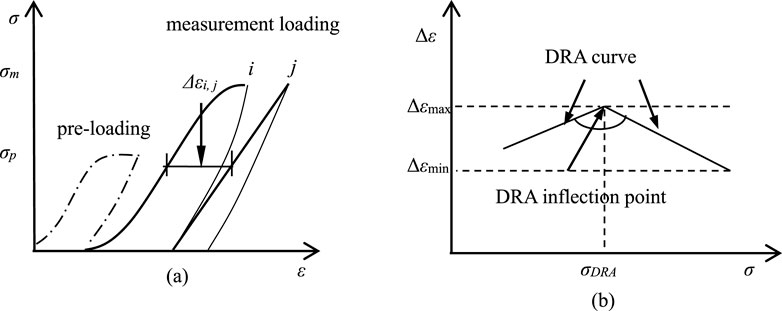
Figure 2. Definition of Deformation Rate Analysis (A) definition of strain differential Δεi, j; (B) DRA curve.
In this context, Equation 1 facilitates the exclusion of reversible strain components from the axial strain profiles elicited by two consecutive compressions, yielding a differential value δε that epitomizes the axial irreversible strain. As depicted in Figure 2B, plotting the stress σ against the strain differential δε generates a strain differential curve, also known as the dra curve. Notably, an inflection point becomes apparent on this curve, the stress at this inflection point (σdra) signifies the stored memory information (σp), providing a quantitative basis for interpreting the deformation history of the material. The dra method can be used for direct ground stress measurement and indoor research on rock deformation memory effect.
2.2 Samples and experimental equipment
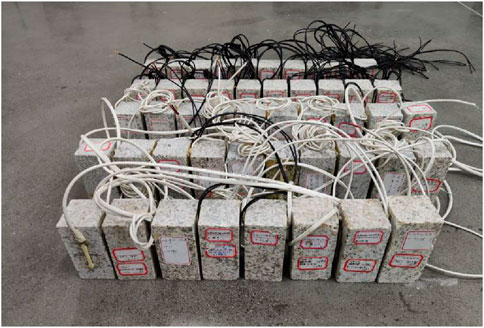
The granite and sandstone tested in this article were quarried from a quarry in Cangzhou City, Hebei Province, and were buried about 10 m underground, which is a shallow area. Sandstones and granites were selected for experimental materials and made into standard cuboid samples of 50 × 50 × 100 mm in size. As recommended by ISRM, the maximum non-parallelism between both ends of a rock sample should be controlled within 0.02 mm, and both end surfaces should be parallel and smooth. The completed samples are shown in Figure 3.
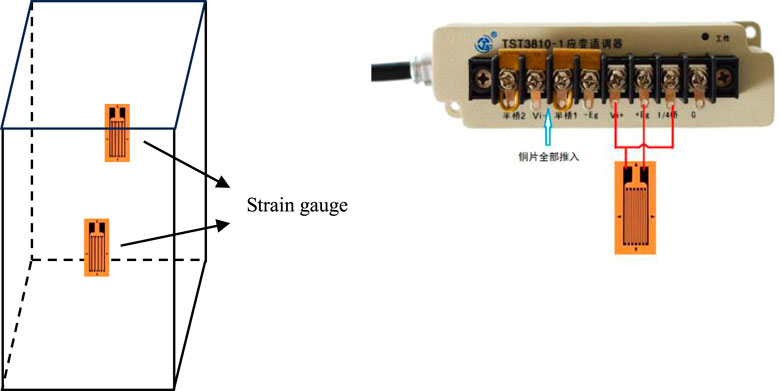
The strain was measured by strain gauges attached on two sides of samples in vertical direction as shown in Figure 4. In the physical experiments of this article, strain was measured using strain gauges, as shown in Figure 4. The cuboid specimen was pasted on two opposite sides. Before pasting, cross-hatch lines were drawn on the side of the sample to ensure accurate pasting position. The resistance of the strain gauge is 120 Ω, and the allowable deviation is ±0.1 Ω. The strains are all connected to the strain adaptor in the form of a 1/4 bridge (a three-wire working piece), as shown in Figure 4, which is suitable for measuring simple tensile and compression strains in harsher environments.
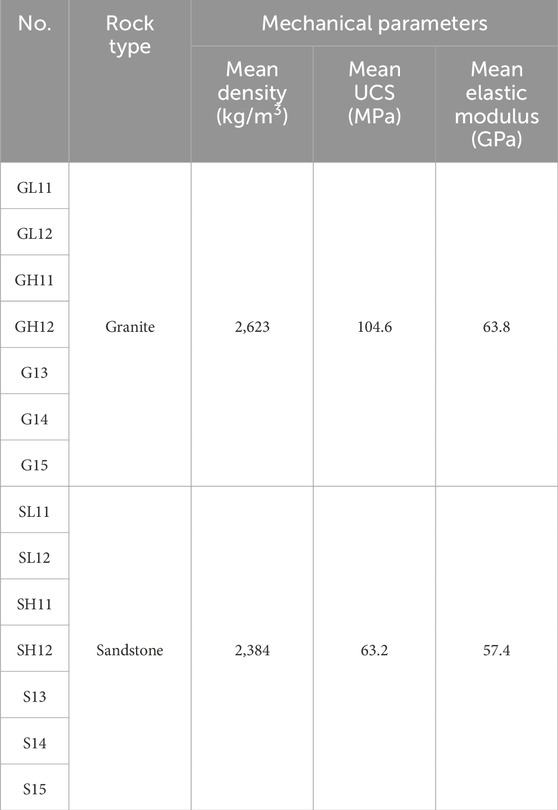
Each sample was numbered separately in the form, the naming rule for samples is Rock type + Stress level + Stress path (the number of samples of this type). For example, sample GL11 means granite sample were test by stress path 1-1 in low stress level. In order to facilitate the discussion and analysis of the test, we chose three samples of sandstone and granite for obtaining mechanical parameters, the failure tests were carried out after the DME tests to measure the mechanical parameters of each sample, including density, UCS and elastic modulus as shown in the Table 1.
The tests were conducted under the load control scheme by SUNS-650 W electro-hydraulic servo loading system shown in Figure 5. The maximum load may reach 600 kN, and the displacement control ranges from 0 to 200 mm. Strain data was collected by the TST Strain collector. The collector has 16 channels and the frequency of acquisition is 1000 Hz. The error of the collected strain is ±1 micro strain. Experimental equipment is shown in Figure 5.
2.3 Test scheme
In order to investigate how the different stress path influences the rock DME, six different stress paths were set as shown in Figure 6. In Figure 6, σp1∼ σp3 are preloading values, 1, 2, and 3 represent the order of loading, σm is a measuring loading value. Besides, two kinds of stress levels were also considered to investigate whether the rock DME changes with stress levels. The detailed loading parameters and environmental parameters are listed in Table 2.
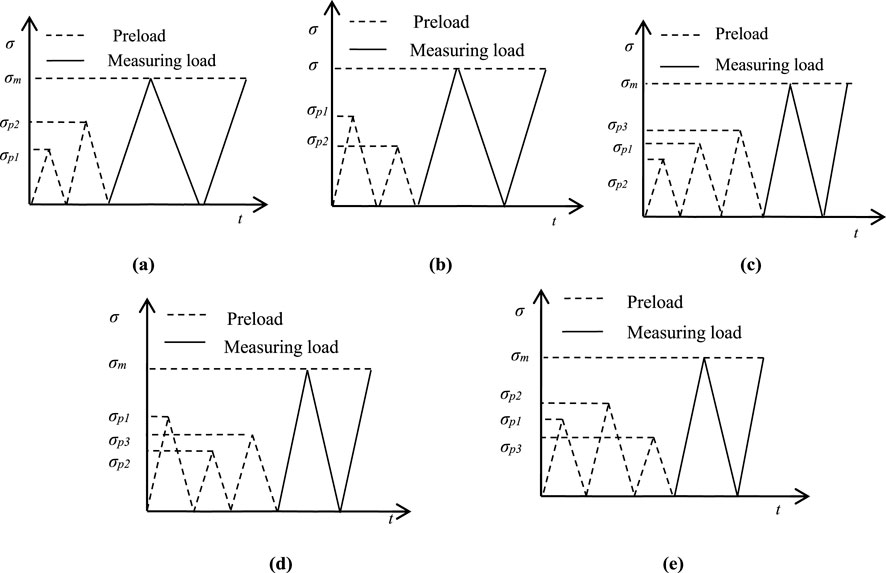
Figure 6. Loading regime (A) Stress path 1–1; (B) Stress path 1–2; (C) Stress path 1–3; (D) Stress path 1–4; (E) Stress path 1–5.
2.4 Test result and analysis
2.4.1 Different rock type and stress level
Figure 7 presents the DRA curves derived from uniaxial compression tests on granite and sandstone specimens, following stress paths 1-1 and 1-2. These curves exhibit at least one pronounced inflection point, as indicated by the arrows, signifying a notable change in slope.
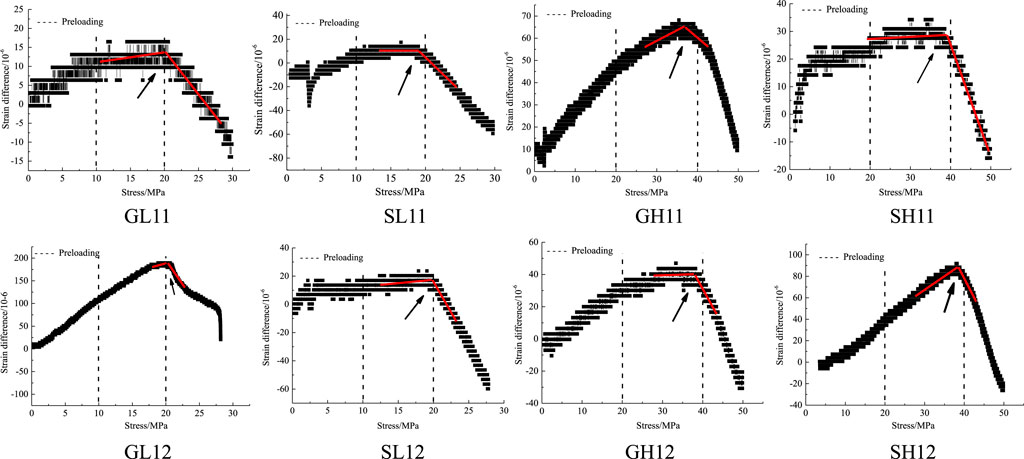
Figure 7. Typical DRA curves of granite and sandstone under different stress levels under single stress path.
The DRA curves reveal that, for granite samples GL11 and GL12, the inflection points correspond to stress levels approximately equivalent to 20 MPa. This observation suggests that both samples retained identical stress memories despite undergoing distinct stress pathways. It is evident that the stress memory encoded by these samples pertains to the higher preloads encountered in their respective stress paths, rather than preloads proximal to the measurement loads. A similar pattern is discerned in the DRA curves for sandstone samples SL11 and SL12, where the inflection points also align with stress levels around 20 MPa.
Furthermore, when examining samples subjected to higher initial stress levels, such as GH11 and GH12, which received preloads twice that applied to GL11 and GL12, it is observed that these samples memorialized the higher preload of approximately 40 MPa, as opposed to the lower preload closer to their DRA curve’s measurement point. Analogously, the DRA curves of sandstone samples SH11 and SH12 corroborate this trend, demonstrating a consistent inclination towards retaining the memory of the more substantial stress when subjected to higher stress levels.
This uniformity in stress memory retention across both granite and sandstone samples, regardless of the specific stress path experienced, underscores a fundamental aspect of rock behavior. It implies a robust mechanism by which rocks preserve memory of the maximal stress encountered, reflecting an intrinsic property of the material’s response to varying stress environments.
2.4.2 Single and multiple stress path
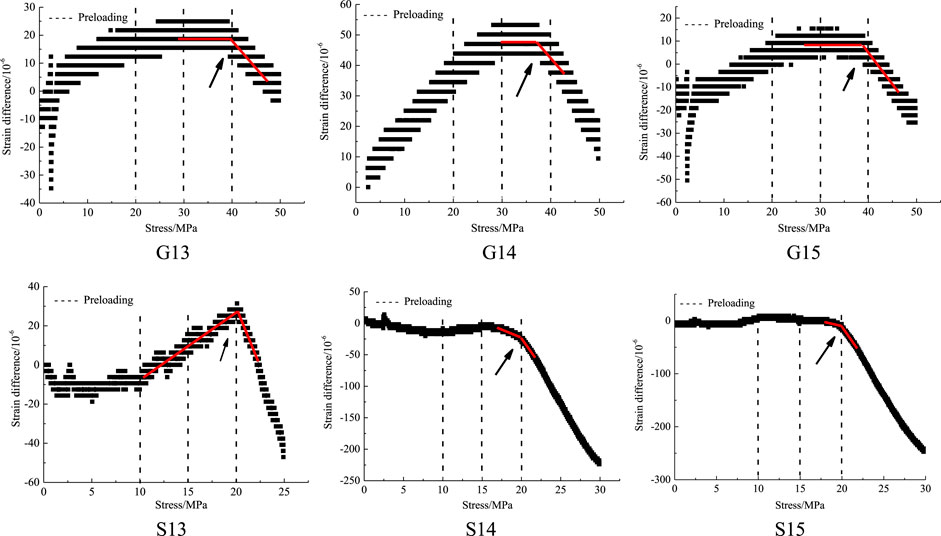
Figure 8 delineates the DRA curves acquired from uniaxial compression tests on granite and sandstone specimens subjected to multiple stress paths 1-3, 1-4, and 1-5. Consistent with observations from simpler stress paths 1-1 and 1-2, each of the DRA curves exhibited at least one pronounced inflection point, as highlighted by arrows, affirming a fundamental characteristic of the DRA curve framework.
The curves are marked by three vertical dashed lines, indicative of the sequence of preloads applied in varying orders. Notably, the inflection points on all DRA curves align closely with the rightmost dashed lines, signifying that irrespective of the sequence of stress paths experienced, both granite and sandstone specimens consistently recorded the maximum stress encountered. This observation is further exemplified by the comparison between samples GL11 and GL12 (illustrated in Figure 7) and samples G13, G14, and G15, which, despite undergoing an additional preload in a non-sequential manner and being subjected to the identical measuring stress, all manifested inflection points at stresses approximately 40 MPa, correlating with the highest preload applied in these tests. A parallel trend was observed in the sandstone samples, which uniformly registered a memory of approximately 20 MPa stress, reflective of the maximal preload, despite traversing five distinct stress paths.
This phenomenon elucidates a critical aspect of rock behavior under stress: regardless of the complexity or number of stress paths experienced, rock specimens invariably encode the maximal stress encountered within their deformation history. This consistent pattern underscores the intrinsic capacity of rocks to memorize the peak stress levels experienced, a feature that is paramount to understanding the deformational and memory characteristics of geological materials.
2.4.3 Multi-memory in tests
Figure 7 demonstrates that the strain difference curves of samples GL11, SL11, and GH12 exhibit two distinct inflection points at stress levels of 10 MPa and 20 MPa, respectively. Concurrently, Figure 8 reveals the presence of two inflection points at stress levels of 30 MPa and 40 MPa in the strain difference curve of sample G14, while the curve of sample G15 is characterized by three inflection points at stress levels of 20 MPa, 30 MPa, and 40 MPa. These inflection points correspond closely to the stresses applied as preloads to each sample, suggesting that certain samples retain memory of not just a single stress level, but multiple stress levels experienced along various stress paths. It is important to highlight, however, that this capacity for retaining multiple stress memories is not universally observed across all samples. While some specimens demonstrate the ability to encode memories of several preceding stress levels, others appear to retain only the memory of the highest stress level encountered. This phenomenon exists in samples of two different rock samples, however the rules of mult-memory under different rock type are not clear from completed experiments.
This variation in memory retention capacity among different rock samples underscores the complexity of the deformation memory effect, suggesting that the underlying mechanisms of stress memory in rocks may be influenced by a variety of factors beyond the mere magnitude of stress applied.
3 Theoretical analysis
3.1 Friction sliding model of multiple microstructure surfaces
The macro-mechanical behaviors of rock are known to be determined by the combined mechanical behaviors of the rock matrix and its microstructures (Wang et al., 2019; Yu et al., 2023; Salganik, 1973; Salganik, 1982). Consequently, the DME in rocks is also a result of the mechanical behaviors of microstructures influencing DME. Moreover, the microstructural mechanical behaviors of rock are intricately linked with the rock’s deformation and damage processes, which, in the context of uniaxial compression, include five phases: crack closure, elasticity, crack generation and propagation, unstable crack propagation, and a post-damage or post-peak softening phase (Shuyang et al., 2023; Wawersik and Fairhurst, 1970; Hudson et al., 1997; Haijun et al., 2022; Wang et al., 2022). It has been established that models based solely on crack propagation may fall short in explaining the emergence of rock DME within low-stress zones. Instead, the genesis of rock DME is attributed to frictional sliding on microstructural surfaces (Wang, 2012; Basista and Gross, 1998; Wang et al., 2012; Wang et al., 2014). To model this phenomenon, a basic memory element of the unit-volume rock containing a single microstructural surface combines an elastic component (Cai, 2002) (Hookean body), a viscous component (Newtonian body), and a Y body, facilitating the simulation of frictional sliding on microstructural surfaces.
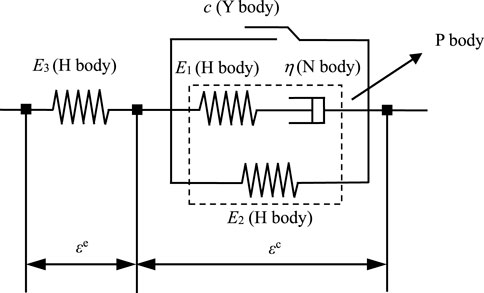
This basic memory element shown in Figure 9 is depicted as comprising two parts: the first, a Hookean body characterizes the elastic matrix surrounding the microstructural surface. The second part consists of a Poynting-Thomson body formed by an H body and an N body in series connected with an H body in parallel (called P body) and a Y body connected in parallel, symbolizes the contributions of microcrack and particle contact surface mechanics to rock deformation.
The H body constitutive equation is consistent with the Hooke’s law. As for the Y body, when the stress applied on a component reaches a cohesion limit, the stress keeps unchanged while the strain keeps growing. The stress limit in the basic element is the cohesion c. As for the N body, the stress is in direct proportion to strain. Constitutive equations of all basic element bodies are given as Equations 2–5:
H body:
Y body:
N body:
P body:
Wherein, E is an elasticity modulus, σs is a stress limit, η is a viscous parameter, and t is time.
The theoretical model of basic memory elements is formed by combining the above basic components, with mechanic behaviors of each component remaining consistent with Equations 2–5. As the left H body is connected with the right “B||Y” body in series, if setting the applied stress to σ, the component and the body are subject to the same stress, and the strain ε equals to a sum of strain on both components, as for the “P||Y” body, two components are connected with each other in parallel, and the stress σc of the body equals to a sum of stresses on the two components as:
Wherein σe and εe represent, the stress and strain of the elastic matrix, respectively; σc and εc represent the stress and strain of the “P||Y” body, respectively; σY and εY represent the stress and strain of the Y body, σP and εP represent the stress and strain of the P body.
The Poynting-Thomson body is formed by an H body and an N body in series connected with an H body in parallel:
Wherein, σN and εN are the stress and strain of the N body, respectively, σH1 and εH1 represents the stress and strain of the H body E1, σH2 and εH2 represents the stress and strain of the H body E1.
The Y body has two conditions, stationary and sliding, which should be determined upon a comparison of its stress to its cohesion. When the stress surpasses the cohesion, the “P||Y” body starts sliding, and the stress of Y body remains unchanged, which always equals to the cohesion. When the stress is less than the cohesion, the Y body stops sliding and stays stationary, and the entire “P||Y” body is “locked” by the Y body, which is:
Wherein, ε0c is the initial strain of the “P||Y” body. At this point, the H body E1 and the H body E2 cannot recover from deformation, allowing for storing the elastic potential energy.
Therefore, the differential equation of a basic element model can be given as:
The rock sample contains a large quantity of randomly distributed microstructure surfaces. Based on basic elements herein, a theoretical model is built for multiple contact surfaces containing n basic elements, each of which is connected with another in series so as to simulate the rock sample (without counting in mutual influences between contact surfaces of the rock interior):
Wherein, n is a serial number of the contact surface, σ is a total stress of the theoretical model, σn is a stress of the contact surface n, ε is a total strain of the theoretical model, and εn is a strain of the contact surface.
In combination with external loading conditions, the stress–strain relation of an axial symmetrical model of multiple contact surfaces may be calculated by Equations 6–10. In turn, the DRA curves may be obtained.
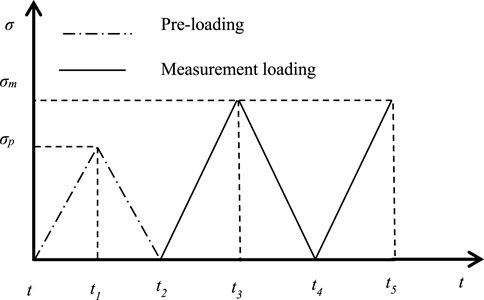
The most basic loading scheme, as shown in Figure 10.
According to the Equations 6–10 and Basic loading regime, the N body strain and strain rate can be obtained as the Equations 11–13:
Wherein:
B is the time point during each loading when a Y body reaches a threshold c, and r is the loading rate.
3.2 Calculation parameters of theoretical model
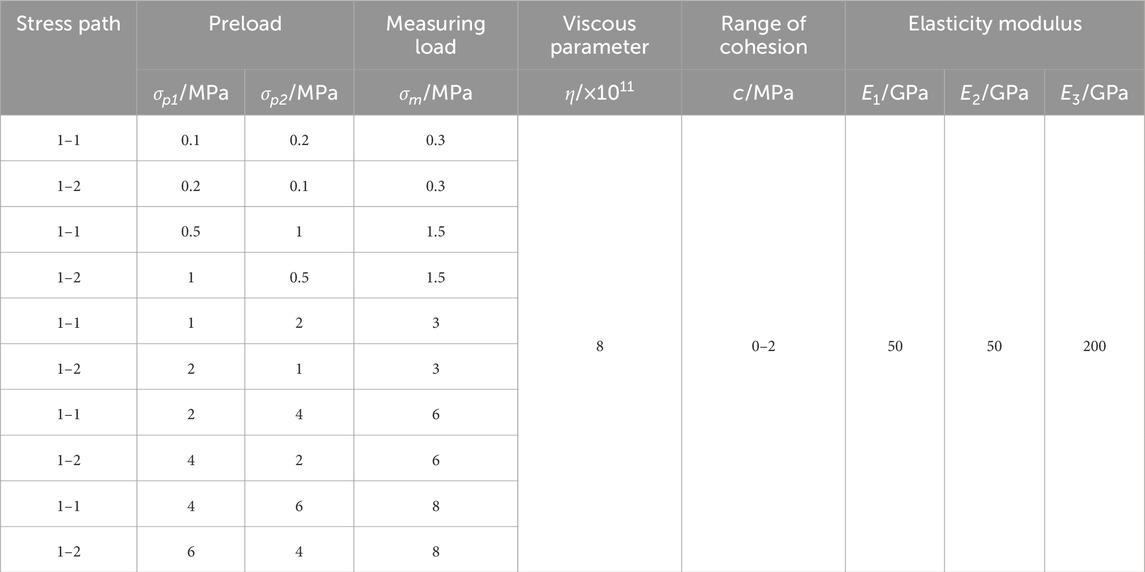
The loading scheme of the theoretical calculation adopts the 1-1 and 1-2 loading paths in the physical test loading scheme in Figure 6, and sets 5 groups of different stress levels to explore the variation law of the peak value under different stress levels. 500 basic elements in series are selected to do the theoretical model calculation (n = 500). The specific theoretical calculation loading scheme and theoretical model parameters are shown in Table 3, the parameters of the theoretical models of the 5 groups are set to the same, and the cohesion is evenly distributed in 500 units.
3.3 Calculation results of theoretical model
3.3.1 Stress-strain curve
Figure 11 presents the stress-strain curves of a theoretical model under five different stress levels. These curves align perfectly with the 1-1 and 1-2 loading paths across all stress levels, indicating the model’s applicability to uniaxial compression tests on rock.
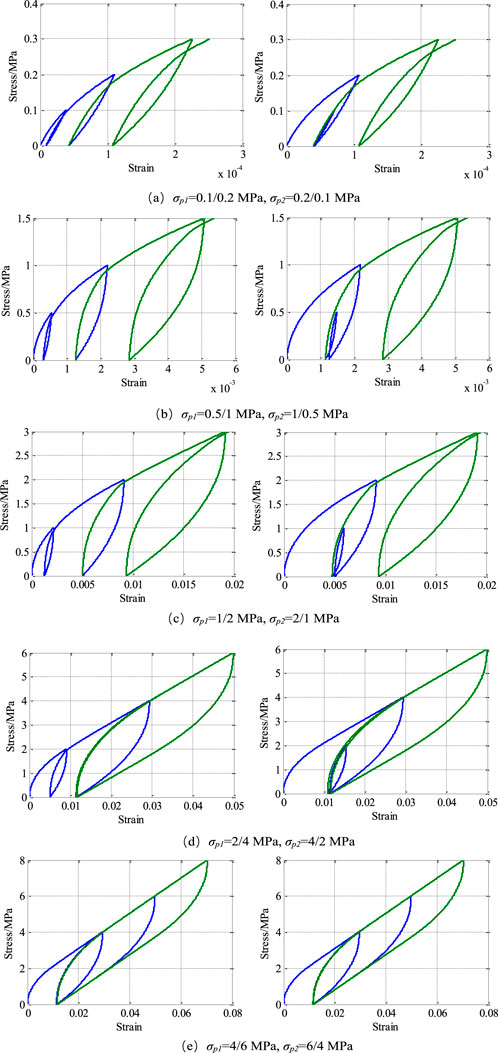
Figure 11. Stress-strain curve of theoretical model. (A) σp1 = 0.1/0.2 MPa, σp2 = 0.2/0.1 MPa, (B) σp1 = 0.5/1 MPa, σp2 = 1/0.5 MPa, (C) σp1 = 1/2 MPa, σp2 = 2/1 MPa, (D) σp1 = 2/4 MPa, σp2 = 4/2 MPa, (E) σp1 = 4/6 MPa, σp2 = 6/4 MPa.
In Figures 11A–C, as the stress level increases, the hysteresis loops from both pre-loading-unloading and measurement loading-unloading cycles first expand and then contract. This phenomenon likely occurs because at lower stress levels, the model exhibits minimal nonlinear deformation and energy dissipation. With increasing stress, these factors become more pronounced, resulting in expanded hysteresis loops. At higher stress levels (as shown in Figures 11D, E, the initial loading completes most of the nonlinear deformation and energy dissipation, causing subsequent loading-unloading curves to overlap with the initial ones, and thus the hysteresis loops contract.
3.3.2 DRA curve
Figure 12 presents the DRA curves of the theoretical model under five different stress levels. The left side shows the 1-1 loading path, while the right side shows the 1-2 loading path. It is evident that all five DRA curves exhibit inflection points near the initial loading (σp1 or σp2).
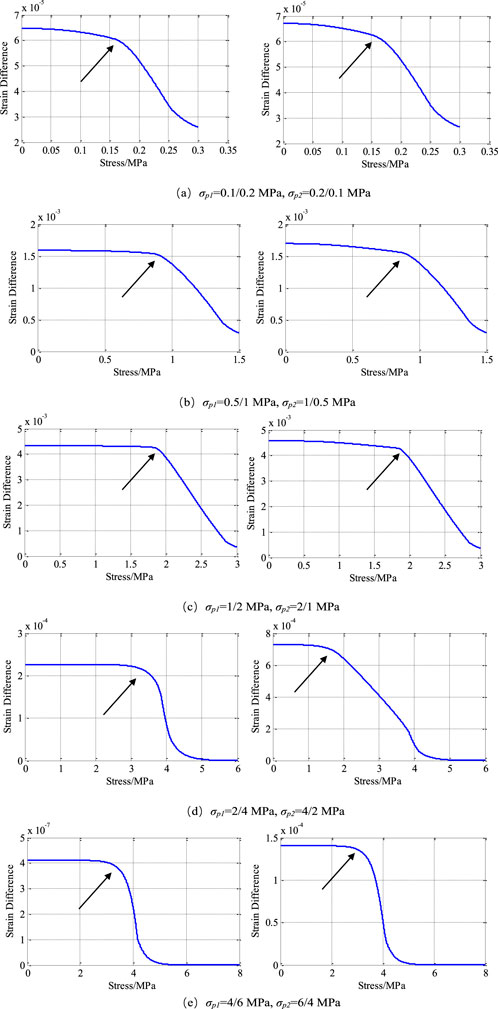
Figure 12. DRA curve of theoretical model. (A) σp1 = 0.1/0.2 MPa, σp2 = 0.2/0.1 MPa, (B) σp1 = 0.5/1 MPa, σp2 = 1/0.5 MPa, (C) σp1 = 1/2 MPa, σp2 = 2/1 MPa, (D) σp1 = 2/4 MPa, σp2 = 4/2 MPa, (E) σp1 = 4/6 MPa, σp2 = 6/4 MPa.
In Figure 12A, the inflection point of the DRA curve for the 1-1 loading path appears at 0.165 MPa, whereas for the 1-2 loading path, it is at 0.161 MPa. Both loading paths have a preloading stress of approximately 0.2 MPa, with memory information formation accuracies of 82.5% and 80.5%, respectively. In Figure 12B, the inflection points for the DRA curves under the 1-1 and 1-2 loading paths are located at 0.876 MPa and 0.869 MPa, respectively, both identifying a preloading stress of 1 MPa. The memory information formation accuracies are 87.6% and 86.9%. In Figure 12C, the inflection points of the DRA curves under the 1-1 and 1-2 loading paths occur at 1.833 MPa and 1.821 MPa, both closely matching the preloading stress of 2 MPa. The memory information formation accuracies are 91.65% and 91.05%, respectively.
In Figure 12D, the inflection points of the DRA curves for the 1-1 and 1-2 loading paths are at 3.733 MPa and 1.624 MPa, corresponding to preloading stresses of 4 MPa and 2 MPa, respectively. In Figure 12E, the inflection points of the DRA curves under the 1-1 and 1-2 loading paths are identified at 3.56 MPa and 3.25 MPa, respectively, corresponding to a preloading stress of 4 MPa. Notably, in Figures 12D, E, when the stress exceeds 4 MPa, the strain differences of all DRA curves tend to zero. Since the sliding of plastic elements in the theoretical model is the cause of memory formation, and 4 MPa is twice the maximum cohesion of the element, it can be inferred that the maximum preloading stress measured by the model is twice the maximum cohesion. Therefore, the results in Figures 12D, E cannot be used as references for different peak stress paths.
In summary, the theoretical models in Figures 12A–C all retained the larger preloading stress at different stress levels, but the accuracy of memory information varied. These results indicate that the memory information formation accuracy for the 1-1 stress path is higher than that for the 1-2 stress path. Additionally, as the stress level increases, the memory information formation accuracy for both paths gradually improves.
3.4 Comparison between results from theoretical model calculation and physical tests
3.4.1 Comparison of different stress path
Experimental results show that both granite and sandstone exhibit consistent behavior under varying stress levels: regardless of whether the preloading occurs twice or multiple times (three times in this study), the rock specimens always remember the maximum stress encountered during preloading. The sequence of loading does not influence the memory of the maximum stress. Similarly, theoretical model analyses demonstrate the same pattern. Under different stress levels, the theoretical memory model also retains only the maximum stress from two preloading. Regarding the precision of memory formation, theoretical model calculations indicate that the sequence of preloading affects the accuracy of the memory. The closer a larger preloading is to the measurement loading, the greater the precision of the memory information formation.
3.4.2 Discuss of multi-memory
The characteristics of the DRA curves under multi-memory phases in this study are similar to those observed in previous research, as shown in Figure 13. Holmes (Holmes, 2004), while using the DRA method to measure in situ stress, found two inflection points on the axial DRA curve, indicated by arrows in Figure 13A. Utagawa et al. (1997), using Kamechi sandstone as their experimental material, attributed the DRA inflection points to different stress memory information, as depicted in Figure 13B. Similarly, Dight, (2006) observed three distinct inflection points on the DRA curve in his DRA experiments, as illustrated in Figure 13C.
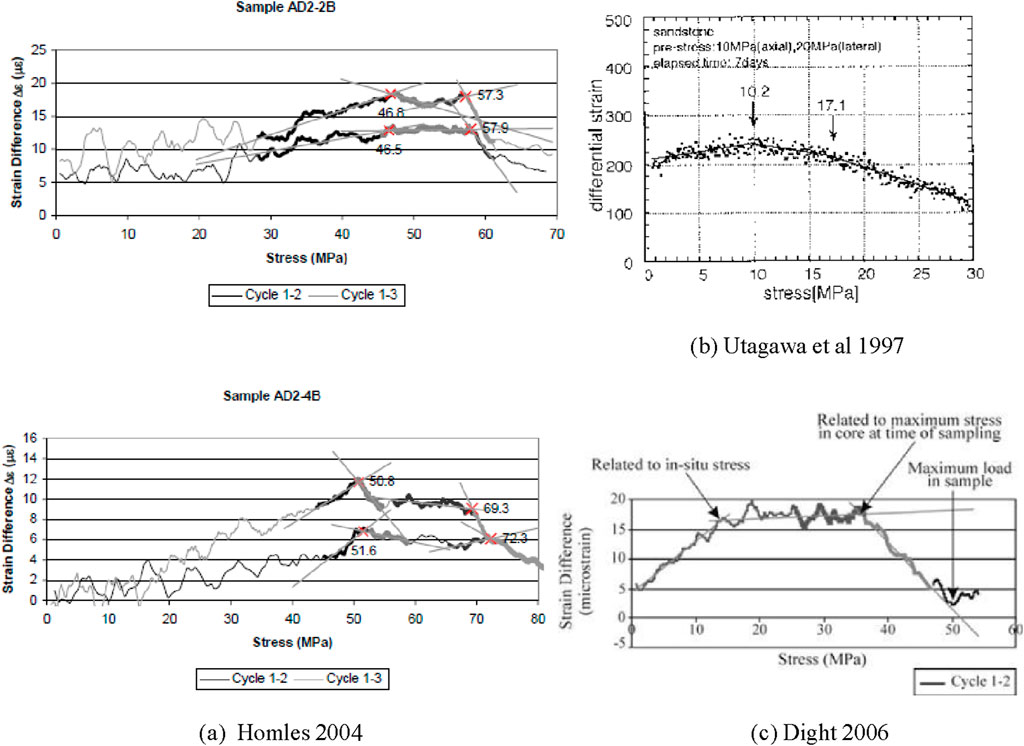
Figure 13. Other researchers’ DRA curves with multi-memory. (A) Homles 2006, (B) Utagawa et al 1997, (C) Dight 2006.
However, previous studies (Holmes, 2004; Utagawa et al., 1997; Dight, 2006) have not analyzed the formation conditions of multi-memory phases. Our experiments indicate that a significant characteristic of these multi-memory phases under different stress paths is the frequency of their occurrence. Specifically, multi-memory phases occur more frequently during preloading with low initial stress compared to preloading with high initial stress. In other words, high stress applied at a later stage does not override the effects of low stress applied at an earlier stage, while high stress at an earlier stage is likely to override low stress at a later stage. This suggests that different stress paths influence the formation of rock Deformation Memory Effect (DME) multiple phases. It is important to note that the influence of stress paths on the occurrence of multi-memory phases is probabilistic. Not all stress paths with higher initial stress will result in the formation of DME multiple memories. Furthermore, different stress paths alone are not sufficient conditions for the generation of multiple memories. Additionally, theoretical memory model calculations in this study did not exhibit the phenomenon of multiple memories, indicating that this memory model cannot fully explain the occurrence of multiple phases in rocks. Therefore, the mechanism underlying rock multiple memories requires more systematic and in-depth research.
4 Conclusion
This study conducted uniaxial artificial DRA tests on granite and sandstone under different stress levels and performed theoretical model calculations based on the sliding friction mechanism to analyse the changes in rock DME under different stress peak values. The conclusions and recommendations are as follows.
(1) Experimental and Theoretical Model Findings: Both physical experiments and theoretical models indicate that the DRA curve of rocks under different stress peak paths shows distinct inflection points near the maximum stress peak encountered during preloading. This suggests that rocks always remember the maximum stress peak from preloading, regardless of the sequence of multiple preloading. This result is consistent across different rock types and stress levels.
(2) Multi-memory in Physical Experiments: Physical experiments reveal that rocks exhibit multi-memory under different stress peak paths. However, the occurrence of multi-memory in the experiments is not inevitable. It is hypothesized that when preloading with low initial stress cannot be overridden by subsequent higher stress loading, there is a certain probability that the DRA curve will simultaneously remember both the low and high stress peaks, leading to multi-memory.
(3) Theoretical Model Based on Sliding Friction Mechanism: The theoretical model shows that the precision of memory information formation on the DRA curve inflection points varies systematically with different stress peak paths. The precision of memory information formation increases as the historical maximum peak value gets closer to the measurement load. However, the theoretical model does not exhibit multi-memory under different stress peak paths, indicating that a more systematic and in-depth study is needed to understand the mechanism and theory of rock multi-memory.
Data availability statement
The original contributions presented in the study are included in the article/supplementary material, further inquiries can be directed to the corresponding authors.
Author contributions
LZ: Data curation, Formal Analysis, Investigation, Software, Writing–original draft, Writing–review and editing. XR: Funding acquisition, Writing–review and editing, Supervision, Visualization. HW: Methodology, Writing–review and editing. GZ: Data curation, Writing–review and editing. YL: Data curation, Writing–review and editing. JZ: Data curation, Writing–review and editing.
Funding
The author(s) declare that financial support was received for the research, authorship, and/or publication of this article. This research was financially supported by the Major Science and Technology Project of Yunnan Province (Grant No. 202102AF080001); the Fundamental Research Funds for the Central Universities (Grant No. B220204001); the China Scholarship Council, Grant/Award Number: 201906710161.
Conflict of interest
Author JZ was employed by Zhong Nan Engineering Corporation Limited.
The remaining authors declare that the research was conducted in the absence of any commercial or financial relationships that could be construed as a potential conflict of interest.
Publisher’s note
All claims expressed in this article are solely those of the authors and do not necessarily represent those of their affiliated organizations, or those of the publisher, the editors and the reviewers. Any product that may be evaluated in this article, or claim that may be made by its manufacturer, is not guaranteed or endorsed by the publisher.
References
Basista, M., and Gross, D. (1998) The sliding crack model of brittle deformation: an internal variable approach. Int. J. Solids. Struct. 35(5–6): 487–509. doi:10.1016/s0020-7683(97)00031-0
Fujii, Y., Makasi, M., Kodama, J., Fukuda, D., Goto, K., Kumakura, S., et al. (2018). Tangent modulus method – an original method to measure in-situ rock stress. Tunn. Undergr. Space Technol. 82, 148–155. doi:10.1016/j.tust.2018.08.005
Haijun, W., Hanzhang, Li, Lei, T., Jianchun, Li, and Ren, X. (2022). Fracturing behavior of brittle solids containing 3D internal crack of different depths under ultrasonic fracturing. Int. J. Min. Sci. Technol. 32 (6), 1245–1257. doi:10.1016/j.ijmst.2022.09.008
Holmes, C. (2004). Deformation rate analysis and “stress memory” effect in rock. Perth: The University of Western Australia.
Hudson, J., Harrison, J., and Popescu, M. (1997). Engineering rock mechanics: an introduction to the principles. Appl. Mech. Rev., 55(2):B30, doi:10.1115/1.1451165
Kyamamoto, I., Kuwahara, Y., Kato, N., and Hirasawa, T. (1990). Deformation rate analysis: a new method for in situ stress estimation from inelastic deformation of rock samples under uni-axial compression. Sci. Rep. Tohoku Univ. Fifth 33 (2), 34.
Reed, L. D., and Mcdowell, G. M. (1994). A fracto-emission memory effect and subharmonic vibrations in rock samples stressed at sonic frequencies. Rock Mech. Rock Eng. 27 (4), 253–261. doi:10.1007/bf01020202
Salganik, R. L. (1982). Overall effects due to cracks and crack-like defects. Netherlands: Springer, 199–208.
Shuyang, Yu, Xuhua, R., Zhang, J., and Sun, Z. (2023). Numerical simulation on the excavation damage of Jinping deep tunnels based on the SPH method. Geomechanics Geophys. Geo-Energy Geo-Resources 9, 1. doi:10.1007/s40948-023-00545-z
Utagawa, M., Seto, M., and Katsuyama, K. (1997). Estimation of initial stress by deformation rate analysis (DRA). Int. J. Rock Mech. and Min. Sci. 34 (3-4), 501. doi:10.1016/s0148-9062(97)00249-0
Vinnikov, V. A., and Shkuratnik, V. L. Theoretical model for the thermal emission memory effect in rocks. J. Appl. Mech. and Tech. Phys.
Wang, H. (2012). Mechanism of rock deformation memory effect based on viscoelastic frictional sliding. Nanjing: Hohai university.
Wang, H., Dyskin, A., and Pasternak, E. (2019). Comparative analysis of mechanisms of 3-D brittle crack growth in compression. Eng. Fract. Mech. 220, 106656. doi:10.1016/j.engfracmech.2019.106656
Wang, H., Li, H., Tang, L., Ren, X., Meng, Q., and Zhu, C. (2022). Fracture of two three-dimensional parallel internal cracks in brittle solid under ultrasonic fracturing. J. Rock Mech. Geotechnical Eng. 14 (3), 757–769. doi:10.1016/j.jrmge.2021.11.002
Wang, H., Tang, L., Ren, X., Anyu, Y., and Yan, N. (2014). Mechanism of rock deformation memory effect in low stress region and its memory fading. Rock Soil Mech. (4), 1007–1014.
Wang, H., Tang, L., Ren, X., Lingwei, Z., Fuan, S., and Ariel, H. (2018). Rock deformation memory effect: applications, experiments and theories. Chin. J. Geotechnical Eng., 1–12.
Wang, H. J., Dyskin, A. V., Hsieh, A., and Dight, P. (2012). The mechanism of the deformation memory effect and the deformation rate analysis in layered rock in the low stress region. Comput. and Geotechnics 44, 83–92. doi:10.1016/j.compgeo.2012.03.006
Wawersik, W. R., and Fairhurst, C. (1970). A study of brittle rock fracture in laboratory compression experiments. Int. J. Rock Mech. and Min. Sci. and Geomechanics Abstr. 7 (5), 561–575. doi:10.1016/0148-9062(70)90007-0
Yabe, Y., Yamamoto, K., Sato, N., and Omura, K. (2010). Comparison of stress state around the Atera fault, central Japan, estimated using boring core samples and by improved hydraulic fracture tests. Earth, Planets Space 62 (3), 257–268. doi:10.5047/eps.2009.12.002
Yamamoto, K. (2009). A theory of rock core-based methods for in-situ stress measurement. Earth, Planets Space 61 (10), 1143–1161. doi:10.1186/bf03352966
Yamamoto, K., Yamamoto, H., Kato, N., and Hirasawa, T. (1995). Deformation rate analysis for in situ stress measurement. Clausthal-Zellerfeld: Trans Tech Publications.
Yamshchikov, V. S. S. V. L. L., Shkuratnik, V. L., and Lavrov, A. V. (1994). Memory effects in rocks (review). J. Min. Sci. 5 (30), 463–473. doi:10.1007/bf02047337
Keywords: deformation memory effect, deformation rate analysis, different stress path, multi-memory, friction sliding
Citation: Zhong L, Ren X, Wang H, Zhao G, Li Y and Zhu J (2024) Influence of the different stress paths on rock deformation memory effects using the deformation rate analysis method. Front. Earth Sci. 12:1459447. doi: 10.3389/feart.2024.1459447
Received: 04 July 2024; Accepted: 03 September 2024;
Published: 16 September 2024.
Edited by:
Bin Gong, Brunel University London, United KingdomReviewed by:
Dan Ma, China University of Mining and Technology, ChinaJun Yu, Nantong University, China
Yu Zhou, Shaoxing University, China
Copyright © 2024 Zhong, Ren, Wang, Zhao, Li and Zhu. This is an open-access article distributed under the terms of the Creative Commons Attribution License (CC BY). The use, distribution or reproduction in other forums is permitted, provided the original author(s) and the copyright owner(s) are credited and that the original publication in this journal is cited, in accordance with accepted academic practice. No use, distribution or reproduction is permitted which does not comply with these terms.
*Correspondence: Xuhua Ren, cmVueGhAaGh1LmVkdS5jbg==; Haijun Wang, aGp3YW5nQG5ocmkuY24=
 Lingwei Zhong
 Xuhua Ren1*