 Xiaowen Liu
 Yuwu Zhao2
- 1College of Earth Sciences, Northeast Petroleum University, Daqing, China
- 2NO.8 Oil Production Plant of Daqing Oilfield Limited Liability Company, Daqing, China
Terrestrial sedimentary basins are influenced by rapid changes in the clay content, resulting in significant differences in the lateral sealing capacity (shale gouge ratio, SGR) of different parts of the fault. In the present study, we used a method of setting virtual wells and using seismic inversion data to accurately calculate the SGR of faults in strata composed of interbedded sandstone and mudstone calculate the clay content of the strata and to compensate for the low level of the actual well control. Optimal well spacing was determined based on the variable clay content of the formation. The planar variation of the fault throw was characterized via seismic interpretation. We also examined the lateral sealing of faults. The Putaohua oil layer in the S14 area of the Sanzhao Sag in the Songliao Basin was chosen as an case study. Based on the calculation of fault SGR values and the oil distribution, the evaluation criteria for the fault sealing capacity were determined, and the changes in the lateral sealing capacity of the faults were analyzed. This approach accurately estimates fault SGR values and predicts the effective oil-bearing area within the fault zone. It is also suitable for evaluating the lateral sealing of faults in strata composed of interbedded sandstone and mudstone. Our findings provide an in-depth understanding of the lateral sealing of faults and can aid in further research on petroleum distribution patterns.
1 Introduction
Fault traps are common in sedimentary basins and are the main targets for increasing oil reserves and tapping the remaining oil potential. These traps have played an important role in oil and gas exploration (e.g., Aydin, 2000; Manzocchi et al., 2010; Liu et al., 2018; Zhao et al., 2018; Song et al., 2020; Song et al., 2024). The lateral sealing capacity of faults controls the degree of oil filling in fault traps. Therefore, the lateral sealing capacity of faults is important for evaluating the effectiveness of fault traps (Clarke et al., 2005; Reilly et al., 2016; Fisher et al., 2017; Fu et al., 2021). The shale gouge ratio (SGR) is an effective parameter for quantitatively evaluating the lateral sealing capacity of faults (Yielding et al., 1997; Freeman et al., 1998; Yielding, 2002; Pei et al., 2015; Song et al., 2022). This method is based on the principle of mudstone smearing. In stratigraphic dislocation, the shale in the surrounding strata smears along the fault surface. The higher the clay content is, the better the lateral sealing of the fault is. By calculating the average clay content (i.e., the SGR) of the formation sliding through the breakpoint and using oil testing data, a quantitative relationship between the SGR and the height of the sealed oil column can be established, thus achieving effective prediction of the oil distribution (Yielding et al., 1997; Bretan et al., 2003). This method has been widely applied in various oil-bearing basins and has achieved good results (e.g., Wang et al., 2017; Lei et al., 2019; Wang et al., 2021).
Several researchers have improved this method by considering factors such as the degree of diagenesis, geological stresses, and the fault dip angle to better solve the problem of fault sealing under complex conditions (Wang et al., 2017; Hong et al., 2018; Hu and Lyu, 2019; Jing et al., 2022). However, few studies have been conducted on the lateral sealing of faults in strata composed of interbedded sandstone and mudstone in terrestrial sedimentary basins. The fault has a specific spatial distribution range, and the lateral sealing of the fault’s different parts inevitably varies due to the complex changes in the clay content and fault throw. It is difficult to use a single well to reflect the clay content of the strata along the range of the fault’s strike directions, especially for strata composed of interbedded sandstone and mudstone due to rapid changes in the planar lithology and the unstable clay content (Zeng et al., 2017; Luo et al., 2021). Previous studies have relied on logging data to calculate the clay content (Yielding et al., 1997; Freeman et al., 1998; Yielding, 2002; Bretan et al., 2003; Wang et al., 2017; Lei et al., 2019; Wang et al., 2021). Determining the optimum well spacing to characterize the spatial variations in the clay content, and calculating the clay content and SGR in areas lacking well control, remain challlenging. If the SGR of the faults cannot be accurately calculated, it is difficult to understand the lateral sealing of the faults.
The Putaohua oil layer in the Sanzhao Depression in the Songliao Basin is a typical continental formation composed of interbedded sandstone and mudstone. Moreover, the fault traps are well developed and drilling data are abundant, making this an ideal area for conducting fine calculations of the fault SGR and research on the lateral sealing of faults. In this paper, a method for precisely calculating the fault SGRs based on detailed well seismic data from the Putaohua oil layer in the S14 area is proposed. Lateral sealing of faults are analyzed. This method can help clarify the distribution pattern of oil, guide oil exploration, and, characterize waterflooding development at the edges of the faults.
2 Geologic setting
The Songliao Basin is located in northeastern China. It is a large terrestrial sedimentary basin developed in the Mesozoic and Cenozoic and is one of the largest oil and gas-bearing basins discovered (Yuan et al., 2019; Li et al., 2024). Years of exploration practice have shown that refined exploration research is an essential foundation for improving oil and gas recovery, and fault edges are the main areas for potentially tapping the remaining oil in the Songliao Basin (Wang, 2019; Yang et al., 2022; Feng et al., 2023).
The Sanzhao Depression is an important oil-generating and oil-rich depression in the Songliao Basin, and it includes four nose protrusions and three depressions. The S14 area is located in the southern part of the Shengping nose-shaped structural belt in the Sanzhao Depression, and it has a southward dipping slope. The Putaohua oil layer is the most important oil-producing layer in the study area, with the development of delta front subfacies (Chen et al., 2019). The average thickness is approximately 50 m. Vertically, it is divided into two sand formations, consisting of nine sublayers and 13 sedimentary units. The sand body in the upper sand formation is relatively thin, and the thickness of a single sand body is generally 2–3 m. In contrast, the thickness of a single sand body in the lower sand group ranges from 3 to 5 m. The faults in the Putaohua oil layer are relatively developed. The fault density is about 2/km2, and they are all normal faults. The maximum vertical throw is 48 m, with an average of 15 m. The strike is variable, and faults with different strikes overlap or cut each other. The combination of inclined strata and striped underwater distributary channel sand bodies makes it easy for fault-blocking traps to form (Figure 1).
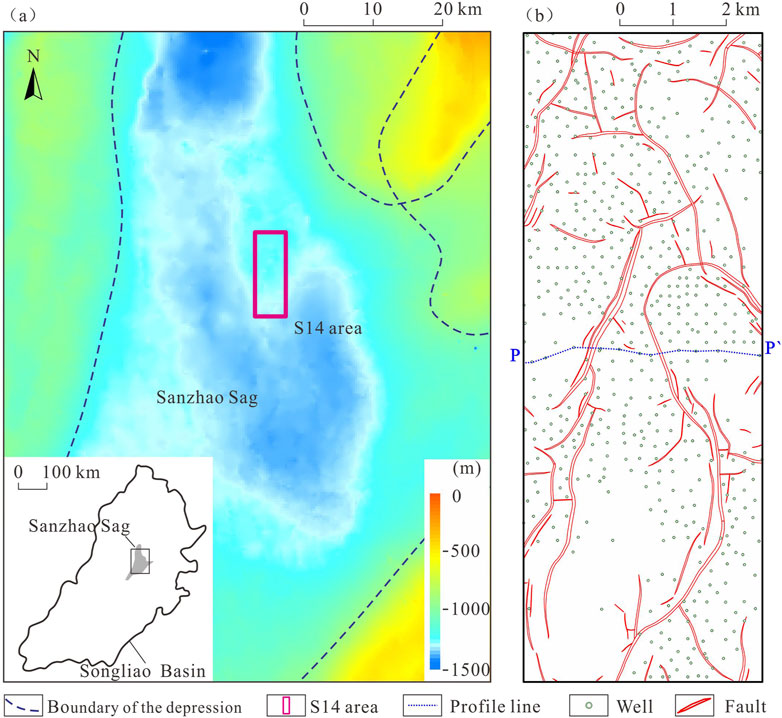
Figure 1. Map showing hte basic information for the S14 area. (A) Location of the study area. (B) Well locations and fault distribution in the study area.
The study area is currently in the high water production development stage. The uneven deployment of wells along the fault edge has led to residual oil enrichment. Therefore, there is room for further exploration (Chang and Liu, 2017; Sun et al., 2018; Meng et al., 2021).
3 Data
The data required for this study included logging data, seismic sandstone and mudstone inversion data, seismic data for the interpretation of horizons and faults. Although there are 540 wells in the study area, only the wells adjacent to the faults were useful. The natural gamma curve data were used to calculate the clay content of the formation. Seismic sandstone and mudstone inversion data were used to calculate the clay content in areas without wells. The seismic interpretation of the horizons and faults allowed us to characterize the changes in the fault throw. The specific analysis methods and uses of these data are described in detail in the next section. The above data were provided by the No. Eight Oil Production Plant in the Daqing Oil Field.
4 Principles and methods
The shale gouge ratio (Yielding et al., 1997; Freeman et al., 1998; Yielding, 2002; Song et al., 2022) is calculated by taking the average clay content of the beds that have slipped past any point (as determined by the fault throw) and treating it as an estimate of the upscaled fault-zone composition. The calculation formula (Yielding et al., 1997) is as follows:
where Vcl is the clay volume fraction in the zone (0%–100% or 0–1.0), ∆z is the thickness of the host rock layer (m), and t is the fault throw (m).
The clay content is obtained through logging curves and inversion data, and the optimal well spacing needs to be considered during the calculation process. The thickness of the host rock layer is obtained based on the actual sandstone and mudstone formation thickness data for the study area. The vertical fault throw is determined using stratigraphic projection. The specific calculation methods are as follows.
4.1 Calculation of clay contents of the strata on both sides of the fault
4.1.1 Calculation of clay content in areas with wells using the natural gamma curve
Generally, in sandstone and mudstone formations, due to the small particle size and large specific surface area of the clay components, it is easier to adsorb radioactive substances, resulting in high gamma values (Mo et al., 2006). Therefore, natural gamma curves are commonly used to indirectly characterize the clay content of a formation. The calculation formulas are as follows:
where Vcl is the clay volume fraction in the zone (0%–100% or 0–1.0), Ish is the relative value of the natural gamma curve, GCUR is the empirical coefficient (for old formations, GCUR = 2; for Paleogene and Neogene formations, GCUR = 3.7), GR is the response value of the natural gamma logging curve, GRmin and GRmax are the minimum and maximum natural gamma values in the statistical well section.
4.1.2 Calculation of clay content in areas without wells using seismic inversion data
In practical situations, there may be a lack of wells near the fault to be evaluated due to the uneven distribution of well locations. In this situation, virtual wells can be supplemented, and pseudo-well curves can be extracted from seismic inversion data to calculate the clay content.
Seismic inversion is a technical means of combining well and seismic data to quantitatively predict the distributions of sandstone and mudstone. The commonly used methods include geostatistical inversion and waveform indicator inversion (Duan, 2019; Fan et al., 2022). The meaning and range changes of the inverted data volume representation vary depending on the characteristic curves used (Chen et al., 2020; Xie et al., 2021). The inversion data body is a wave impedance antibody if the wave impedance curve is used as the characteristic curve. The clay content can be directly characterized after standardizing the extracted pseudo-well curve. If the gamma ray (GR) curve is used as the characteristic curve, the inversion data body is the GR body. After standardizing the extracted pseudo GR curve, the clay content is calculated using Equations 2, 3. In this study, the waveform indication inversion method is used, and the GR curve is selected as the characteristic curve. During the inversion operation, the actual drilling curve in the study area is constrained, and 10% of the wells are reserved as posteriori wells for verifying the accuracy of the inversion results (Figure 2). In general, the sand conformity rate of 75% is qualified. In this study, the coincidence rate of the inversion reaches the standard, so the method of using the inversion data to calculate the clay content is reliable. Seismic inversion is a mature technology, and the focus of this work is to obtain the clay content in areas without wells by using the inversion results. Therefore, the inversion process and precision analysis process are not discussed.
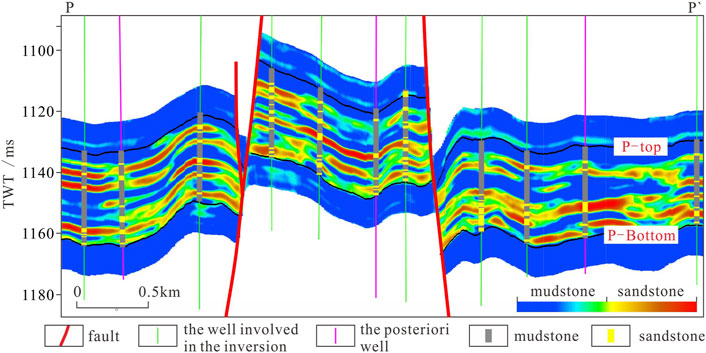
Figure 2. Results of seismic inversion section, and profile location is shown in Figure 1B. By comparing the predicted lithology with the drilling lithology, it can be seen that the lithology predicted via inversion is relatively accurate.
By comparing the GR curve of the same well with the inversion pseudo well curve, it can be seen that the overall trends of the two are the same. However, the GR curve has a high vertical accuracy and can more accurately reflect the changes in the clay content of the formation (Figure 3). Therefore, in practical applications, GR curves are used to conduct calculations in areas with a high well density, and inversion data are used as a supplement in areas lacking well locations or GR curves.
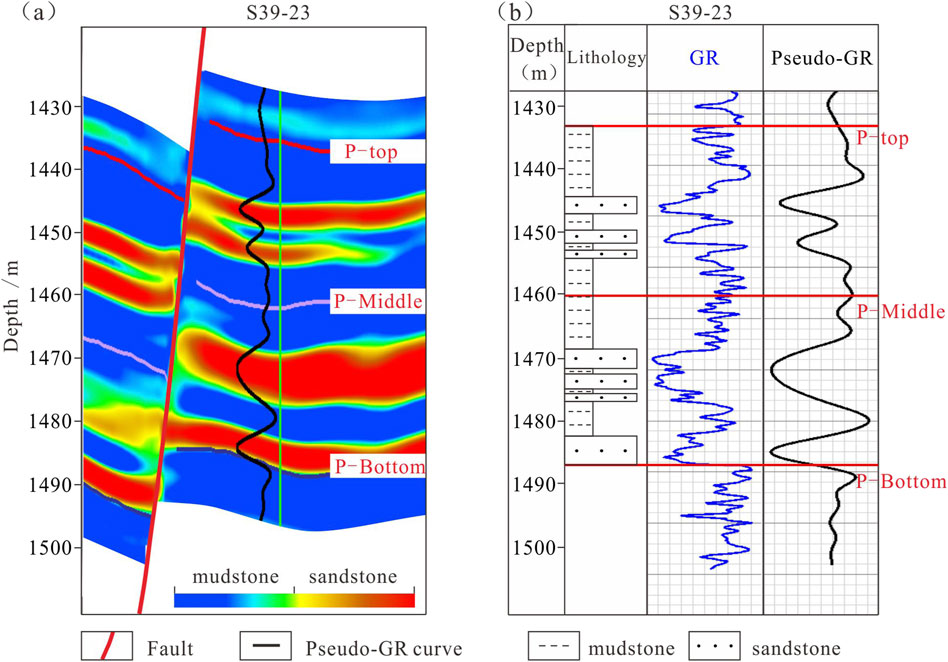
Figure 3. (A) GR inversion profile and pseudo-GR curve obtained through data inversion. (B) Comparison of actual GR curve and pseudo-GR curve for a single well. P-Top is the top interface of the Putaohua oil layer, P-Middle is the interface between the upper and lower sand formations, and P-Bottom is the bottom interface of the Putaohua oil layer. By comparing the GR curve for the same well with the inversion pseudo well curve, it can be seen that the overall trends of the two are the same.
4.2 Optimal well spacing for calculating the clay content
In order to reflect the clay content of the fault surface containing the smallest number of wells, the optimum well spacing should be determined based on the planar variation pattern of the reservoir’s clay content.
The SGR reflects the average clay content of the strata within the range of the vertical fault dislocation. Therefore, the average value within a specific thickness range should be considered when studying the variation pattern of the clay content of the formation. The thickness should be considered based on the actual fault throw. For example, if the identifiable fault throw in this study area is generally greater than 5 m, then when calculating the SGR, the variation pattern of the average clay content in layers with a thickness of greater than 5 m should be studied. The clay content varies horizontally, and if observed in a certain direction, it will exhibit a wavey curve. In order to quantitatively characterize the clay content, the distance between two adjacent maximum clay contents along a certain direction is called the fluctuation distance, and half of the fluctuation distance (the distance between the adjacent maximum and minimum values) represents the area in which the clay content changes the most. However, in practical applications, the distribution pattern of the virtual wells is random, and it is difficult to just set wells at the maximum or minimum value of the clay content. Therefore, in order to more accurately control the change in the clay content, 25% of the minimum fluctuation distance of the average clay content was selected as the optimal well spacing.
4.3 Characterization of the spatial variation of the fault throw
We accurately located and shaped the strata and faults based on the precise interpretation of three-dimensional seismic data. By intersecting the seismic interpretation horizon with the fault plane, the fault throw was determined between the intersection line of the hanging wall horizon and the footwall horizon. In this way, the fault throw at different positions on the fault plane could be determined. The example presented in Figure 4 shows that this method can effectively characterize the spatial variation of the fault throw along the fault plane. Horizontally, the fault throws of isolated growth faults are large in the middle and small at both ends (Figures 4–a). The fault throws of segmented growth faults decrease at the horizontal segmentation point (Figures 4B). Vertically, the fault throw of the Putaohua oil layer is consistent from top to bottom. If there is a sudden change in the fault throw, the cause of this change should be identified and the model should be adjusted to ensure the accuracy of the spatial variation of the fault throw.
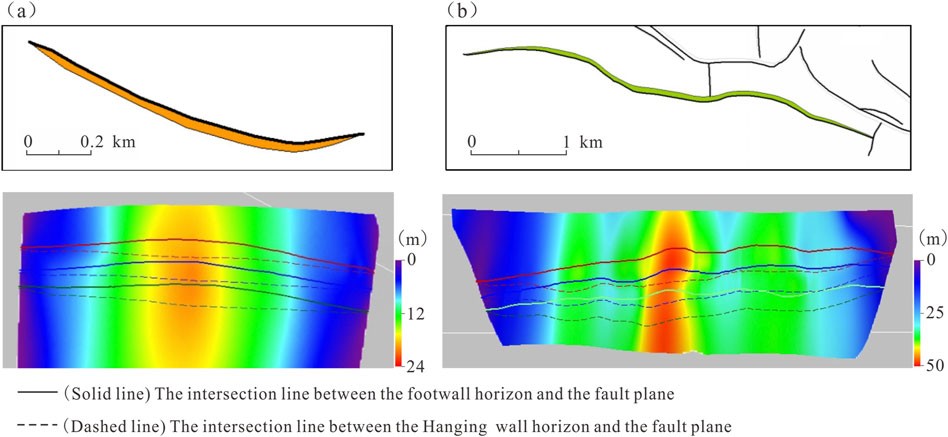
Figure 4. By intersecting the seismic interpretation horizon with the fault plane, the fault throw was determined between the intersection line of the hanging wall horizon and the footwall horizon. The variation in the fault throw along the fault plane can be obtained. (A) Shape of the fault plane and fault throw of the isolated growth fault; and (B) Shape of the fault plane and fault throw of the segmented growth fault.
5 Results
5.1 Optimal well spacing for calculating the clay content
For the case study presented in this paper, the average clay contents of the layers with different thicknesses range from 5 to 30 m. First, the clay contents of the upper and lower sand formations of the Putaohua oil layer were calculated using seismic inversion data. The results show that the average clay content of the upper sand formation is higher than that of the lower sand formation (Figures 5A, B). The horizontal variations in the clay content in the 5 m–10 m thickness range are relatively rapid, while the horizontal variations in the clay content in the thickness range of ≥10 m tends to be stable. Among them, the average clay content of the 5 m thick layer in the lower sand formation changes the fastest.
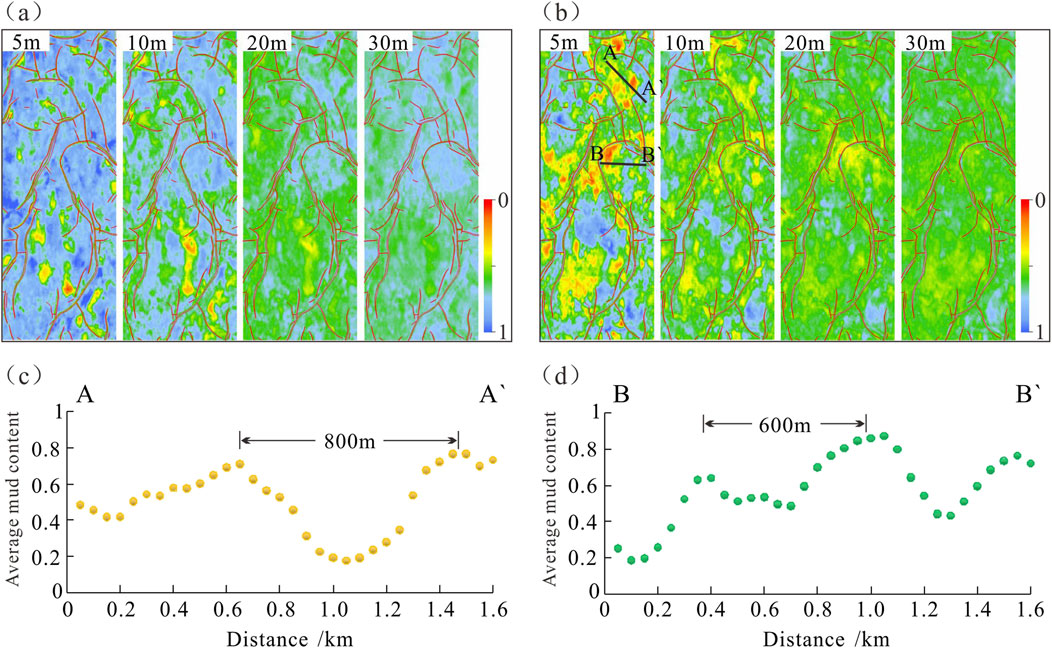
Figure 5. (A) Map of the average clay content in the layers with different thicknesses in the upper sand formation. (B) Map of the average clay content in the layers with different thicknesses in the lower sand formation. The average clay content of the upper sand formation is higher than that of the lower sand formation. The horizontal variation in the clay content in the 5-m to 10-m thickness range is relatively fast, while the horizontal variation in the clay content in the thickness range of 10 m and above tends to be stable. (C) Scatter plot of the changes in the clay content in section A, with a fluctuation distance of 800 m. The position of the section is shown in (B). (D) Scatter plot of the changes in the clay content in section B, with a fluctuation distance of 600 m. The position of the section is shown in (B).
Next, we selected a location without faults and with continuous strata in this layer segment. We set an observation line along the direction where the clay content changes the fastest (usually perpendicular to the direction of the underwater distributary channel) to observe the changes in the clay content. For observation line A-A′, the clay content exhibits undulating changes, with a fluctuation distance (distance between adjacent extremely high values) of about 800 m (Figure 5C). At the location of the B-B′ connection, the frequency of the change in the clay content is higher, with a fluctuation distance of about 600 m (Figure 5D). A quarter of the minimum fluctuation distance (600 m) is sufficient to control the calculation of the planar clay content variation. Therefore, the optimal well spacing for calculating the clay content in the study area was determined to be 150 m.
5.2 Evaluation criteria for fault sealing capacity
Based on the calculation results of the SGR at each fault plane and the actual oil distribution, we established a quantitative relationship between the SGR and the maximum enclosed oil column height, and the sealing capacity was quantitatively classified. In the research process, considering that the actual trap may not be fully filled, or even if it is oil-filled, the well fails to reveal the bottom of the oil layer. Therefore, the actual oil column height does not represent the maximum oil column height that a fault can seal. This paper provides the relationship between the actual oil column height and the minimum fault SGR within the reservoir range. In this way, for the same SGR, the actual oil column height varies, and the highest value is approximated to represent the maximum oil column height that a fault can seal. On the scatter plot, the maximum envelope represents the relationship between the SGR and the maximum oil column height a fault can seal (Figure 6).
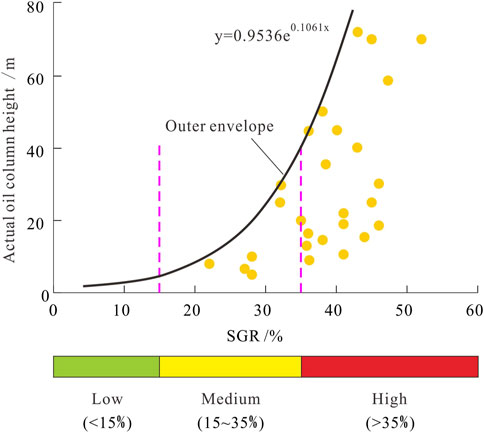
Figure 6. Classification and evaluation of the fault sealing capacity in the study area. This study provides the relationship between the actual oil column height and the minimum fault SGR within the reservoir range. In this way, for the same SGR value, the actual oil column height varies, and the highest value is approximated to represent the maximum oil column height that a fault can seal. On the scatter plot, the maximum envelope represents the relationship between the SGR and the maximum oil column height a fault can seal. According to the SGR, the fault sealing capacity is divided into three levels.
The results indicate that the quantitative relationship between the maximum oil column height (H) and the SGR in the example area is
5.3 Maximum oil bearing range sealed by faults in each sublayer
By utilizing the quantitative relationship between the maximum oil column height (H) and SGR described above, the maximum oil column height that each sublayer of fault can seal can be obtained. The maximum oil bearing range sealed by the faults in each sublayer can be obtained by converting the maximum oil column height into a plane structural map.
As shown in Figure 7, two underwater distributary channels are developed within the fault block in the PI3 sublayer. The upward dip direction is blocked by faults, which controls the oil distribution. Due to the uneven distribution of the wells, the actual location of the bottom of the oil in this sublayer is not yet clear. Using the above method, the minimum SGRs of the two river channels sealed by the faults are 31.2% (left pink field in Figure 7) and 28.4% (right pink field in Figure 7). The maximum oil column heights are calculated to be 26.1 m (left pink field in Figure 7) and 19.4 m (right pink field in Figure 7), respectively. These results are consistent with the oil distribution revealed by data for known wells (Figure 7). The maximum elevation of the bottom of the oil and the maximum oil bearing range can be determined. This scope helps guide reservoir exploration and expand the scale of the reserve volume.
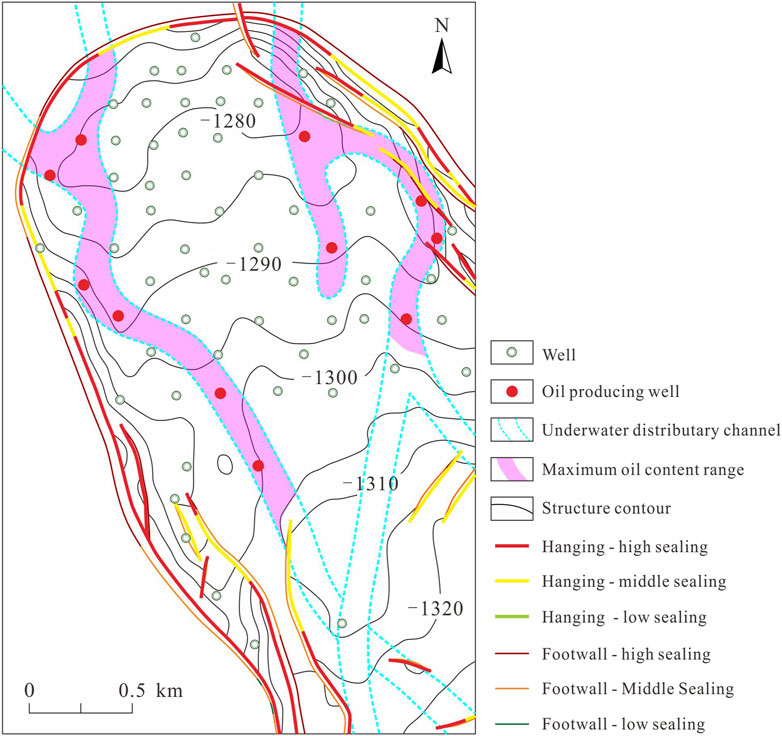
Figure 7. Maximum oil content range of a fault block in the PI3 sublayer. Two underwater distributary channels are developed within the fault block in the PI3 sublayer, with the upward dip direction blocked by faults, which controls the oil distribution. By utilizing the quantitative relationship between the maximum oil column height (H) and the SGR, the maximum oil column height that each sublayer of the fault can seal can be obtained. The maximum oil bearing range sealed by the faults in each sublayer can be obtained by converting the maximum oil column height to a plane structural map.
6 Discussion
Due to the influence of the clay content in the strata composed of interbedded sandstone and mudstone and the spatial variation of the fault throw, the lateral sealing capacity of the different parts of the fault varies greatly. Based on the precise calculation results of the fault SGR, the lateral sealing of the faults can also be understood in more detail.
6.1 The sealing capacity of the different parts of the same fault plane analysis
On the fault plane, the minimum SGR, corresponding to the reservoir, controls the lateral sealing capacity of the fault. It can be seen from the example fault (Figures 8A, B) that the minimum SGR of the fault varies significantly on the plane. For this fault’s hanging wall, from left to right, the fault’s sealing capacity is weak-medium-strong-medium-strong. This is because the SGR is related to the fault throw and the clay content in the range of the fault (Equation 1). In this instance, the fault exhibits a small fault throw and low mudstone proportion in areas with a weak sealing capacity. In areas with a moderate sealing capacity, the fault exhibits a medium to low fault throw and a medium to low mudstone proportion. In areas with a strong sealing capacity, the fault is characterized by a large fault throw and medium to high mudstone proportion (Figure 8C).
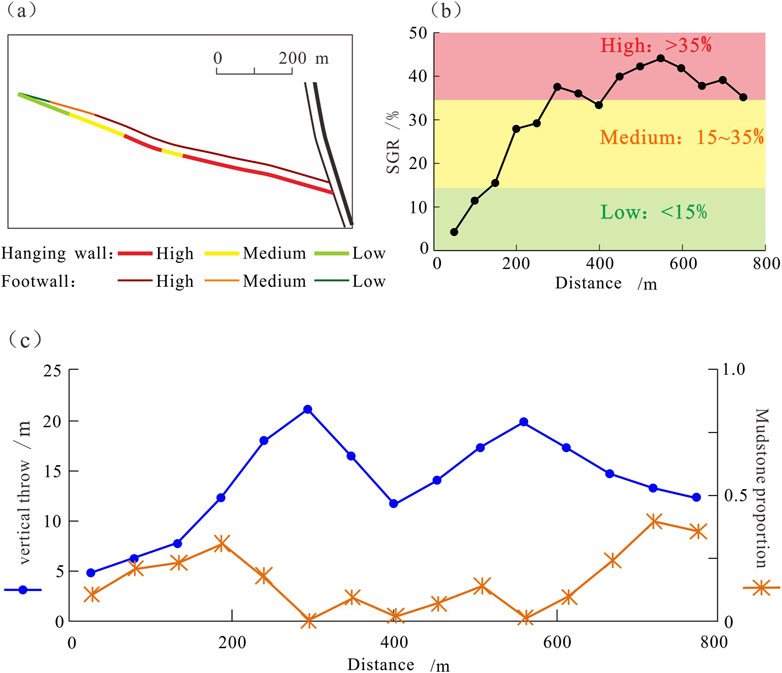
Figure 8. Plane change analysis of the minimum SGR on the hanging wall of a fault in the P13 sublayer. (A) Plane classification of the sealing capacity of the example fault. (B) Plot of the change in the SGR in the hanging wall of the fault. (C) Plot of the changes in the fault throw and mudstone proportion. The SGR is related to the fault throw and the clay content within the range of the fault. In this instance, the fault exhibits a small fault throw and low mudstone proportion in areas with a weak sealing capacity. In the areas with a moderate sealing capacity, is the fault exhibits a medium to low fault throw and a medium to low mudstone proportion. In areas with a strong sealing capacity, the fault is characterized by a large fault throw and a medium to high mudstone proportion.
6.2 The sealing abilities of the hanging wall and footwall of a fault in the same layer analysis
As can be seen from Figure 8B, the sealing abilities of the hanging wall and footwall of a fault in the same layer also differ. By calculating the average SGR of the entire Putaohua oil layer, it was found that the sealing capacity of the footwall is generally better than that of the hanging wall. As shown in Figure 9A, the average SGRs of the hanging wall and footwall of the example fault are 38.2% and 44.8%, respectively. This is because the footwall mainly receives a shale coating from the upper part of the oil layer, while the hanging wall mainly receives a shale coating from the lower part of the oil layer, and the clay content in the upper part of the oil layer is relatively high (Figure 9B).

Figure 9. (A) Comparative analysis of the sealing capacities of the footwall and hanging wall of the example fault. The average SGR of the footwall is greater than that of the hanging wall. (B) Schematic diagram of the coating range of the strata on the fault. The footwall mainly receives a shale coating from the upper part of the oil layer, while the hanging wall mainly receives a shale coating from the lower part of the oil layer. The clay contents of the upper and lower parts of the oil layer are different, resulting in different average SGRs in the footwall and the hanging wall.
6.3 The sealing capacity of the same fault for different sub-layers analysis
Controlled by the period of the fault activity, most of the faults in the Putaohua oil layer exhibit overall faulting in the study area (Sun et al., 2013). For each small layer, there is almost no change in the vertical throw of the fault. Therefore, the vertical change in the SGR is mainly controlled by the clay content. In the study area, the overall clay content of the upper sand formation is higher than that of the lower sand formation (Figures 5A, B). Therefore, the fault-sealing abilities of the individual sublayers in the upper sand formation are generally better than those of the individual sublayers in the lower sand formation (Figure 10).
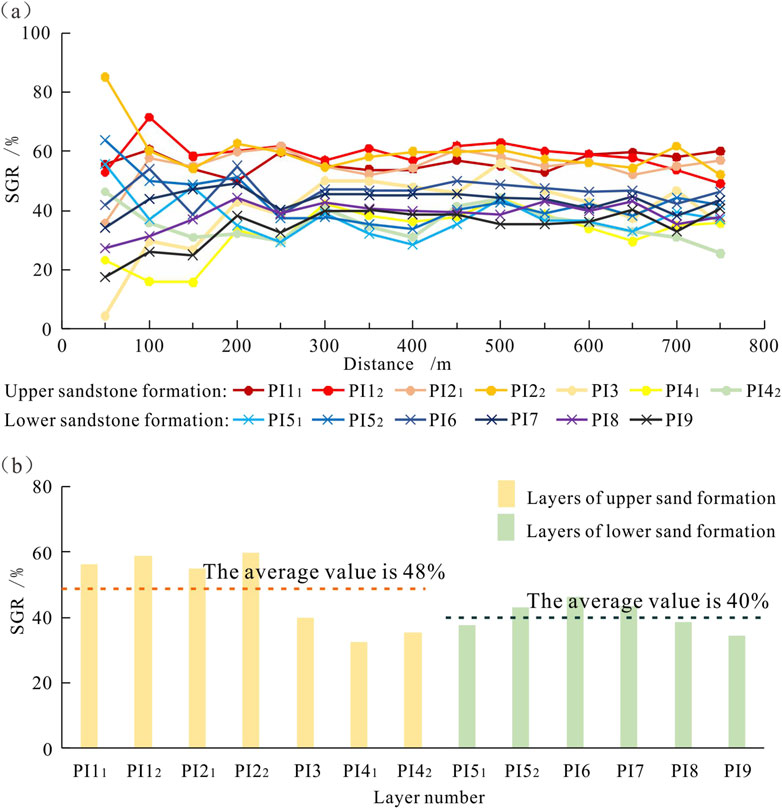
Figure 10. Comparative analysis of the sealing capacity of the footwall of the example fault in different sublayers. (A) Plot of the change in the SGR in each sublayer along the strike. (B) Plot of the average SGR of each sublayer. The average value of the upper sand formation is 48%, and the average value of the lower sand formation is 40%.
6.4 The fault sealing critical throw analikysis
Considering the complexity of fault sealing, in practical applications, we hope to evaluate whether faults have sealing properties with simpler and more easily obtainable parameters (i.e., the fault throw). Therefore, in this study, we explored the lateral sealing of the faults in the study area under the influence of a single factor, the fault throw, based on analysis of the regional clay content. Furthermore, based on the lower limit of the SGR, the fault-sealing critical throw was obtained.
6.4.1 Fault sealing critical throw for a single well
The single well SGR-fault throw ternary diagram and corresponding scatter plots (Figures 11A, B) reflect the relationship between the fault throw and the SGR for a specific formation location, assuming that the lithology combination and clay content are already clear. As the fault throw increases, the SGR changes, which is manifested as a decrease in the SGR of the mudstone section due to smearing and an increase in the SGR of the sandstone section due to smearing, and finally, it tends to stabilize.
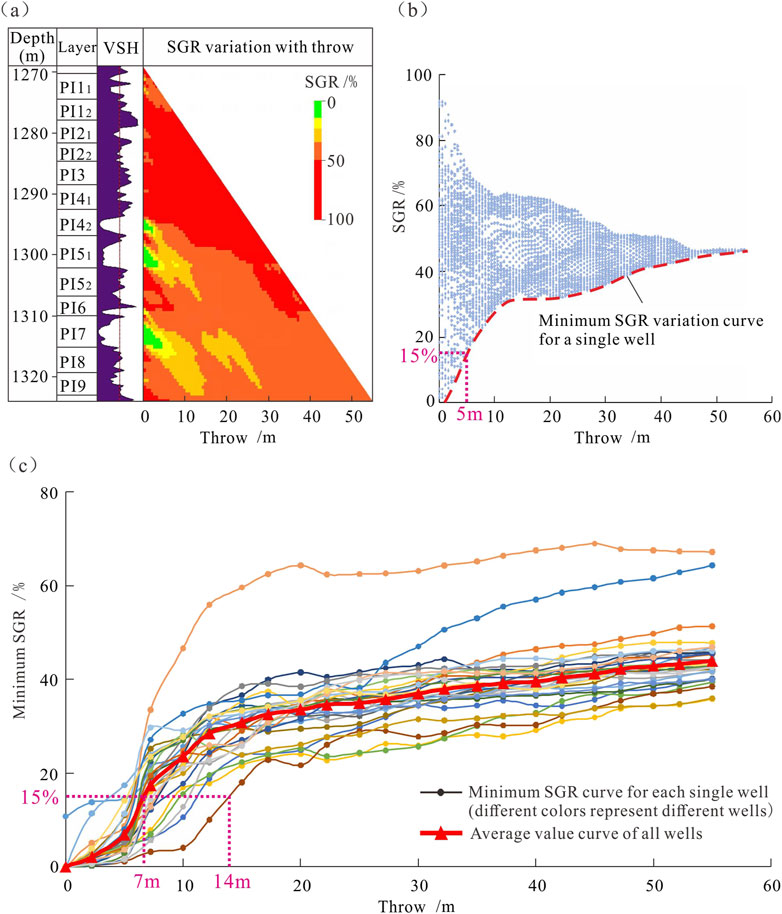
Figure 11. Analysis of the fault sealing critical throw in the S14 area. (A) Ternary diagram of the variation in the SGR with the fault throw in a single well (Sheng 55–34). When the fault throw is 0, the SGR represents the clay content of the original formation. High values represent the mudstone section, and low values represent the sandstone section. As the fault throw increases, the SGR changes, which is manifested as a decrease in the SGR of the mudstone section due to smearing and an increase in the SGR of the sandstone section due to smearing, and finally, it tends to stabilize. (B) Plot of the change in the SGR with the fault throw in a single well (Sheng 55–34), in which the fault sealing critical throw of the single well is determined according to the lower limit of the SGR. When the fault throw is greater than the critical throw, all of the SGR values on the fault plane are greater than 15%, and the entire fault is sealed. (C) Plot of the minimum change in the SGR with the fault throw for multiple wells, in which the fault sealing critical throw in the entire area is determined according to the lower limit of the SGR. The average fault sealing critical throw in the study area is 7 m, and the maximum value is 14 m. Thus, when the fault throw in the study area is less than 7 m, the risk of fault unsealing is higher; and when the fault throw is greater than 14 m, the fault’s sealing capacity is good.
The lower envelope of the single well SGR-fault throw scatter plot represents the relationship between the fault throw and the minimum SGR (Figure 11B). Using the lower envelope and taking 15% of the SGR as the lower sealing limit, the corresponding fault throw can be calculated. This is the fault sealing critical throw. When the fault throw is greater than the critical throw, all of the SGR values on the fault plane are greater than 15%, and the entire fault is sealed.
6.4.2 Fault sealing critical throw within the case study area
Due to the different lithological combinations and clay contents at different locations in the entire study area, the fault sealing critical throw is minor in the mudstone-dominated parts of the faults and is significant in the sandstone-dominated parts of the faults. To summarize the general conclusions for this region, a specific number of wells should be evenly selected throughout the entire region and compiled using the SGR-fault throw scatter plot of the data from single wells. Then, the lower envelope can be extracted to analyze the fault sealing critical throw (Figure 11C). Using this approach, we conclude that the average fault sealing critical throw in the study area is 7 m, and the maximum value is 14 m. Thus, when the fault throw in the study area is less than 7 m, the risk of fault unsealing is higher, and when the fault throw is greater than 14 m, the fault’s sealing capacity is good.
Based on the relationships between various parameters and the fault sealing capacity, we determined that different positions along the fault plane have different sealing capabilities. Our results present a more in-depth understanding, which will be helpful in further research on petroleum distribution patterns.
7 Conclusion
(1) A method for calculating fault SGRs suitable for strata composed of interbedded sandstone and mudstone was established. The key point of this method lies in the precise calculation of three parameters: the clay content, optimal well spacing, and fault throw. For the clay content, logging curves are used to calculate the clay content in areas with wells; while in areas without wells, virtual wells are set up, and the clay content is calculated based on seismic inversion data. Regarding the optimal well spacing, one-fourth of the minimum fluctuation distance of the average clay content is selected as the optimal well spacing. For the fault throw, the method of intersecting the seismic interpretation horizon with the fault plane is used to accurately characterize the spatial variation of the fault throw along the fault plane.
(2) Based on the actual oil distribution patterns in the study area, the fault sealing capacity is divided into three levels based on the SGR: weak (SGR < 15%), medium (15% < SGR < 35%), and strong (SGR > 35%).
(3) Using the precise calculation of the fault SGR, the fault sealing in the S14 area is clarified. ① The SGR varies significantly at different positions on the fault plane and is mainly determined by the changes in the clay content and fault throw. ② The fault sealing capacity of the upper sand formation in the Putaohua oil layer is better than that of the lower sand formation. ③ The overall sealing capacity of the footwall of the fault is better than that of the hanging wall. ④ As the fault throw increases, the fault SGR of the sandstone section initially increases and then stabilizes. Taking the SGR value of 15% as the lower limit for fault sealing, the average fault sealing critical throw in the study area is 7 m, and the maximum value is 14 m.
Data availability statement
The original contributions presented in the study are included in the article/supplementary material, further inquiries can be directed to the corresponding author.
Author contributions
XL: Writing–original draft, Writing–review and editing. YZ: Methodology, Resources, Writing–review and editing. GP: Methodology, Resources, Writing–review and editing. BB: Methodology, Resources, Writing–review and editing. XS: Conceptualization, Methodology, Writing–review and editing. ZL: Conceptualization, Methodology, Writing–review and editing. JY: Investigation, Writing–review and editing.
Funding
The author(s) declare that financial support was received for the research, authorship, and/or publication of this article. This study was supported by the National Natural Science Foundation of China (nos. 42102173 and 42172161).
Acknowledgments
Two reviewers are thanked for their comments and criticisms, which improved the presentation of our research.
Conflict of interest
Authors YZ, GP, and BB were employed by NO.8 Oil Production Plant of Daqing Oilfield Limited Liability Company.
The remaining authors declare that the research was conducted in the absence of any commercial or financial relationships that could be construed as a potential conflict of interest.
Publisher’s note
All claims expressed in this article are solely those of the authors and do not necessarily represent those of their affiliated organizations, or those of the publisher, the editors and the reviewers. Any product that may be evaluated in this article, or claim that may be made by its manufacturer, is not guaranteed or endorsed by the publisher.
References
Aydin, A. (2000). Fractures, faults, and hydrocarbon entrapment, migration and flow. Mar. petroleum Geol. 17 (7), 797–814. doi:10.1016/s0264-8172(00)00020-9
Bretan, P., Yielding, G., and Jones, H. (2003). Using calibrated shale gouge ratio to estimate hydrocarbon column heights. AAPG Bull. 87 (3), 397–413. doi:10.1306/08010201128
Chang, Y., and Liu, D. M. (2017). Hydrocarbon accumulation patterns and their controlling factors of Putaohua reservoirs in Chaochang area, Songliao Basin. Oil Gas Geol. 38, 944–951. doi:10.11743/ogg20170513
Chen, H. Z., Wang, Y. C., and Gao, Y. (2019). Seismic fine depiction of the thin sand distribution of the Putaohua Reservoir in the Well C51 Area. Oil Geophys. Prospect. 54, 600–607. doi:10.13810/j.cnki.issn.1000-7210.2019.03.013
Chen, Y. H., Bi, J. J., Qiu, X. B., Chen, Y. B., Yang, H., Cao, J. J., et al. (2020). A method of seismic meme inversion and its application. Petroleum Explor. Dev. 47, 1235–1245. doi:10.1016/s1876-3804(20)60132-5
Clarke, S. M., Burley, S. D., and Williams, G. D. (2005). A three-dimensional approach to fault seal analysis: fault-block juxtaposition and argillaceous smear modelling. Basin Res. 17 (2), 269–288. doi:10.1111/j.1365-2117.2005.00263.x
Duan, N. (2019). Application of prestack seismic waveform indicates inversion in thin reservoir prediction. Prog. Geophys. 34 (2), 523–528. doi:10.6038/pg2019CC0023
Fan, Z. H., Hu, B., Song, J. J., Liu, H. J., Shen, G. Q., and Wang, Z. T. (2022). Analysis of influencing factors in reservoir description accuracy by seismic inversion. Oil Geophys. Prospect. 57 (2), 441–451. doi:10.13810/j.cnki.issn.1000-7210.2022.02.024
Feng, L. Y., Zhang, J. G., Jing, Z. X., Li, C. S., and Bai, Y. F. (2023). High-precision sedimentary cycle framework and organic matter enrichment response of Qingshankou Formation in Songliao Basin. Acta Pet. Sin. 44 (02), 299–311. doi:10.7623/syxb202302006
Fisher, Q., Haneef, J., Grattoni, C., Allshorn, S., and Lorinczi, P. (2017). Permeability of fault rocks in siliciclastic reservoirs: recent advances. Mar. Petroleum Geol. 99 (6), 29–42. doi:10.1016/j.marpetgeo.2017.12.019
Freeman, B., Yielding, G., Needham, D. T., and Badley, M. E. (1998). Fault seal prediction: the gouge ratio method. Geol. Soc. Lond. Spec. Publ. 127 (01), 19–25. doi:10.1144/GSL.SP.1998.127.01.03
Fu, X. F., Song, X. Q., Wang, H. X., Liu, H. T., Wang, S. Y., and Meng, L. D. (2021). Comprehensive evaluation on hydrocarbon-bearing availability of fault traps in a rift basin: a case study of the Qikou Sag in the Bohai Bay Basin, China. Petroleum Explor. Dev. 48 (04), 787–797. doi:10.1016/s1876-3804(21)60066-6
Hong, G. L., Jin, Q., Cheng, F. Q., Wu, K., Zhang, R. C., and Hou, Q. J. (2018). An improved method for extracting parameters and its application to calculating fault sealing capacity: a case study of the central-southern section of the Liaoxi Uplift. Petroleum Geol. Recovery Effic. 25 (03), 50–54+60. doi:10.13673/j.cnki.cn37-1359/te.2018.03.007
Hu, X. L., and Lyu, Y. F. (2019). Improvement of lateral sealing evaluation of faults based on SGR threshold. J. China Univ. Min. &Technology 48 (06), 1330–1342. doi:10.13247/j.cnki.jcumt.001045
Jing, Z. Y., Li, G. B., Fu, X. F., Meng, L. D., Yang, Z. P., and Zhao, Y. F. (2022). New methods for evaluation fault sealing effectiveness based on sand box physical simulation. Geol. Rev. 68 (01), 348–358. doi:10.16509/j.georeview.2021.12.071
Lei, C., Yuan, X. T., Yang, X. Y., Xuan, Q. Y., Wang, M., and She, J. F. (2019). Quantitative characterization of fault lateral sealing capacity based on 3-D SGR model: a case from M field, Niger. Oil & Gas Geol. 40 (06), 13171–13323. doi:10.11743/ogg20190615
Li, Y., Wang, M., Yan, Y., Wang, X., Zhang, J. Y., Bai, X. F., et al. (2024). Paleoenvironment evolution and organic matter enrichment mechanisms in the first member of the Qingshankou Formation, Songliao Basin, China. Front. Earth Sci. 18, 364–383. doi:10.1007/s11707-022-1067-1
Liu, X. W., Chang, D., Shi, S. M., He, C. B., and Wei, and H. B. (2018). Structure analysis of the Paleogene strata in the northern Nanpu sag: the “transfer growth” phenomenon in fault links and its significance. J. China Univ. Min. & Technol. 47 (06), 1287–1294. doi:10.13247/j.cnki.jcumt.000847
Luo, Q., Huang, S. Z., Shi, D. F., and Wang, R. (2021). Recognizing turbidite sand bodies in thinly interbedded sand−shale reservoir in the Weixinan Depression by energy half-time attributes. Earth Sci. Front. 28 (1), 273–281. doi:10.13745/j.esf.sf.2020.5.25
Manzocchi, T., Childs, C., and Walsh, J. J. (2010). Faults and fault properties in hydrocarbon flow models. Geofluids 10 (1), 94–113. doi:10.1002/9781444394900.ch8
Meng, Q. A., Li, C. B., Bai, X. F., Zhang, W. J., Xue, T., Peng, J. L., et al. (2021). Petroleum exploration history and enlightenment in the northern Songliao Basin. Xinjiang Pet. Geol. 42 (3), 264–271. doi:10.7657/XJPG20210302
Mo, X. W., Ding, Y. H., and Wang, H. J. (2006). Method of estimating shale and clay volume in hydrocarbon reservoirs of puxi area. J. Jilin Univ. Sci. Ed. 36 (S2), 139–142. doi:10.13278/j.cnki.jjuese.2006.s2.017
Pei, Y. W., Paton, D. A., Knipe, R. J., and Wu, K. Y. (2015). A review of fault sealing behaviour and its evaluation in siliciclastic rocks. Earth Sci. Rev. 150, 121–138. doi:10.1016/j.earscirev.2015.07.011
Reilly, C., Nicol, A., Walsh, J. J., and Kroeger, K. F. (2016). Temporal changes of fault seal and early charge of the Maui gas-condensate field, Taranaki basin, New Zealand. Mar. Petroleum Geol. 70, 237–250. doi:10.1016/j.marpetgeo.2015.11.018
Song, X. G., Chen, S., Zhang, Y. T., Xie, Z., Liang, X. X., Yang, M. H., et al. (2024). Formation mechanism of the small-angle X-type strike-slip faults in deep basin and its controlling on hydrocarbon accumulation: a case study from the Tabei Uplift, Tarim Basin, NW China. Front. Earth Sci. 12, 1387544. doi:10.3389/feart.2024.1387544
Song, X. Q., Meng, L. D., Fu, X. F., Wang, H. X., Sun, Y. H., and Jiang, W. Y. (2020). Sealing capacity evolution of trap-bounding faults in sand-clay sequences: insights from present and paleo-oil entrapment in fault-bounded traps in the Qinan area, Bohai Bay Basin, China. Mar. Petroleum Geol. 122, 104680. doi:10.1016/j.marpetgeo.2020.104680
Song, X. Q., Wang, H. X., Fu, X. F., Meng, L. D., Sun, Y. H., Liu, Z. D., et al. (2022). Hydrocarbon retention and leakage in traps bounded by active faults: a case study from traps along the NDG fault in the Qinan area, Bohai Bay Basin, China. J. Petroleum Sci. Eng. 208, 109344. doi:10.1016/j.petrol.2021.109344
Sum, Y. H., Chen, Y. B., Sun, J. G., Fu, X. F., and Hu, M. (2013). Evolutionary sequence of faults and the formation of inversion structural belts in the northern Songliao Basin. Petroleum Explor. Dev. 40 (3), 275–283. doi:10.11698/PED.2013.03.03
Sun, Y., Yu, L. M., Yan, B. Q., Liu, Y. Y., Cong, L., and Ma, S. Z. (2018). Oil water distribution and its major controlling factors of Putaohua reservoir of the cretaceous yaojia formation in syncline area of Sanzhao sag, Songliao Basin. Oil Gas Geol. 39 (6), 1120–1130+1236. doi:10.11743/ogg20180603
Wang, C., Fu, G., Dong, Y. J., Yang, D. X., Cao, L. Z., and Hu, X. L. (2017). SGR Algorithm-based improvement of fault lateral sealing evaluation method and its application. Acta Geol. Sin. 91 (7), 1641–1650. doi:10.19762/j.cnki.dizhixuebao.2017.07.015
Wang, Y., Jiang, Y. L., Zhao, K., Hu, H. J., Su, S. M., and Gong, S. M. (2021). An alternative SGR method for shallow siliciclastic rock: a case study from the Kendong uplift of the Bohai Bay Basin. J. Struct. Geol. 151, 104420. doi:10.1016/j.jsg.2021.104420
Wang, Y. H. (2019). Analysis and countermeasure on the exploration situation of Daqing Oilfield. Petroleum Geol. & Oilfield Dev. Daqing 38 (05), 34–40. doi:10.19597/j.issn.1000-3754.201907085
Xie, C. L., Li, Y. Y., Chen, Z. D., Hu, J. Z., Tian, M., and Wang, X. Y. (2021). Seismic motion simulation for horizontal well drilling in Fuyu Reservoirs. Oil Geophys. Prospect. 56, 564–573. doi:10.13810/j.cnki.issn.1000-7210.2021.03.015
Yang, Z., Tang, X., Xiao, H., Zhang, F., Jiang, Z., and Liu, G. (2022). Water film thickness of tight reservoir in Fuyu oil layer of Cretaceous Quantou Formation in Songliao Basin and its influence on the lower limit of seepage. Mar. Petroleum Geol. 139, 105592. doi:10.1016/j.marpetgeo.2022.105592
Yielding, G. (2002). “Shale gouge ratio: calibration by geohistory,”. Hydrocarbon seal quantification. Editors A. G. Koestler, and R. Hunsdale (Amsterdam: Norwegian Petroleum Society (NPF) Special Publications), 11, 1–15. doi:10.1016/s0928-8937(02)80003-0
Yielding, G., Freeman, B., and Needham, D. T. (1997). Quantitative fault seal prediction. Am. Assoc. Petrol. Geol. Bull. 81 (6), 897–917. doi:10.1306/522B498D-1727-11D7-8645000102C1865D
Yuan, Q. F., Zhu, L. L., Lu, H. M., and Zheng, X. B. (2019). Development characteristics and main tackled EOR research direction for the waterflooded oilfield at the late stage. Petroleum Geol. & Oilfield Dev. Daqing 38 (5), 34–40. doi:10.19597/j.issn.1000-3754.201907089
Zeng, Q., Zhang, X., Zhang, R., Zhao, J., Hou, G., and Ji, Y. (2017). Characteristics of tidal action sedimentary system and distribution of favorable sand bodies of Silurian in Tazhong area, Tarim basin, NW China. Quat. Int. 468, 62–71. doi:10.1016/j.quaint.2017.02.016
Zhao, X. Z., Zhou, L. H., Pu, X. G., Jin, F. M., Han, W. Z., Xiao, D. Q., et al. (2018). Development and exploration practice of the concept of hydrocarbon accumulation in rifted-basin troughs: a case study of Paleogene Kongdian Formation in Cangdong Sag, Bohai Bay Basin. Petroleum Explor. Dev. 45 (06), 1166–1176. doi:10.1016/s1876-3804(18)30120-4
Keywords: Songliao basin, interbedded sandstone and mudstone, SGR value, lateral sealing of faults, fault sealing critical throw
Citation: Liu X, Zhao Y, Pan G, Bian B, Song X, Liu Z and Yu J (2024) Research on fault lateral sealing of thinly interbedded sandstone and mudstone strata based on the fine calculation method of the SGR value. Front. Earth Sci. 12:1459091. doi: 10.3389/feart.2024.1459091
Received: 03 July 2024; Accepted: 22 August 2024;
Published: 02 September 2024.
Edited by:
Gang Rao, Southwest Petroleum University, ChinaReviewed by:
Yangwen Pei, China University of Petroleum (East China), ChinaChangyu Fan, Northwest University, China
Copyright © 2024 Liu, Zhao, Pan, Bian, Song, Liu and Yu. This is an open-access article distributed under the terms of the Creative Commons Attribution License (CC BY). The use, distribution or reproduction in other forums is permitted, provided the original author(s) and the copyright owner(s) are credited and that the original publication in this journal is cited, in accordance with accepted academic practice. No use, distribution or reproduction is permitted which does not comply with these terms.
*Correspondence: Xiaowen Liu, MTIxOTkwMTAxODQ2QG5lcHUuZWR1LmNu