
94% of researchers rate our articles as excellent or good
Learn more about the work of our research integrity team to safeguard the quality of each article we publish.
Find out more
ORIGINAL RESEARCH article
Front. Earth Sci., 03 September 2024
Sec. Geohazards and Georisks
Volume 12 - 2024 | https://doi.org/10.3389/feart.2024.1458416
 Jinming Hu1,2,3,4
 Beibei Chen1,2,3,4*Xiaoyu Chu1,2,3,4Huili Gong1,2,3,4Chaofan Zhou1,2,3,4Yabin Yang5Xiaoxiao Sun5Danni Zhao1,2,3,4
Land subsidence, marked by a decline in surface elevation, poses a significant threat to urban infrastructure and safety. Accurate subsidence information and a reliable prediction model are crucial for prevention and control. In this study, we used persistent scatterer interferometric synthetic aperture radar (PS-InSAR) technology to obtain long-term land subsidence data and analyzed subsidence characteristics in Decheng District. By integrating hydrogeological and groundwater data, we developed a three-dimensional groundwater flow and one-dimensional compaction model through numerical simulation. Furthermore, the subsidence data monitored by PS-InSAR were used to further constrain and validate the model. The evolution trend of land subsidence under different groundwater exploitation scenarios was predicted and analyzed. The results showed that from May 2017 to December 2021, the cumulative maximum subsidence in Decheng District reached −173 mm. The subsidence area is mainly concentrated in the northern area, and its subsidence center is near Qiaoyuan Town. According to the Land Subsidence Prevention and Control Plan of Dezhou City, Shandong Province (2018–2025), we set up different groundwater mining scenarios with the goal that the rate of land subsidence in the key prevention and control area is less than 35 mm/yr in 2025.The Fluid-solid coupled model prediction analysis results indicated that a 30% reduction in groundwater exploitation is reasonable.
Land subsidence results from the consolidation and compression of loose rock and soil layers at varying depths beneath the Earth’s surface. This phenomenon is typically characterized by a reduction in the ground elevation within a certain area (Galloway and Burbey, 2011). Groundwater exploitation is one of the main causes of land subsidence, which disrupts the groundwater balance of the aquifer system. When the groundwater level decreases, the pore water pressure decreases, leading to an increase in the effective stress. This, in turn, induces subsidence of the soil structure, ultimately causing land subsidence. If the effective stress is higher than the previous consolidation value, a large part of the land subsidence is permanent and will affect the water storage capacity of the aquifer (Bonì et al., 2017; Terzaghi, 1925). Land subsidence can also cause damage to buildings and infrastructure, increasing the risk of flooding and saltwater intrusion in coastal areas (Blackwell et al., 2020; Herrera-García et al., 2021). Therefore, it is very important to obtain land subsidence monitoring information and provide land subsidence predictions.
Interferometric synthetic aperture radar (InSAR) technology can provide wide-ranging and high-precision land subsidence data. Since its first application in obtaining surface change information in 1989 (Gabriel et al., 1989), this method has been widely used in land subsidence monitoring (Costantini et al., 2017; Dong et al., 2023; Haghighi and Motagh, 2019; Miller and Shirzaei, 2015; Motagh et al., 2017; Berardino et al., 2002). Based on the traditional InSAR technique, the persistent scatterer interferometric synthetic aperture radar (PS-InSAR) technique can overcome limitations such as phase decorrelation and atmospheric delay, significantly enhancing the monitoring accuracy for obtaining more precise land subsidence data (Awasthi et al., 2022; Ferretti et al., 2000; Foroughnia et al., 2019; Hooper et al., 2004; Mateos et al., 2017).
In recent years, numerical models coupled with compaction have been applied by many scholars to predict land subsidence due to groundwater overexploitation (Fernández-Merodo et al., 2021; Lin et al., 2015; Ochoa-González, et al., 2018; Teatini et al., 2006; Zhao et al., 2021). Building upon Terzaghi and Bjerrum’s consolidation theory, scholars have proposed various coupled numerical models for assessing land subsidence, including the two-step computational model (Gambolati and Freeze, 1973), partially coupled models (Li and Zhou, 2006), and fully coupled models (Kihm et al., 2007). The two-step computational model is conceptually simple and computationally efficient. However, it does not accurately reflect the actual situation as it separates changes in the hydraulic head from soil subsidence. When the seepage field changes due to the groundwater level drop in the aquifer, the adjacent soil will also deform nonlinearly. Partially coupled models consider this aspect by adjusting the soil porosity, permeability coefficient, and other hydrogeological parameters to achieve partial coupling between the seepage and subsidence models (Zhang and Xue, 2002). In contrast, fully coupled models demand numerous parameters and involve considerable computational complexity, limiting practical application. Therefore, to accurately predict land subsidence in this study, we adopted a partially coupled model.
The accuracy of three-dimensional fluid-solid models is generally affected by the model parameters and calibration data. Typically, model parameters such as lithology, permeability, coefficient of storage, consolidation and porosity are derived from field measurements or experiments. However, these parameters only represent the characteristics of the experimental area, and in some areas, there is a lack of leveling observations. Therefore, it is necessary to find new subsidence monitoring data. InSAR data play a crucial role in understanding the groundwater resource distribution and variation, mapping lithologic boundaries, calculating storage coefficients of confined aquifers, and calibrating land subsidence models (Boni et al., 2020; Galloway and Hoffmann, 2007; Peng et al., 2022). At present, some scholars have used InSAR data to calibrate the parameters of 3D groundwater flow and 1D compaction model and verify the simulation results. For example, Hoffmann et al. (2003) utilized InSAR technology to obtain subsidence data for the Antelope Canyon area in California. Combining it with the subsidence package (SUB), developed by Leake (1990), which is based on Terzaghi’s (1925) theory of one-dimensional consolidation (also referred to as compaction), they estimated the inelastic drainage system number to enhance the performance of the land subsidence model and improve result reliability. Burbey and Zhang (2015) used high spatial and temporal resolution subsidence observation of InSAR and hydraulic head data to inversely calibrate the hydrogeological parameters of the development zone aquifer in the entire Las Vegas Basin. They found that the subsidence observation using PS-InSAR is extremely beneficial to accurately quantify the hydraulic parameters, and the model calibration results are far more accurate than only using the water level as the observation value and a small number of random subsidence observations. Masoud Mahmoudpour et al. (2016) used head and InSAR data for model calibration and verified that the prediction results suitably agreed with the measurement results. Ezquerro et al. (2020) used Sentinel-1 and CosmoSkyMed satellite data to obtain land subsidence data to calibrate and validate the groundwater model to improve the accuracy and reliability of the groundwater model. Ceccatelli et al. (2021) used the PS-InSAR technique to obtain subsidence information for the Pistoia region, calibrating and validating hydrodynamic model parameters. In conclusion, InSAR data provide certain advantages in correcting the hydraulic parameters of the model and verifying the prediction results.
In this paper, we selected Decheng District as the study area. First, we used the PS-InSAR method to process Sentinel-1A images and obtained the land subsidence information for Decheng District from May 2017 to December 2021. Then, combined with local hydrogeological data and groundwater data, we constructed a 3D groundwater flow and 1D compaction model using numerical simulation techniques. To verify the prediction results and correct the model parameters, we compared the prediction with the subsidence data obtained by PS-InSAR. Finally, using the numerical model corrected with subsidence data from the PS-InSAR, we predicted the land subsidence in Decheng district from 2022 to 2025. In addition, according to the goal of controlling land subsidence in Dezhou (Wang and Zhang, 2020), this study established different groundwater exploitation scenarios to predict the changing trend of land subsidence.
Decheng District is located in Dezhou city, Shandong Province, in the Lubei Plain. It borders Ling County in the east, Pingyuan County and Wuling County in the south, and Gucheng County, Jingxian County and Wuqiao County in Hebei Province in the west, northwest and northeast, respectively. It occurs in the border zone of the two provinces. The geographical coordinates of the area are 116°10‘15''∼ 116°30′40″E and 37°10′15''∼ 37°30′30″N, with a total area of 539.9 km2 (Figure 1). The annual average temperature in Decheng District is 12.9°C, and the annual average rainfall from 1951 to 2015 reached 570 mm (Li, 2017). The rainfall distribution is relatively uniform in space, but it is unbalanced in time, mainly concentrated from June to August. In addition, the annual rainfall varies greatly.
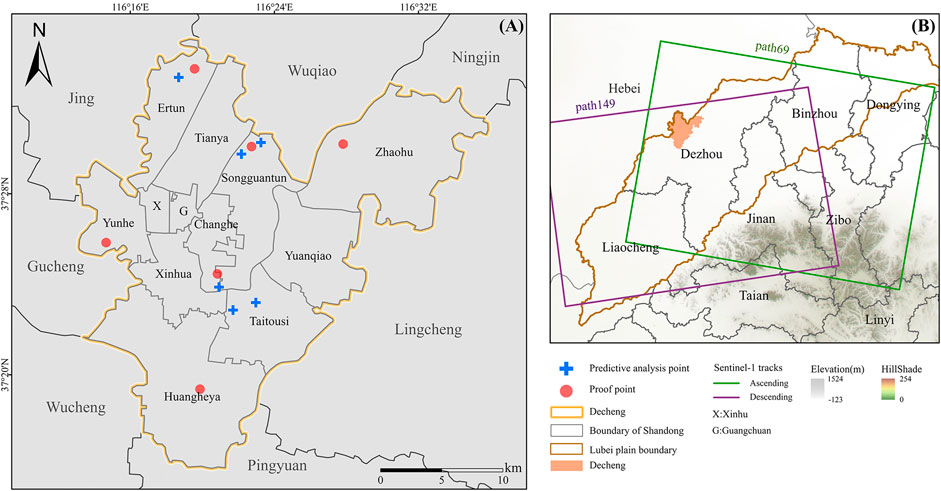
Figure 1. Geographical location of the study area. (A) Study area location; (B) Sentinel-1 data coverage.
Influenced by the Yanshan and Xishan movements, Decheng District is situated in a Cenozoic faulted basin, with a thick Cenozoic boundary. Depending on the burial depth, the strata relevant to human activities can be categorized into the Quaternary Plain Group, Neoproterozoic and Paleoproterozoic layers. The Quaternary Plain Formation includes the Holocene (Q4), Upper Pleistocene (Q3), Middle Pleistocene (Q2), and Lower Pleistocene (Q1) Formations. The upper part of the Quaternary Holocene Formation mainly comprises sandy clay and clayey sand, and the minimum floor buried depth is 15 m. The Upper Pleistocene is characterized by clayey sand and sandy clay, and the minimum floor buried depth is 50 m. The Middle Pleistocene is mainly clayey sandy soil and sandy clay, and contains a small amount of gypsum. The minimum floor buried depth is 100 m. The Lower Pleistocene Formation is comprising sandy clay, and contains a small amount of clayey sand, and the minimum floor burial depth reaches 160 m (Data source: Shandong Provincial Lubei Geo-engineering Exploration Institute).
Decheng District is located in the alluvial plain area of the middle and lower reaches of the Yellow River, and the strata with a ground elevation higher than 260 m comprise Quaternary sediments. The strata with a ground elevation ranging from 260 to 1,300 m are the sediments of the Minghua Town Formation. Quaternary sediments exhibit a high-water content, porosity and compressibility. In contrast, the water content, pore ratio and compressibility of the Minhua Town Group sediments are low. Groundwater in Decheng District mainly exists in the pores and fissures of the Quaternary and Minhua Town Group sediments. Influenced by the geological conditions, the groundwater aquifers in the area are distributed in a strip-like manner, and when viewed vertically, the aquifers in the clay-compression layer exhibit a discontinuous convex lens structure. Within the clay-compression layer, clays and pulverized clays constitute a relative water barrier, but there is no completely continuous water barrier. Between the upper and lower aquifers, overflow can occur through the relatively weak permeable layer, thus creating a hydraulic connection. According to the burial depth, lithology, and mechanical and hydraulic characteristics, the shallow strata up to 800 m in Decheng District can be divided into eight aquifers, nine compression layers, and one topsoil layer (Figure 2), of which the third aquifer group (depth:300–500 m) and the fourth aquifer group (depth:500–800 m) are the main groundwater extraction layers (Data source: Shandong Provincial Lubei Geo-engineering Exploration Institute).
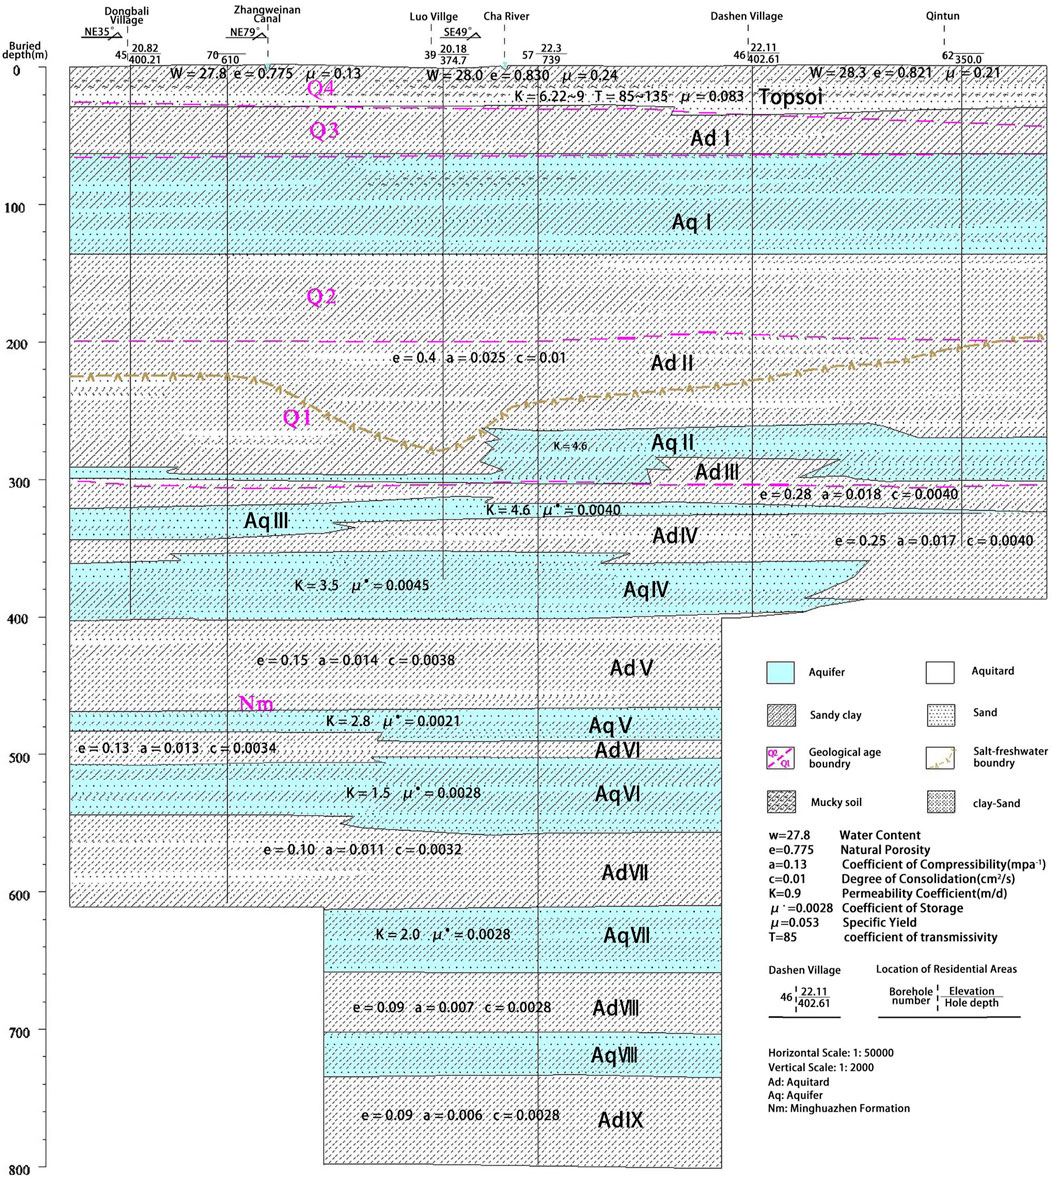
Figure 2. Hydrogeological profile of Decheng District (modified from Yang (2009)).
In this study, we use the 114 ascending views of Sentinel-1data from 2017 to 2021. Then, the land subsidence of Decheng district is obtained by PS-InSAR technology. In addition, to validate the accuracy of the subsidence data, we selected 28 Sentinel-1 descending data from 2019 to 2021 to obtain subsidence information for comparison. Sentinel-1 is a constellation composed of two identical SAR satellites. Sentinel-1A and Sentinel-1B were launched on 3 April 2014, and 25 April 2016, respectively. Details of the selected image data are provided in Table 1. External digital elevation model (DEM) auxiliary data include Shuttle Radar Topology Mission (SRTM) V3.0 version provided by NASA, with a spatial resolution of 90 m.
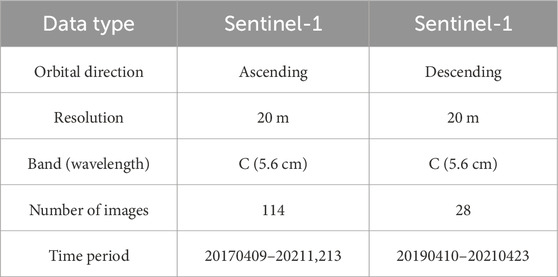
Table 1. Sentinel-1 dataset information.
PS-InSAR technology requires the use of amplitude and phase information to identify time-series SAR images of the same area. By analyzing the amplitude time series, pixels with higher amplitude values are selected as candidate permanent scatterers (PS). Next, the scattering characteristics of these PS candidates are analyzed for stability, further filtering out high-quality PS points and removing those likely affected by interference or noise, thereby improving the accuracy and reliability of interferometric measurements. Analyzing these PS points in the time series and considering the elimination of atmospheric phase effects help in calculating their movement relative to the satellite sensor. By considering information from densely sampled points over the entire area, land subsidence field information can be obtained.
We used the SARPROZ software to detect land subsidence in Decheng. Using the ascending view processing of Sentinel-1 data as an example, we selected the main image based on the principle of maximum overall coherence, considering factors such as temporal and spatial baselines and Doppler centroid frequency between the images. The other auxiliary images are then coregistered with the main image to generate a set of differential interferograms. After calculations, the image from 10 February 2019, is set as the main image, and other images are used as auxiliary images, generating 113 interferometric pairs. In the case of non-zero baseline, the phase obtained by interference is the sum of the phases contributed by many factors. The subsidence phase can be obtained using the PS-InSAR method by decomposing the interferometric phase as following Equation 1 (Zhu et al., 2017):
where φ is the differential interferometric phase obtained from the interferometric pairs,
The deform phase
According to previous research (Guo L et al., 2003), the horizontal displacement in Decheng area is much smaller than the vertical displacement, so the line-of-sight (LOS) subsidence can be converted into vertical subsidence using trigonometric transformation:
In Equation 2,
In this study, we established a three-dimensional numerical model for unsteady groundwater flow using MODFLOW-2000 in Groundwater Modeling Systems (GMS) software, and a land subsidence model was constructed by using the SUB package Based on Terzaghi’s one-dimensional consolidation theory, the land subsidence model can accurately predict land subsidence by simulating the delayed drainage and compression processes of low permeability layers and interlayers over time. To further optimize the model, the subsidence field monitored by PS-InSAR was used to adjust the parameters of the subsidence model and verify the prediction results. Finally, we established various groundwater extraction scenarios based on the subsidence control objectives in Dezhou city. These scenarios were used to analyze the changes in land subsidence in Decheng District from 2023 to 2025. The technical flowchart is shown in Figure 3.
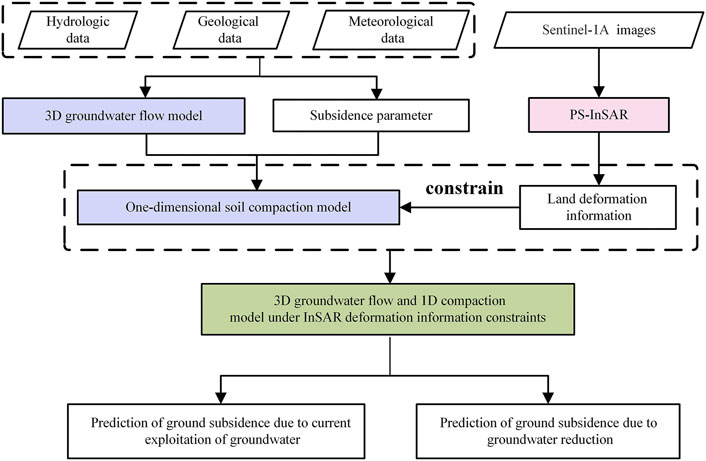
Figure 3. Technical flow chart.
Seepage is the flow of water or other liquids through a geotechnical medium. Below the water table air is scarce in the geotechnical medium and the pores are mainly filled by water. Groundwater mining leads to a decline in pore pressure, which increases effective stress and causes compaction. Therefore, to simulate land subsidence in the soil and water model, the first step is to establish a seepage model to understand groundwater flow. Based on Darcy’s law, the 3D flow differential equation of groundwater is shown in Equation 3:
where (x, y, z) ∈
The solution conditions for the 3D flow differential equations of groundwater are the initial conditions as well as the boundary conditions, which can be expressed as follows:
In Equation 4,
In this paper, according to borehole data and hydrogeological reports of the study area, the complex hydrogeological conditions in Decheng District are generalized and stratified by using GMS. We categorize soil layers with similar hydrogeological characteristics within the study area into a single layer. The strata below 460 m in the Decheng District are divided into five layers. The first four layers correspond to the topsoil layer, the first compression layer, the first aquifer, the second compression layer, and the second aquifer as depicted in Figure 2. Influenced by groundwater mining, the third to fifth aquifers exhibit unified hydraulic connections and similar hydrogeological conditions, leading to their consolidation into a single aquifer group. The fifth layer of the model corresponds to this aquifer group. Shallow groundwater is associated with the topsoil layer, while deep groundwater corresponds to the fifth layer of the model. We use a rectangular grid tool to divide the study area into a 5-layer grid with 110 rows and 110 columns, totaling 12,100 cells, as shown in Figure 4. The lateral boundaries of the model are generalized as general head boundaries, with boundary flow rates calculated according to Darcy’s Law. Vertically, since the upper boundary receives atmospheric precipitation infiltration and agricultural irrigation return recharge, and groundwater is discharged through evaporation, the upper boundary is treated as a surface recharge-discharge boundary; the bottom boundary is generalized as a water-impermeable boundary.
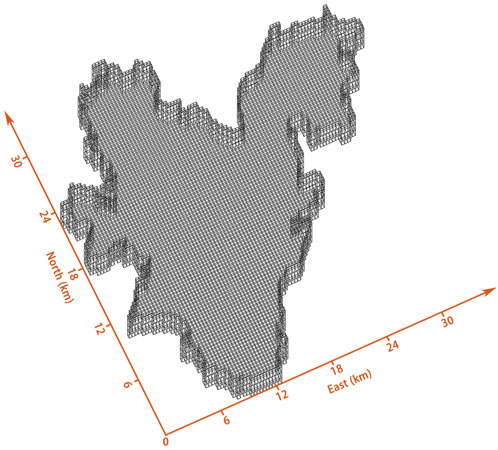
Figure 4. Three-dimensional numerical simulation grid map of Decheng District.
Based on the data from the water resources bulletin, statistical yearbook, and groundwater level data from the China Geological Environmental Monitoring Institute (https://geocloud.cgs.gov.cn), we have constructed our groundwater data set. We determine the initial conditions of groundwater flow field and construct a three-dimensional numerical model of unsteady groundwater flow by using MODFLOW. In this paper, the initial parameter values were based on empirical hydrogeological parameters. We compare the observed groundwater level with the calculated groundwater level, and then adjust the model parameters by trial estimation-correction method until the calculated results meet the model prediction standards. The adjusted model parameter values are shown in Table 2.
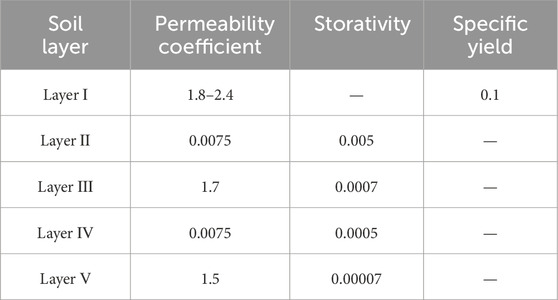
Table 2. Values of hydrogeological parameters for each layer.
Based on the numerical model of three-dimensional unsteady groundwater flow in Decheng district, three-dimensional groundwater flow and one-dimensional compaction model is established by combining Terzaghi consolidation theory. We then compared subsidence information from InSAR monitoring with the model’s results, adjusting parameters to improve the model’s accuracy.
In Terzaghi’s consolidation theory, it is assumed that clay drains vertically, groundwater only flows vertically, and soil only undergoes vertical compressive subsidence, ignoring horizontal strain, thus yielding the following differential equation of seepage consolidation, as shown in Equation 5:
where
According to Terzaghi’s consolidation theory, for linearly elastic soils, the vertical subsidence caused by the pumping process can be shown in Equation 6:
where
where
In the three-dimensional flow differential equation of groundwater, the amount of water storage change per unit volume of water-containing medium per unit time can be divided into the water storage change of the compressible layer and the water storage change of other water-containing media. Distinguishing the soil skeleton specific storage between elastic and inelastic can be obtained:
In Equation 8,
The coupling of a three-dimensional groundwater flow model and a one-dimensional soil subsidence model can be achieved.
In this paper, a 1D subsidence model is established in the SUB package. After calibrating the model and obtaining results that met generally accepted calibration criteria, the elastic (reversible) and inelastic (irreversible) subsidences of sediments in the aquifer was simulated by SUB package. We need to assign parameters to different layers, such as the vertical hydraulic conductivity, pre-consolidation hydraulic head, initial hydraulic head, equivalent interlayer thickness, the elastic and inelastic skeletal component of specific storage. The mathematical model is solved by three-dimensional finite difference program MODFLOW, and the land subsidence is solved by SUB package. Based on the subsidence information obtained from InSAR, we know that the land subsidence is serious in Yuanqiao Town in the north of the study area. When correcting the model, we choose the subsidence data from InSAR to compare with the simulation data of Yuanqiao Town. At the same time, according to the comparison results, the model parameters are constantly modified until the model accuracy meets the predictable standard.
We use the PS-InSAR method to obtain subsidence information from both descending and ascending Sentinel-1 data in Decheng District. We verify the accuracy of our subsidence data by comparing the results from these two datasets. As shown in Figure 5A, the correlation between the two InSAR monitoring results is 0.95. Histograms are generated based on the differences between the two sets of InSAR monitoring results. and as shown in Figure 5B, the mean value of the deviation of the two sets of results is 3.56 mm/a, and the standard deviation is 13.59 mm/a. The consistency of subsidence monitoring results of two different InSAR data sets further shows the reliability of InSAR monitoring results.
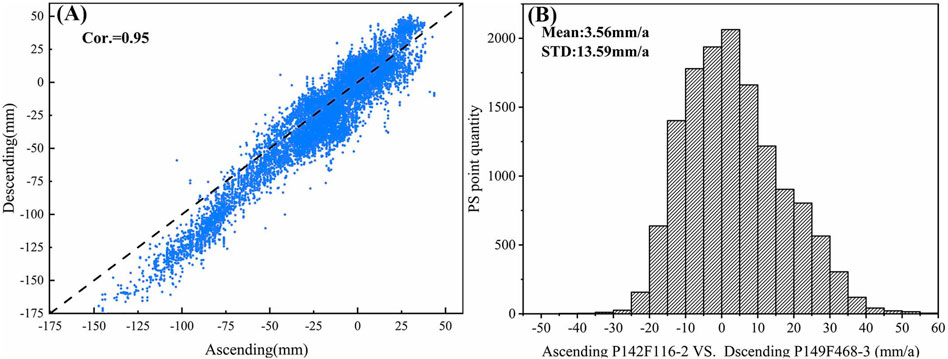
Figure 5. Accuracy verification of InSAR data. (A) Consistency of the PS-InSAR monitoring results for the ascending and descending orbits; (B) Distribution of the differences in the PS-InSAR monitoring results for the ascending and descending orbits.
As shown in Figure 6, from May 2017 to December 2021, the maximum cumulative subsidence in Decheng District reached −173 mm, the subsidence area mainly occurs in the northern part of Decheng District. The center of subsidence is located in the northern part of the city near Yuanqiao town. The maximum annual subsidence rates from 2018 to 2021 are −43 mm/yr, −46 mm/yr, −43 mm/yr, and −42 mm/yr, respectively (Figure 7). These rates indicate that the land subsidence development rate in Decheng District remains relatively stable. The subsidence survey of the Shandong Geological and Mineral Exploration and Development Bureau showed that the land subsidence area in Decheng District was located in the western part of Decheng District from 1991 to 2016, and the center of the subsidence occurred near the No. One National Cotton Factory (Figure 8). Compared with the subsidence monitoring results of this study, the land subsidence center in Decheng District has been transferred from the vicinity of Guomian No.1 Factory to the vicinity of Qiaoyuan Town.
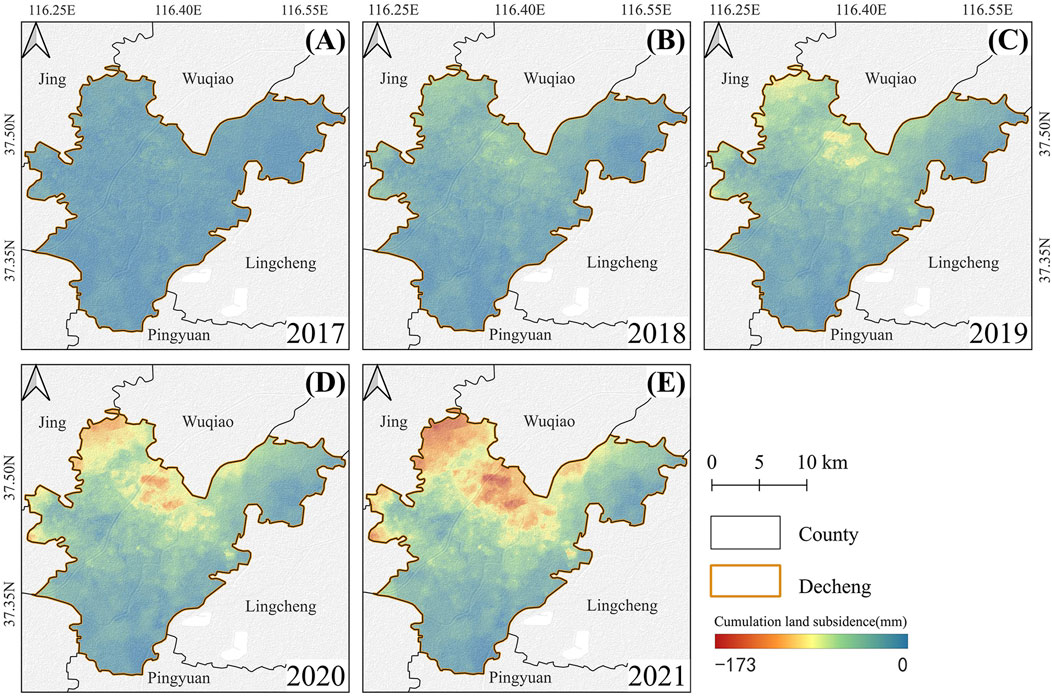
Figure 6. Cumulative subsidence in Decheng District from May 2017 to December 2021. (A) Cumulative subsidence from May to December 2017; (B) Cumulative subsidence from May 2017 to December 2018; (C) Cumulative subsidence from May 2017 to December 2019; (D) Cumulative subsidence from May 2017 to December 2020; (E) Cumulative subsidence from May 2017 to December 2021.
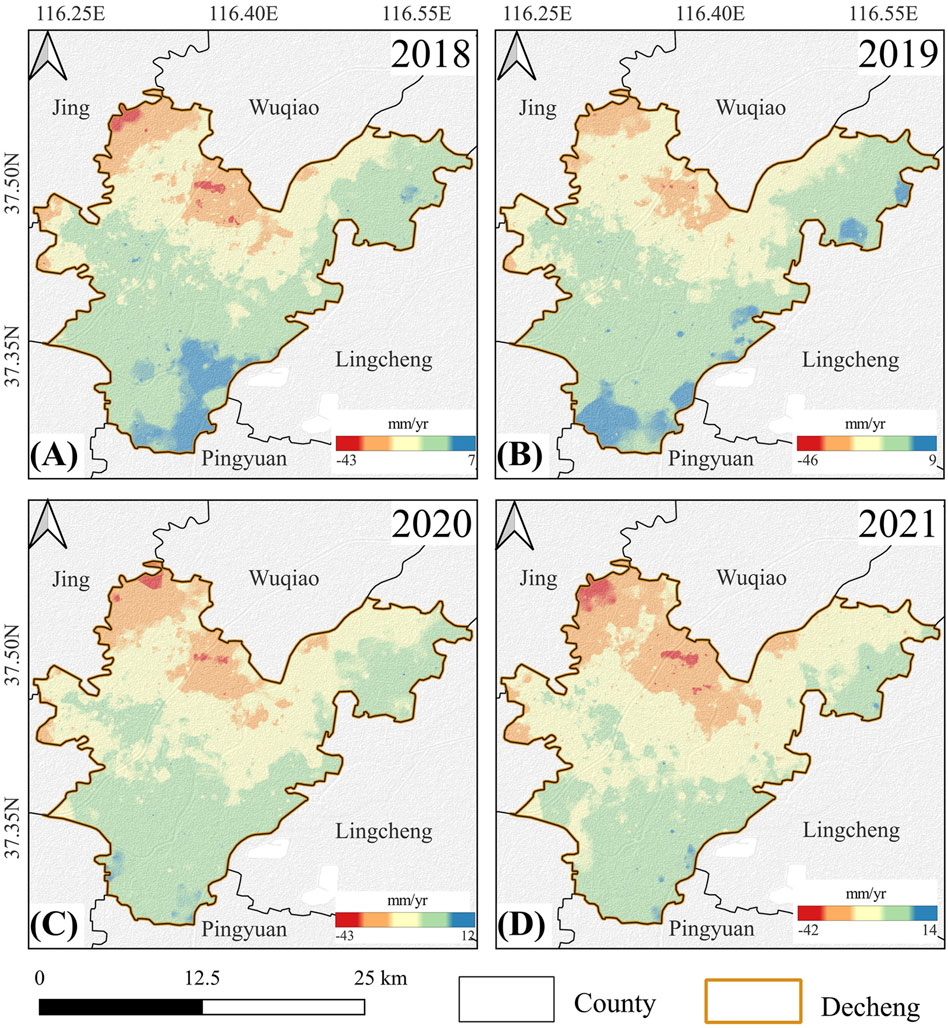
Figure 7. Average annual rate of subsidence in Decheng District from 2018 to 2021. (A) Average annual subsidence rate in 2018; (B) Average annual subsidence rate in 2019; (C) Average annual subsidence rate in 2020; (D) Average annual subsidence rate in 2021.
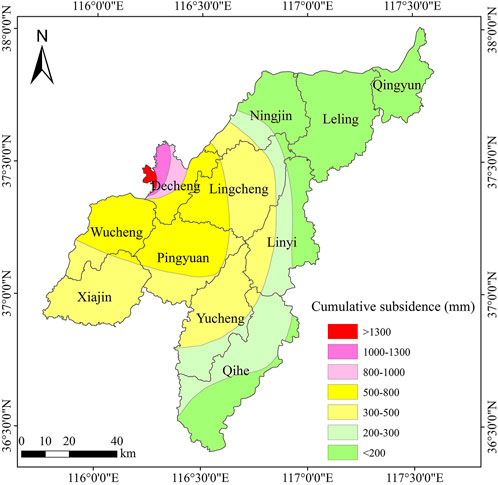
Figure 8. Cumulative subsidence in Dezhou from 1991 to 2016 (modified from Jia et al. (2021)).
In this study, the set identification period ranged from January 2018 to December 2020, and the validation period ranged from January 2021 to December 2021. We used the shallow and deep groundwater flow fields from January 2018 as the initial conditions, and the groundwater flow field from January 2020 as the final fitting conditions. Groundwater flow field data and well monitoring values were used to validate the model calculations. It can be seen from Figure 9 that the fitting of shallow and deep groundwater flow can meet the requirements of the model. At the same time, the measured value of water well is compared with the calculated value of model. Based on Figure 10, the simulated groundwater levels are generally at the same level as the actual groundwater levels. The actual groundwater levels show significant seasonal fluctuations, with a maximum difference of 1.2 m. Most of the time, the error is within 1 m, which is within an acceptable range. Due to the lack of deep groundwater well monitoring data, the accuracy of the simulation results is based on the flow field comparison results shown in Figure 9.
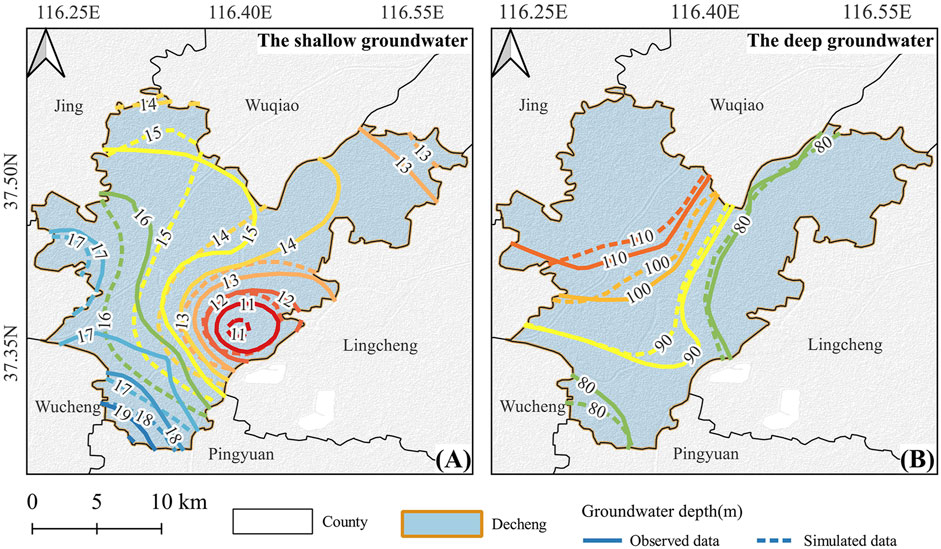
Figure 9. Validation of shallow and deep groundwater flow depth(m) in January 2020, the solid line represents the measured groundwater depth, while the dashed line represents the simulated groundwater depth: (A) Verification of the shallow groundwater flow field; (B) Verification of the deep groundwater flow field.
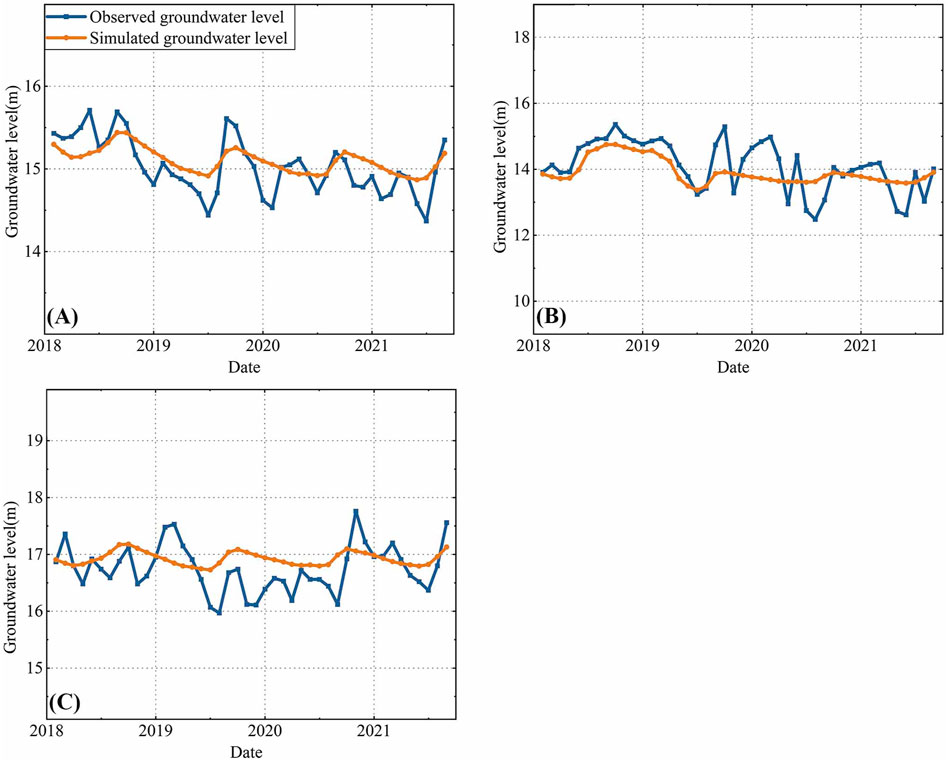
Figure 10. Comparison of the simulation results and the monitoring results of the wells in the shallow layer: (A-C) Comparison of the monitored and simulated groundwater depth for three wells.
In the SUB package of GMS software, the initial subsidence is set to the cumulative subsidence from May 2017 to December 2017. We compared the InSAR monitoring results from 2018 to 2020 with the model simulations and adjusted the model parameters. The land subsidence in 2021 is then simulated and verified against InSAR monitoring results. The numerical simulation results of land subsidence rates in Decheng District for 2021 were compared and analyzed with the InSAR monitoring results. Figure 11 indicates that the model effectively reflects the distribution characteristics of land subsidence in Decheng District for 2021.
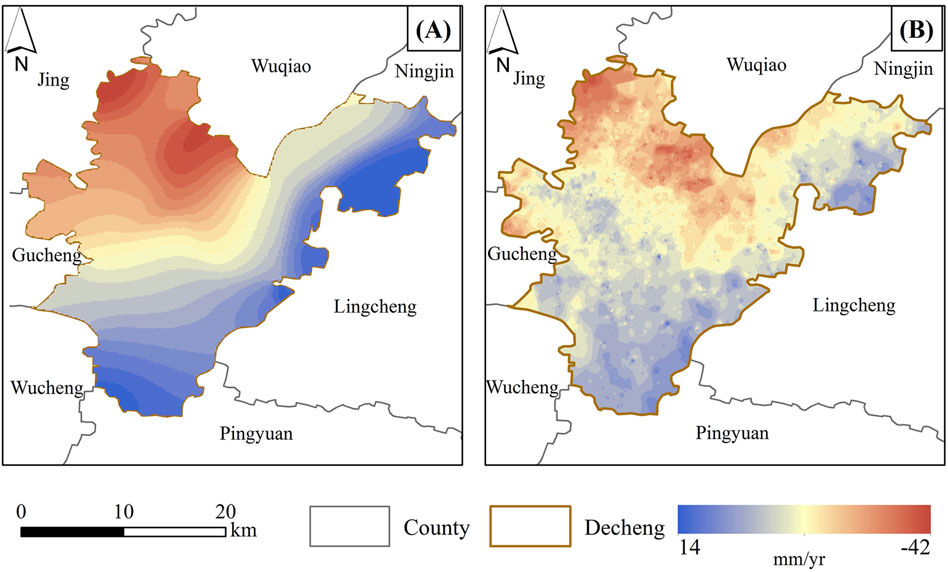
Figure 11. Comparison between the InSAR monitoring results and the simulation results of the subsidence rate in 2021 (mm/yr): (A) Simulation results; (B) InSAR monitoring results.
To better illustrate the land subsidence simulation results for different areas, we select six validation points at the center of the subsidence funnel, the edge of the subsidence funnel, and the area without serious subsidence, and the locations of the validation points are shown with red markers in Figure 1. The land subsidence simulation results for each validation point were compared and validated against the InSAR monitoring results for the period from 2018 to 2021.
As shown in Figure 12, the validation results indicate that the overall fitting effect at each validation point is favorable. The maximum difference between the simulation results and the actual land subsidence does not exceed 10 mm, demonstrating that the numerical simulation model accurately reflects the real land subsidence trend. This confirms that using PS-InSAR monitoring data as constraints to improve the simulation accuracy of the land subsidence model is effective, meeting the needs for subsidence prediction and subsequent analysis.
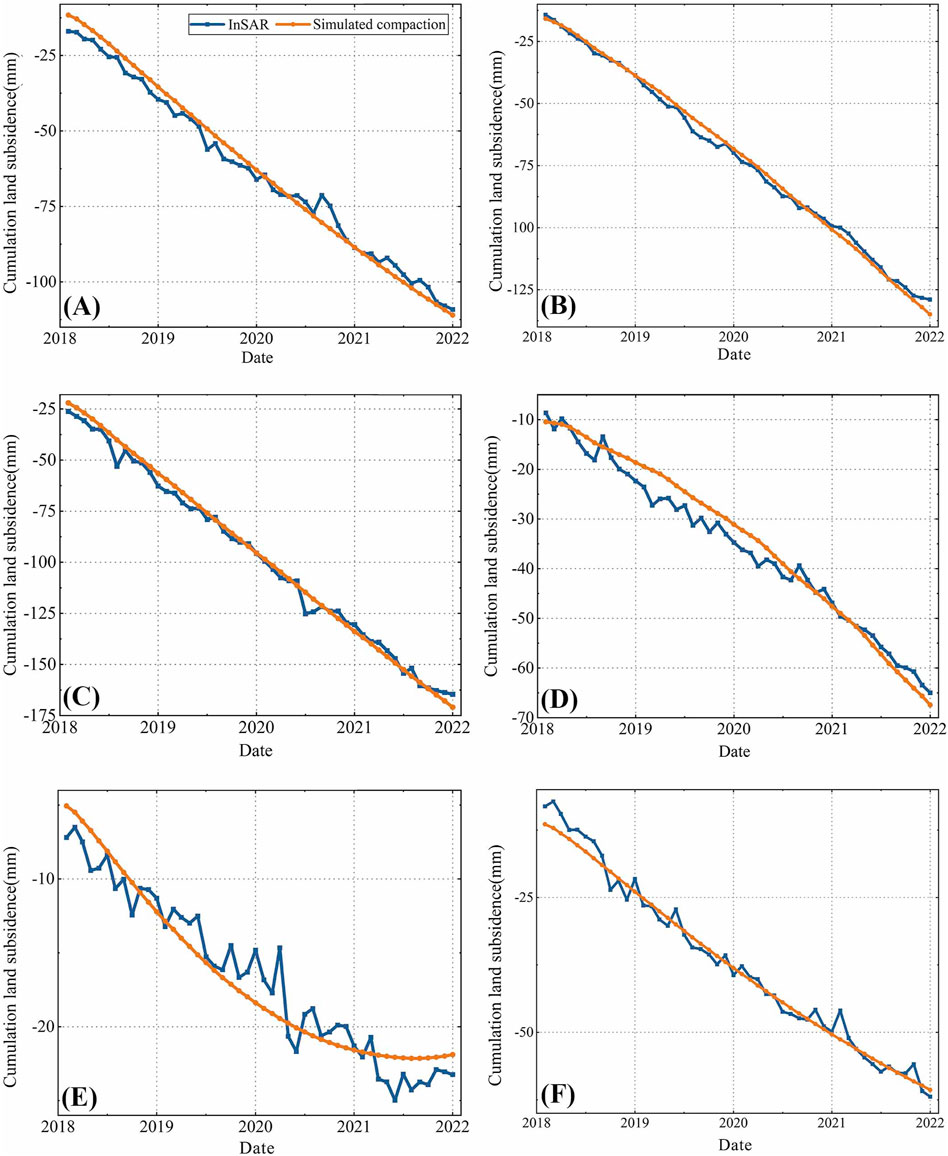
Figure 12. Comparison of the cumulative land subsidence simulation results with the InSAR data. (A–E) Comparison of subsidence monitoring values and simulated values at six verification points.
Based on the established 3D groundwater flow and 1D compaction model with InSAR constraints for Decheng District, we simulated land subsidence in the study area from 2022–2025. We use May 2017 as the initial time with cumulative subsidence, and the groundwater extraction rates from 2021 are used as current extraction rates for subsidence prediction.
Under the condition of maintaining the current groundwater exploitation state, as indicated in Figure 13, the location of most areas exhibiting notable subsidence in Decheng District did not change significantly, and they are still mainly concentrated in the northern, eastern and northeastern areas of Decheng District, with subsidence showing a trend of continued development and increase. By December 2025, the maximum cumulative land subsidence amount in Decheng District will reach 303 mm, with the center of subsidence near Songguantun Street and Yuanqiao town. In the study area, regions with an average annual subsidence rate exceeding 30 mm/yr include the areas around Ertun Town, Tianqu Street, Songguantun Street, Qiaoyuan Town, and Zhaohu Town, particularly near the boundary of Decheng District. Additionally, parts of the western section of Yunhe Street also have an average annual subsidence rate exceeding 30 mm/yr.
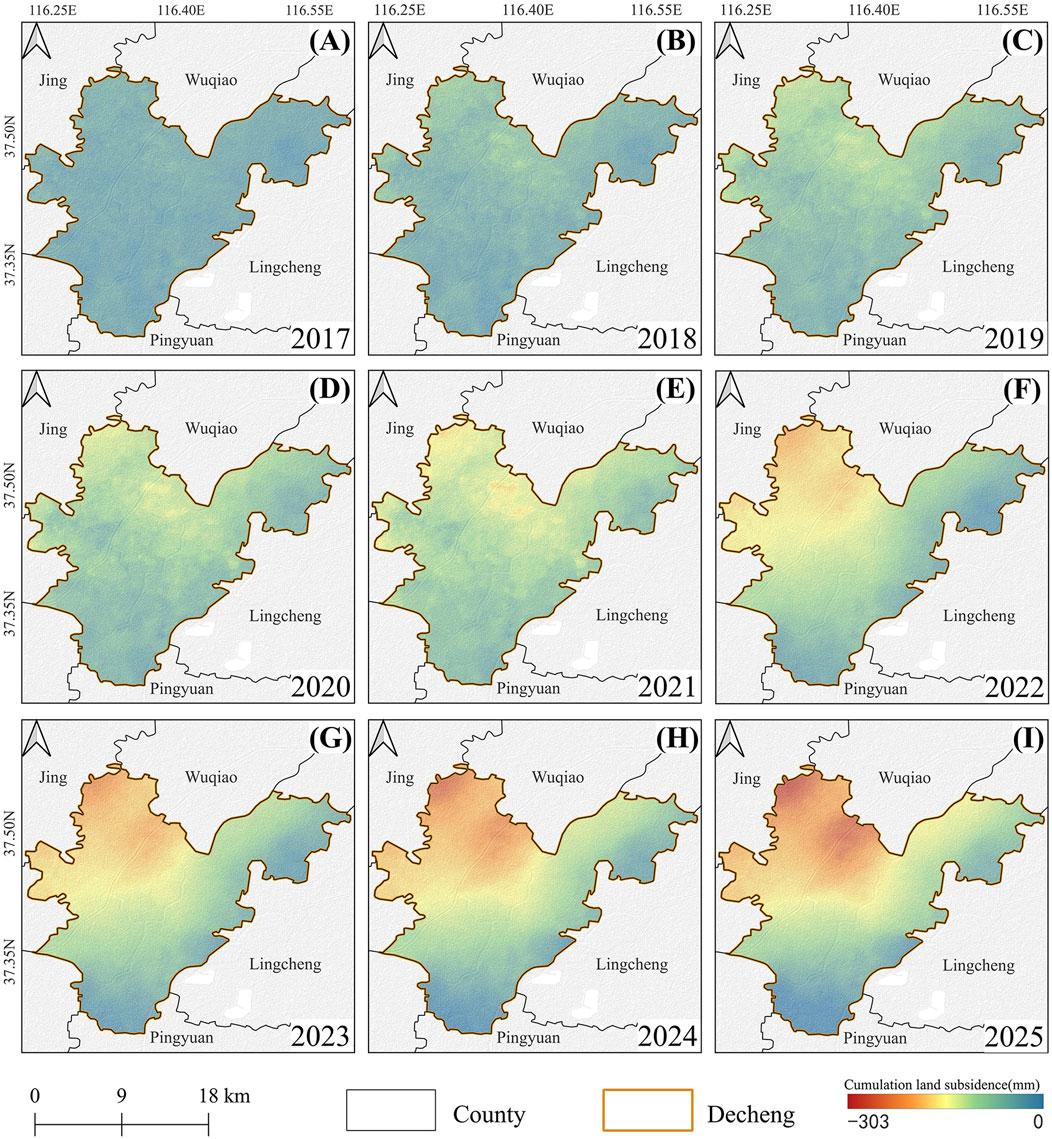
Figure 13. Cumulative land subsidence in Decheng city from 2017–2025. (A-E) 2017–2021 for the InSAR monitoring results; (F-I) 2022–2025 for the numerical modeling results.
Based on the Land Subsidence Prevention Planning in Dezhou City, Shandong Province (2018–2025)” control targets, aiming for a land subsidence rate of less than 35 mm/yr at the center of subsidence in key prevention areas by 2025, we established three groundwater extraction scenarios: reductions of 10%, 30%, and 50%. We simulated land subsidence in Decheng District under these scenarios and created annual subsidence rate maps for 2023 to 2025, as shown in Figure 14.
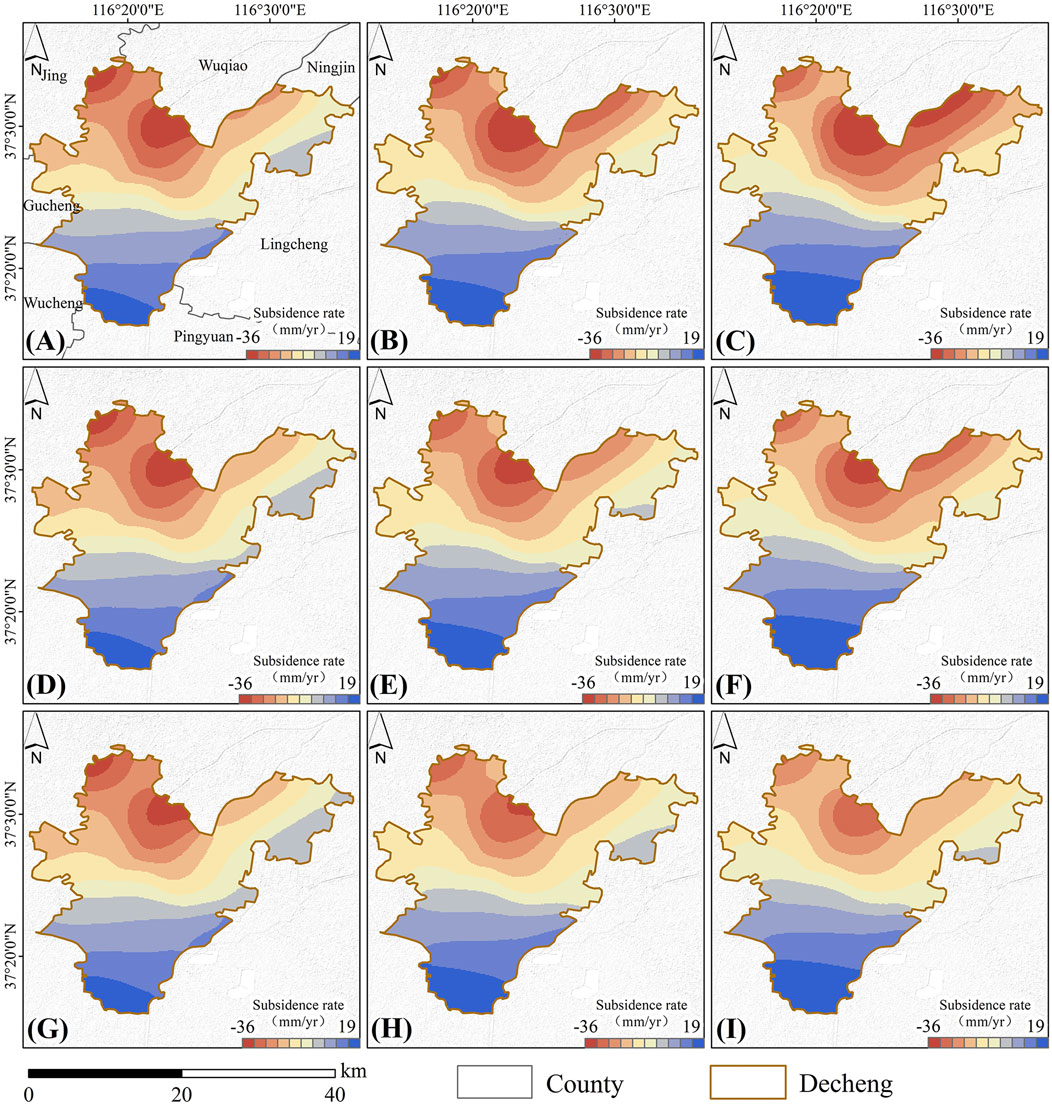
Figure 14. Annual subsidence rate of Decheng District from 2023 to 2025 under different groundwater extraction scenarios: (A-C) Subsidence rate for each year under Scenario I; (D-F) Subsidence rate for each year under Scenario II; (G-I) Subsidence rate for each year under Scenario III.
As shown in Figure 14, the location of the center of land subsidence remains the same in the same year under the different groundwater extraction scenarios, and land subsidence declines with decreasing groundwater extraction. Under Scenario I, the annual subsidence rate at the center of land subsidence is 34 mm/yr in 2023, increases to 36 mm/yr in 2024, and remains at 36 mm/yr in 2025. Although the rate of land subsidence is inhibited, the rate of land subsidence remains stable in the different years. Under the reduced mining conditions of Scenario II, the land subsidence rate in the study area shows a decreasing state year by year, and the annual subsidence rate at the center of subsidence declines from 34 to 32 mm/yr. The annual subsidence rate at the center of subsidence under this scenario is less than 35 mm/yr in 2025, which meets the subsidence governance requirements contained in Land Subsidence Prevention Planning in Dezhou City, Shandong Province (2018–2025), for the key prevention and control areas. Under the mining reduction conditions of Scenario III, the mitigation effect of the land subsidence rate is more obvious, and the subsidence rate at the center is 30 mm/yr by 2025.
To compare the development of land subsidence at the subsidence center and the edge of the subsidence area under the different groundwater extraction scenarios, three points are selected at the subsidence center and the edge of the subsidence area. The locations of the selected points are shown with blue markers in Figure 1, and the cumulative land subsidence at each point under the three scenarios is obtained.
As shown in Figure 15, at the land subsidence centers such as points A, B and C, with the decrease of groundwater exploitation, the accumulated land subsidence is obviously reduced. When the groundwater is reduced by 30% and 50%, the subsidence rate (the slope of the cumulative subsidence curve) gradually decreases, and the land subsidence is controlled. At the edge of subsidence at points D, E and F, with the decrease of groundwater exploitation, the development rate of land subsidence decreases obviously. We choose point F as an example, and the groundwater reduction by 30% in rate of land subsidence is obviously lower than that by 10%. Under the condition of 50% reduction of groundwater exploitation, the cumulative subsidence at this point in September, October and November 2025 is 55.16 mm, 55.38 mm and 55.60 mm respectively, and the development of land subsidence at this point tends to stop. The edge points of other similar subsidence areas rebound with time under the condition of groundwater reduction in Scenario II and Scenario III.
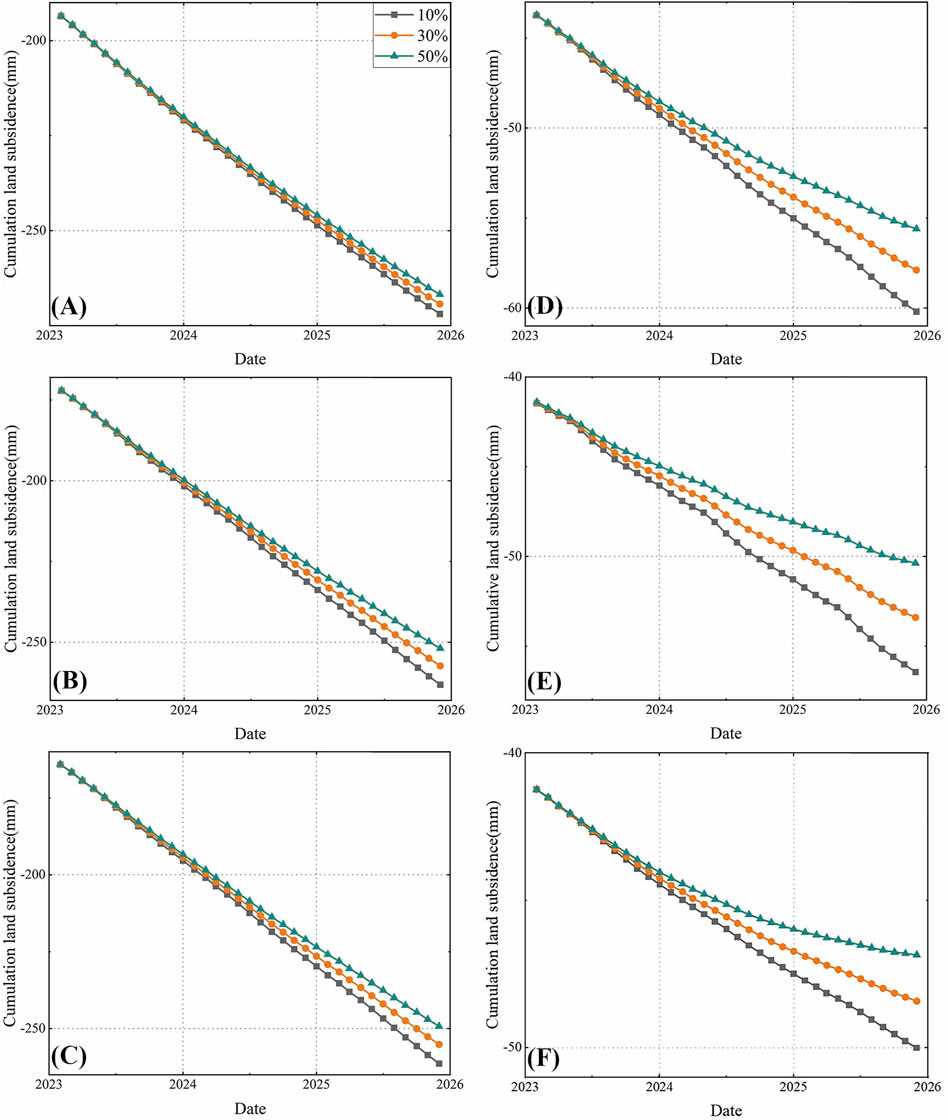
Figure 15. Comparison of the cumulative land subsidence under the different groundwater extraction scenarios: (A-C) Points of subsidence center area; (D-F) Points of subsidence edge area.
The above analysis demonstrates that the mitigation effect of reducing groundwater mining on land subsidence is obvious. Under the reduced mining conditions of Scenarios II and III, the subsidence rates at the center of Decheng District in 2025 will reach 32 and 30 mm/yr, respectively, which are less than 35 mm/yr, and the prevention and control target of the key prevention and control zone of land subsidence can be reached.
In this study, the PS-InSAR method is used to obtain time-series information on land subsidence in Decheng District from 2017 to 2021 and to analyze the spatial and temporal evolution characteristics of land subsidence. three-dimensional groundwater flow and one-dimensional compaction model under InSAR subsidence information constraints is constructed to predict the change in land subsidence in Decheng District from 2022 to 2025. Finally, the development of land subsidence under different groundwater exploitation scenarios is investigated based on the target of controlling subsidence in Dezhou city. The main conclusions are as follows.
(1) The InSAR monitoring results show that the maximum cumulative subsidence in Decheng District is −173 mm. Combined with previous land subsidence monitoring results, it is found that the center of land subsidence in Decheng District has shifted from the National Cotton No. One Factory to the vicinity of Yuanqiao town. During the study period, the size of the areas with low and medium subsidence development only slightly changed, while the areas with high subsidence development showed a decreasing stability trend.
(2) Three-dimensional groundwater flow and one-dimensional compaction model under InSAR subsidence information constraints is established for Decheng District, and the model prediction results show that under the current mining conditions, the maximum cumulative subsidence in Decheng District will reach 303 mm from May 2017 to December 2025, and the subsidence center will be near Songguantun Street and YuanQiao town. The area with an average annual subsidence rate of 30 mm/yr or more occurs in the area near Ertun town-Tianqu Street-Songguantun Street-Yuanqiao town-Zhaohu town, as well as in the western part of Yunhe Street. In the case of a 30% reduction in groundwater extraction in Decheng District, the subsidence rate decreases year by year, the subsidence rate at the subsidence center will reach 33 mm/yr in 2025, and the subsidence in some areas at the edge of the subsidence center declines or even tends to stop. Considering the comprehensive implementation effect and feasibility, a 30% reduction is a more economical and reasonable groundwater extraction choice.
The dataset used in this study cannot be made publicly available due to confidentiality agreements and privacy concerns. Requests to access the datasets should be directed to https://geocloud.cgs.gov.cn.
JH: Conceptualization, Data curation, Formal Analysis, Investigation, Validation, Visualization, Writing–original draft, Methodology, Software, Writing–review and editing. BC: Funding acquisition, Methodology, Project administration, Resources, Supervision, Writing–review and editing, Conceptualization. XC: Conceptualization, Data curation, Validation, Visualization, Software, Writing–review and editing. HG: Data curation, Resources, Supervision, Writing–review and editing. CZ: Funding acquisition, Methodology, Project administration, Resources, Supervision, Writing–review and editing. YY: Data curation, Investigation, Resources, Writing–review and editing. XS: Data curation, Investigation, Resources, Writing–review and editing. DZ: Data curation, Validation, Visualization, Writing–review and editing.
The author(s) declare that financial support was received for the research, authorship, and/or publication of this article. This work is supported by the National Natural Science Foundation of China (number 42371089/D0104), the Beijing Outstanding Young Scientist Program (BJJWZYJH01201910028032), the National Natural Science Foundation of China (number 41930109/D010702), the National Natural Science Foundation of China (number 42371081/D0104) and the National Natural Science Foundation of China (number 42201081/D0104).
The authors would like to express gratitude towards anonymous referees for their constructive comments and suggestions on how to improve this manuscript. We sincerely appreciate both the European Space Agency (ESA) for their great efforts in developing and distributing the remotely sensed SAR data and the National Aeronautics and Space Administration (NASA) for making the SRTM DEM data available. Our thanks also go to the creators of the GMS and ArcGIS software. We would also like to thank the China Geological Environment Monitoring Institute for releasing the monitoring data of underground wells to the public.
The authors declare that the research was conducted in the absence of any commercial or financial relationships that could be construed as a potential conflict of interest.
All claims expressed in this article are solely those of the authors and do not necessarily represent those of their affiliated organizations, or those of the publisher, the editors and the reviewers. Any product that may be evaluated in this article, or claim that may be made by its manufacturer, is not guaranteed or endorsed by the publisher.
Awasthi, S., Jain, K., Bhattacharjee, S., Gupta, V., Varade, D., Singh, H., et al. (2022). Analyzing urbanization induced groundwater stress and land deformation using time-series Sentinel-1 datasets applying PSInSAR approach. Sci. Total Environ. 844, 157103. doi:10.1016/j.scitotenv.2022.157103
Berardino, P., Fornaro, G., Lanari, R., and Sansosti, E. (2002). A new algorithm for surface deformation monitoring based on small baseline differential SAR interferograms. IEEE Trans. Geosci. Remote Sens. 40 (11), 2375–2383. doi:10.1109/TGRS.2002.803792
Blackwell, E., Shirzaei, M., Ojha, C., and Werth, S. (2020). Tracking California’s sinking coast from space: implications for relative sea-level rise. Sci. Adv. 6 (31), eaba4551. doi:10.1126/sciadv.aba4551
Bonì, R., Meisina, C., Cigna, F., Herrera, G., Notti, D., Bricker, S., et al. (2017). Exploitation of satellite A-DInSAR time series for detection, characterization and modelling of land subsidence. Geosci 7, 25. doi:10.3390/geosciences7020025
Bonì, R., Meisina, C., Teatini, P., Zucca, F., Zoccarato, C., Franceschini, A., et al. (2020). 3D groundwater flow and deformation modelling of Madrid aquifer. J. Hydrol. 585, 124773. doi:10.1016/j.jhydrol.2020.124773
Burbey, T. J., and Zhang, M. (2015). Inverse modeling using PS-InSAR for improved calibration of hydraulic parameters and prediction of future subsidence for Las Vegas Valley, USA. Proc. Int. Assoc. Hydrological Sci. 372 (372), 411–416. doi:10.5194/piahs-372-411-2015
Ceccatelli, M., Del Soldato, M., Solari, L., Fanti, R., Mannori, G., and Castelli, F. (2021). Numerical modelling of land subsidence related to groundwater withdrawal in the Firenze-Prato-Pistoia basin (central Italy). Hydrogeol. J. 29 (2), 629–649. doi:10.1007/s10040-020-02255-2
China Geological Environmental Monitoring Institute “Geo cloud,” in National groundwater monitoring network. (2022). Available at: https://geocloud.cgs.gov.cn.
Costantini, M., Ferretti, A., Minati, F., Falco, S., Trillo, F., Colombo, D., et al. (2017). Analysis of surface deformations over the whole Italian territory by interferometric processing of ERS, Envisat and COSMO-SkyMed radar data. Remote Sens. Environ. 202, 250–275. doi:10.1016/j.rse.2017.07.017
Dong, J., Guo, S., Wang, N., Zhang, L., Ge, D., Liao, M., et al. (2023). Tri-decadal evolution of land subsidence in the Beijing Plain revealed by multi-epoch satellite InSAR observations. Remote Sens. Environ. 286, 113446. doi:10.1016/j.rse.2022.113446
Ezquerro, P., Tomás, R., Béjar-Pizarro, M., Fernández-Merodo, J. A., Guardiola-Albert, C., Staller, A., et al. (2020). Improving multi-technique monitoring using Sentinel-1 and Cosmo-SkyMed data and upgrading groundwater model capabilities. Sci. Total Environ. 703, 134757. doi:10.1016/j.scitotenv.2019.134757
Fernández-Merodo, J. A., Ezquerro, P., Manzanal, D., Béjar-Pizarro, M., Mateos, R. M., Guardiola-Albert, C., et al. (2021). Modeling historical subsidence due to groundwater withdrawal in the Alto Guadalentín aquifer-system (Spain). Eng. Geol. 283, 105998. doi:10.1016/j.enggeo.2021.105998
Ferretti, A., Prati, C., and Rocca, F. (2000). Nonlinear subsidence rate estimation using permanent scatterers in differential SAR interferometry. IEEE Trans. Geosci. Remote Sens. 38 (5), 2202–2212. doi:10.1109/36.868878
Foroughnia, F., Nemati, S., Maghsoudi, Y., and Perissin, D. (2019). An iterative PS-InSAR method for the analysis of large spatio-temporal baseline data stacks for land subsidence estimation. Int. J. Appl. EARTH Obs. 74, 248–258. doi:10.1016/j.jag.2018.09.018
Gabriel, A. K., Goldstein, R. M., and Zebker, H. A. (1989). Mapping small elevation changes over large areas: differential radar interferometry. J. GEOPHYS RES-SOL Ea. 94 (B7), 9183–9191. doi:10.1029/JB094iB07p09183
Galloway, D. L., and Burbey, T. J. (2011). Review: regional land subsidence accompanying groundwater extraction. Hydrogeol. J. 19, 1459–1486. doi:10.1007/s10040-011-0775-5
Galloway, D. L., and Hoffmann, J. (2007). The application of satellite differential SAR interferometry-derived ground displacements in hydrogeology. Hydrgeol J. 15 (1), 133–154. doi:10.1007/s10040-006-0121-5
Gambolati, G., and Freeze, R. A. (1973). Mathematical simulation of the subsidence of Venice: 1. Theory. Water Resour. Res. 9 (3), 721–733. doi:10.1029/WR009i003p00721
Guo, L., Bo, W., and Yang, G. (2003). Characteristics of current subsidence of fault belts in North China. Crustal Subsidence Earthq. 23, 29–36.
Haghighi, M. H., and Motagh, M. (2019). Ground surface response to continuous compaction of aquifer system in Tehran, Iran: results from a long-term multi-sensor InSAR analysis. Remote Sens. Environ. 221, 534–550. doi:10.1016/j.rse.2018.11.003
Herrera-García, G., Ezquerro, P., Tomás, R., Béjar-Pizarro, M., López-Vinielles, J., Rossi, M., et al. (2021). Mapping the global threat of land subsidence. Science 371 (6524), 34–36. doi:10.1126/science.abb8549
Hoffmann, J., Galloway, D. L., and Zebker, H. A. (2003). Inverse modeling of interbed storage parameters using land subsidence observations, Antelope Valley, California. Water Resour. Res. 39 (2). doi:10.1029/2001WR001252
Hooper, A., Zebker, H., Segall, P., and Kampes, B. (2004). A new method for measuring deformation on volcanoes and other natural terrains using InSAR persistent scatterers. Geophys Res. Lett. 31 (23). doi:10.1029/2004GL021737
Jia, C., Zhang, S. P., Sun, X. X., Geng, S. T., and Ding, P. P. (2021). Correlation between groundwater exploitation and land subsidence in northwest plain of Shandong province. China Scipap 16 (2), 173–180.
Kihm, J. H., Kim, J. M., Song, S. H., and Lee, G. S. (2007). Three-dimensional numerical simulation of fully coupled groundwater flow and land deformation due to groundwater pumping in an unsaturated fluvial aquifer system. J. Hydrol. 335 (1-2), 1–14. doi:10.1016/j.jhydrol.2006.09.031
Leake, S. A. (1990). Interbed storage changes and compaction in models of regional groundwater flow. Water Resour. Res. 26, 1939–1950. doi:10.1029/WR026i009p01939
Li, C. Z., and Zhou, Z. F. (2006). Summary of numerical calculation model of land subsidence and fluid-solid coupling theory. Investig. Sci. Technol. 2006 (06), 14–20.
Li, H. (2017). Numerical simulation analysis of ground subsidence induced by groundwater [D]. CMFD. Shandong University.
Lin, P. L., Hsu, K. C., Lin, C. W., and Hwung, H. H. (2015). Modeling compaction of multi-layer-aquifer system due to groundwater withdrawal. Eng. Geol. 187, 143–155. doi:10.1016/j.enggeo.2015.01.002
Mahmoudpour, M., Khamehchiyan, M., Nikudel, M. R., and Ghassemi, M. R. (2016). Numerical simulation and prediction of regional land subsidence caused by groundwater exploitation in the southwest plain of Tehran, Iran. Iran. Eng. Geol. 201, 6–28. doi:10.1016/j.enggeo.2015.12.004
Mateos, R. M., Ezquerro, P., Luque-Espinar, J. A., Béjar-Pizarro, M., Notti, D., Azañón, J. M., et al. (2017). Multiband PSInSAR and long-period monitoring of land subsidence in a strategic detrital aquifer (Vega de Granada, SE Spain): An approach to support management decisions. J. Hydrol. 553, 71–87. doi:10.1016/j.jhydrol.2017.07.056
Miller, M. M., and Shirzaei, M. (2015). Spatiotemporal characterization of land subsidence and uplift in Phoenix using InSAR time series and wavelet transforms. J. Geophys Res. Solid Earth 120 (8), 5822–5842. doi:10.1002/2015JB012017
Motagh, M., Shamshiri, R., Haghighi, M. H., Wetzel, H. U., Akbari, B., Nahavandchi, H., et al. (2017). Quantifying groundwater exploitation induced subsidence in the Rafsanjan plain, southeastern Iran, using InSAR time-series and in situ measurements. Eng. Geol. 218, 134–151. doi:10.1016/j.enggeo.2017.01.011
Ochoa-González, G. H., Carreón-Freyre, D., Franceschini, A., Cerca, M., and Teatini, P. (2018). Overexploitation of groundwater resources in the faulted basin of Querétaro, Mexico: a 3D deformation and stress analysis. Eng. Geol. 245, 192–206. doi:10.1016/j.enggeo.2018.08.014
Peng, M., Lu, Z., Zhao, C., Motagh, M., Bai, L., Conway, B. D., et al. (2022). Mapping land subsidence and aquifer system properties of the Willcox Basin, Arizona, from InSAR observations and independent component analysis. Remote Sens. Environ. 271, 112894. doi:10.1016/j.rse.2022.112894
Teatini, P., Ferronato, M., Gambolati, G., and Gonella, M. (2006). Groundwater pumping and land subsidence in the Emilia-Romagna coastland, Italy: modeling the past occurrence and the future trend. Water Resour. Res. 42 (1). doi:10.1029/2005WR004242
Terzaghi, K. (1925). Principles of soil mechanics. IV. Settlement and consolidation of clay. Eng. News-Rec 95, 874.
Wang, M. Z., and Wan, J. W. (2020). Analysis and suggestions on land subsidence control in Dezhou city. Geol. Surv. China (03), 96–103.
Yang, L. Z. (2009). Form principle and controlling-adjusting research about deep groundwater depression cone in Dezhou. Chin Acad Geol Sci.
Zhang, Y., and Xue, Y. Q. (2002). Research status and prospect of mathematical model of pumping ground subsidence. Chin. J. Geol. Hazard Control 13 (2), 1–6.
Zhao, Y., Wang, C., Yang, J., and Bi, J. (2021). Coupling model of groundwater and land subsidence and simulation of emergency water supply in Ningbo urban Area, China. J. Hydrol. 594, 125956. doi:10.1016/j.jhydrol.2021.125956
Keywords: subsidence, InSAR, fluid-solid coupled model, numerical simulation, groundwater exploitation
Citation: Hu J, Chen B, Chu X, Gong H, Zhou C, Yang Y, Sun X and Zhao D (2024) Simulation and prediction of land subsidence in Decheng District under the constraint of InSAR deformation information. Front. Earth Sci. 12:1458416. doi: 10.3389/feart.2024.1458416
Received: 02 July 2024; Accepted: 19 August 2024;
Published: 03 September 2024.
Edited by:
Chong Xu, National Institute of Natural Hazards, Ministry of Emergency Management (China), ChinaReviewed by:
Chaoying Zhao, Chang’an University, ChinaCopyright © 2024 Hu, Chen, Chu, Gong, Zhou, Yang, Sun and Zhao. This is an open-access article distributed under the terms of the Creative Commons Attribution License (CC BY). The use, distribution or reproduction in other forums is permitted, provided the original author(s) and the copyright owner(s) are credited and that the original publication in this journal is cited, in accordance with accepted academic practice. No use, distribution or reproduction is permitted which does not comply with these terms.
*Correspondence: Beibei Chen, YXBwbGVjaGVuYmVpYmVpQDEyNi5jb20=
Disclaimer: All claims expressed in this article are solely those of the authors and do not necessarily represent those of their affiliated organizations, or those of the publisher, the editors and the reviewers. Any product that may be evaluated in this article or claim that may be made by its manufacturer is not guaranteed or endorsed by the publisher.
Research integrity at Frontiers
Learn more about the work of our research integrity team to safeguard the quality of each article we publish.