- 1Université Côte d’Azur, IRD, CNRS, Observatoire de la Côte d’Azur, Géoazur, France
- 2Geological Survey of the Netherlands, Nederlandse Organisatie Voor Toegepast Natuurwetenschappelijk Onderzoek (TNO), Utrecht, Netherlands
- 3Institute of Earth Sciences, Academia Sinica, Taipei, Taiwan
The postseismic deformation following the April 2019 Mw 6.2 Hualien earthquake presents an unique opportunity to investigate the mechanisms by which the northern section of the Longitudinal Valley accommodates lithospheric deformation. We apply a variational Bayesian independent component analysis approach to displacement time-series to infer a 6-month long afterslip. Kinematic inversion shows that displacements are well explained by widespread afterslip (∼60 km in the along-strike direction) with limited slip (≤0.1 m) surrounding the coseismic slip area. The total geodetic moment relieved by afterslip (M0 ∼ 4.6 × 10¹⁸ Nm, i. e., Mw ∼ 6.4) is twice as large as the mainshock seismic moment, which represents a rare exception of a moderate magnitude event for which the afterslip moment exceeds that of the seismic moment. Then, combining geodetic and seismological analysis, we infer that afterslip is the dominant mechanism of near-to intermediate-field postseismic deformation and also likely represents the driving force that controls aftershock productivity and the spatiotemporal migration of seismicity. Besides, the fault zone frictional stability parameter a-b of rate-and-state dependent friction (a-b ∼ 0.0067–0.02) is comparable with previous estimates in the Longitudinal Valley. Finally, the study demonstrates that the northern Longitudinal Valley region hosts complex seismogenic structures that display a variety of slip behaviors.
1 Introduction
Geodetic measurements have revealed that earthquakes are generally followed by a phase of postseismic relaxation gradually decaying with time. Postseismic deformation, which represents the Earth’s response to coseismic stress perturbations, can last hours to years following an earthquake (Fukuda and Johnson, 2021; Zhao et al., 2022). Several mechanisms are commonly involved in postseismic deformation, including afterslip on fault portions surrounding the coseismic rupture (Marone et al., 1991) or on nearby faults (Tang et al., 2023), viscoelastic flow in the lower crust and/or upper mantle (Bürgmann and Dresen, 2008; Fukuda and Johnson, 2021) and poroelastic fluid flow in the shallow crust (Peltzer et al., 1996; McCormack et al., 2020). Postseismic deformation usually contributes significantly more to earthquake moment release than aftershocks (Gualandi et al., 2020) and afterslip is often considered as the primary force that drives aftershocks (Perfettini and Avouac, 2004; Canitano et al., 2018).
Located at the collisional boundary between the Eurasian plate (EP) and the Philippine Sea plate (PSP), Taiwan is a highly active seismic and tectonic zone. In eastern Taiwan, the Longitudinal Valley (LV) represents the suture of the collision (Barrier and Angelier, 1986), accounting for a third of tectonic plate convergence (Yu and Kuo, 2001). A major part of the oblique plate convergence (geodetic rate
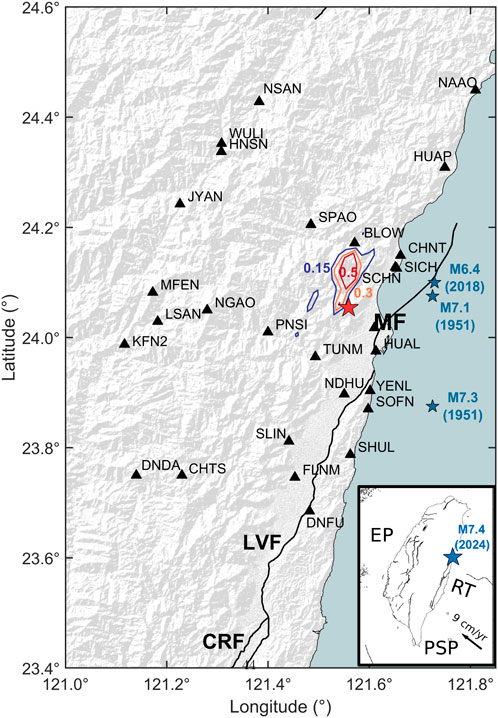
Figure 1. Map of eastern Taiwan. The red star shows the epicenter of the 2019 Hualien earthquake and colored contours outline the coseismic slip distribution (with 0.15, 0.30 and 0.50-m intervals) of the Lee et al. (2020) finite-fault source. The blue stars show the epicenters of the large earthquakes (
The 18 April 2019
2 Instrumentation and data processing
2.1 GNSS displacements
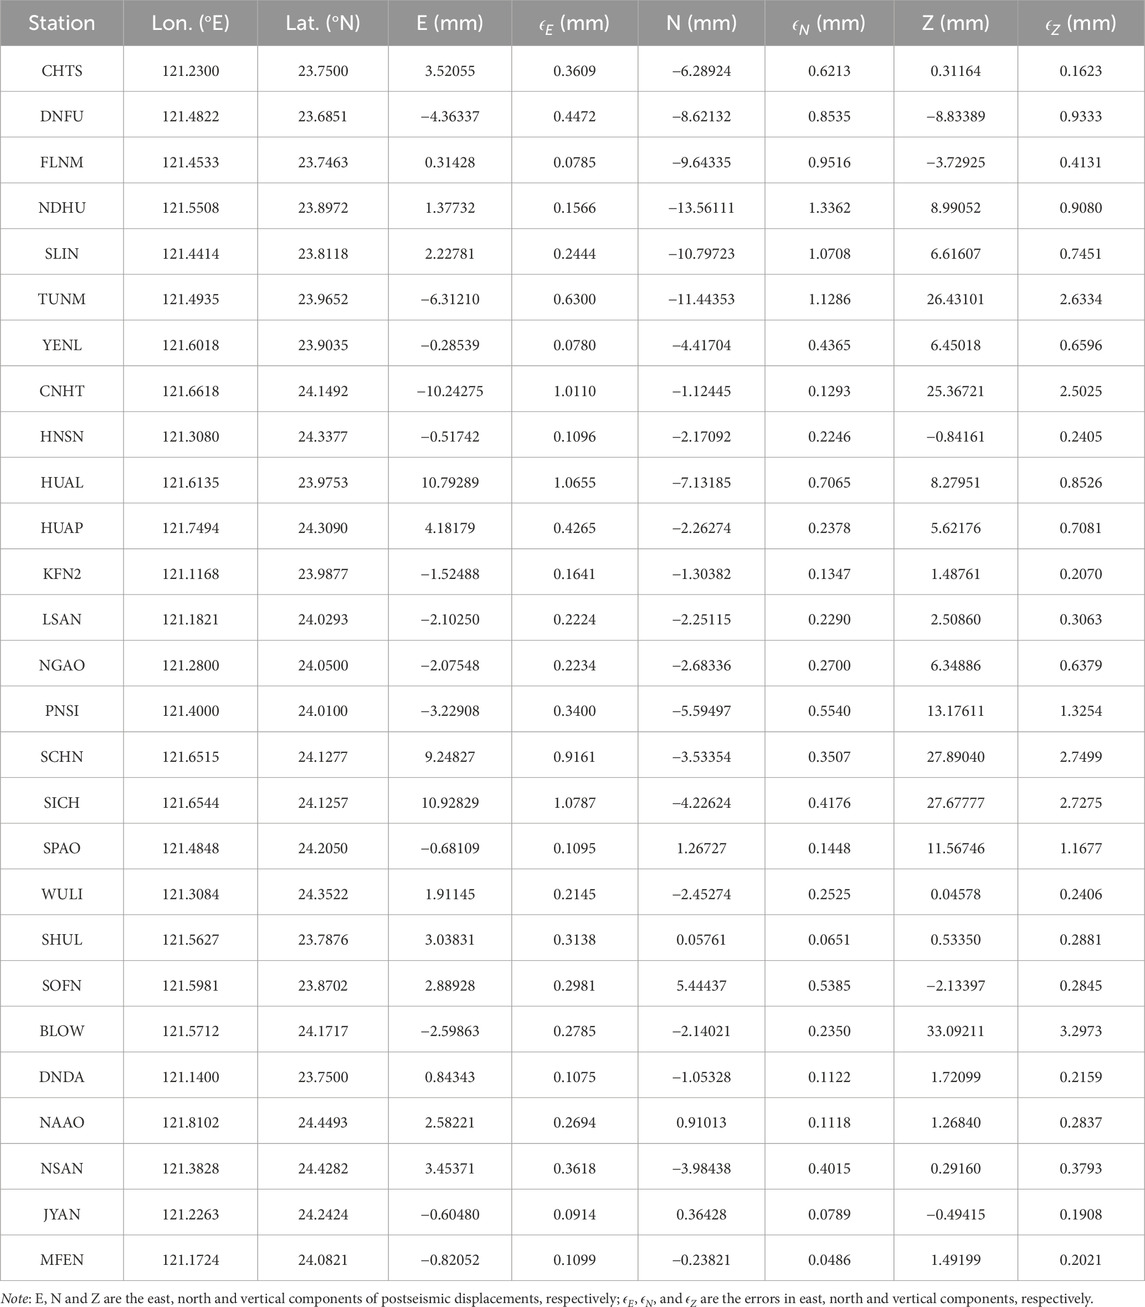
We use the GAMIT10.42/GLOBK5.16 software packages (Herring et al., 2010) to process the 3-D displacement time-series from 2018 to 2021 for 27 Global Navigation Satellite System (GNSS) stations deployed in the Hualien region (Figure 1). We obtain daily solutions in the ITRF2014 reference frame (Altamini et al., 2016) by utilizing double-differenced carrier phase measurements, and we enhance the regional deformation pattern for Taiwan by incorporating additional stations, including 362 from Taiwan, 8 from the Ryukyu islands and 17 International GNSS Service sites in the Asia-Pacific region. We utilize the following model equation to parametrize the time-dependent displacements (Lin et al., 2023b):
where
To isolate the signals related to postseismic deformation, we input the GNSS time-series detrended and cleaned for tectonic and non-tectonic offsets into a variational Bayesian independent component analysis (vbICA) algorithm (Choudrey and Roberts, 2003) modified to study complex geodetic signals (Gualandi et al., 2016). This method assumes that observations are a combination of a limited number of statistically independent sources, which can be extracted and characterized using their multimodal probability density functions. We extract four independent components (IC) determined by the Automatic Relevance Determination method (Gualandi et al., 2016). The postseismic deformation signal from the 2019 earthquake is mapped in the first independent component IC1 (Figure 2) and explains approximately 60% of the total GNSS data variance. IC2 component denotes the postseismic signal associated with the 2018
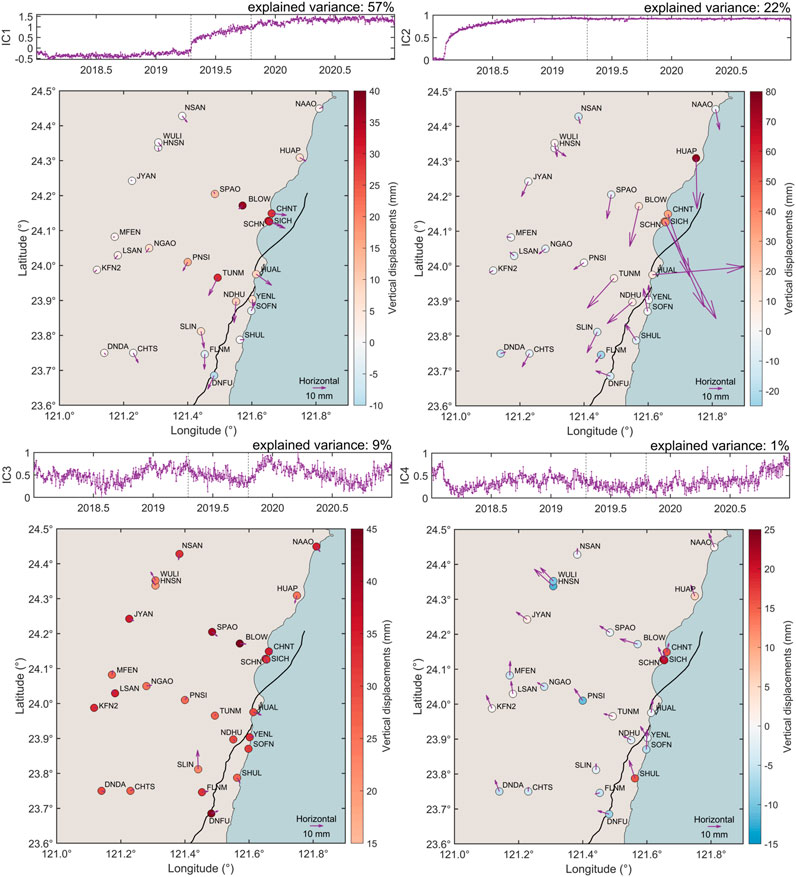
Figure 2. Temporal evolution of the four independent components (ICs) over a 3-year period (2018–2021) and related 3-D displacements. The vertical dashed lines denote the occurrence of the 2019 Hualien earthquake and the duration of postseismic deformation (about 6 months), respectively. The afterslip following the 2019 Hualien earthquake is mapped in IC1 component.
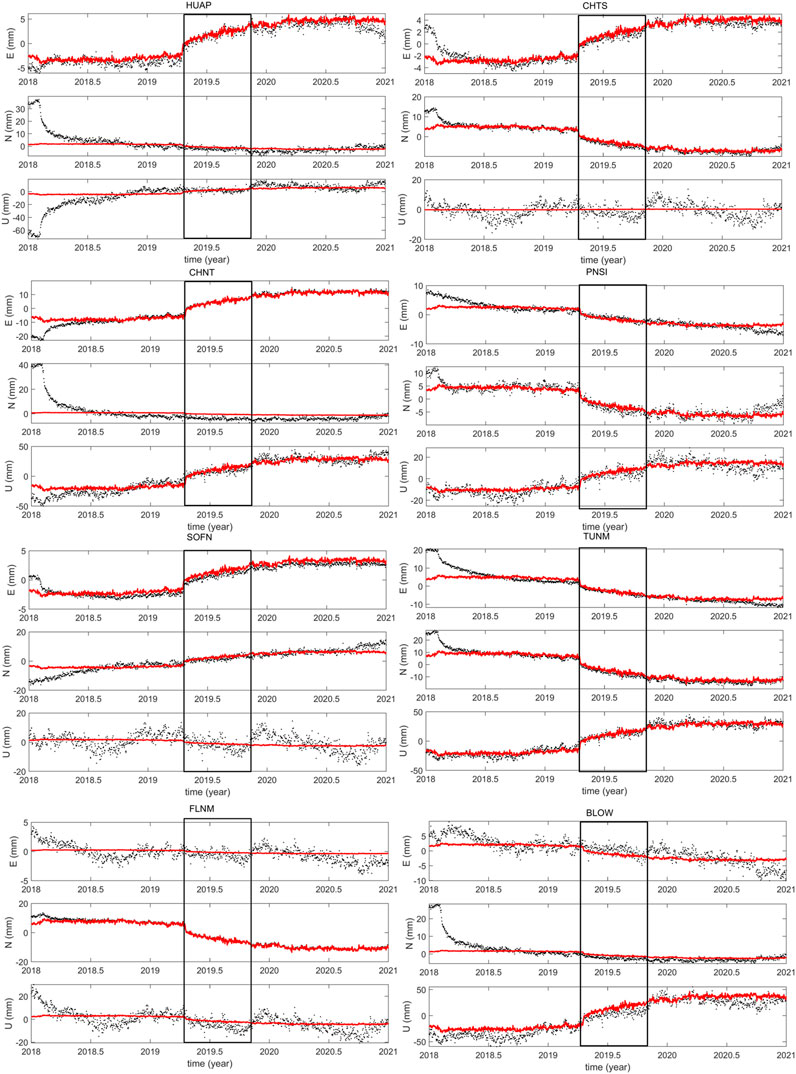
Figure 3. Example of analysis in independent component (ICA) over a 3-year period (2018–2021) showing the extraction of the 6-month long postseismic displacements (IC1) (black box) related to the 2019 Hualien earthquake. The black curve denotes the GNSS time-series corrected for a linear trend and large coseismic and instrumental offsets and the red curve shows the IC1 component, respectively.
2.2 Seismicity
We analyze the seismicity collected by the Central Weather Administration (CWA) of Taiwan during the first 6 months following the mainshock (until 15 October 2019). We select all events located between the depth of 0–30 km in the region defined by
We observe mainly two patterns of seismicity during the 6 months following the mainshock (Figure 4). First, the main earthquake cluster is concentrated at mid-crustal depth (
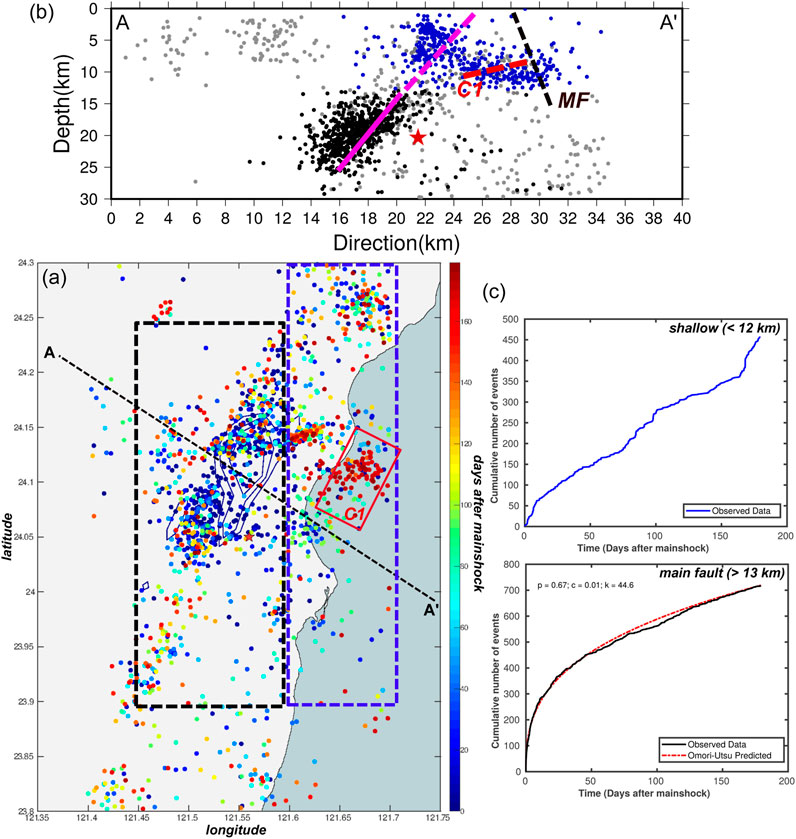
Figure 4. (A) Surface projection of the spatiotemporal evolution of the seismicity (with
3 Analysis of the postseismic deformation process
3.1 Forward models of postseismic deformation
In a first step, we perform a forward modeling to approximate the 3-D surface displacements generated by viscoelastic relaxation in the lower crust and by poroelastic rebound. We use the finite-fault coseismic model from Lee et al. (2020) as the initial stress perturbation. Although being usually the dominant mechanism of deformation in the long run (Bürgmann and Dresen, 2008), viscoelastic deformation can also accompany moderate-magnitude events (typically
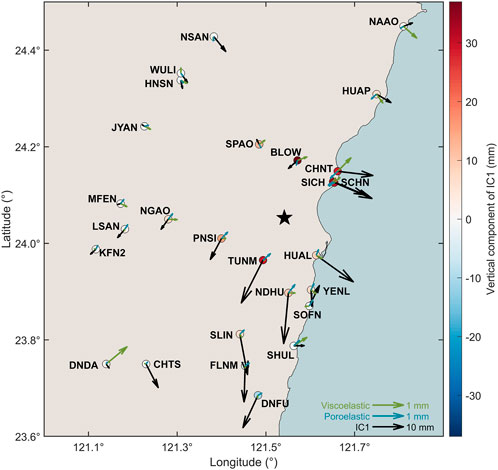
Figure 5. Forward modeling approximating the surface displacements generated by viscoelastic relaxation in the lower crust (green vector) and by poroelastic rebound (blue vector) during the first 6 months following the mainshock. The black vectors show the displacements related to IC1 component (Figure 2) and the black star denotes the mainshock epicenter. Viscoelastic relaxation and poroelastic rebound show no appreciable contribution to postseismic deformation (maximum displacements
3.2 Kinematic afterslip inversion
To obtain a realistic afterslip model, we discretize the mainshock fault plane into 240 subfaults with dimensions of 5 km
where
where
Our preferred model (
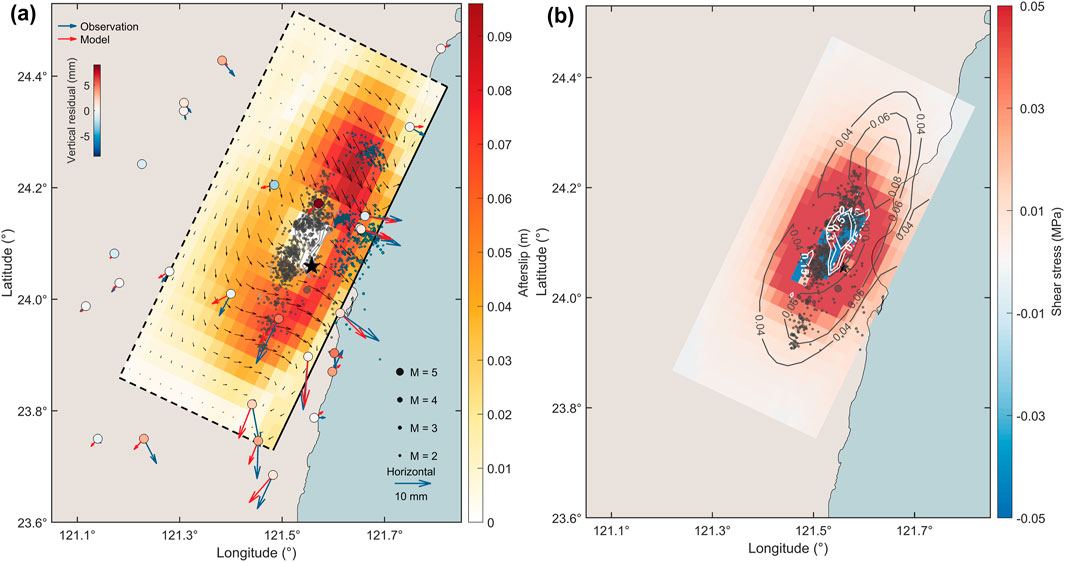
Figure 6. (A) Kinematic afterslip distribution over a 6-month period following the 2019 Hualien earthquake resolved on 5 km
4 Dynamics of the aftershock sequence in the mainshock region
We investigate a possible link between aftershock activity in the mainshock region and afterslip by comparing the cumulative seismicity with the afterslip temporal function mapped in the IC1 component. We find that the cumulative number of aftershocks and afterslip follow a similar temporal decay that is relatively well-explained with
where
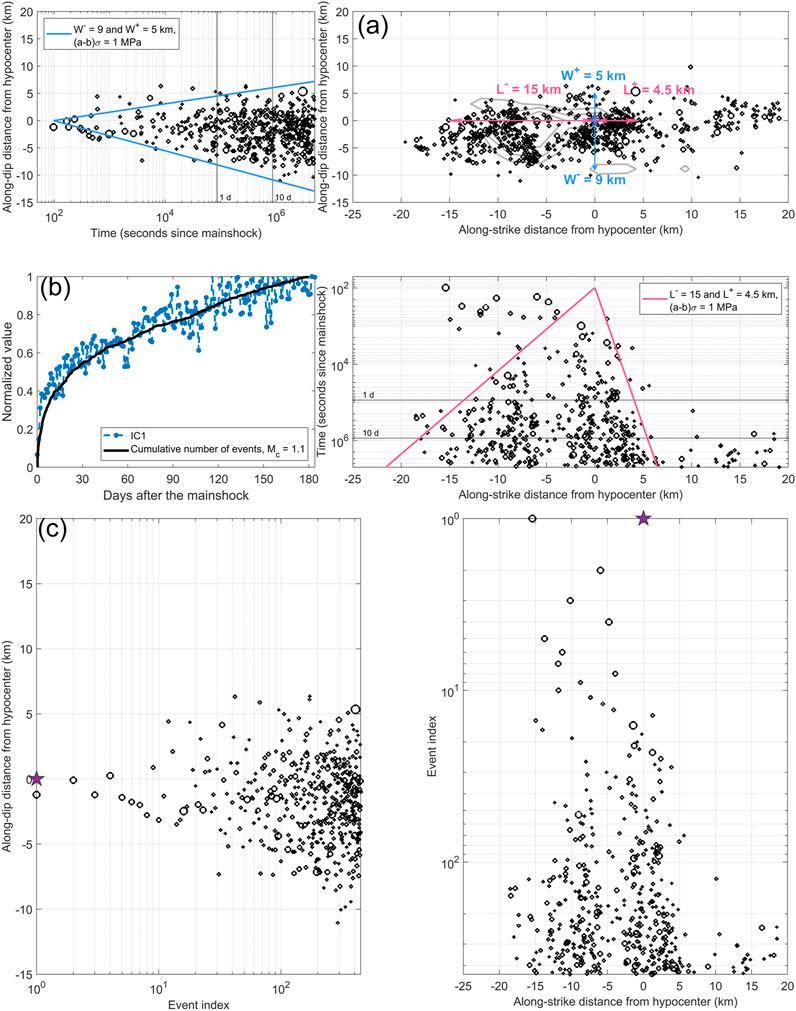
Figure 7. (A) Spatiotemporal evolution of the aftershocks along the mainshock fault plane (see Figure 4, black cluster) during the first 6 months following the Hualien earthquake. The pink and blue arrows represent the characteristic dimensions retained for modeling the expansion of the seismicity front along-strike (
We assume
Finally, we estimate the effective stress drop
where
5 Discussion and conclusions
We analyze GNSS and seismological data to constrain the spatiotemporal evolution of crustal deformation and seismicity throughout the postseismic phase of the 2019 Hualien earthquake. Afterslip often represents the dominant deformation mechanism in the early postseismic phase (Gualandi et al., 2020; Lin et al., 2023b) and we demonstrate that near-source GNSS displacements during the 6 months following the 2019 Hualien earthquake are well explained by widespread afterslip located on the mainshock fault plane. While the existence of velocity-strengthening regions, that can sustain afterslip for months or years, were previously evidenced on the southern section of the LVF (Thomas et al., 2014; Canitano et al., 2018) and on the southern and central sections of the CRF (Lin et al., 2023b; Tang et al., 2023), the 2019 Hualien earthquake reveals unambiguously the presence of a large velocity-strengthening zone at shallow to mid-crustal depth in the Hualien region. The afterslip distribution shows a relatively good spatial coherence with coseismic shear stress changes, which suggests that the latter may have helped to promote afterslip (Fukuda and Johnson, 2021). We infer that mid-crustal aftershocks (15–20 km depth) are mainly located in areas of moderate afterslip (
The analysis of seismicity during the first 6 months following the mainshock exhibits two distinct features (Figure 4). The main aftershock cluster is located at mid-crustal depth (
We also observe clustered seismic activity at shallow depth (depth
Finally, we observe that the geodetic moment of the afterslip (
Data availability statement
The original contributions presented in the study are included in the article/Supplementary Material, further inquiries can be directed to the corresponding author.
Author contributions
H-FL: Conceptualization, Formal Analysis, Investigation, Software, Visualization, Writing–original draft. AC: Conceptualization, Funding acquisition, Project administration, Supervision, Validation, Writing–original draft. Y-JH: Conceptualization, Formal Analysis, Investigation, Software, Visualization, Writing–original draft.
Funding
The author(s) declare that financial support was received for the research, authorship, and/or publication of this article. This research is supported by the Ministry of Science and Technology grant NSTC 113-2116-M-001-009.
Acknowledgments
We are grateful to IES colleagues for collecting and processing the GNSS data. We are thankful to Shiann-Jong Lee for providing the coseismic slip model and Wen-Tzong Liang for insightful comments. Figures were created by using the Generic Mapping Tools (GMT) (version: GMT 4.5.7, URL link: https://www.generic-mapping-tools.org/download/) (Wessel and Smith, 1998). We are thankful to the Associate Editor Fuqiong Huang and two reviewers for their constructive suggestions and comments allowing to improve the manuscript. This is the contribution of the Institute of Earth Sciences, Academia Sinica, IESAS2423.
Conflict of interest
The authors declare that the research was conducted in the absence of any commercial or financial relationships that could be construed as a potential conflict of interest.
Publisher’s note
All claims expressed in this article are solely those of the authors and do not necessarily represent those of their affiliated organizations, or those of the publisher, the editors and the reviewers. Any product that may be evaluated in this article, or claim that may be made by its manufacturer, is not guaranteed or endorsed by the publisher.
Supplementary material
The Supplementary Material for this article can be found online at: https://www.frontiersin.org/articles/10.3389/feart.2024.1457240/full#supplementary-material
References
Altamini, Z., Rebischung, P., Metivier, L., and Collilieux, X. (2016). ITRF2014: a new release of the International Terrestrial Reference Frame modeling nonlinear station motions. J. Geophys. Res. Solid Earth 121, 6109–6131. doi:10.1002/2016jb013098
Barbot, S., and Fialko, Y. (2010a). Fourier-domain Green’s function for an elastic semi-infinite solid under gravity, with applications to earthquake and volcano deformation. Geophys. J. Int. 182 (2), 568–582. doi:10.1111/j.1365-246x.2010.04655.x
Barbot, S., and Fialko, Y. (2010b). A unified continuum representation of postseismic relaxation mechanisms: semi-analytic models of afterslip, poroelastic rebound and viscoelastic flow. Geophys. J. Int. 182 (3), 1124–1140. doi:10.1111/j.1365-246x.2010.04678.x
Barrier, E., and Angelier, J. (1986). Active collision in eastern taiwan: the coastal range. Tectonophysics 125, 39–72. doi:10.1016/0040-1951(86)90006-5
Bruhat, L., Barbot, S., and Avouac, J. P. (2011). Evidence for postseismic deformation of the lower crust following the 2004 Mw6.0 Parkfield earthquake. J. Geophys. Res. 116, B08401. doi:10.1029/2010JB008073
Bürgmann, R., and Dresen, G. (2008). Rheology of the lower crust and upper mantle: evidence from rock mechanics, geodesy, and field observations. Annu. Rev. Earth Planet. Sci. 36, 531–567. doi:10.1146/annurev.earth.36.031207.124326
Cabrera, L., Poli, P., and Frank, W. B. (2022). Tracking the spatio-temporal evolution of foreshocks preceding the Mw6.1 2009 L’Aquila earthquake. J. Geophys. Res. Solid Earth 127. doi:10.1029/2021JB023888
Canitano, A., Godano, M., Hsu, Y. J., Lee, H. M., Linde, A. T., and Sacks, S. (2018). Seismicity controlled by a frictional afterslip during a small magnitude seismic sequence (ML < 5) on the Chihshang Fault, Taiwan. J. Geophys. Res. Solid Earth 123 (2), 2003–2018. doi:10.1002/2017jb015128
Canitano, A., Godano, M., and Thomas, M. Y. (2021). Inherited state of stress as a key factor controlling slip and slip mode: inference from the study of a slow slip event in the Longitudinal Valley, Taiwan. Geophys. Res. Lett. 48 (3). doi:10.1029/2020GL090278
Chang, J. M., Chao, W. A., Yang, C. M., and Huang, M. W. (2024). Coseismic and subsequent landslides of the 2024 hualien earthquake (M7.2) on April 3 in taiwan. Landlides 21, 2591–2595. doi:10.1007/s10346-024-02312-x
Chen, K. H., Toda, S., and Rau, R. J. (2008). A leaping, triggered sequence along a segmented fault: the 1951 ML 7.3 Hualien-Taitung earthquake sequence in eastern Taiwan. J. Geophys. Res. 113. doi:10.1029/2007JB005048
Choudrey, R. A., and Roberts, S. J. (2003). Variational mixture of Bayesian independent component analyzers. Neural comput 15 (1), 213–252. doi:10.1162/089976603321043766
Churchill, R. M., Werner, M. J., Biggs, J., and Fagereng, A. (2022). Afterslip moment scaling and variability from a global compilation of estimates. J. Geophys. Res. Solid Earth 127, e2021JB023897. doi:10.1029/2021JB023897
Cruz-Atienza, V. M., Tago, J., Villafuerte, C., Wei, M., Garza-Girón, R., Dominguez, L. A., et al. (2021). Short-term interaction between silent and devastating earthquakes in Mexico. Nat. Commun. 12, 2171. doi:10.1038/s41467-021-22326-6
Dieterich, J. H. (1994). A constitutive law for rate of earthquake production and its application to earthquake clustering. J. Geophys. Res. 99, 2601–2618. doi:10.1029/93jb02581
Essing, D., and Poli, P. (2024). Unraveling earthquake clusters composing the 2014 Alto Tiberina earthquake swarm via unsupervised learning. J. Geophys. Res. Solid Earth 129. doi:10.1029/2022JB026237
Fischer, T., and Hainzl, S. (2017). Effective stress drop of earthquake clusters. Bull. Seismol. Soc. Am. 107, 2247–2257. doi:10.1785/0120170035
Fischer, T., and Hainzl, S. (2021). The growth of earthquake clusters. Front. Earth Sci. 9. doi:10.3389/feart.2021.638336
Frank, W. B., Poli, P., and Perfettini, H. (2017). Mapping the rheology of the Central Chile subduction zone with aftershocks. Geophys. Res. Lett. 44, 5374–5382. doi:10.1002/2016gl072288
Freed, A. M., Hashima, A., Becker, T. W., Okaya, D. A., Sato, H., and Hatanaka, Y. (2017). Resolving depth-dependent subduction zone viscosity and afterslip from postseismic displacements following the 2011 Tohoku-oki, Japan earthquake. Earth Planet. Sci. Lett. 459, 279–290. doi:10.1016/j.epsl.2016.11.040
Fukuda, J., and Johnson, K. M. (2021). Bayesian inversion for a stress-driven model of afterslip and viscoelastic relaxation: method and application to postseismic deformation following the 2011 Mw 9.0 Tohoku-Oki earthquake. J. Geophys. Res. Solid Earth 126. doi:10.1029/2020JB021620
Gualandi, A., Liu, Z., and Rollins, C. (2020). Post-large earthquake seismic activities mediated by aseismic deformation processes. Earth Planet. Sci. Lett. 530, 115870. doi:10.1016/j.epsl.2019.115870
Gualandi, A., Serpelloni, E., and Belardinelli, M. E. (2016). Blind source separation problem in GPS time series. J. Geod. 90, 323–341. doi:10.1007/s00190-015-0875-4
Gutenberg, R., and Richter, C. F. (1944). Frequency of earthquakes in California. Bull. Seismol. Soc. Am. 34, 185–188. doi:10.1785/bssa0340040185
Hainzl, S. (2004). Seismicity patterns of earthquake swarms due to fluid intrusion and stress triggering. Geophys. J. Int. 159, 1090–1096. doi:10.1111/j.1365-246x.2004.02463.x
Hawthorne, J. C., Simons, M., and Ampuero, J.-P. (2016). Estimates of aseismic slip associated with small earthquakes near San Juan Bautista, CA. J. Geophys. Res. Solid Earth 121, 8254–8275. doi:10.1002/2016jb013120
Herring, T., King, W., and McCluskey, S. M. (2010). Introduction to GAMIT/GLOBK release 10.4. Cambridge: Mass. Inst. of Technol.
Howell, A., Palamartchouk, K., Papanikolaou, X., Paradissis, D., Raptakis, C., Copley, A., et al. (2017). The 2008 Methoni earthquake sequence: the relationship between the earthquake cycle on the subduction interface and coastal uplift in SW Greece. Geophys. J. Int. 208, 1592–1610. doi:10.1093/gji/ggw462
Hsu, Y. J., Fu, Y., Bürgmann, R., Hsu, S. Y., Lin, C. C., Tang, C. H., et al. (2020). Assessing seasonal and interannual water storage variations in Taiwan using geodetic and hydrological data. Earth Planet. Sci. Lett. 550, 116532. doi:10.1016/j.epsl.2020.116532
Huang, H. H., and Wang, Y. (2022). Seismogenic structure beneath the northern Longitudinal Valley revealed by the 2018-2021 Hualien earthquake sequences and 3-D velocity model. Terr. Atmos. Ocean. Sci. 33, 17. doi:10.1007/s44195-022-00017-z
Huang, M. H., and Huang, H. H. (2018). The complexity of the 2018 Mw6.4 Hualien earthquake in east Taiwan. Geophys. Res. Lett. 45 (13), 249–313. doi:10.1029/2018gl080821
Huang, T. Y., Gung, Y., Kuo, B. Y., Chiao, L. Y., and Chen, Y. N. (2015). Layered deformation in the Taiwan orogen. Science 349, 720–723. doi:10.1126/science.aab1879
Ingleby, T., and Wright, T. (2017). Omori-like decay of postseismic velocities following continental earthquakes. Geophys. Res. Lett. 44, 3119–3130. doi:10.1002/2017gl072865
Jian, P. R., and Wang, Y. (2022). Applying unsupervised machine-learning algorithms and MUSIC back-projection to characterize 2018-2022 Hualien earthquake sequence. Terr. Atmos. Ocean. Sci. 33, 28. doi:10.1007/s44195-022-00026-y
Johnson, K. M., Fukuda, J., and Segall, P. (2012). Challenging the rate-state asperity model: afterslip following the 2011 M9 Tohoku-oki, Japan, earthquake. Geophys. Res. Lett. 39. doi:10.1029/2012GL052901
Lee, S. J., Wong, T. P., Liu, T. Y., Lin, T. C., and Chen, C. T. (2020). Strong ground motion over a large area in northern Taiwan caused by the northward rupture directivity of the 2019 Hualien earthquake. J. Asian Earth Sci. 192, 104095. doi:10.1016/j.jseaes.2019.104095
Li, S., Tao, T., Chen, Y., He, P., Gao, F., Qu, X., et al. (2021). Geodetic observation and modeling of the coseismic and postseismic deformation associated with the 2020 Mw6.5 Monte Cristo earthquake. Earth Space Sci. 8. doi:10.1029/2021EA001696
Lin, H. F., Gualandi, A., Hsu, Y. F., Hsu, Y. J., Huang, H. H., Lee, H. M., et al. (2023b). Interplay between seismic and aseismic deformation on the central Range fault during the 2013 Mw6.3 Ruisui earthquake (taiwan). J. Geophys. Res. Solid Earth 128 (9). doi:10.1029/2023JB026861
Lin, H. F., Hsu, Y. F., and Canitano, A. (2023a). Source modeling of the 2009 Fengpin-Hualien earthquake sequence, Taiwan, inferred from static strain measurements. Pure Appl. Geophys. 180, 715–733. doi:10.1007/s00024-022-03068-y
Lohman, R. B., and McGuire, J. J. (2007). Earthquake swarms driven by aseismic creep in the Salton Trough, California. J. Geophys. Res. 112, B04405. doi:10.1029/2006JB004596
Mandler, E., Pintori, F., Gualandi, A., Anderlini, L., Serpelloni, E., and Belardinelli, M. E. (2021). Post-seismic deformation related to the 2016 Central Italy seismic sequence from GPS displacement time-series. J. Geophys. Res. Solid Earth 126, e2021JB022200. doi:10.1029/2021JB022200
Marone, C. J., Scholz, C. H., and Bilham, R. (1991). On the mechanics of earthquake afterslip. J. Geophys. Res. 96, 8441–8452. doi:10.1029/91jb00275
Matthews, M. V., and Segall, P. (1993). Estimation of depth-dependent fault slip from measured surface deformation with application to the 1906 San Francisco earthquake. J. Geophys. Res. 98 (12), 12153–12163. doi:10.1029/93jb00440
McCormack, K., Hesse, M. A., Dixon, T., and Malservisi, R. (2020). Modeling the contribution of poroelastic deformation to postseismic geodetic signals. Geophys. Res. Lett. 47. doi:10.1029/2020GL086945
Moreno, M., Haberland, C., Oncken, O., Rietbrock, A., Angiboust, S., and Heidbach, O. (2014). Locking of the Chile subduction zone controlled by fluid pressure before the 2010 earthquake. Nat. Geosci. 7, 292–296. doi:10.1038/NGEO2102
Morikami, S., and Mitsui, Y. (2020). Omori-like slow decay (p < 1) of postseismic displacement rates following the 2011 Tohoku megathrust earthquake. Earth Planets Space 72, 37. doi:10.1186/s40623-020-01162-w
Okada, Y. (1992). Internal deformation due to shear and tensile faults in a half-space. Bull. Seism. Soc. Am. 82 (2), 1018–1040. doi:10.1785/bssa0820021018
Peltzer, G., Rosen, P., Rogez, F., and Hudnut, K. (1996). Postseismic rebound in fault step-overs caused by pore fluid flow. Science 273 (5279), 1202–1204. doi:10.1126/science.273.5279.1202
Peng, W., Marsan, D., Chen, K. H., and Pathier, E. (2021). Earthquake swarms in Taiwan: a composite declustering method for detection and their spatial characteristics. Earth Planet. Sci. Lett. 574, 117160. doi:10.1016/j.epsl.2021.117160
Perfettini, H., and Avouac, J. P. (2004). Postseismic relaxation driven by brittle creep: a possible mechanism to reconcile geodetic measurements and the decay rate of aftershocks, application to the Chi-Chi earthquake, Taiwan. J. Geophys. Res. 109. doi:10.1029/2003JB002488
Perfettini, H., Frank, W. B., Marsan, D., and Bouchon, M. (2018). A model of aftershock migration driven by afterslip. Geophys. Res. Lett. 45, 2283–2293. doi:10.1002/2017gl076287
Perfettini, H., Frank, W. B., Marsan, D., and Bouchon, M. (2019). Updip and along-strike aftershock migration model driven by afterslip: application to the 2011 Tohoku-Oki aftershock sequence. J. Geophys. Res. Solid Earth 124 (3), 2653–2669. doi:10.1029/2018jb016490
Periollat, A., Radiguet, M., Weiss, J., Twardzik, C., Amitrano, D., Cotte, N., et al. (2022). Transient brittle creep mechanism explains early postseismic phase of the 2011 Tohoku-Oki megathrust earthquake: observations by high-rate GPS solutions. J. Geophys. Res. Solid Earth. 127. doi:10.1029/2022JB024005
Rau, R. J., Ching, K. E., Hu, J. C., and Lee, J.-C. (2008). Crustal deformation and block kinematics in transition from collision to subduction: global positioning system measurements in northern Taiwan, 1995–2005. J. Geophys. Res. 113, B09404. doi:10.1029/2007jb005414
Rau, R. J., and Liang, W. T. (2022). Introduction to the special issue on the Hualien earthquake swarms. Terr. Atmos. Ocean. Sci. 33, 27. doi:10.1007/s44195-022-00028-w
Schorlemmer, D., Wiemer, S., and Wyss, M. (2005). Variations in earthquake-size distribution across different stress regimes. Nature 437, 539–542. doi:10.1038/nature04094
Shyu, J. B. H., Chen, C. F., and Wu, Y. M. (2016). Seismotectonic characteristics of the northernmost Longitudinal Valley, eastern Taiwan: structural development of a vanishing suture. Tectonophysics 692, 295–308. doi:10.1016/j.tecto.2015.12.026
Shyu, J. B. H., Sieh, K., Chen, Y. G., and Chung, L. H. (2006). Geomorphic analysis of the Central Range fault, the second major active structure of the Longitudinal Valley suture, eastern Taiwan. Geol. Soc. Am. Bull. 118, 1447–1462. doi:10.1130/b25905.1
Soares, A., Custodio, S., Cesca, S., Silva, R., Vuan, A., and Mendes, V. B. (2023). The february 2018 seismic swarm in sao miguel, azores. Front. Earth Sci. 11. doi:10.3389/feart.2023.1144151
Tang, C. H., Hsu, Y. J., Barbot, S., Moore, J. D. P., and Chang, W. L. (2019). Lower-crustal rheology and thermal gradient in the Taiwan orogenic belt illuminated by the 1999 Chi-Chi earthquake. Sci. Adv. 5 (2), eaav3287. doi:10.1126/sciadv.aav3287
Tang, C. H., Lin, Y., Tung, H., Wang, Y., Lee, S. J., Hsu, Y. J., et al. (2023). Nearby fault interaction within the double-vergence suture in eastern Taiwan during the 2022 Chihshang earthquake sequence. Commun. Earth Environ. 4, 333. doi:10.1038/s43247-023-00994-0
Thomas, M. Y., Avouac, J. P., Champenois, J., Lee, J. C., and Kuo, L. C. (2014). Spatiotemporal evolution of seismic and aseismic slip on the Longitudinal Valley fault, taiwan. J. Geophys. Res. 119 (6), 5114–5139. doi:10.1002/2013jb010603
Thomas, M. Y., Avouac, J. P., and Lapusta, N. (2017). Rate-and-state friction properties of the Longitudinal Valley Fault from kinematic and dynamic modeling of seismic and aseismic slip. J. Geophys. Res. 122 (4), 3115–3137. doi:10.1002/2016jb013615
Toyokuni, G., Zhao, D., and Chen, K. H. (2021). Structural control on the 2018 and 2019 hualien earthquakes in taiwan. Phys. Earth Planet. Inter. 312, 106673. doi:10.1016/j.pepi.2021.106673
Utsu, T., Ogata, Y., Matsu’ura, R. S., and Matsu'ura, (1995). The centenary of the Omori formula for a decay law of aftershock activity. J. Phys. Earth 43, 1–33. doi:10.4294/jpe1952.43.1
Wanninger, L. (2009). Correction of apparent position shifts caused by GNSS antenna changes. GPS Solutions 13, 133–139. doi:10.1007/s10291-008-0106-z
Wessel, P., and Smith, W. H. F. (1998). New, improved version of generic mapping tools released. Eos Trans. AGU 79, 579. doi:10.1029/98EO00426
Wiemer, S. (2001). A software package to analyze seismicity: ZMAP. Seismol. Res. Lett. 72 (3), 373–382. doi:10.1785/gssrl.72.3.373
Williams, S. D. P. (2003). Offsets in global positioning system time series. J. Geophys. Res. 108. doi:10.1029/2002JB002156
Wu, Y. M., Chen, S. K., Huang, T. C., Huang, H. H., Chao, W. A., and Koulakov, I. (2018). Relationship between earthquake b-values and crustal stresses in a young orogenic belt. Geophys. Res. Lett. 45, 1832–1837. doi:10.1002/2017gl076694
Yu, S. B., and Kuo, L. C. (2001). Present-day crustal motion along the Longitudinal Valley fault, eastern taiwan. Tectonophysics 333, 199–217. doi:10.1016/s0040-1951(00)00275-4
Zhao, B., Bürgmann, R., Wang, D., Zhang, J., Yu, J., and Li, Q. (2022). Aseismic slip and recent ruptures of persistent asperities along the Alaska-Aleutian subduction zone. Nat. Comm. 13, 3098. doi:10.1038/s41467-022-30883-7
Keywords: postseismic activity, kinematic inversion, aftershock activity, rate and state dependent friction, taiwan
Citation: Lin H-F, Canitano A and Hsu Y-J (2024) Kinematic GNSS inversion of the large afterslip (Mw 6.4) following the 2019 Mw 6.2 Hualien earthquake (Taiwan). Front. Earth Sci. 12:1457240. doi: 10.3389/feart.2024.1457240
Received: 30 June 2024; Accepted: 12 November 2024;
Published: 27 November 2024.
Edited by:
Fuqiong Huang, China Earthquake Networks Center, ChinaReviewed by:
Jeffrey Todd Freymueller, Michigan State University, United StatesChen Chieh-Hung, China University of Geosciences Wuhan, China
Copyright © 2024 Lin, Canitano and Hsu. This is an open-access article distributed under the terms of the Creative Commons Attribution License (CC BY). The use, distribution or reproduction in other forums is permitted, provided the original author(s) and the copyright owner(s) are credited and that the original publication in this journal is cited, in accordance with accepted academic practice. No use, distribution or reproduction is permitted which does not comply with these terms.
*Correspondence: Alexandre Canitano, Y2FuaXRhbm9AZWFydGguc2luaWNhLmVkdS50dw==
 Hsiao-Fan Lin
 Alexandre Canitano
 Ya-Ju Hsu3