 Khurelbaatar Temuujin1,2*
 Avirmed Dashtseren1,3
 Bernd Etzelmüller4
 Tsogtbaatar Undrakhtsetseg1
 Kristoffer Aalstad4
 Sebastian Westermann4,5*
- 1Institute of Geography and Geoecology, Mongolian Academy of Sciences, Ulaanbaatar, Mongolia
- 2Department of Environment and Forest engineering, School of Engineering and Technology, National University of Mongolia, Ulaanbaatar, Mongolia
- 3UNESCO Chair of Environmental Sciences in Eastern Central Asia, Mongolian Academy of Sciences, Ulaanbaatar, Mongolia
- 4Department of Geosciences, University of Oslo, Oslo, Norway
- 5Centre for Biogeochemistry in the Anthropocene, Oslo, Norway
In Central Asia, the ground thermal regime is strongly affected by the interplay between topographic factors and ecosystem properties. In this study, we investigate the governing factors of the ground thermal regime in an area in Central Mongolia, which features discontinuous permafrost and is characterized by grassland and forest ecosystems. Miniature temperature dataloggers were used to measure near-surface temperatures at c. 100 locations throughout the 6 km2 large study area, with the goal to obtain a sample of sites that can represent the variability of different topographic and ecosystem properties. Mean annual near-surface ground temperatures showed a strong variability, with differences of up to 8 K. The coldest sites were all located in forests on north-facing slopes, while the warmest sites are located on steep south-facing slopes with sparse steppe vegetation. Sites in forests show generally colder near-surface temperatures in spring, summer and fall compared to grassland sites, but they are warmer during the winter season. The altitude of the measurement sites did not play a significant role in determining the near-surface temperatures, while especially solar radiation was highly correlated. In addition, we investigated the suitability of different hyperspectral indices calculated from Sentinel-2 as predictors for annual average near-surface ground temperatures. We found that especially indices sensitive to vegetation properties, such as the Normalized Difference Vegetation Index (NDVI), show a strong correlation. The presented observations provide baseline data on the spatiotemporal patterns of the ground thermal regime which can be used to train or validate modelling and remote sensing approaches targeting the impacts of climate change.
1 Introduction
Ecosystems in Mongolia are intricately shaped by the interplay between topography and the associated radiation regime, which especially in Central Mongolia determines the small-scale pattern of forests and steppes (Dulamsuren et al., 2011). In particular, the radiation regime determines the evapotranspiration during the summer months, which has a significant impact on soil moisture and thus ecosystem dynamics (Batima et al., 2005). Another crucial factor that exerts a strong control on these ecosystems is the insulating winter snow cover, which plays a vital role in governing ground temperatures (e.g., Zhang, 2005; Rödder and Kneissel, 2012; Gisnås et al., 2014). Furthermore, in Mongolia about 30% of the area is underlain by permafrost (Jambaljav et al., 2022). While the larger-scale permafrost patterns in Mongolia are climate- and elevation-controlled, the radiation regime, snow cover, and properties of the subsurface control the smaller-scale patterns of permafrost occurrence. Permafrost strongly interacts with the structure and function of Mongolia’s ecosystems, influencing vegetation, hydrology, and soil processes (Dulamsuren et al., 2011; Zweigel et al., 2024). The transition from the Siberian boreal forest region in the north to the steppes in the central parts and finally to the Gobi Desert in the south corresponds to a change from discontinuous to sporadic permafrost and ultimately to seasonally frozen ground (Dashtseren et al., 2014). In a warming climate, the response of permafrost is often controlled by ecosystem factors which in some cases can strongly delay thawing (e.g., Shur and Jorgenson, 2007). On the other hand, climate-induced ecosystem changes, e.g., due to fires, also have the potential to initiate or accelerate permafrost thaw (Shur and Jorgenson, 2007) which highlights the importance of local-scale ecosystem interactions for permafrost dynamics in Mongolia and elsewhere.
Mongolia has experienced one of the fastest warming rates globally, with air temperatures increasing by 2.4°C over the past 60 years, approximately three times higher than the global average (IPCC, 2013; MARCC, 2014; Dashtseren et al., 2021). As a consequence, permafrost in the region is rapidly warming and thawing, and it has already disappeared from many marginal areas (Sharkhuu, 2003; Ishikawa et al., 2018; Dashtseren, 2021). However, the local-scale response of permafrost and associated ecosystem types to climate change remains highly uncertain. Therefore, it is of utmost importance to better understand the factors governing the ground thermal regime at spatial scales of tens of meters to kilometres, in particular the interplay between climatic, topographic, and ecosystem-related controls.
In-situ monitoring of ground temperatures in permafrost areas generally relies on boreholes which capture the ground thermal regime on the plot scale (Biskaborn et al., 2019). As borehole installations are logistically challenging and expensive, there are usually only a single or few boreholes measurement available within a certain area, so that the small-scale spatial variability caused by topographic and ecosystem factors remains uncaptured. Temperature measurements near the ground surface can at least partly fill this gap: as they are efficient to conduct using miniature temperature loggers, it is possible to install arrays of dozens or even hundreds of temperature loggers that can indeed capture variations of near-surface ground temperature on spatial scales of tens of meters to kilometres. Studies conducted outside Mongolia have shown that annual averages of near-surface ground temperature can vary by several Kelvin over short spatial distances, driven by environmental factors like snow depth (Gisnås et al., 2014; Zweigel et al., 2021), topographic factors like altitude, slope and aspect (Serban et al., 2023), as well as surface material and vegetation (Rödder and Kneissel, 2012; Luo et al., 2019).
In this study, we present spatially distributed measurements of near-surface ground temperatures from a 6 km2 area in Central Mongolia, which is located in the discontinuous permafrost zone. The dataset allows us to statistically evaluate the importance of different factors for both annual and seasonal temperatures, in particular topography- and ecosystem-related controls. Furthermore, we evaluate the suitability of satellite-derived indices as predictors for mean annual near-surface ground temperature. Finally, we discuss the potential to employ the dataset presented in this study as training and/or validation for both remote sensing and numerical modelling targeting the state of permafrost.
2 Study area
The Terelj climate and permafrost observatory (47°58′, 107°26′; Figure 1) is located in the southern Khentii Mountain in the discontinuous permafrost zone, close to the southern limit of permafrost occurrence in Mongolia. In the study area, the elevations vary between 2,200 m a.s.l. and 1,550 m a.s.l. The area is located in the forest-steppe zone, with forests dominated mainly by larch, birch and occasional pine trees (Batchuluun et al., 2021). At the site, the south-facing slopes are permafrost-free and occupied by steppe vegetation, while the majority of the forests occurs on north-facing slopes underlain by permafrost. Soil properties change rapidly in space; in the forest, the organic soil layer has a thickness of 0.2–0.4 m, whereas it is much thinner or even non-existent in the steppe (Ishikawa et al., 2005; Dashtseren et al., 2014).
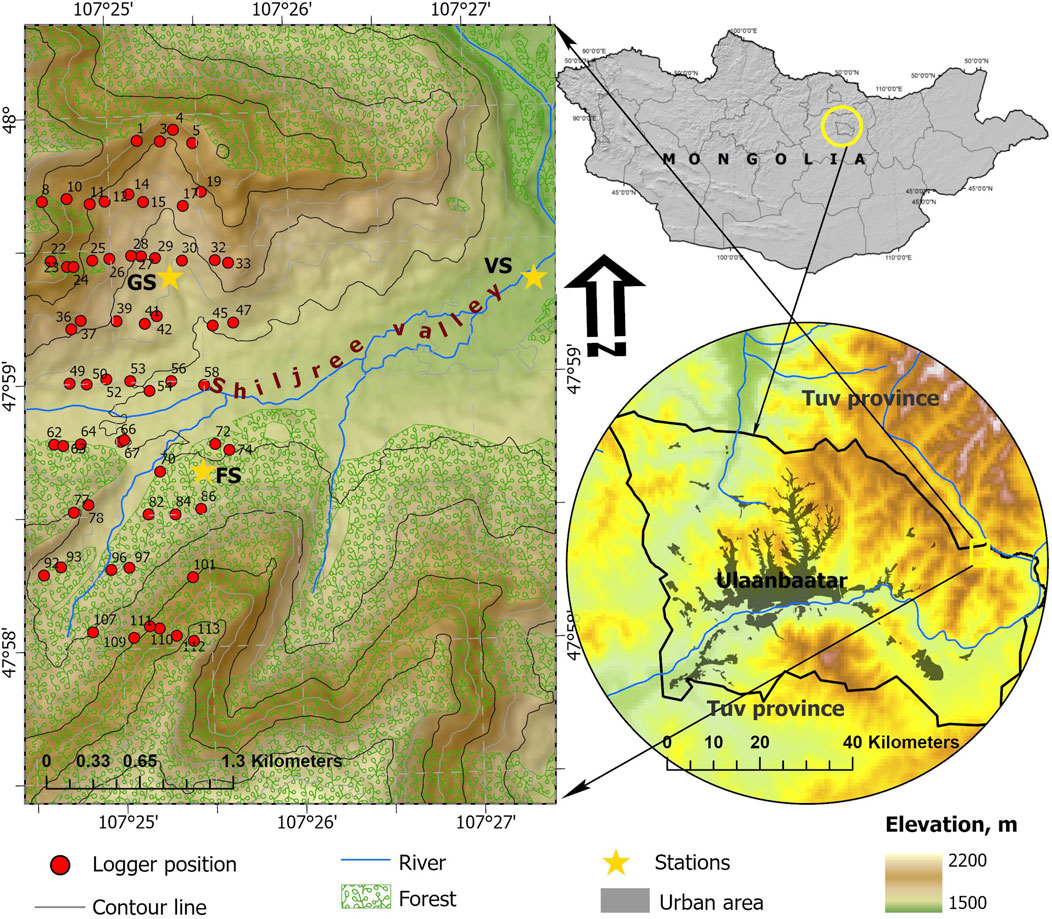
Figure 1. Map of the study area (left) with the locations of the ground surface temperature logger, as well as the location of the study area within Mongolia (right).
Three automatic meteorological stations are located in the study area: one in bottom of the central valley (VS), one in the north-facing slope inside the forest (FS), and one on the south-facing slope in the mountain steppe (GS). In this study, we use observations of air temperature data (Table 1).
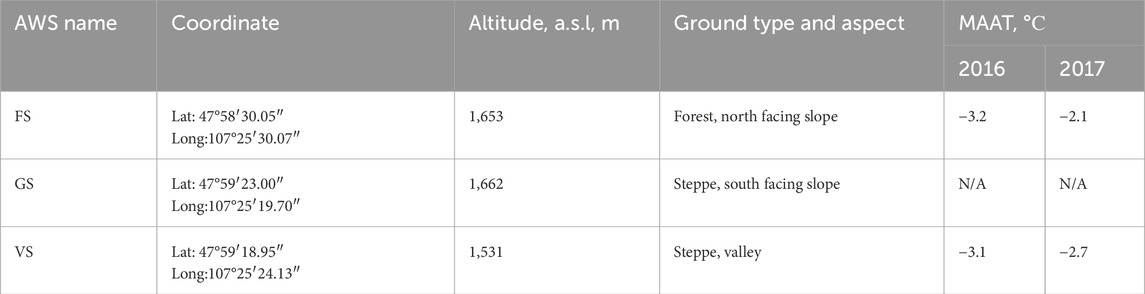
Table 1. Position and site description of automatic meteorological stations.
Figure 2 shows the mean annual air temperatures (MAAT) measured at the Terelj meteorological station from 1986 to 2017, ranging from about −5°C to −2°C. Over the three shown decades, temperatures have increased by about 0.75°C which largely corresponds to the general temperature trend in Mongolia. In the study period, MAAT were relatively warm with around −3°C.
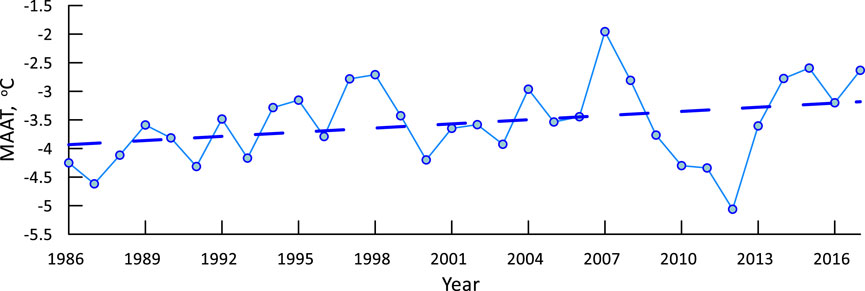
Figure 2. Mean annual air temperature (MAAT) measured at Terelj meteorological station. Dashed line: linear trend from 1986 to 2017.
3 Methods
3.1 Near-surface ground temperature and snow measurements
We installed miniature temperature data loggers, specifically Micro-Temperature Data Loggers (MTDs), 2–3 cm below the ground surface at 100 locations within an area of approximately 6 km2 (Figure 1). These devices, covering two valley sides, were deployed across a variety of elevations, slopes, and aspects, and included different land cover types. The Maxim iButton DS 1922L model was selected for its accuracy of ±0.5°C and a resolution of 0.0625°C, ensuring precise temperature measurements critical for our study (Thermochron iButton, 2014). The measurements were automatically conducted at 4-h temporal resolution. The loggers were installed on 1 Aug 2015, and continued until the logger malfunctioned, which generally occurred by summer 2018. For the main analysis, we concentrated on 59 points for which the two complete years 2016 and 2017 are available. Twenty-four of these points are located in rather dry steppe areas, ten are in the relatively moist grasslands in the central valley, and twenty-five points are located in forest areas (Figure 1). For the analysis, the sites are divided into two categories according to their surface type, i.e., forest and grassland.
While there can be differences between the ground surface temperature (i.e., skin temperature when the ground is not snow-covered) and the measured temperatures 2–3 cm below the ground surface for individual points in time, these largely cancel out for longer-term averages (e.g., Gisnås et al., 2014; Way and Lewkovicz, 2018), making it possible to derive long-term averages of ground surface temperature from our measurements. In line with previous studies using similar measurement setups (e.g., Luo et al., 2019; Zweigel et al., 2021), we therefore use the well-established term “MAGST” (Mean Annual Ground Surface Temperature), when referring to annual averages of near-surface ground temperature derived from our measurements. In all other cases, we use the term “near-surface ground temperature” throughout the manuscript.
A survey with local residents was conducted to establish the start and end dates of a stable winter snow cover, and the results were cross-checked by comparing them to the records of the near-surface ground temperature (Klein et al., 2016). Additionally, in situ measurements of the snow depth and density were conducted on 20 February 2017, at various locations with MTDs. The date of the snow survey was selected to approximately coincide with the annual maximum of snow depths in the study area (Sturm et al., 2010, Sturm and Liston, 2021). In addition, air temperature data from meteorological stations located within and close to the study area (Table 1) are used for interpretation of near-surface ground temperatures.
3.2 Satellite remote sensing data
To further characterize the study area, we use spectrally resolved late summer surface reflectance from the Sentinel-2A satellite and the global digital elevation model (GDEM) from the Advanced Spaceborne Thermal Emission and Reflection Radiometer (ASTER) onboard the Terra satellite (Table 2).
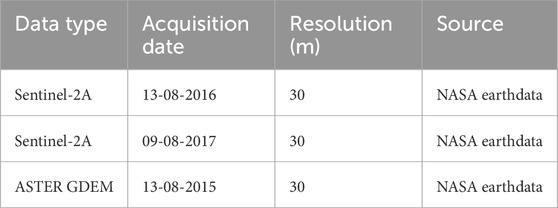
Table 2. Satellite data used to calculate indices.
From Sentinel-2A, data, the Normalized Difference Vegetation Index (NDVI), Normalized Difference Water Index (NDWI), Normalized Difference Moisture Index (NDMI), Soil Adjustment Vegetation Index (SAVI), and Modified Soil Adjustment Vegetation Index (MSAVI), Modified Normalized Difference Water Index (MNDWI) have been calculated (Table 3) for the pixel closest to each logger site (see Table 3).
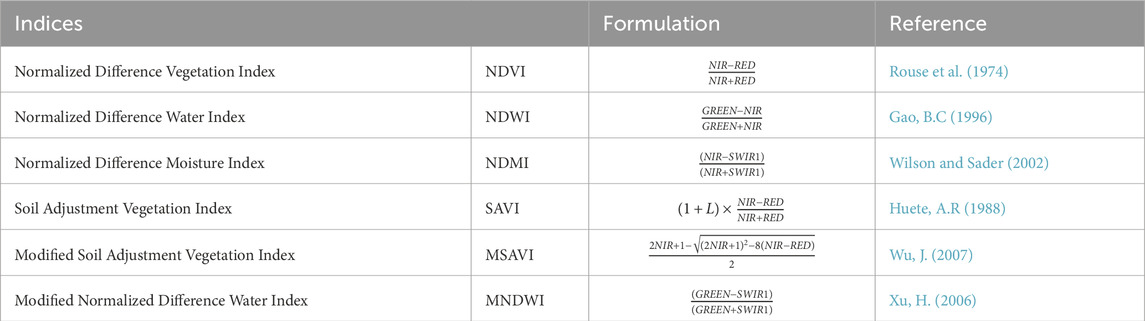
Table 3. Indices used to analyse with MAGST (mean annual ground surface temperature).
Furthermore, we determine the elevation, slope, aspect and the potential incoming solar radiation for all logger points from the ASTER GDEM (Abrams, M., 2015) using ArcGIS (©).
3.3 Frost number
To analyse the surface offset between air and near-surface ground temperatures, we calculate thawing degree days (TDD) and frezing degree days (FDD) from air and near-surface ground temperature:
where, FDDS and TDDS are freezing and thawing degree days near the ground surface,
Furtermore, we determine the frost number Fn (also called “permafrost index”), which is a measure for the likelihood of permafrost occurrence (Smith and Riseborough, 1996):
Frost numbers smaller than 0.5 indicate that permafrost-free conditions are likely, while frost numbers higher than 0.5 are indicative for permafrost.
4 Results
4.1 Spatial variability of near-surface ground temperatures
Of the 59 analysed sites, 25 points are located in grasslands the flat valley and south facing slopes, while 34 points are located in forested areas mainly on north-facing slopes. Figure 3 shows histograms for seasonal average near-surface ground temperature for these two main landcover types for both 2016 and 2017. In winter, near-surface ground temperatures of the “forest” points are on average warmer than the “grassland” points, while summer and spring temperatures are significantly warmer. In autumn, near-surface ground temperatures are more similar, but still on average warmer for the grassland sites. This pattern is largely consistent in both analysed years (Figure 3), as well as for the entire time series containing three winter and summer seasons (Figure 4).
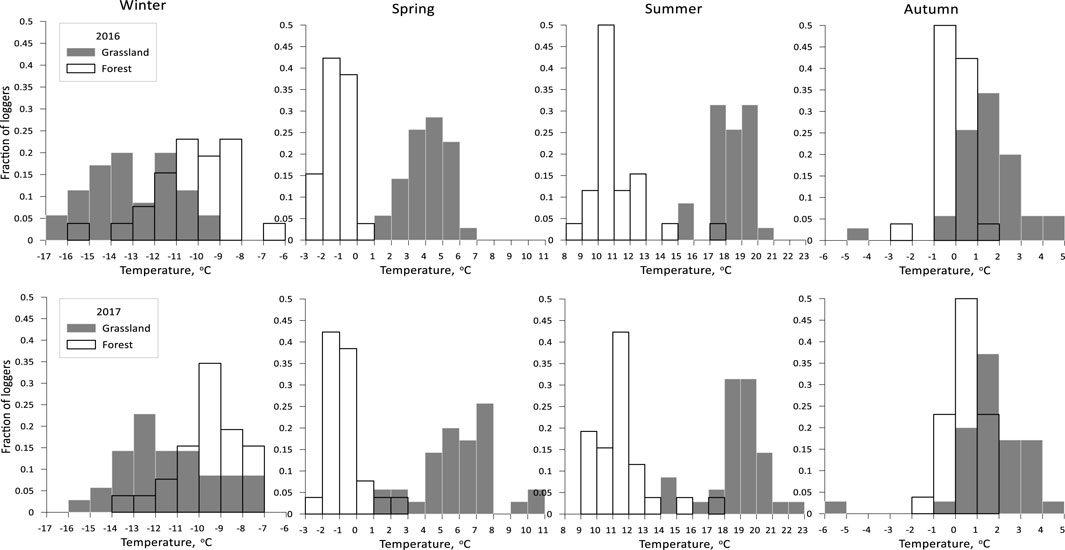
Figure 3. Histogram of mean seasonal near-surface ground temperature of the loggers at the study area in 2016 (N=59) and 2017 (N=59). Mean winter temperature (December, January, February); mean spring temperature (March, April, May); mean summer temperature (June, July, August); mean autumn temperature (September, October, November).
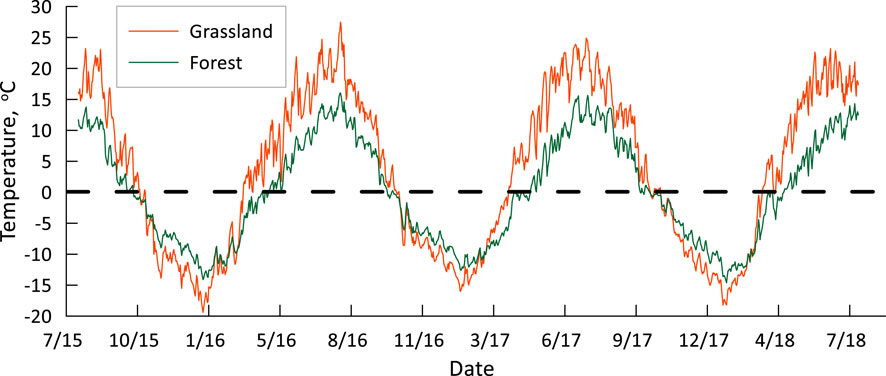
Figure 4. Daily average near-surface ground temperature of forest (mean of 25 sites) and grassland sites (mean of 34 sites).
4.2 Controlling factors of near-surface ground temperature
Figure 5 shows the dependence of mean annual near-surface ground temperature (denoted MAGST, see Section 3) on topographic factors and snow depth. Aspect is a major control for MAGST, with south-facing aspects on average more than 4°C warmer than north-facing expositions (Figure 5), for which MAGST between −1°C and 1°C are observed. Furthermore, north-facing expositions are largely associated with forests, while grasslands dominate the south-facing expositions. In contrast, the elevation is uncorrelated with MAGST (Figure 5), which suggests that elevation-dependent differences in climate are overridden by other factors. Similarly, there is no clear dependence on the slope, especially for the forest sites. However, there is a strong positive correlation with potential incoming solar radiation (Figure 5) which is controlled by both slope and aspect, with R2 values between 0.57 and 0.64.
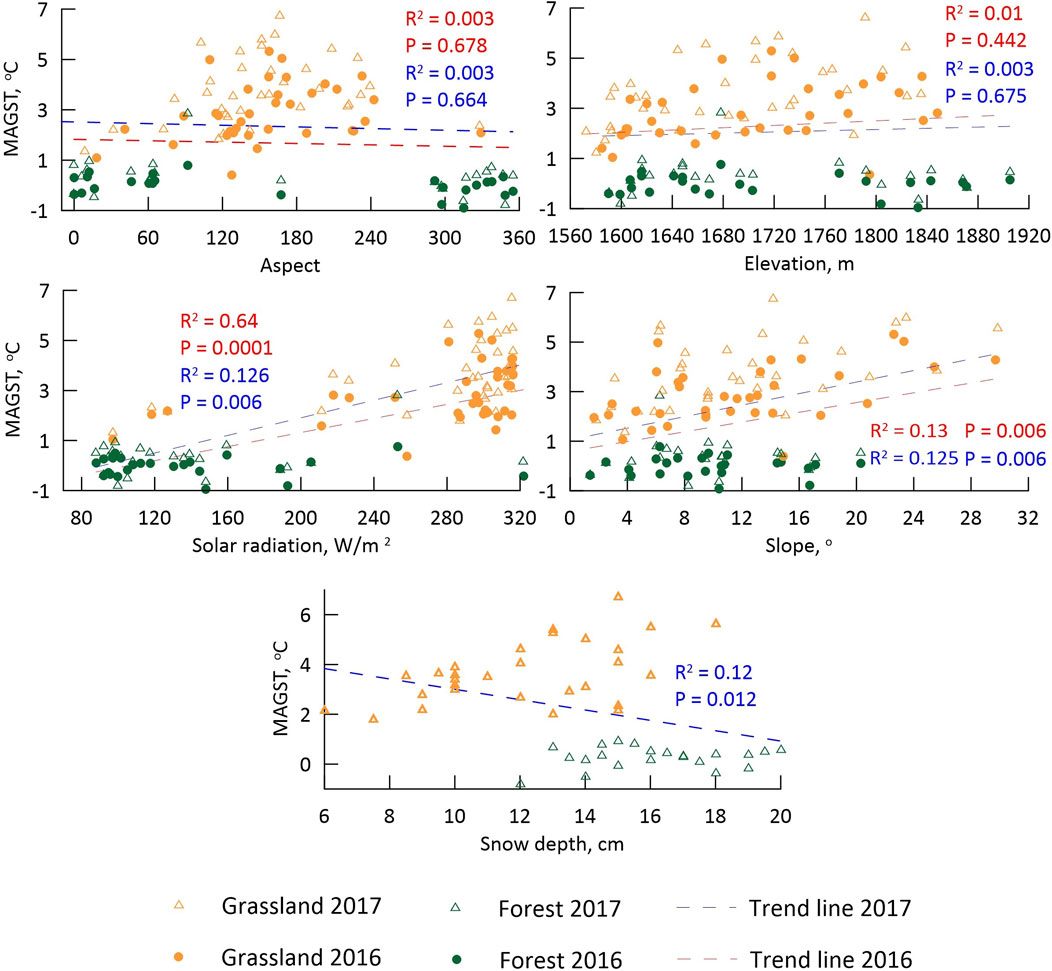
Figure 5. Correlation between topographic factors and snow depth and mean annual ground surface temperature (MAGST, see Sect. 3) of 59 points in the study area in 2016 and 2017.
For the year 2017, the data illustrate only a very moderate correlation between February snow depth and MAGST (R2 = 0.12), indicating that the impact of the snow cover on annual averages of near-surface ground temperatures is less pronounced compared to solar radiation. The measured snow height varied between 6 and 20 cm, with low snow depths generally associated with grasslands and thus higher values of MAGST (Figure 5). On the contrary, average winter (December to February) near-surface ground temperatures were strongly correlated with snow depth (R2 = 0.72, Figure 6), with low snow depths associated with low average winter near-surface ground temperatures, likely due to the thermally insulating effect of the seasonal snow cover. This shows that while the snow cover is a major control on the ground thermal regime during the winter season, its effect is largely overridden by other factors for annual averages. Table 4 presents the results of the snow cover duration analysis, showing that a stable snow cover forms more than 10 days earlier for the forested compared to the grassland sites. Furthermore, the snow disappears considerably earlier at the grassland sites, with a difference of approximately 1 month, leading an about 40 days longer snow-covered period for the sites located in forest (Table 4) which likely contributes to the overall lower MAGST values in the forested areas.
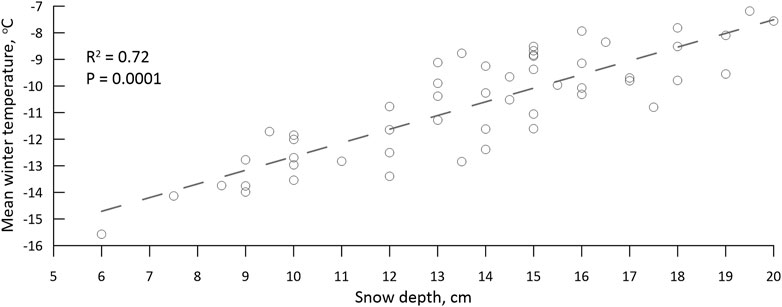
Figure 6. Correlation between snow depth and mean winter (December, January and February) near-surface ground temperature in 2017.
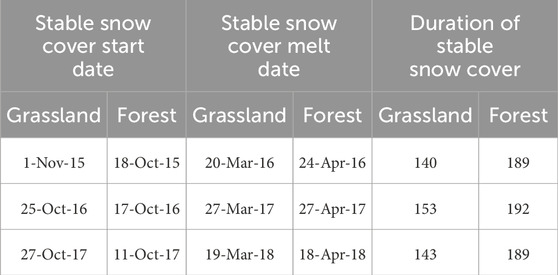
Table 4. Stable snow cover start, melt date, and duration during the study period, based on interview data from local people.
4.3 Remote sensing indices as predictors for MAGST
Figure 7 shows the relationship between the six indices and the measured MAGST. All indices are to some extent correlated with MAGST, with R2 values between 0.45 and 0.75. The main reason for this strong correlation is their ability to distinguish between the grassland and forest which was found to be a major control for near-surface ground temperatures (Section 4.1). In general, the vegetation-related indices perform better than the soil moisture related indices, especially NDVI and SAVI for which R2 values exceeded 0.7 in both years (Figure 7). The weakest correlation was found with MNDWI (R2 = 0.45). It is worth pointing out that the best-performing satellite-derived indices outperform topography-based predictors for MAGST in our study area, although the potential incoming solar radiation shows a similar significant correlation.
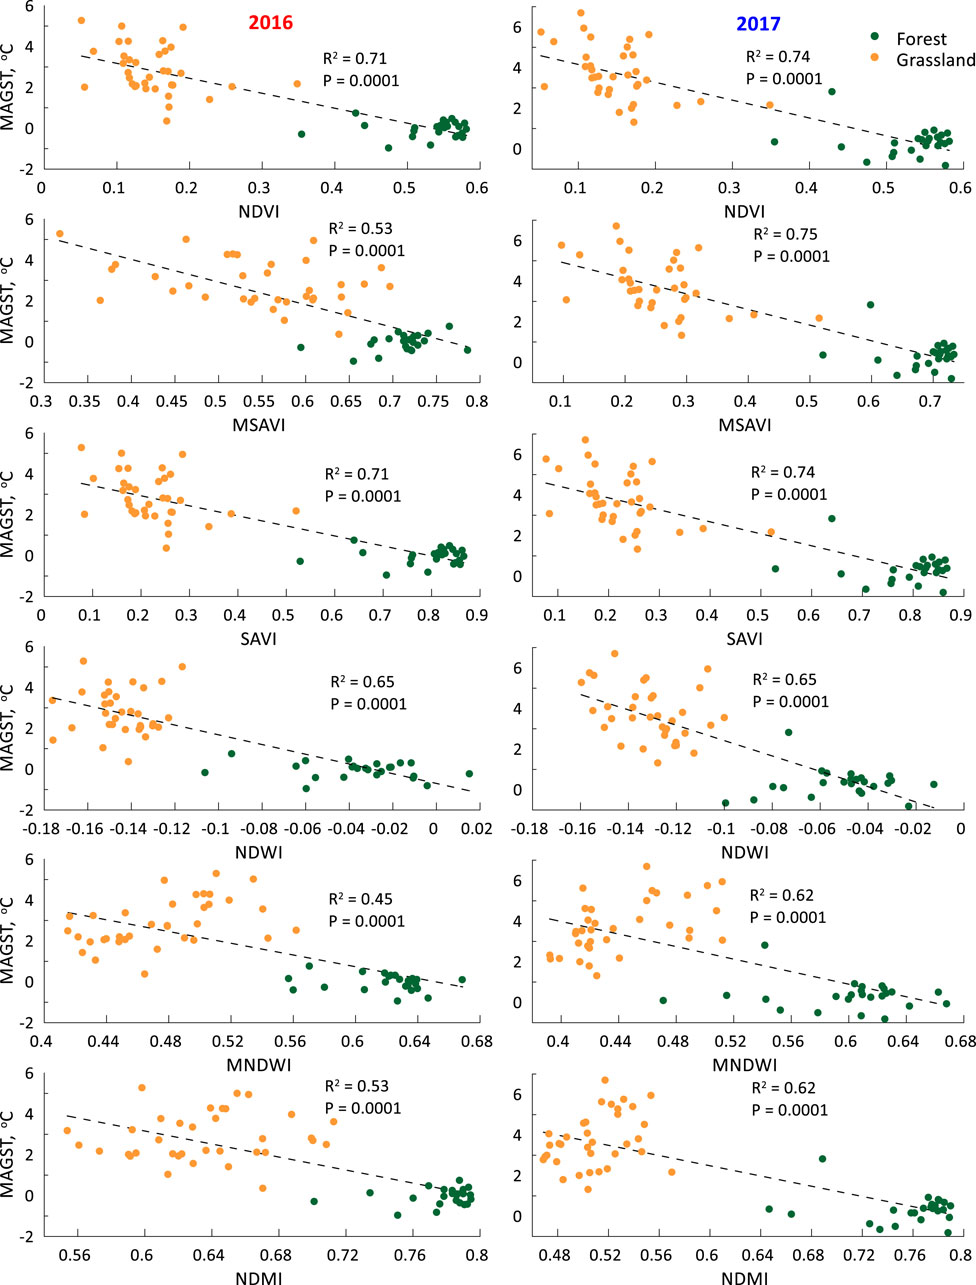
Figure 7. MAGST (mean annual ground surface temperature, see Section 3) vs. NDWI (Normalized Difference Water Index), NDVI (Normalized Difference Vegetation Index), MSAVI (Modified Soil Adjusted Vegetation Index), MNDWI (Modified Normalized Difference Water Index), SAVI (Soil Adjusted Vegetation Index), and NDMI (Normalized Difference Moisture Index), for the years 2016 and 2017.
4.4 Implications for permafrost occurrence
Figure 8 shows the distribution of frost number (FN) values across different temperature data loggers placed in grassland and forest ecosystems. For the grassland areas, the frost numbers are exclusively below 0.5, indicating permafrost-free conditions. In contrast, the frost number values for forested areas are predominantly higher than 0.5, thus giving a high probability for permafrost presence. However, the frost numbers are generally close to 0.5 which indicates warm permafrost which may be close to thawing.
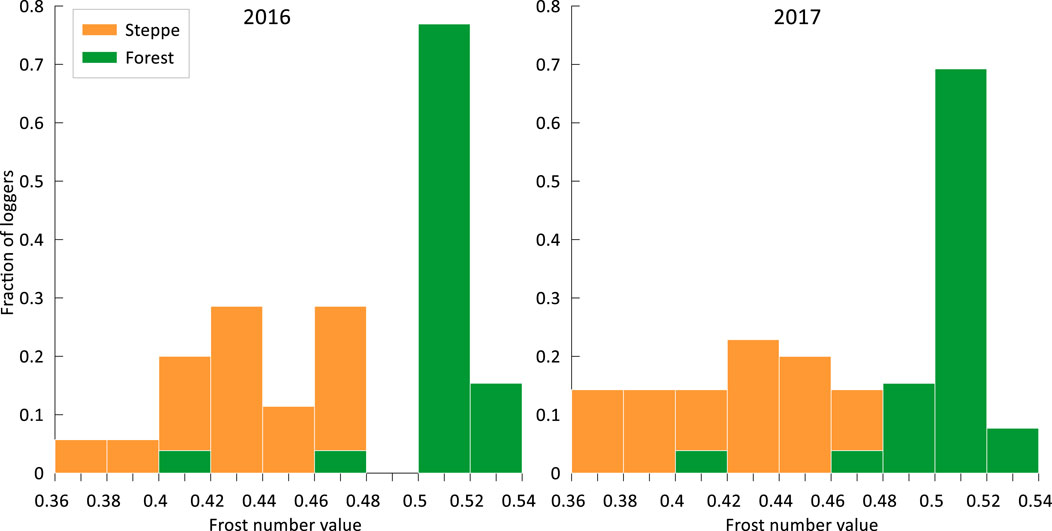
Figure 8. Histogram of frost number values of the loggers at the study area in 2016 and 2017 (N=59).
5 Discussion
5.1 Uncertainties and limitations
This study aims to capture the spatial variability of near-surface ground temperatures within the study area, but it is unclear to what extent the 59 analysed temperature loggers can indeed represent the true spatial distribution of near-surface ground temperature. While the measurements show a large variability of 8 K for the annual averages, it is possible that even colder and warmer sites exist, but likely only a few localized spots. With the available measurements, we have performed a correlation analysis with different topographic and environmental factors (Section 4.2), as well as satellite-derived hyperspectral indices (Section 4.3). Hereby, the coarse spatial resolution (30 m pixels) of both the employed DEM and the satellite products can be a limiting factor, as the logger represents only a single point within the footprint and factors like exposition and surface reflectance could vary at smaller spatial scales. While this can be problematic for single sites, the large number of analysed sites moderate this issue, so that we are confident that our analysis can realistically capture the correlations between key variables and the ground thermal regime. Furthermore, it must be emphasized that the different factors are not independent of each other, which makes it challenging to compare the correlation coefficients of different factors and indices. For the same reason, this study does not allow to entangle causal relationships between the ground thermal regime and ecosystem-related factors. Forests, for example, occur almost exclusively on north-facing slopes, but they also strongly affect ground temperatures (Dulamsuren et al., 2011; Dashtseren et al., 2014), so that it is not possible to separate the relative impacts of the ecosystem and the topographic controls. Here, physically-based numerical modelling studies could improve our understanding of the controlling mechanisms. For our study area, Zweigel et al. (2024) demonstrated with a land surface model that the topographic factors are likely the main control on annual average ground temperatures, while the “ecosystem control” by the forest canopy more affected the seasonal temperature amplitude of ground temperatures. The dataset presented in this study can thus be further exploited together with model approaches which rely on established process understanding to aid the interpretation of the field observations.
5.2 Relation between satellite-derived indices and near-surface ground temperature
The correlation analysis between MAGST and satellite-based indices suggests that especially indices like NDVI related to vegetation properties can be excellent predictors for the ground thermal regime. However, this finding is almost certainly restricted to the relatively small study site, or possibly similar areas in the vicinity, but it is unlikely that it can capture climate-related MAGST patterns over large spatial scales. The good correlation is likely related to the fact that basically all tested indices can very well distinguish between forest and grassland ecosystems which are strongly related to the observed near-surface ground temperatures. Nevertheless, there are clear differences in the performance of the different spectral indices, for example, the vegetation-focused indices NDVI, SAVI, and MSAVI perform better than soil moisture and evaporation-focused indices like MSAVI, NDMI, and NDWI. The widely used NDVI index has the overall best performance, on par with the SAVI index which was found to achieve a better separation in regions with low vegetation cover (Bader Almutairi and Vargas, 2013). The MSAVI index (Qi et al., 1994) performs worse than NDVI and SAVI, especially in 2016, but still better than the water-related indices, although the NDMI is developed as a measure for the amount of water contained in plants (Ajay Kumar Taloor, 2021). Surprisingly, the NDWI index has a relatively good performance although it is more suitable for mapping water bodies (Ajay Kumar Taloor, 2021). Overall, the strong performance of especially NDVI and SAVI suggests that they could be employed for upscaling purposes at least on the regional scale, possibly supported by numerical modelling or machine learning (Zweigel et al., 2024). The near-surface ground temperature observations could be further exploited to calibrate and validate remote sensing-based approaches to characterize permafrost, such as statistical models targeting ground temperatures on a continental scale (e.g., Aalto et al., 2020). In addition to multispectral satellite data, the observations presented in this study could be employed to validate and enhance satellite-based observations of land surface temperature (LST), e.g., coarse 1 km scale remote observations from MODIS (which are also employed as input for permafrost modelling, Westermann et al., 2017), or more fine-scale measurements, e.g., from Landsat (Gao, 1996).
5.3 Ground thermal regime and implications for permafrost occurrence
The warmest temperatures are recorded on south-facing slopes within the grassland/steppe ecosystem, with MAGST close to +7°C. On the other hand, the coldest MAGST of close to −1°C occurred in the forest ecosystems on north-facing slopes, thus yielding significant spatial variations of up to 8 K. Our results confirm that vegetation and solar radiation are significant in controlling near surface ground temperature (Cheng, 2004; Etzelmüller et al., 2006; Heggem et al., 2006; Kade and Walker, 2008; Dashtseren et al., 2014), while the snow depth is not a major control for MAGST in our study area, contrary to many Arctic regions (e.g., Gisnås et al., 2014). Our study shows that sites with higher snow depths are characterized by warmer winter temperatures, as expected from the insulating properties of snow (e.g., Sturm et al., 2021; Cheng, 2004). However, as high-snow sites more often occur in forest in north-facing expositions (Figure 5), the warmer winter temperatures are offset by colder spring, summer and autumn temperatures (Figure 3), thus strongly reducing the influence of snow depth on the annual mean. Furthermore, the snow cover persists around 1 month longer in the forested sites which confines near-surface ground temperatures to 0°C or below, while the snow-free grassland sites already experience positive temperatures during this period (Figure 3; Robin et al., 2024), thus contributing to the overall lower MAGST values at the forest sites.
The MAGST variability within the relatively small study area is large compared to the observed temperature increase of +2.4 K in the last 60 years, which could suggest that ecosystems can to a certain degree adapt by spreading to more suitable locations in the immediate vicinity, when conditions at their previous locations become too warm. However, this picture is clearly oversimplified, as atmospheric warming can also affect other key processes, especially precipitation and evaporation which are main controls for soil moisture conditions and ecosystems (Batima et al., 2005). This is especially true for permafrost which is largely restricted to the north-facing slopes in the study area (Jambaljav et al., 2022). The measured MAGSTs between −1 and +1°C indicate the presence of warm permafrost, considering the likely thermal offset between the ground surface and the top of the permafrost (Smith and Riseborough, 1996). This interpretation is supported by the calculated frost numbers higher than 0.5 and further corroborated by borehole measurements at the north-facing slope in the study area (Sharkhuu, 2003). Continued warming could therefore quickly lead to the loss of permafrost which may in turn affect the forest ecosystem and thus lead to a non-linear response to the warming. On the other hand, the presence of a forest canopy can change the response of the ground thermal regime to atmospheric warming (Zweigel et al., 2024). To further disentangle the interplay between climatic, topographic, and ecosystem-related factors, a close integration of field observations (as presented in this study), manipulation experiments (Batima et al., 2005), and land surface modelling (e.g., Zweigel et al., 2024) could be a promising way forward.
6 Conclusion
In this study, we present 2 years of measurements of spatially distributed near-surface ground temperatures from a 6 km2 large study area in Central Mongolia which features a range of different elevations, expositions, and ecosystem types. We analyze observations from more than 50 sites, which constitute a near-representative sample of conditions within the area, so that it is possible to analyze the governing factors of the ground thermal regime. From the study, the following conclusions can be drawn:
• The spatial variability of annual average near-surface ground temperatures is on the order of 8 K, highlighting the large range of ground thermal conditions which shape the local ecosystems.
• Altitude and winter snow depth is largely uncorrelated with annual average near-surface ground temperatures, while slope and aspect, and the related potential incoming short-wave radiation are strong controls.
• Forest ecosystems, which are almost entirely located on local north-facing slopes, feature significantly colder annual average near-surface ground temperatures than grassland ecosystems, indicating the presence of permafrost. Permafrost conditions are less likely for grassland sites, and the warmest sites are located on steep south-facing slopes in grasslands,
• In grasslands, near-surface ground temperatures are warmer in spring, summer, and fall compared to forests, while they are colder in the winter season.
• Spectral indices sensitive to vegetation, such as the Normalized Difference Vegetation Index (NDVI), are good predictors for mean annual near-surface ground temperatures, with square correlation coefficients R2 exceeding 0.7.
The study presents a new observational dataset on the spatial variability of the ground thermal regime in permafrost regions. Especially for Central Asian permafrost, which is strongly dominated by the radiation regime, such datasets are extremely rare. However, they can provide valuable information to better understand the governing factors of the ground thermal regime and assess the impacts of climate change on the spatial patterns of ecosystems and permafrost. Our findings emphasize the importance of vegetation cover and topographic factors in controlling near-surface ground temperatures and permafrost stability. The data can be further utilized in conjunction with modeling studies to improve the predictive understanding of permafrost dynamics under changing climatic conditions. Additionally, the correlation between spectral indices and ground temperatures suggests potential for upscaling in situ observational data using remote sensing techniques, thereby enhancing the spatial coverage and resolution of permafrost monitoring efforts. This can aid in developing adaptive strategies to mitigate the impacts of climate change on permafrost and associated ecosystems.
Author contributions
KT: Conceptualization, Data curation, Formal Analysis, Funding acquisition, Investigation, Methodology, Project administration, Resources, Software, Supervision, Validation, Visualization, Writing–original draft, Writing–review and editing. AD: Data curation, Funding acquisition, Project administration, Resources, Writing–review and editing. BE: Writing–review and editing. TU: Writing–review and editing. KA: Writing–review and editing. SW: Conceptualization, Data curation, Formal Analysis, Funding acquisition, Methodology, Project administration, Resources, Supervision, Writing–original draft, Writing–review and editing.
Funding
The author(s) declare that financial support was received for the research, authorship, and/or publication of this article. We acknowledge funding from Permafrost4Life (Research Council of Norway, grant no. 301639) and the European Space Agency CCI+ Permafrost (grant no. 4000123681/18/I-NB).
Acknowledgments
We would like to express our sincere gratitude to all individuals and organizations that contributed to the success of this research. Firstly, we thank the local residents of Terelj for their invaluable assistance and cooperation during the field surveys and interviews. Your insights and knowledge were crucial for understanding the local climatic and environmental conditions. We are deeply grateful to the Institute of Geography and Geoecology at the Mongolian Academy of Sciences for their support and collaboration.
Conflict of interest
The authors declare that the research was conducted in the absence of any commercial or financial relationships that could be construed as a potential conflict of interest.
Publisher’s note
All claims expressed in this article are solely those of the authors and do not necessarily represent those of their affiliated organizations, or those of the publisher, the editors and the reviewers. Any product that may be evaluated in this article, or claim that may be made by its manufacturer, is not guaranteed or endorsed by the publisher.
Supplementary material
The Supplementary Material for this article can be found online at: https://www.frontiersin.org/articles/10.3389/feart.2024.1456012/full#supplementary-material
References
Aalto, J., Schuur, E. A. G., Kuhry, P., Parmentier, F. J. W., and Christensen, T. R. (2020). Statistical permafrost modeling using a process-based model approach. J. Geophys. Res. Earth Surf. 125 (1), e2019JF005104. doi:10.1029/2019JF005104
Ajay Kumar Taloor (2021). Remote sensing applications for vegetation and water Resources. Springer. doi:10.1007/978-3-030-68771-1
Bader Almutairi, K., and Vargas, R. (2013). Soil moisture controls on carbon dioxide and methane fluxes in desert soils. Soil Sci. Soc. Am. J. 77 (2), 603–617. doi:10.2136/sssaj2012.0242
Batchuluun, T., Khishigjargal, T., and Bayarmaa, B. (2021). Forest-steppe transitions in Mongolia. Mong. J. Biol. Sci. 15 (1), 47–58.
Batima, P., Natsagdorj, L., Gombluudev, P., and Erdenetsetseg, B. (2005). Observed climate change in Mongolia. AIACC Work. Pap. 12, 1–26.
Biskaborn, B. K., Smith, S. L., Noetzli, J., Matthes, H., Vieira, G., Streletskiy, D. A., et al. (2019). Permafrost is warming at a global scale. Nat. Commun. 10 (1), 264. doi:10.1038/s41467-018-08240-4
Cheng, G. (2004). Influences of local factors on permafrost occurrence and their impacts on environmental change. (2), 87–94. doi:10.1002/ppp.486
Dashtseren, A. (2021). “Permafrost in Mongolia,” in The physical Geography of Mongolia (Cham: Springer International Publishing), 119–133.
Dashtseren, A., Ishikawa, M., Iijima, Y., and Jambaljav, Y. (2014). Temperature regimes of the active layer and seasonally frozen ground under a forest-steppe mosaic, Mongolia. Permafr. Periglac. Process. 25, 295–306. doi:10.1002/ppp.1824
Dashtseren, A., Temuujin, K., Westermann, S., Batbold, A., Amarbayasgalan, Y., and Battogtokh, D. (2021). Spatial and temporal variations of freezing and thawing indices from 1960 to 2020 in Mongolia. Front. Earth Sci. 9, 713498. doi:10.3389/feart.2021.713498
Dulamsuren, C., Hauck, M., and Leuschner, C. (2011). Recent drought stress leads to growth reductions in Larix sibirica in the western Khentey, Mongolia. Glob. Change Biol. 16 (9), 3024–3035. doi:10.1111/j.1365-2486.2009.02147.x
Etzelmüller, B., Heggem, E. S. F., Sharkhuu, N., Frauenfelder, R., Kääb, A., and Goulden, C. (2006). Mountain permafrost distribution modelling using a multi-criteria approach in the Hövsgöl area, northern Mongolia. Permafr. Periglac. Process. 17 (2), 91–104. doi:10.1002/ppp.554
Gao, B. C. (1996). NDWI—a normalized difference water index for remote sensing of vegetation liquid water from space. Remote Sens. Environ. 58 (3), 257–266. doi:10.1016/s0034-4257(96)00067-3
Gisnås, K., Westermann, S., and Schuler, T. V. (2014). Small-scale variation of snow in a regional permafrost model. Cryosphere 8 (6), 2061–2075.
Heggem, E. S. F., Etzelmüller, B., Anarmaa, S., Sharkhuu, N., Goulden, C. E., and Nandintsetseg, B. (2006). Spatial distribution of ground surface temperatures and active layer depths in the Hövsgöl area, northern Mongolia. Permafr. Periglac. Process. 17 (4), 357–369. doi:10.1002/ppp.568
Huete, A. R. (1988). A soil-adjusted vegetation index (SAVI). Remote Sens. Environ. 25 (3), 295–309. doi:10.1016/0034-4257(88)90106-x
IPCC. (2013). Climate change 2013: the physical science basis. Contribution of working group I to the fifth assessment report of the intergovernmental panel on climate change.
Ishikawa, M., Johansen, O., Brown, J., Yoshikawa, K., Ladanyi, B., Allard, M., et al. (2005). Thermal regimes at the permafrost table and their implications for permafrost monitoring in Svalbard. Permafr. Periglac. Process. 16 (1), 23–33. doi:10.1002/ppp.512
Ishikawa, M., Jamvaljav, Y., Dashtseren, A., Sharkhuu, N., Davaa, G., Iijima, Y., et al. (2018). Thermal states, responsiveness and degradation of marginal permafrost in Mongolia. Permafr. Periglac. Process. 29 (4), 271–282. doi:10.1002/ppp.1990
Jambaljav, Y., Sharkhuu, N., and Yoshikawa, K. (2022). Mapping of permafrost in Mongolia. (1), 83–95. doi:10.1002/ppp.2071
Kade, A., and Walker, D. A. (2008). Experimental alteration of vegetation on nonsorted circles: effects on cryogenic activity and implications for climate change in the Arctic. Arct. Antarct. Alp. Res. 40 (1), 96–103. doi:10.1657/1523-0430(06-029)[kade]2.0.co;2
Klein, G., Vitasse, Y., Rixen, C., Marty, C., and Rebetez, M. (2016). Shorter snow cover duration since 1970 in the Swiss Alps due to earlier snowmelt more than to later snow onset. Clim. Change 139 (3-4), 637–649. doi:10.1007/s10584-016-1806-y
Luo, D., Jin, H., He, R., Wu, Y., Yu, J., Shen, G., et al. (2019). Diversity patterns of the rhizosphere and bulk soil microbial communities along an altitudinal gradient in an alpine ecosystem of the eastern Tibetan Plateau. Geoderma 338, 118–127. doi:10.1016/j.geoderma.2018.11.047
MARCC. (2014). Mongolia Second Assessment Report on Climate Change 2014. Ministry of Environment, Green Development and Tourism, Mongolia.
Qi, J., Chehbouni, A., Huete, A. R., Kerr, Y. H., and Sorooshian, S. (1994). A modified soil adjusted vegetation index. Remote Sens. Environ. 48 (2), 119–126. doi:10.1016/0034-4257(94)90134-1
Robin, A., Smith, J., and Doe, B. (2024). Impact of livestock activity on near-surface ground temperatures in Mongolia. J. Environ. Impact Stud. 45 (1), 204–220. doi:10.1234/jeis.2024.88456
Rödder, A., and Kneisel, C. (2012). Impact of Topography and Vegetation on Ground Temperature in Permafrost Regions: Insights from the Mongolian Altai. Geomorphology 159-160, 1–10.
Rouse, J. W., Haas, R. H., Schell, J. A., and Deering, D. W. (1974) Monitoring vegetation systems in the great plains with ERTS, 351. NASA Special Publication, 309.
Sharkhuu, N. (2003). “Recent changes in the permafrost of Mongolia,” in Proceedings of the 8th international conference on permafrost, 21–25.
Shur, Y. L., and Jorgenson, M. T. (2007). Patterns of permafrost formation and degradation in relation to climate and ecosystems. Permafr. Periglac. Process. 18 (1), 7–19. doi:10.1002/ppp.582
Smith, M. W., and Riseborough, D. W. (1996). Permafrost monitoring and detection of climate change. Permafr. Periglac. Process. 7 (4), 301–309. doi:10.1002/(sici)1099-1530(199610)7:4<301::aid-ppp231>3.0.co;2-r
Sturm, M., Holmgren, J., and Liston, G. E. (2010). A seasonal snow cover classification system for local to global applications. J. Clim. 13 (21), 3754–3769.
Sturm, M., and Liston, G. E. (2021). Revisiting the global seasonal snow classification: an updated dataset for earth system applications. J. Hydrometeorol. 22, 2917–2938. doi:10.1175/JHM-D-21-0070.1
Way, R. G., and Lewkowicz, A. G. (2018). Environmental controls on ground temperature and permafrost in Labrador, northeast Canada. Permafr. Periglac. Process. 29, 73–85. doi:10.1002/ppp.1972
Westermann, S., Langer, M., Boike, J., Heikenfeld, M., Peter, M., Etzelmüller, B., et al. (2017). Modeling the impact of heterogeneity in surface conditions and soil properties on the thermal regime of permafrost. (3), 1333–1350.
Wilson, E. H., and Sader, S. A. (2002). Detection of forest harvest type using multiple dates of Landsat TM imagery. Remote Sens. Environ. 80 (3), 385–396. doi:10.1016/s0034-4257(01)00318-2
Wu, J., Wang, D., and Bauer, M. E.(2007). Assessing broadband vegetation indices and QuickBird data in estimating leaf area index of corn and potato canopies. Field Crops Research, 102(1), 33–42. doi:10.1016/j.fcr.2007.01.003
Xu, H. (2006). Modification of normalised difference water index (NDWI) to enhance open water features in remotely sensed imagery. Int. J. Remote Sens. 27 (14), 3025–3033. doi:10.1080/01431160600589179
Zhang, T. (2005). Influence of the seasonal snow cover on the ground thermal regime: An overview. Rev. Geophys. 43 (4), RG4002. doi:10.1029/2004rg000157
Zweigel, R. B., Dashtseren, A., Temuujin, K., Aalstad, K., Webster, C., Stuenzi, S. M., et al. (2024). Simulating the thermal regime and surface energy balance of a permafrost-underlain forest in Mongolia. J. Geophys. Res. Earth Surf. 129, e2023JF007609. doi:10.1029/2023jf007609
Keywords: permafrost, ground surface temperature, snow cover, topography, vegetation, remote sensing, climate change
Citation: Temuujin K, Dashtseren A, Etzelmüller B, Undrakhtsetseg T, Aalstad K and Westermann S (2024) Spatial variability of near-surface ground temperatures in a discontinuous permafrost area in Mongolia. Front. Earth Sci. 12:1456012. doi: 10.3389/feart.2024.1456012
Received: 27 June 2024; Accepted: 19 September 2024;
Published: 17 October 2024.
Edited by:
Zhongqiu Sun, Northeast Normal University, ChinaReviewed by:
Xiaoying Jin, Northeast Forestry University, ChinaRensheng Chen, Chinese Academy of Sciences (CAS), China
Copyright © 2024 Temuujin, Dashtseren, Etzelmüller, Undrakhtsetseg, Aalstad and Westermann. This is an open-access article distributed under the terms of the Creative Commons Attribution License (CC BY). The use, distribution or reproduction in other forums is permitted, provided the original author(s) and the copyright owner(s) are credited and that the original publication in this journal is cited, in accordance with accepted academic practice. No use, distribution or reproduction is permitted which does not comply with these terms.
*Correspondence: Khurelbaatar Temuujin, dGVtdXVqaW5raEBtYXMuYWMubW4=; Sebastian Westermann, c2ViYXN0aWFuLndlc3Rlcm1hbm5AZ2VvLnVpby5ubw==