 Lei Liu
 Zhilin Ren2
 Jinkai Yan
- 1Urban Construction School, Beijing City University, Beijing, China
- 2Key Laboratory of Ministry of Education for Geomechanics and Embankment Engineering, Hohai University, Nanjing, China
- 3Chinese Academy of Geological Sciences, Beijing, China
Ground fissures, as a typical geohazard, pose potential georisks to the construction and maintenance of urban transportation infrastructure. Under the influence of ground fissures, the segmented tunnel structure used in subway systems complicates the propagation of subway train vibrations. In this study, the soil acceleration, earth pressure and contact pressure of a three-section subway tunnel under dynamic loading of a subway train in a ground fissure environment were observed and analyzed by physical modeling tests, and the effects of the presence and activity of the ground fissure and tunnel segmentation were discussed. The results show that the vibration generated by the subway traveling will have different degrees of attenuation when propagating in all directions in the soil layer, and the ground fissure has a damping effect on the subway vibration. The attenuation and enhancement of acceleration by ground fissure is affected by the activity and propagation direction of ground fissure. The distribution of additional earth pressure is affected by the ground fissure, soil contact state, which is related to the ground fissure activity state. The ground fissure activity on the contact additional pressure mainly focuses on the bottom and top of the tunnel and there are differences in the location of the hanging wall and footwall. Three-section tunnels have a stronger vibration response and vibration attenuation than monolithic tunnels due to the influence of segmentation. Based on the consideration of the effects of ground fissure and tunnel segmentation, the tunnel design mainly takes into account the amount of ground fissure activity and determines the structural measures, the tunnel structure at the location of the ground fissure is strengthened, in addition to the vibration attenuation measures for the segmented tunnels when crossing the ground fissure. The discussion of mechanical response and design measures in this study helps to reduce the georisk of ground fissures on urban underground transportation infrastructure.
1 Introduction
The propagation of subway train vibrations through the ground and their impact on the surrounding environment is a significant issue in urban construction. Numerous studies have been conducted both domestically and internationally on the dynamic effects of subway train vibrations on tunnel structures and the propagation patterns of these vibrations through the ground. These studies have employed various methods, including numerical simulations (Wang et al., 2019; Nezhadshahmohammad et al., 2021; Gu et al., 2022; Guo et al., 2022; Wang et al., 2022; Wang et al., 2023), model tests (Yang et al., 2018; Guo et al., 2023; Yang et al., 2023), a combination of model tests and numerical simulations (Zhang et al., 2018; Yan et al., 2020; Wu et al., 2021), and a combination of field monitoring data and numerical simulations (Huang et al., 2021; Sun et al., 2023). Substantial findings have been achieved through these efforts.
However, certain cities, such as Xi’an, possess unique geological environments that can impact the propagation of subway train vibrations. In Xi’an, for instance, the subway system operates within a geological setting characterized by active ground fissures. Ground fissures, as a typical geohazard occurring in cities, pose a potential geohazard risk to the construction and maintenance of urban transportation infrastructure (Bian et al., 2023, 2024a). With 14 active ground fissures in the area, the interaction between the strata near these fissures and the subway tunnel structure becomes significantly more intricate. Firstly, the presence of ground fissures can alter the propagation path and pattern of subway train loads. Secondly, the activities of these ground fissures result in constant changes in the interaction state between the subway tunnel and the surrounding strata, including fluctuations in contact pressure and the formation of void zones. These dynamics create a scenario where the dynamic interaction between the strata and the tunnel structure in the ground fissure environment differs substantially from that in stable soil conditions (Yu et al., 2023; Zhang et al., 2024a; Zhang et al., 2024b; Yang et al., 2024). Additionally, to ensure the safe operation of the subway, the Xi’an subway system employs a segmented tunnel structure. The coexistence of ground fissures and segmented subway tunnel structures complicates the propagation of train vibrations within the Xi’an subway system significantly. Research on impact assessment and preventive measures for geohazards is key to mitigating the risk of geohazards (Feng et al., 2023; Cai et al., 2024; Bian et al., 2024b). Therefore, it is imperative to elucidate the dynamic interaction between ground fissures and segmented subway tunnels under subway train loading for the normal operation and effective control of vibration effects within the Xi’an subway system.
In the study of the dynamic interaction between subway tunnels and the ground in the presence of ground fissures, most research has focused on the dynamic interactions under seismic conditions. Liu et al. (2019a), Liu et al. (2019b) used shaking table tests and numerical simulation models to investigate the activity and damage caused by ground fissures under seismic conditions, examining tunnel acceleration, earth pressure, and tunnel structure strain. Chang et al. (2023) simulated the dynamic response of subway tunnels at varying distances from ground fissures by establishing a numerical model of a typical ground fissure site. For the issue of dynamic stability of tunnels crossing faults, Song et al. (2024) investigated the seismic response characteristics of surrounding rock and tunnel structures using a three-dimensional model and a joint time-frequency analysis method.
Regarding the dynamic interaction under train load conditions, Yang et al. (2015) employed numerical simulation methods to study the dynamic interaction between subway tunnels crossing ground fissure zones and the soil under subway load, focusing on the contact pressure between the lining and soil, the transmission patterns of dynamic stress in the soil, and the extent of vibration impact. Additionally, Yang et al. (2019) conducted physical model tests to analyze the impact of train speed and excitation frequency on the soil on both sides of a ground fissure under orthogonal conditions of ground fissure and shield tunnel, from the perspective of soil acceleration. Liu et al. (2017a), Liu et al. (2017b), Liu et al. (2018), Liu et al. (2022) investigated the vibration response induced by subway operation under oblique crossing conditions of subway tunnels and ground fissures using model tests and numerical simulations.
In general, research on the dynamic interaction of subway train loads on subway tunnels in ground fissure environments is limited, particularly with regard to segmented subway tunnels intersecting diagonally with ground fissures, which has received little specific attention. In the Xi’an metro line, the subway intersects ground fissures at oblique angles in numerous locations. This study aims to address this gap by investigating the dynamic interaction between ground fissures and diagonally intersecting three-section horseshoe subway tunnels through physical modeling tests. Specifically, through the ground fissure environment subway train dynamic load on the subway tunnel under the action of soil acceleration, earth pressure, soil and tunnel contact pressure observation and analysis. Summarize the interaction law between ground fissure and three-section subway tunnel under the action of dynamic train load. Determine the effects of ground fissure activity and tunnel segmentation. Ultimately provide assistance for vibration control measures and safety monitoring of segmented subway tunnels in ground fissure areas.
2 Experimental design
2.1 Test principles and devices
The test principle of this study involves designing and fabricating a scaled-down model based on determining the appropriate similarity proportion according to the actual engineering conditions and test requirements. The scaled-down model comprises the soil model and the subway tunnel model. The ground fissures was pre-set in the soil model to simulate fault dislocation due to ground fissure activity by controlling the descent of the hanging wall on the ground fissure, as shown by the arrow at the bottom of the hanging wall in Figure 1A. The vibration of the subway train is simulated using shakers installed in the subway tunnel model, allowing investigation into the dynamic response of the subway tunnel in the ground fissure section under vibration load, particularly in the case of diagonal intersection between the subway and the ground fissure. Accelerometers and pressure cells are utilized to measure the propagation characteristics of subway vibration and the stress distribution within the tunnel. In the test model, the ground fissure has an inclination angle of 80°, the intersection angle between the ground fissure and the subway tunnel is set at 60°, and the subway tunnel structure consists of three sections. The schematic diagram of the test model is presented in Figure 1B. In particular, the terminology related to geohazards and georisks involved in this study is shown in Table 1.
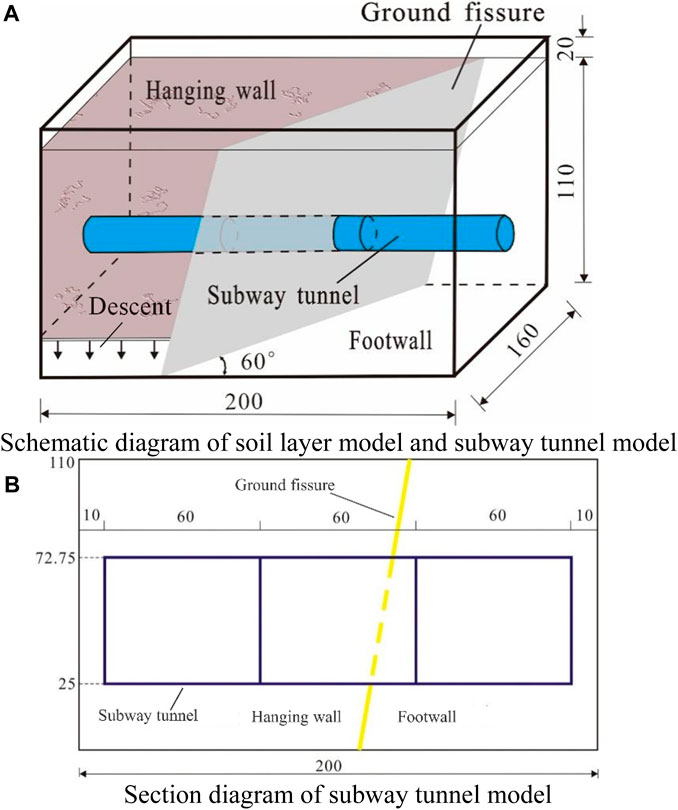
Figure 1. Schematic diagram of test model (unit: cm). (A) Schematic diagram of soil layer model and subway tunnel model. (B) Section diagram of subway tunnel model.
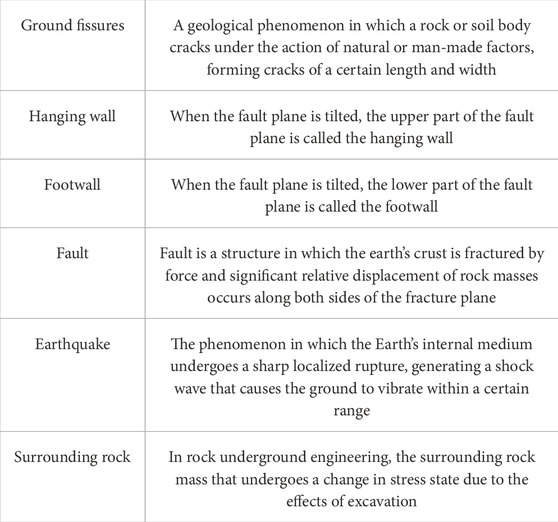
Table 1. Glossary of specialized terms.
The model test in this study was conducted within a model box, as illustrated in Figures 2A, B, while Figure 2C depicts the settlement control system employed. The model box’s specific dimensions measure 2.0 m (length) × 1.6 m (width) × 1.2 m (height). The model box is constructed with a structural skeleton made of steel angles, which are reliably connected by bolts. After the structural skeleton is securely fixed, wooden plywood and tempered glass are fixed as the inner wall of the model box. During the test, the bottom plate of the model box is divided into two segments representing the hanging wall and the footwall, simulating the scenario where the subway tunnel intersects diagonally with the ground fissure at a 60° angle. It's crucial to control the descent of the hanging wall while keeping the footwall stationary. The settlement control system accomplishes this task using five jacks mounted beneath the bottom plate supports of the hanging wall. In particular, in order to control the boundary effects of the model box: to attenuate the reflection of vibration waves at the box boundaries and the friction of the box walls on the surrounding rock and soil. The inner wall of the model box was lined with two layers of polystyrene plastic film and sprinkled with talcum powder between its double layers.
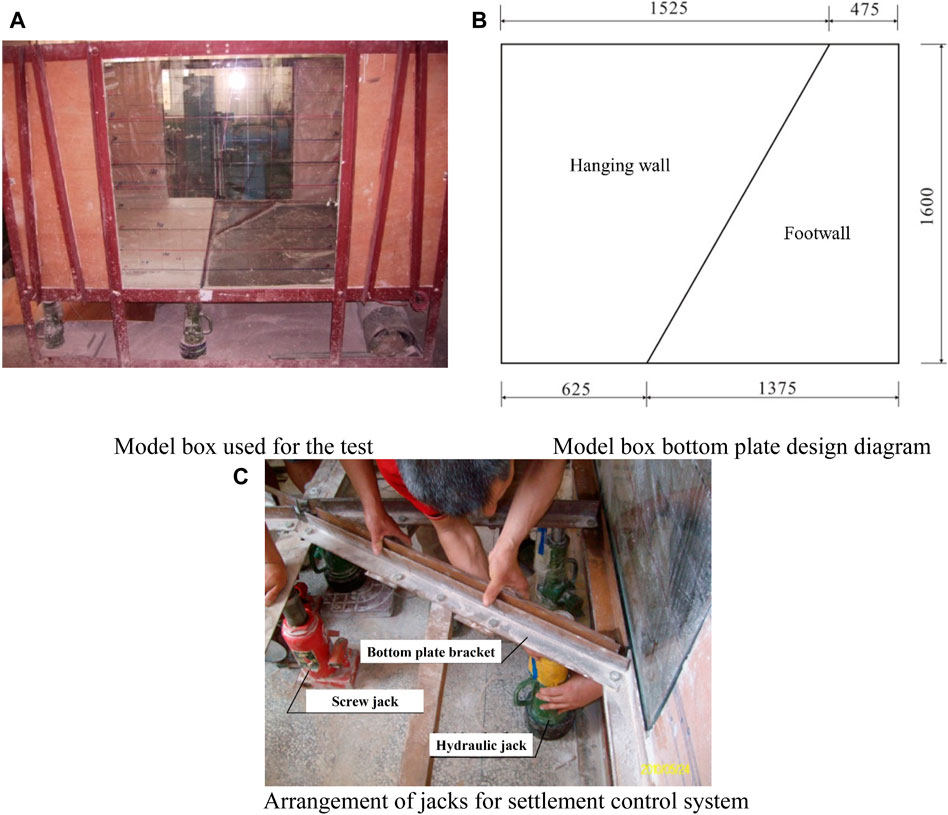
Figure 2. Model box and settlement control system (unit: mm). (A) Model box used for the test. (B) Model box bottom plate design diagram. (C) Arrangement of jacks for settlement control system.
2.2 Design of similarity ratio
In this study, the similarity ratio for the model test is determined based on similarity theory, considering the actual engineering dimensions of the Xi’an subway and the size of the model box, among other test conditions. The chosen subway prototype is the horseshoe-shaped tunnel structure used in Xi’an Metro Line 2 when crossing the ground fissure, featuring a tunnel height of 9.55 m and a burial depth of 20 m. The influence zone of the ground fissure’s hanging wall extends from 0 to 20 m, while that of the footwall spans from 0 to 15 m. The physico-mechanical parameters of the subway lining structure and the soil near the ground fissure are shown in Table 2.
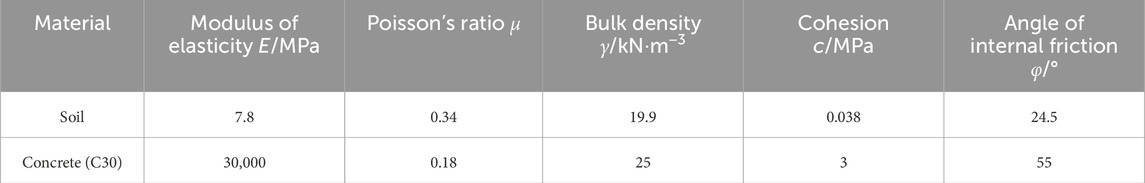
Table 2. Physical and mechanical parameters of prototype materials.
According to the characteristics of the model test in this study, 18 main physical quantities related to the test were determined. Among them, the physical quantities that characterize the geometrical features are: length l, displacement u, area A. The physical quantities that characterize the material features are: stress σ, strain ε, modulus of elasticity E, Poisson’s ratio μ, density ρ, cohesion c, deformation modulus. The physical quantities that characterize the dynamics are: mass m, time t, frequency ω, speed v, acceleration a, and gravitational acceleration g. The physical quantities that characterize the loading are: concentrated load F, surface load q. Three basic physical quantities with independent scales are chosen: length l, density ρ, and elastic modulus E. According to the second theorem of similarity, the 18 main physical quantities in the model test can be combined into 15 dimensionless π numbers, and the 15 π-numbers in the model are equal to the corresponding π-numbers in the prototype, which can be obtained as the 15 relational equations that should be satisfied between the similarity ratios as shown in Table 3. In this study, the geometric similarity ratio is 20, the density similarity ratio is 1, and the modulus of elasticity similarity ratio is 1.5. According to the relationships between the similarity ratios in the table, the similarity ratios of each physical quantity are obtained as shown in Table 3.
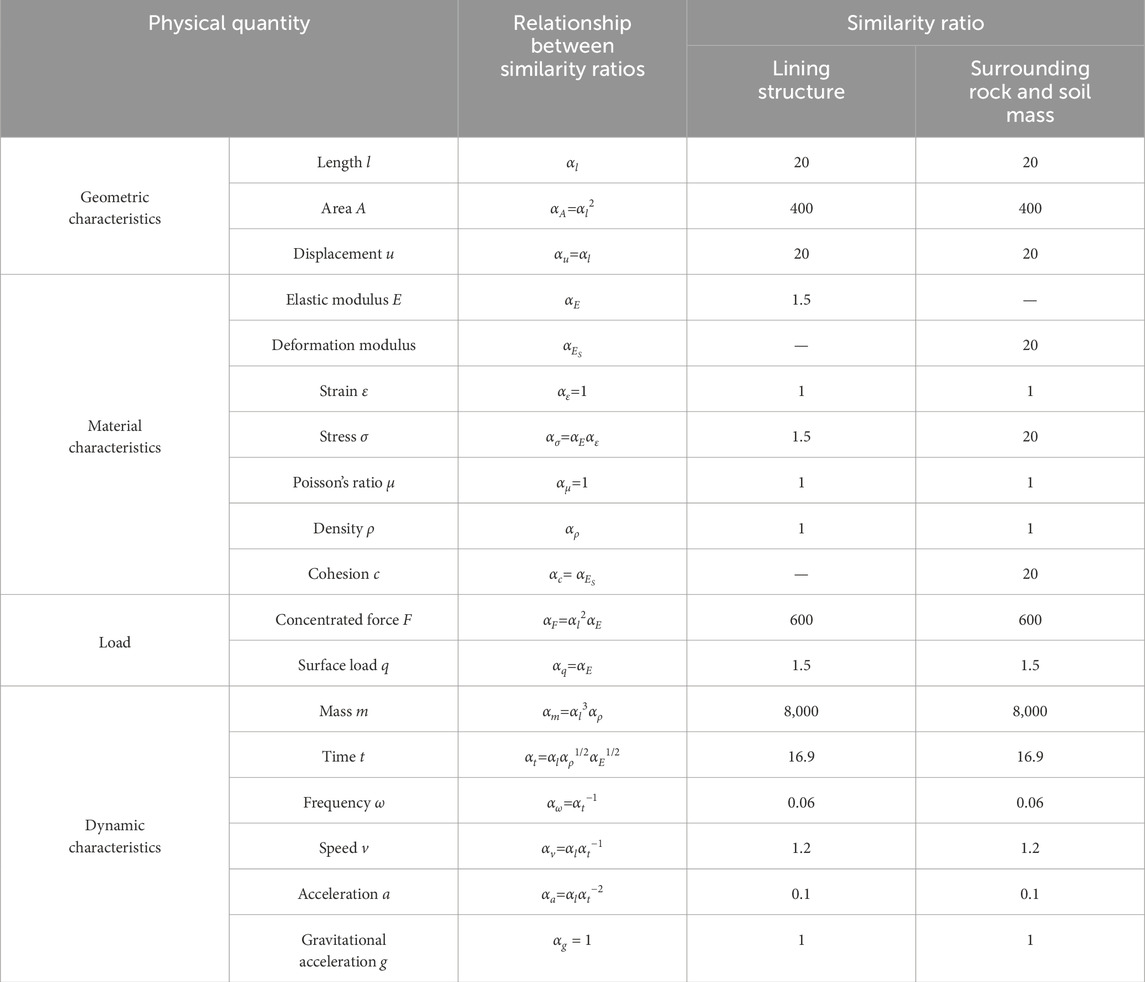
Table 3. Similarity ratio of various physical quantities in model experiments.
2.3 Model materials
2.3.1 Stratum
To simulate the main soil layers in the buried depth range of the Xi’an subway, including loess and paleo-soil, a mixture of barite powder, clayey soil, and river sand is used as the stratum soil materials in this study (Bian et al., 2022a; Bian et al., 2022b). The parameters of the materials used are as follows: the bulk density of barite powder is 45 kN/m3, with a particle size of 500 mesh; the bulk density of clay soil is 18 kN/m3; and the bulk density of river sand is 25.6 kN/m3. Based on several proportioning tests (Liu et al., 2017a; Liu et al., 2017b; Liu et al., 2022), the ratios of barite powder, clay soil, sand, and water used are as follows: 55:30:10:5. Experiments were conducted on the prototype soil within the burial depth of Xi’an subway and the model soil used in the modeling experiments, and each physico-mechanical parameter is shown in Table 4.
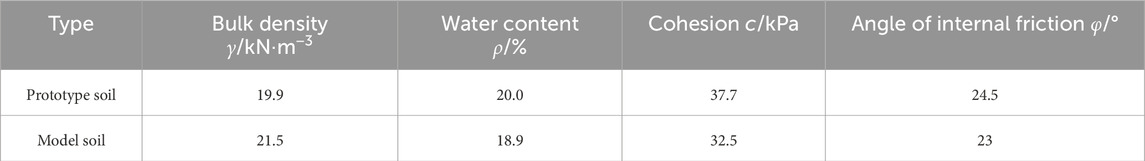
Table 4. Physical and mechanical parameters of prototype and modeled soils.
2.3.2 Ground fissure
In this study, the Xi’an ground fissure is simulated by pre-setting ground fissure in the soil model. Most of the Xi’an ground fissures have an inclination angle ranging from 70° to 80°, and they are mostly filled with chalk or powdered sand. To ensure that the ground fissures in the model were as close as possible to the prototype ground fissures, fine sand was used as the filler at the ground fissures in the test. The width of the ground fissure preset in the test is 10 mm, with an inclination angle of 80°, and an angle of 60° with the tunnel. The specific production method is to first set a 10 mm thick partition board to fix the position of the ground fissure. Then the layered filling of the soil on both sides of the ground fissure is carried out. When the soil body is filled to a predetermined height take out the plank. Fill fine sand at its position to finally form the predetermined ground fissure.
2.3.3 Tunnel structure
In this study, the test subway tunnel model measures 180 cm in length, 47.75 cm in height, 47 cm in width, and 2.75 cm in thickness. It is constructed using C15 concrete. Inside the model, 38 Φ2 reinforcing bars are arranged longitudinally with a spacing of 40 mm, and 86 Φ2 reinforcing bars are arranged transversely with a spacing of 20 mm. Importantly, the test tunnel in this study is a three-section structure, with each section measuring 0.6 m in length. The burial location and segmentation of the tunnel are illustrated in Figure 1.
2.4 Vibration load of subway trains
The train of Xi’an subway line 2 consists of 6 trains, and the load of the train wheelset is 160 kN.The dynamic response of the subway tunnel and its surrounding rock is caused by the dynamic load on the track when the train is running. This dynamic load can be regarded as a concentrated force moving periodically at a certain speed. It is shown that the subway traveling dynamic load can be regarded as a half-sinusoidal load with a single frequency in the course of the study (Liu et al., 2022), as shown in Equation 1:
where P0 is the train load, t is the loading time, and f is the loading frequency.
In order to simulate the vibration load of the subway train, the test was conducted with a TST-10 type 10 kg shaker (P0=100 N). The specific setup is as follows: two parallel tracks are installed at the bottom of the arch inside the tunnel model, and a steel plate crossbeam connects these two tracks. The vibrator is firmly fixed on the crossbeam to distribute the vibration load evenly to the two tracks. As the vibration caused by subway train decays faster in high frequency, most of the vibration caused by the surrounding rock and soil is low frequency vibration. According to the geotechnical investigation report of Xi’an Subway Line 2, the vibration frequency of the bed caused by the train load is mostly concentrated below 20 Hz, and the frequency used in this study is set to 10 Hz. The typical load spectrum generated by the shaker is shown in Figure 3A.
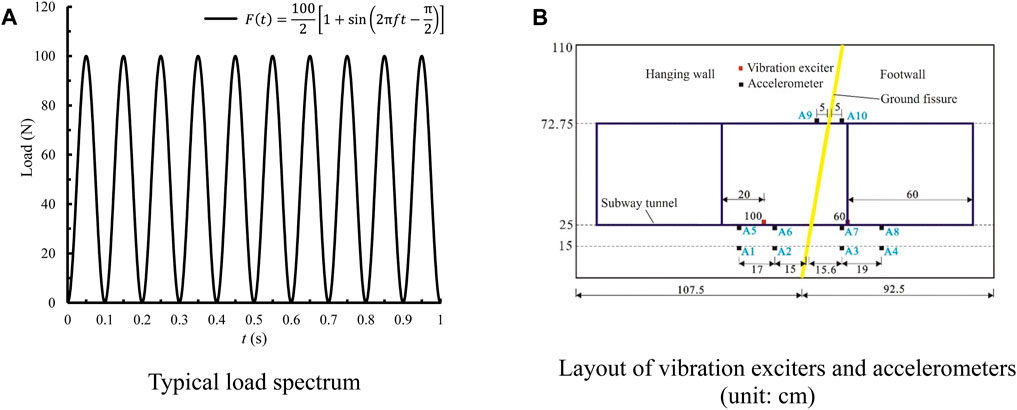
Figure 3. Typical load spectrum and layout of vibration exciters and accelerometers. (A) Typical load spectrum. (B) Layout of vibration exciters and accelerometers (unit: cm).
In this study, two different excitation points are established to simulate the variations in the relative positions of the train and the ground fissure as the subway train travels. These points are positioned inside the tunnel, 60 cm and 100 cm away from the boundary of the subway tunnel in the footwall, as illustrated in Figure 3B.
2.5 Measuring equipment
2.5.1 Acceleration
In this study, soil acceleration was measured using LC0801 strain accelerometers. Ten accelerometers were buried, all positioned along the center axis of the tunnel section, at heights of 15 cm, 25 cm (at the bottom of the tunnel), and 72.75 cm (at the top of the tunnel), respectively. The accelerometers were arranged and numbered according to Figure 3B.
2.5.2 Earth pressure
In this study, earth pressure was measured using ZFCY180 miniature pressure cells (measurement accuracy of 1%). Three layers of pressure cells were installed at soil filling heights of 15 cm, 50 cm, and 85 cm, respectively. The layout of the pressure cells is detailed in Figure 4. During the burial of the pressure cell, the measured earth pressure was matched to the actual results during the model test to ensure that the pressure cell was in close contact with the soil. When the soil was filled to the preset depth, the soil surface was leveled. Excavate the pressure cell burial trench at the preset location for burying the pressure cell. A small amount of fine sand is spread to ensure that the surface of the pressure cell is uniformly stressed. Then place the pressure cell and spread fine sand on the upper part of the placed pressure cell and compact it to ensure that the pressure cell is in close contact with the soil. In particular, in order to prevent damage to the pressure cell, the upper part of the pressure cell is buried using the hydrostatic method, avoiding vibration tamping which may cause damage to the pressure cell.
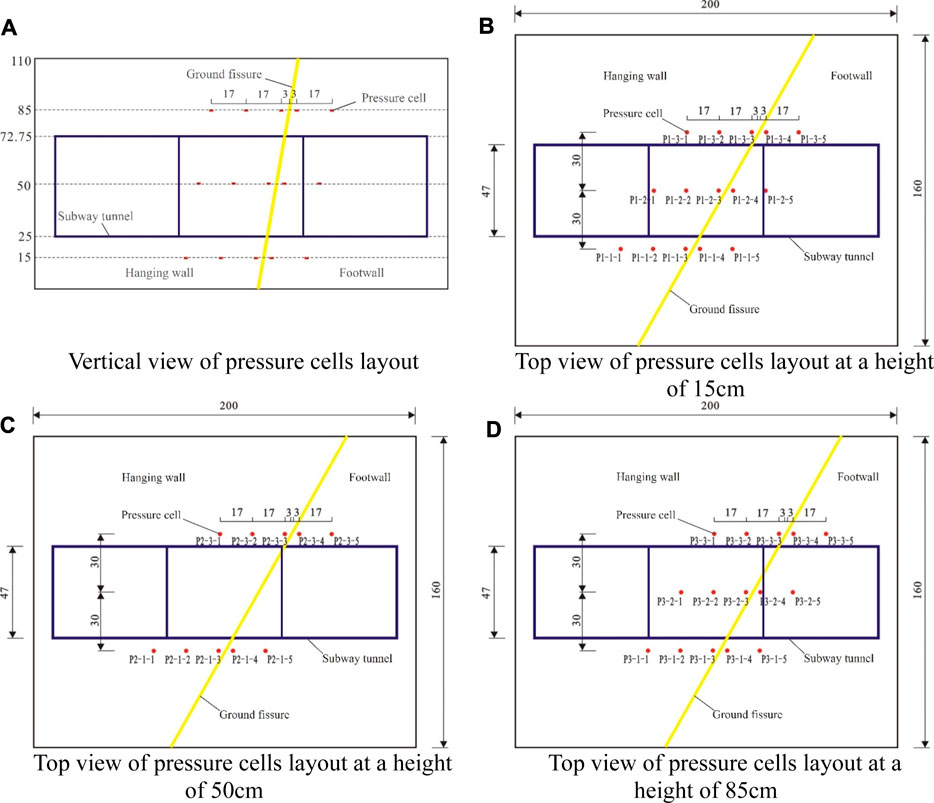
Figure 4. Layout of pressure cells in the soil (unit: cm). (A) Vertical view of pressure cells layout. (B) Top view of pressure cells layout at a height of 15 cm. (C) Top view of pressure cells layout at a height of 50 cm. (D) Top view of pressure cells layout at a height of 85 cm.
2.5.3 Contact pressure between the tunnel and soil mass
In this study, the contact pressure between the tunnel and the soil was measured using ZFCY180 miniature pressure cells. Two circles of earth pressure cells were placed on the tunnel on both sides of the ground fissure, with 8 pressure cells in each circle. The detailed arrangement of the pressure cells is depicted in Figure 5.
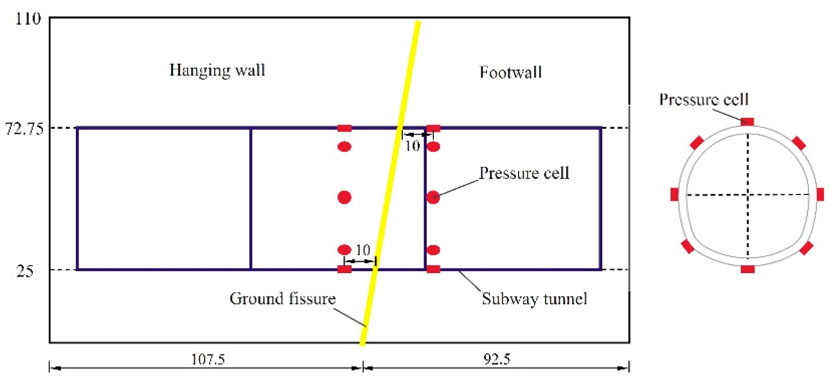
Figure 5. Layout of contact pressure cells on the subway tunnel (unit: cm).
3 Results
For clarity in this research test, the three tunnel sections are denoted as the hanging wall section, middle section, and footwall section, in that sequence, from the hanging wall to the footwall.
3.1 Acceleration response of soil
3.1.1 Dynamic response at different depth
In analyzing the acceleration response of test points with varying burial depths, this study focuses on the measurements from test points A3, A7, and A10 situated in the footwall, as well as test points A2, A6, and A9 positioned in the hanging wall.
Figures 6, 7 depict the acceleration time course curves and peak acceleration curves for test points A3, A7, and A10, as well as A2, A6, and A9, under 10 Hz excitation loads at 60 cm and 100 cm excitation points from the end of the footwall, respectively, under the inactive condition of the ground fissure. Observing the figures, when the excitation point is positioned 60 cm from the end of the footwall, test points A6 and A7, located at the bottom of the tunnel, exhibit relatively high peak accelerations (0.12 m/s2 and 0.15 m/s2, respectively). Conversely, test points A2 and A3, situated at the bottom of the tunnel arch at 10 cm, experience reduced peak accelerations (0.1 m/s2 and 0.132 m/s2, respectively), indicating the attenuation effect of the soil layer on train vibration. Test points A9 and A10, located at the top of the track and farther from the excitation point, display further reduced peak acceleration values (0.06 m/s2 and 0.1 m/s2, respectively). When the excitation point is situated 100 cm from the end of the footwall, the test results are similar to those at the 60 cm excitation point, with the largest peak acceleration observed at the test point at the bottom of the tunnel. The peak acceleration decreases at the test point 10 cm below the bottom of the tunnel and at the top of the tunnel, indicating an overall distribution of acceleration along the vertical axis with the maximum at the bottom of the tunnel and decreasing in the upward and downward directions.
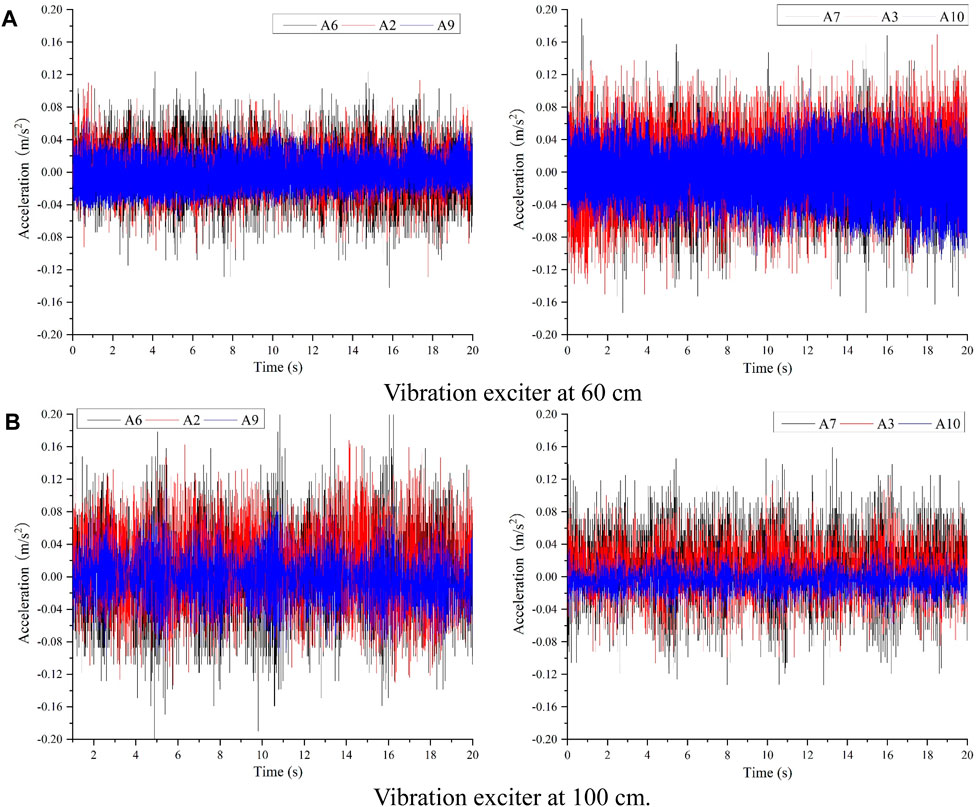
Figure 6. Acceleration time series for inactive ground fissure scenario (A) Vibration exciter at 60 cm. (B) Vibration exciter at 100 cm.
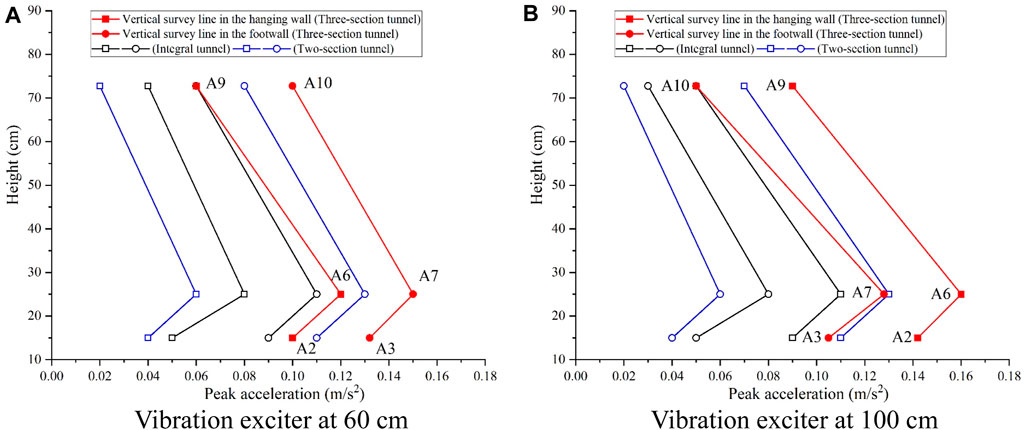
Figure 7. Peak acceleration curves for inactive ground fissure scenario. (A) Vibration exciter at 60 cm. (B) Vibration exciter at 100 cm.
Figures 8, 9 display the acceleration time course curves and peak acceleration curves for test points A3, A7, and A10, as well as A2, A6, and A9, under 10 Hz excitation loads at 60 cm and 100 cm excitation points from the end of the footwall, under the condition of a 1 cm descent of the ground fissure’s hanging wall, respectively. Analyzing the curves, when the excitation point is positioned 60 cm from the end of the footwall tunnel, the peak acceleration at test point A6, located at the bottom of the hanging wall tunnel, decreases compared to the non-descending scenario (0.05 m/s2). Simultaneously, the peak acceleration at test point A2, located below test point A6, also decreases accordingly (0.03 m/s2), while the peak acceleration at test point A9, located at the top of the tunnel, increases compared to the non-descending scenario (0.08 m/s2). Conversely, the peak acceleration at test points A7 and A3, situated at the bottom of the footwall tunnel, increases compared to the non-descending scenario (0.16 m/s2 and 0.14 m/s2, respectively), while the peak acceleration at test point A10, located at the top of the footwall tunnel, decreases compared to the non-descending scenario (0.09 m/s2).
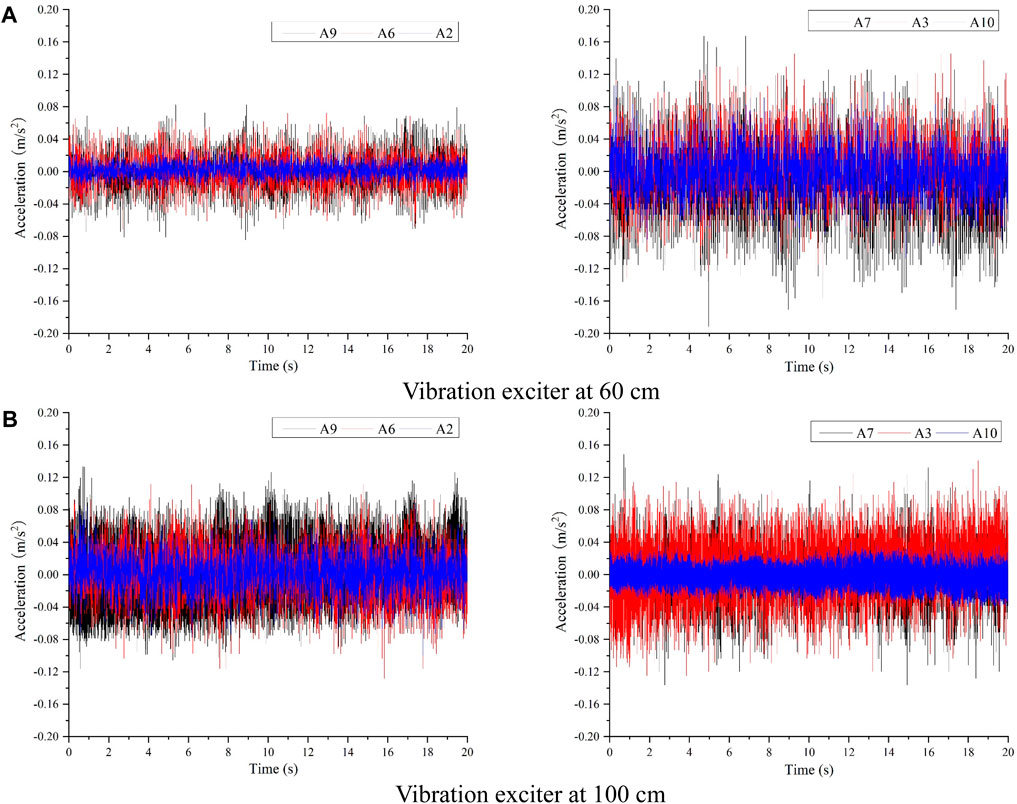
Figure 8. Acceleration time series with hanging wall descending 1 cm. (A) Vibration exciter at 60 cm. (B) Vibration exciter at 100 cm.
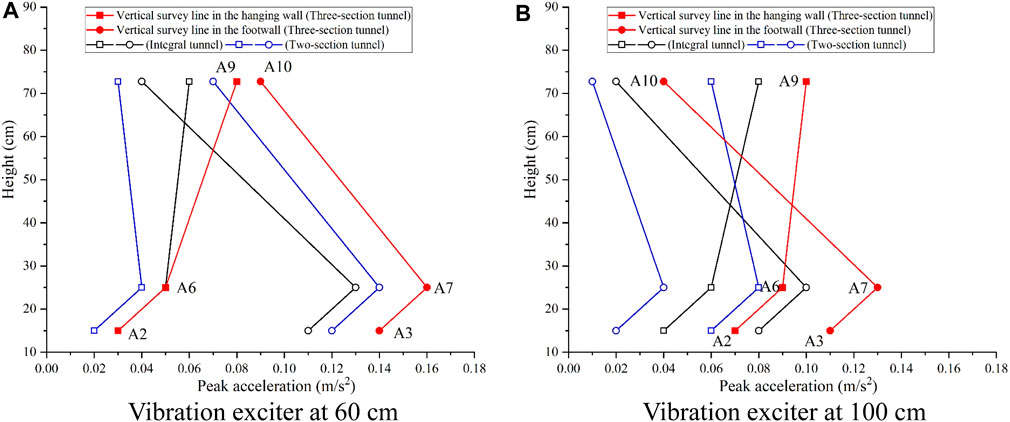
Figure 9. Peak acceleration curves with hanging wall descending 1 cm. (A) Vibration exciter at 60 cm. (B) Vibration exciter at 100 cm.
When the excitation point is situated 100 cm from the end of the footwall, the test outcomes align closely with those observed when the excitation point is positioned at 60 cm. The peak acceleration at test points A3, A7, and A9 increases, while the peak acceleration at test points A2, A6, and A10 decreases relative to the scenario when the footwall is not descended.
3.1.2 Dynamic response longitudinal along the tunnel
To investigate the longitudinal acceleration response along the tunnel, analysis was conducted on measurement lines positioned at the bottom of the tunnel (test points A5, A6, and A7) and 10 cm below the tunnel bottom (test points A1, A2, and A3). Figures 10, 11 illustrate the acceleration time course curves and peak acceleration curves of these two horizontally oriented measurement lines under 10 Hz excitation loads at 60 cm and 100 cm excitation points from the end of the footwall under the inactive condition of the ground fissure, respectively.
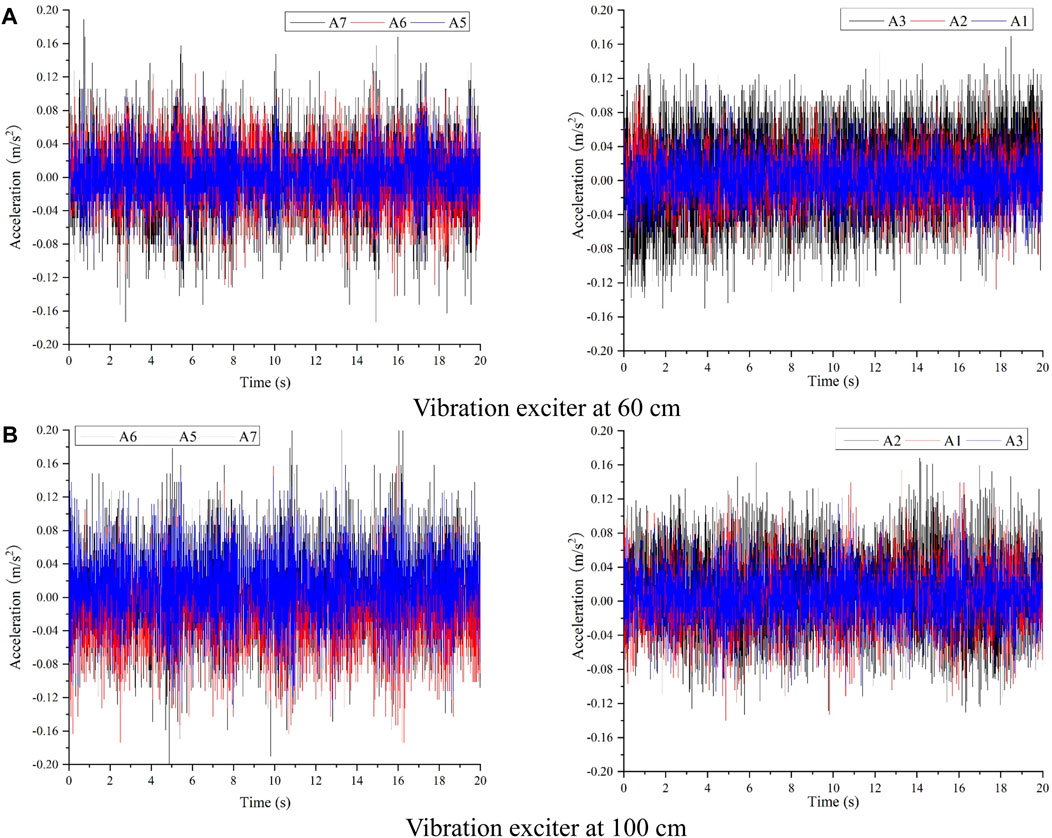
Figure 10. Acceleration time series for inactive ground fissure scenario (A) Vibration exciter at 60 cm. (B) Vibration exciter at 100 cm.
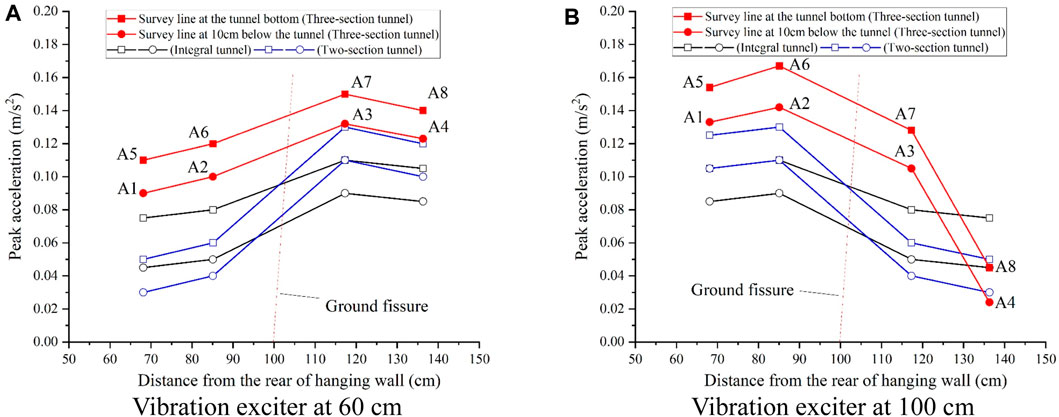
Figure 11. Peak acceleration curves for inactive ground fissure scenario (A) Vibration exciter at 60 cm. (B) Vibration exciter at 100 cm.
Observing the figures, when the excitation point is situated 60 cm (hanging wall) away, the peak acceleration value of the nearest measurement point A7 is the highest, followed by A8. The acceleration peak values of the A6 and A5 measurement points located in the hanging wall are lower, and a similar trend is observed for the measurement line located 10 cm below the tunnel.
When the excitation point is positioned 100 cm (hanging wall) away, the peak acceleration of the closest measurement point A6 is the highest, followed by A5. Conversely, the peak acceleration of the A7 and A8 measurement points located in the footwall is lower. This pattern is consistent even for the measurement line located 10 cm below the tunnel.
Additionally, it's notable that when the excitation point is located 100 cm, the peak acceleration of measurement point A8 exhibits a more significant reduction compared to measurement point A7.
Figures 12, 13 depict the acceleration time course curves and peak acceleration curves of the two horizontal measurement lines under the 10 Hz excitation loads at the 60 cm and 100 cm excitation points from the end of the footwall under the condition of the hanging wall of the ground fissure descending by 1 cm, respectively. Upon observation of the figures, when the excitation point is situated 60 cm (footwall) away, the distribution of peak acceleration in the horizontal direction remains largely unchanged compared to when it is not descending. The acceleration peaks of the measurement points located in the footwall nearer to the excitation point are larger than those located in the hanging wall farther away from the excitation point, and the acceleration peaks diminish the farther away from the excitation point. Furthermore, the difference between the peak acceleration values of the measurement points on both sides of the ground fissure is further accentuated compared to when the ground fissure is not descending.
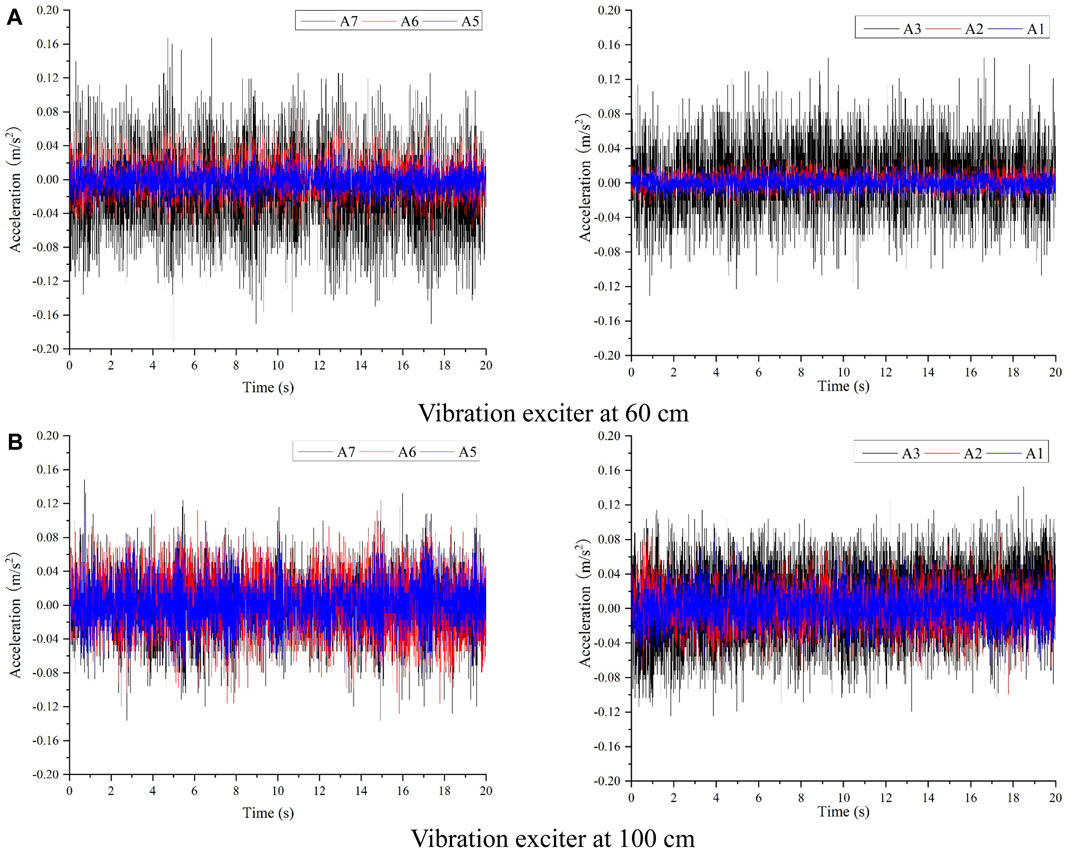
Figure 12. Acceleration time series with hanging wall descending 1 cm. (A) Vibration exciter at 60 cm. (B) Vibration exciter at 100 cm.
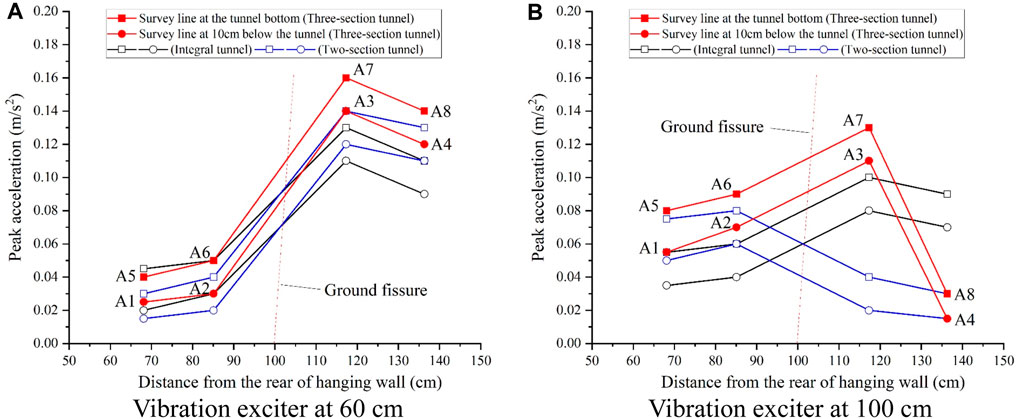
Figure 13. Peak acceleration curves with hanging wall descending 1 cm. (A) Vibration exciter at 60 cm. (B) Vibration exciter at 100 cm.
When the excitation point is situated at 100 cm (hanging wall), the distribution pattern of the peak acceleration in the horizontal direction differs significantly from that observed when it is not descending. Specifically, the six measurement points located in the middle section of the tunnel exhibit an increase in peak acceleration from the hanging wall to the footwall direction.
3.2 Dynamic response of earth pressure
Figures 14–16 depict the additional earth pressure curves for different soil heights under the 10 Hz excitation load in the inactive condition of the ground fissure. Observing the figures, when the ground fissure hanging wall is inactive, the additional earth pressure of each measurement line is positive. Upon comparison in the vertical direction, it is evident that the additional earth pressure at the height of 15 cm is generally the largest, followed by the height of 50 cm, with the value of additional earth pressure at the height of 85 cm being the smallest. This indicates a gradual decrease in the value of additional earth pressure with the increase in the height of the soil body.
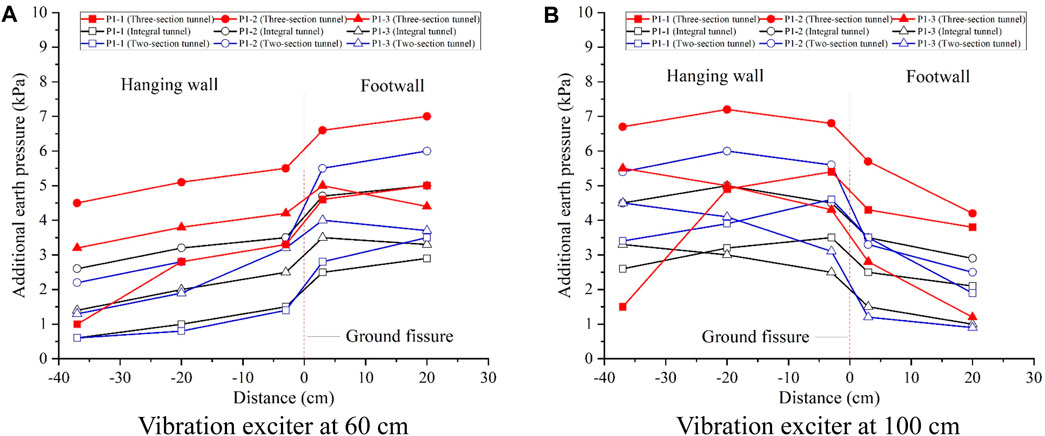
Figure 14. Additional earth pressure at 15 cm height for inactive ground fissure scenario. (A) Vibration exciter at 60 cm. (B) Vibration exciter at 100 cm.
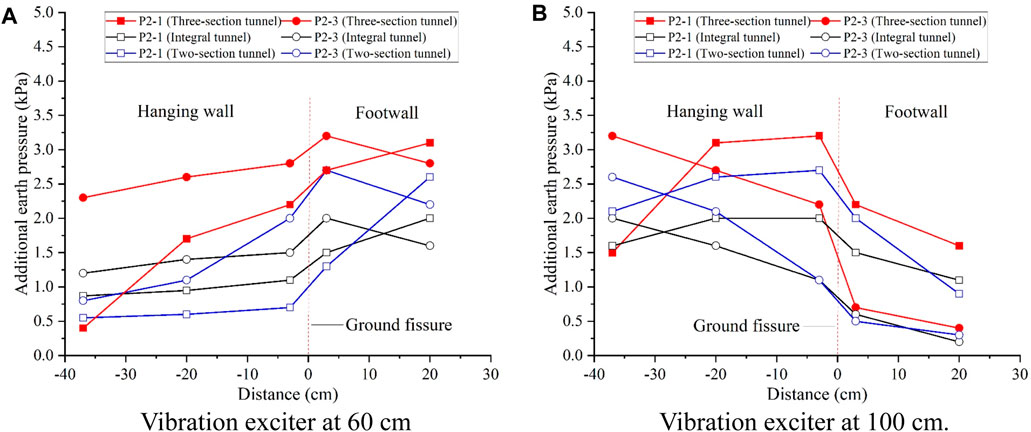
Figure 15. Additional earth pressure at 50 cm height for inactive ground fissure scenario. (A) Vibration exciter at 60 cm. (B) Vibration exciter at 100 cm.
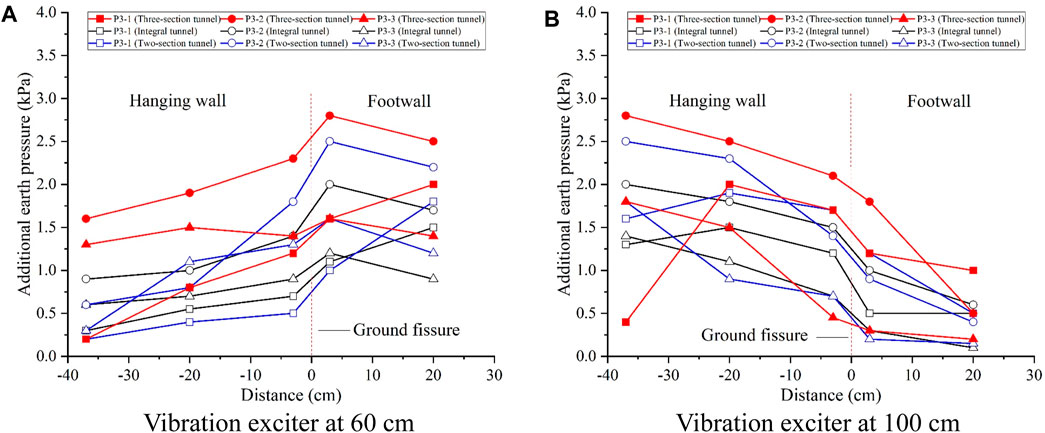
Figure 16. Additional earth pressure at 85 cm height for inactive ground fissure scenario. (A) Vibration exciter at 60 cm. (B) Vibration exciter at 100 cm.
When considering the longitudinal direction of the tunnel, with the excitation point situated at 60 cm from the end of the footwall tunnel (at the joint of the middle section and the footwall section), the additional earth pressure in the footwall generally surpasses that in the hanging wall, as shown in Figures 14A, 15A, 16A. Furthermore, as one moves further away from the excitation point, the additional earth pressure diminishes, and there is a noticeable reduction in additional earth pressure when crossing the ground fissure. With the excitation point placed 100 cm from the end of the footwall tunnel (in the middle section of the hanging wall), the measurement points within the middle section and the footwall section exhibit greater additional earth pressure in the hanging wall compared to the footwall. As the distance from the excitation point increases, the induced additional earth pressure diminishes, with a more pronounced reduction observed when traversing ground fissures and segmental joints. The additional earth pressure at the measurement points situated in the hanging wall section of the tunnel tends to be lower. When examining from the vertical direction of the tunnel, the additional earth pressure at the tunnel axis (depicted by the P1-2 and P3-2 curve in the figure) is higher than that of the soil on both sides of the tunnel at the same height. Interestingly, the excitation point is located 100 cm from the end of the footwall tunnel, and the soils on both sides of the tunnel at the same height and the same distance from the crack exhibit a large difference in earth pressure. This situation, regardless of the effect of soil height, shows a uniform pattern of numerical differences in Figures 14B, 15B, 16B. Taking the height of 15 cm as an example,at the position of −37 cm from the ground fissure in Figure 14B, the value of earth pressure (1.5 kPa) of the P1-1 measuring line is lower than that of the P1-3 measuring line (5.5 kPa). As shown in Figure 4, there is a difference in the distance from the excitation point between the soil bodies at the same height and the same distance from the ground fissure on both sides of the underpass (P1-1-1 and P1-3-1) under the influence of the diagonal intersection of the ground fissure and the subway. When the excitation point is located at 100 cm from the end of the footwall tunnel, P1-1-1 is farther away from the excitation point compared to P1-3-1. As the distance from the excitation point increases, the induced additional earth pressure is smaller.
Figures 17–19 illustrate the additional earth pressure curves at different heights under the 10 Hz excitation load with the ground fissure hanging wall descending by 1 cm. Following the descent of the ground fissure hanging wall, the distribution pattern of additional earth pressure in each measurement line undergoes significant alteration compared to the condition without descent. Generally, in the upper part of the tunnel (P3-2 line), the additional earth pressure exhibits a pattern of larger values in the hanging wall and smaller values in the footwall. Conversely, for the remaining lines, the additional earth pressure of the soil body in the footwall is larger, while that of the soil body in the hanging wall is smaller. Additionally, the additional pressure of the soil body on both sides of the tunnel in the footwall gradually decreases with the increase in the height of the soil body.
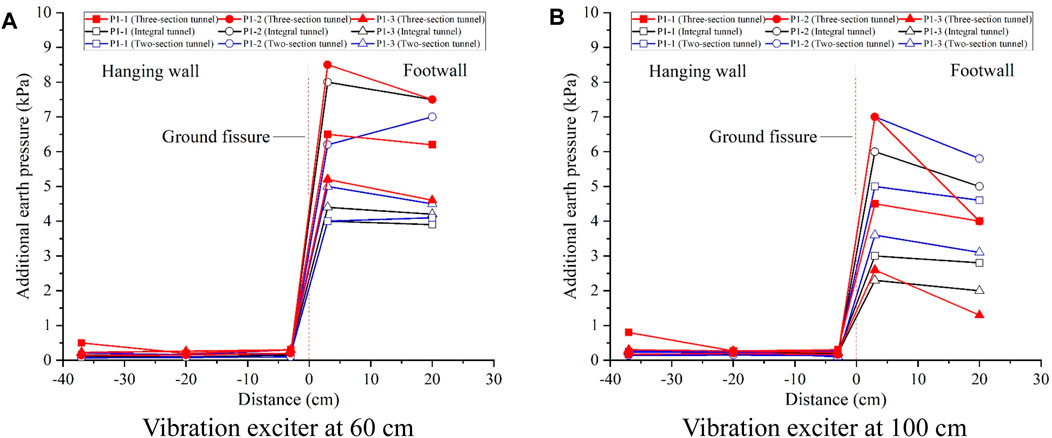
Figure 17. Additional earth pressure at 15 cm height with hanging wall descending 1 cm. (A) Vibration exciter at 60 cm. (B) Vibration exciter at 100 cm.
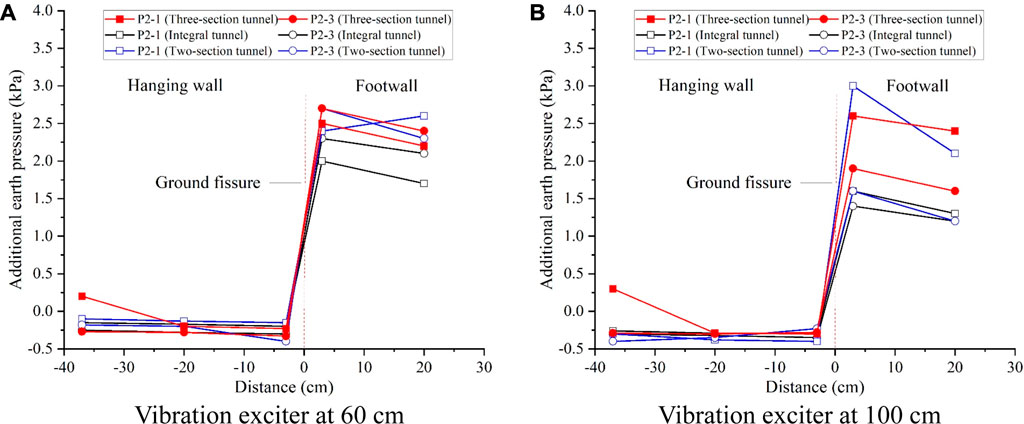
Figure 18. Additional earth pressure at 50 cm height with hanging wall descending 1 cm. (A) Vibration exciter at 60 cm. (B) Vibration exciter at 100 cm.
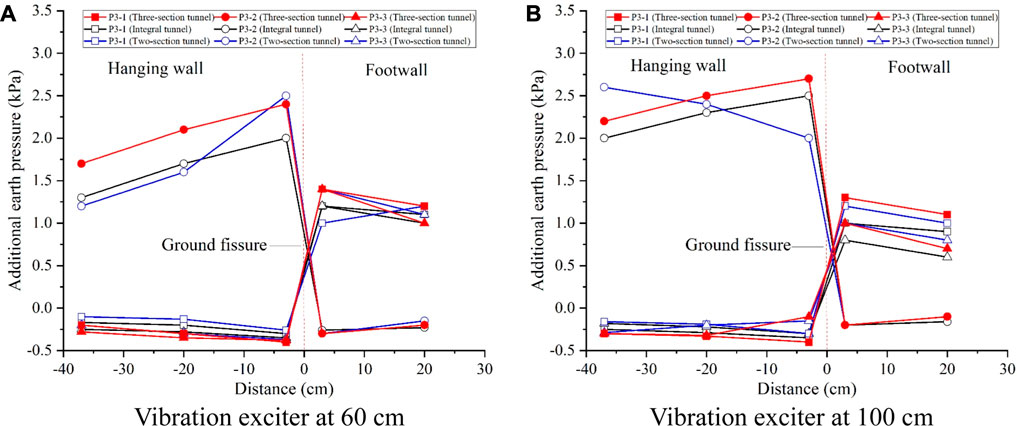
Figure 19. Additional earth pressure at 85 cm height with hanging wall descending 1 cm. (A) Vibration exciter at 60 cm. (B) Vibration exciter at 100 cm.
3.3 Dynamic response of tunnel contact pressure
Figure 20 illustrates the distribution of the contact additional pressure in the tunnel ring direction, with both ring measurement lines situated in the middle section of the tunnel. From the figure, it is evident that when the stratum has not descended, the contact additional pressure at the bottom of the tunnel is greater, while the contact additional pressure at the top of the tunnel is comparatively smaller. Additionally, the additional pressure at the left and right sides of the tunnel is the smallest. Notably, the contact additional pressure is relatively larger on the side where the excitation point is located, while it is relatively smaller on the other side.
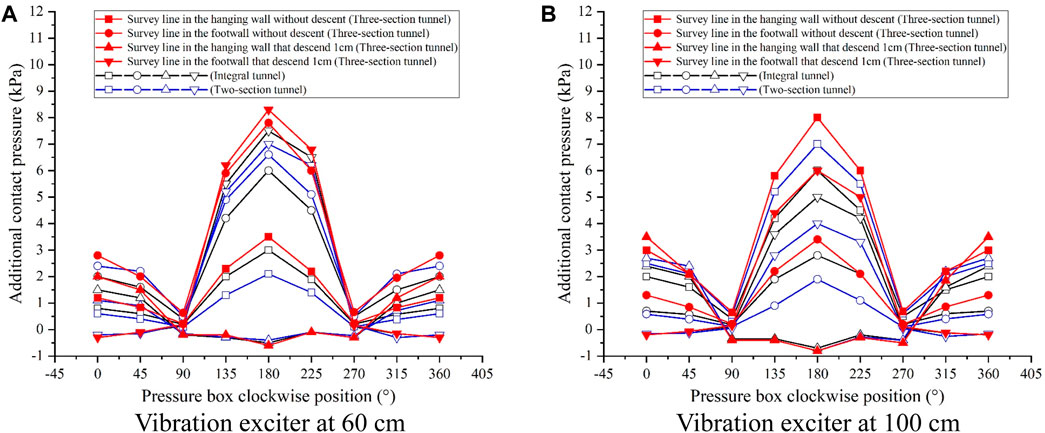
Figure 20. Distribution of the circumferential additional contact pressure. (A) Vibration exciter at 60 cm. (B) Vibration exciter at 100 cm.
After the descent of the hanging wall of the ground fissure, notable changes occur in the contact additional pressure. Specifically, at the top of the tunnel situated in the hanging wall, the contact additional pressure slightly increases. Conversely, at the bottom of the tunnel, the contact additional pressure experiences a substantial decrease, reaching negative values. This decrease in the contact additional pressure at the tunnel’s bottom is more pronounced when the excitation point is positioned at 100 cm. Meanwhile, in the footwall, the contact additional pressure at the bottom of the tunnel increases, with a larger magnitude of increase observed when the excitation point is located at 100 cm. Conversely, the contact additional stress at the top of the tunnel in the footwall decreases, with a larger magnitude of decrease seen when the excitation point is situated at 60 cm. Moreover, the descent of the hanging wall of the ground fissure has minimal impact on the contact additional pressure on both sides of the tunnel.
4 Discussion
4.1 Analysis of the impact of ground fissure on three-section tunnels
Combining the results of the dynamic interaction between the ground fissure and the three-section tunnel, this study comprehensively analyzes the impact of ground fissures on the three-section tunnel in terms of acceleration and earth pressure dynamics.
Inactive ground fissures exhibit a similar attenuation effect on train vibration as the surrounding soil layers. For instance, in Figures 6, 7, test points A6 and A7, positioned at the bottom surface of the tunnel, register relatively large peak accelerations, whereas test points A2 and A3, located 10 cm below the bottom of the tunnel arch, experience reduced peak accelerations. When the excitation point is 60 cm from the footwall, the peak acceleration decreases from 0.12 m/s2 to 0.1 m/s2 for A2 and from 0.15 m/s2 to 0.132 m/s2 for A3 compared to A6 and A7, respectively. In Figure 11, the substantial difference in peak acceleration between measurement points on both sides of the ground fissure suggests significant attenuation of vibration propagation horizontally. Regardless of the excitation point’s location in the hanging wall or footwall, the magnitude of peak acceleration decrease is consistent, indicating equal attenuation of vibration propagation across the ground fissure in both directions when the fissure is inactive.
Similarly, the attenuation of vibration in the presence of inactive ground fissures is also evident in the additional earth pressure, as depicted in Figures 14–16. The reduction in additional earth pressure is more pronounced when crossing the ground fissure, irrespective of whether the excitation point is situated 60 cm from the footwall tunnel end (footwall) or 100 cm from the footwall tunnel end (hanging wall).
When the hanging wall of the ground fissure descends, the contact dynamics between the three-section tunnel and the nearby soil undergo changes due to the soil body’s deformation and the tunnel structure, thereby influencing vibration propagation. The segmented nature of the tunnel exacerbates these effects: the hanging wall section descends with the soil body, the footwall section remains largely unchanged, and the middle section’s contact state with the soil body across the ground fissure varies significantly, leading to localized voiding and compacting phenomena. Specifically, the tunnel’s bottom in the hanging wall of the ground fissure and the top in the footwall of the ground fissure exhibit voiding with the soil, while the tunnel’s top in the hanging wall of the ground fissure and the bottom in the footwall of the ground fissure are compacted with the soil. As depicted in Figures 7, 9, when the excitation point is situated at 60 cm and 100 cm from the end of the footwall, the pattern remains consistent: the peak acceleration at the compacted test points increases, while it decreases at the voided test points compared to when there is no descent. For instance, when the excitation point is located 60 cm from the footwall end, test point A9 at the tunnel’s top and test points A7 and A3 at the footwall tunnel’s bottom are influenced by compaction, resulting in increased peak acceleration compared to the non-descended time (0.08 m/s2, 0.16 m/s2, and 0.14 m/s2, respectively). Conversely, test point A10 at the footwall tunnel’s top and tests A6 and A2 at the hanging wall tunnel’s bottom are affected by voiding, leading to decreased peak acceleration compared to the non-descended time (0.09 m/s2, 0.05 m/s2, and 0.03 m/s2, respectively).
In the presence of an active ground fissure, both attenuation and enhancement effects on vibration are observed, influenced by the tunnel-soil contact state. As depicted in Figures 11, 13, when the excitation point is positioned at 60 cm (footwall), the horizontal peak acceleration distribution pattern closely resembles that of non-descending conditions. The acceleration peaks in the footwall, closer to the excitation point, exceed those in the farther hanging wall, with diminishing peaks further from the excitation point. The disparity between the peak acceleration values on either side of the ground fissure increases notably compared to non-descending hanging wall conditions, signifying greater vibration attenuation when crossing the active ground fissure. However, when the excitation point shifts to 100 cm (hanging wall), influenced by altered tunnel-soil contact due to hanging wall descent, the horizontal peak acceleration distribution pattern differs from non-descending conditions. Notably, peak acceleration at each footwall measurement point surpasses that at each hanging wall measurement point. In the direction of vibration propagation (from hanging wall to footwall), vibration across the ground fissure exhibits enhancement, albeit to a lesser degree than attenuation observed from footwall to hanging wall propagation.
The altered contact dynamics between the tunnel and the soil resulting from the hanging wall descent of the ground fissure manifests similarly in the distribution of additional earth pressure. Furthermore, vibration and the evolving compactness-voiding relationship between tunnel-soil contact induced by ground fissure activity reciprocally influence each other. As depicted in Figure 17, the additional earth pressure in the hanging wall soil at a height of 15 cm (10 cm below the tunnel) approaches zero, attributable to voiding between the tunnel in the hanging wall and the soil beneath it. Conversely, the additional earth pressure in the footwall increases compared to non-descending conditions, particularly along the tunnel axis. This increase arises from compacting between the footwall tunnel and the soil beneath it, with further soil compaction under vibration leading to elevated additional earth pressure. The pronounced disparity in additional earth pressure distribution at a height of 85 cm (approximately 12 cm above the tunnel) compared to the other two test surfaces likewise suggests interaction between vibration and the evolving compacting-voiding relationship between tunnel and soil contact. As illustrated in Figure 19, the additional pressure of soil in the hanging wall of measurement line P3-2, positioned in the tunnel’s central axis part, is positive, while in the footwall, it is negative. This discrepancy arises from the hanging wall’s descent, compacting the tunnel with the soil above it, while the footwall tunnel voids with the soil above it, further exacerbated by vibration.
4.2 Comparative analysis between three-section tunnel and integral tunnel
To ascertain the impact of tunnel segmentation, the test outcomes from the three-section tunnel model under excitation in this study are juxtaposed and scrutinized alongside the responses of integral and two-section tunnels in instances of diagonal ground fissure (Liu et al., 2017a; Liu et al., 2017b; Liu et al., 2022).
As depicted in Figures 7, 9, the vertical distribution pattern of acceleration peaks when the hanging wall remains undescended mirrors that of integral and two-section tunnels in the three-section tunnel configuration. The soil nearest to the vibration source exhibits the highest peak acceleration, gradually diminishing as distance from the source increases—a consistent pattern observed in both integral and two-section tunnel setups. However, following the descent of the ground fissure’s hanging wall, there’s a shift in the vibration propagation law along the vertical axis. While the footwall’s soil maintains a pattern of higher acceleration in the middle and lower at the ends, the hanging wall’s soil displays a sequential decrease in peak acceleration from top to bottom—a behavior akin to that of integral tunnels. Given the shorter single-section length of the three-section tunnel compared to both two-section variants, the restraining influence diminishes further, accentuating the vibration effect and leading to increased peak accelerations at equivalent locations compared to integral and two-section configurations.
In the horizontal plane, the three-section tunnel exhibits a more pronounced attenuation of acceleration across tunnel segments compared to integral tunnels. Illustrated in Figure 11, when the hanging wall remains undescended and the excitation point is situated at 100 cm, the reduction in peak acceleration at measurement point A8 surpasses that at A7. This discrepancy arises because in the three-section test, measurement points A5, A6, A7, and the 100-cm excitation point are all positioned within the middle tunnel section, whereas measurement point A8 resides in the footwall section. Consequently, acceleration across the spanning tunnel segments experiences a more substantial attenuation. Furthermore, post-hanging wall descent, this increased attenuation effect on acceleration within tunnel segments persists. As depicted in Figure 13, when the excitation point is positioned at 100 cm (hanging wall), the peak acceleration within the footwall section of the three-section tunnel registers the smallest values compared to integral tunnels. These findings indicate that the three-section tunnel exerts a greater attenuation effect on vibration propagation along the axial direction of the tunnel.
In the case where the ground remains undisturbed within the three-section tunnel, the earth pressure of the surrounding rock soil body shows little deviation from that of integral and two-section tunnels. As depicted in Figures 14–16, the additional earth pressure diminishes gradually with increasing soil height, mirroring the behavior observed in integral and two-section tunnels. However, within the tunnel area corresponding to the segment housing the excitation point, the additional earth pressure experiences an increment compared to integral tunnels, while within the tunnel area corresponding to the non-excited segment, it registers a decrease relative to integral tunnels. Illustrated in Figures 17–19, following the descent of the ground fissure’s hanging wall, the alteration in additional earth pressure due to ground fissure activity exhibits a smaller magnitude compared to integral tunnels.
Concerning the contact pressure between the surrounding rock and soil body and the tunnel, the distribution pattern of contact additional pressure in the three-section tunnel closely resembles that of integral and two-section tunnels. Illustrated in Figure 20, the distribution pattern of contact additional pressure between the three-section tunnel and the soil body mirrors that of integral and two-section tunnels. Both the top and bottom of the three-section tunnel exhibit a slight increase in contact additional pressure compared to both integral and two-section tunnels.
A comparison of soil acceleration, earth pressure on the surrounding rock and soil, and contact pressure between the rock and soil and the tunnel reveals that the vibration response of the three-section tunnel surpasses that of integral and two-section tunnels, attributed to the segmentation effect. This phenomenon becomes more pronounced with decreasing single-section length. Additionally, three-section tunnels exhibit a greater attenuation effect on vibration propagation along the longitudinal direction of the tunnel when compared with integral tunnels.
4.3 Tunnel design analysis and suggestions
The findings from the dynamic interactions between ground fissures and three-section tunnels underscore the importance of tailoring structural measures based on the level of ground fissure activity when designing subway tunnels in ground fissure zones. However, when traversing areas with stringent vibration or noise requirements, it's advisable to implement specific damping measures. In order to minimize the risk of geohazards posed by ground fissures to the subway system, the impacts of ground fissures and tunnel segmentation on tunnel design were identified and corresponding design recommendations were provided as follows:
(1) From the analysis of segmental effects, it can be seen that in terms of acceleration amplitude, the integral tunnel is the smallest, and the three-section tunnel has the largest acceleration. The reason is that the integral tunnel has better integrity and stronger constraints, and the acceleration amplitude of the surrounding rock and soil is smaller under the dynamic load of the subway. With the segmentation of the tunnel, the integrity is weakened and the constraints become smaller, and the magnitude of the acceleration of the surrounding rock and soil increases. In Xi’an city, the cross ground fissure tunnels are generally structurally strengthened by enlarging the cross-section, reserving space, setting up joints with flexible joints and local lining. Combined with the results of the test data in this study, in order to avoid the increase of acceleration amplitude of the ground fissure and the nearby surrounding rock and soil due to the weakening of the tunnel integrity caused by segmentation, it is recommended that the tunnel lining should be constructed in a way that meets the safety requirements of the tunnel lining structure. It is recommended to increase the length of segments and reduce the number of segments as much as possible when designing the tunnel under the premise of the safety of tunnel lining structure.
(2) In this study, it was found that both integral and segmental tunnels generate additional dynamic earth pressure in the surrounding soil on both sides of the ground fissure under the vibration of the exciter. In particular, the impact of intensive cyclic vibration on the surface buildings and ground fissure activities during the peak operating hours cannot be ignored. In order to avoid the exacerbation of ground fissure activities by subway cyclic vibration. Under the premise of meeting the structural safety, the tunnel segments should be minimized so that the subway dynamic loads can be transferred to the surrounding rock and soil as uniformly as possible.
(3) The vibration generated by the dynamic loads of the subway affects the surface buildings through the roadbed, lining, and soil layer. From the point of view of vibration generation, the vibration caused by subway traffic is unavoidable. In addition, as the train operation time increases, the wear and tear of the train and the rail increases, and the vibration situation also intensifies. Therefore, vibration isolation measures are very effective in reducing the vibration of the soil layer. Active vibration isolation is to minimize the output of vibration at the vibration source through the reasonable application of vibration isolators or vibration isolation materials. For subway vibration, generally take elastic fasteners, floating roadbed, continuous track, etc. to realize the purpose of active vibration isolation. Similarly, passive vibration isolation can also be used to isolate the input of train vibration through vibration isolators and reduce the vibration of surface housing and equipment.
(4) In cases where the ground fissure intersects the subway tunnel diagonally at a significant angle, structural reinforcement is essential even if a segmental tunnel is utilized. Due to the presence of structures crossing the ground fissure, the local bending moment and shear force exerted on the lining structure are substantial. Strengthening measures should be implemented at the location of the ground fissure to safeguard the tunnel structure against damage resulting from ground fissure activity.
This study summarizes the interaction patterns between ground fissures and three-section subway tunnels under dynamic train loads in a ground fissure environment by observing and analyzing the soil acceleration, earth pressure, and contact pressure between the soil and the tunnel, and discusses the effects of the presence and activity of ground fissures and tunnel segmentation. The discussion of the presence and activity of ground fissures, the mechanical response of subway loading on subway tunnels under tunnel segmentation conditions, and design measures in this study helps researchers and design engineers in the field of geology and engineering to reduce the georisk of ground fissures on urban underground transportation infrastructure. In particular, the physical modeling experiments are limited by the scaled down scale brought by the site and equipment, which can’t fully satisfy the purpose of the study to some extent. The authors supplemented and improved the physical model test by numerical simulation results, and analyzed the study of the propagation law of subway-induced vibration in the strata in terms of the characteristics of the acceleration time-course curves and other aspects (Liu et al., 2018). It should be noted that, limited to experimental conditions and time factors, the dynamic effects of subway train loading on subway tunnels in the ground fissure environment are only investigated in terms of macroscopic acceleration, earth pressure, and contact pressure from the perspective of physical modeling experiments and numerical simulations, and the dynamic effects of soil granular materials under load are not analyzed from the perspective of the mechanistic ontology model (Bian et al., 2024c, 2024d). Several studies have shown that the mechanical constitutive model based on the conservation of energy dissipation can effectively explain and analyze the mechanical response of physical model tests from a microscopic perspective (Bai et al., 2023) (Zhou et al., 2024). Therefore, the dynamic response of subway train loading on subway tunnels in the ground fissure environment is further investigated in more depth from the aspect of mechanical constitutive modeling.
5 Conclusion
Based on the physical model test, the following conclusions can be drawn for dynamic interaction between ground fissure and diagonal three-section subway tunnels:
(1) The acceleration of the three-section tunnel by the ground fissure has attenuation and enhancement effects and is affected by the activity and propagation direction of the ground fissure.
(2) The additional earth pressure of the three-section tunnel is affected by the ground fissure when the ground fissure is inactive, and is affected by the contact state between the tunnel and the soil after the ground fissure is inactive.
(3) In terms of contact additional pressure, the influence of ground fissure activity has less influence on both sides of the tunnel, mainly focusing on the bottom and top of the tunnel and the existence of the difference between the location of the hanging wall and footwall.
(4) The three-section tunnels exhibit higher vibration response under excitation compared to integral tunnels, which is attributed to segmentation effects. In addition, they exhibit greater attenuation in vibration propagation along the axial direction of the tunnel.
(5) Structural measures were determined during tunnel design mainly by considering the ground fissure activity, strengthening the tunnel structure at the ground fissure location and applying vibration damping measures for segmented tunnels when traversing the ground fissure.
Data availability statement
The original contributions presented in the study are included in the article/supplementary material, further inquiries can be directed to the corresponding author.
Author contributions
LL: Investigation, Methodology, Resources, Writing–review and editing. ZR: Data curation, Visualization, Writing–review and editing. WP: Supervision, Validation, Writing–review and editing. JY: Writing–original draft.
Funding
The author(s) declare that financial support was received for the research, authorship, and/or publication of this article. This study is supported by the National Natural Science Foundation of China (Grant Nos 52178328 and 42377190).
Conflict of interest
The authors declare that the research was conducted in the absence of any commercial or financial relationships that could be construed as a potential conflict of interest.
Publisher’s note
All claims expressed in this article are solely those of the authors and do not necessarily represent those of their affiliated organizations, or those of the publisher, the editors and the reviewers. Any product that may be evaluated in this article, or claim that may be made by its manufacturer, is not guaranteed or endorsed by the publisher.
References
Bai, B., Zhou, R., Yang, G. C., Zou, W. L., and Yuan, W. (2023). The constitutive behavior and dissociation effect of hydrate-bearing sediment within a granular thermodynamic framework. Ocean. Eng. 268, 113408. doi:10.1016/j.oceaneng.2022.113408
Bian, X., Zeng, L. L., Ji, F., Xie, M., and Hong, Z. (2022a). Plasticity role in strength behavior of cement-phosphogypsum stabilized soils. J. Rock Mech. Geotechnical Eng. 14 (6), 1977–1988. doi:10.1016/j.jrmge.2022.01.003
Bian, X., Zhang, W., Li, X. Z., Shi, X. S., Deng, Y. F., and Peng, J. (2022b). Changes in strength, hydraulic conductivity and microstructure of superabsorbent polymer stabilized soil subjected to wetting–drying cycles. Acta Geotech. 17 (11), 5043–5057. doi:10.1007/s11440-022-01573-x
Bian, X., Peng, W. H., Qiu, C. Q., Xu, G. Z., and Yao, Y. K. (2023). Model test on bearing capacity of cemented slurry reinforced pile composite foundation. Case. Stud. Constr. Mater 19, e02482. doi:10.1016/j.cscm.2023.e02482
Bian, X., Fan, Z. Y., Liu, J. X., Li, X. Z., and Zhao, P. (2024a). Regional 3D geological modelling along metro lines based on stacking ensemble model. Undergr. Space 18, 65–82. doi:10.1016/j.undsp.2023.12.002
Bian, X., Gao, Z. Y., Zhao, P., and Li, X. Z. (2024b). Quantitative analysis of low carbon effect of urban underground space in Xinjiekou district of Nanjing city, China. Tunnelling Underground Space Technol. 143, 105502. doi:10.1016/j.tust.2023.105502
Bian, X., Ren, Z. L., Zeng, L. L., Yao, Y. X., Zhao, F. Y., and Li, X. Z. (2024c). Effects of biochar on the compressibility of soil with high water content. J. Clean. Prod 434, 140032. doi:10.1016/j.jclepro.2023.140032
Bian, X., Zhao, F. Y., Zeng, L. L., Ren, Z. L., and Li, X. Z. (2024d). Role of superabsorbent polymer in compression behavior of high-water-content slurries. Acta Geotech 434, 1–16. doi:10.1007/s11440-024-02296-x
Cai, W. C., Lan, F., Huang, X. H., Hao, J. F., Xia, W. F., Tang, R., et al. (2024). Generative probabilistic prediction of precipitation induced landslide deformation with variational autoencoder and gated recurrent unit. Front. Earth Sci. 12, 1394129. doi:10.3389/feart.2024.1394129
Chang, J., Deng, Y. H., and Mu, H. D. (2023). Effects of the earth fissure on the seismic response characteristics of nearby metro stations and tunnels. Bull. Eng. Geol. Environ. 82 (6), 232. doi:10.1007/s10064-023-03257-6
Feng, Y. R., Yang, W. Q., Wan, J., and Li, H. J. (2023). Granular risk assessment of earthquake induced landslide via latent representations of stacked autoencoder. Front. Environ. Sci. 11, 1308808. doi:10.3389/fenvs.2023.1308808
Gu, Z. F., Wei, H. L., Liu, Z. K., and Zhang, M. F. (2022). Dynamic response mechanism of silt ground under vibration load. Sustainability 14 (16), 10335. doi:10.3390/su141610335
Guo, J. Q., Xu, L. X., Xu, C., Chen, R. M., and Lin, J. H. (2022). Dynamic response analysis on stress and displacement of the shield tunnel structure and soil layer under train-induced vibration in Xiamen Metro Line 6. Sustainability 14 (19), 11962. doi:10.3390/su141911962
Guo, W. Q., Yang, W. B., Qian, Z. H., Yang, L. L., He, C., and Qu, S. (2023). The effect of internal structure on dynamic response of road-metro tunnels under train vibration loads: an experimental study. Tunn. Undergr. Space Technol. 138, 105182. doi:10.1016/j.tust.2023.105182
Huang, Q., Li, P., Zhang, D. M., Huang, H. W., and Zhang, F. (2021). Field measurement and numerical simulation of train-induced vibration from a metro tunnel in soft deposits. Adv. Civ. Eng. 2021 (1), 1–20. doi:10.1155/2021/6688746
Liu, L., Liu, X. L., and Ma, T. (2017a). Dynamic response analysis of the oblique metro tunnels in ground fissures area. J. Geomechanics 23 (5), 654–660. (In Chinese).
Liu, L., Liu, X. L., and Zhou, J. X. (2018). Numerical analysis on dynamic response of the oblique metro tunnel in ground fissure area. J. Geomechanics 24 (02), 238–243. (In Chinese). doi:10.12090/j.issn.1006-6616.2018.24.02.025
Liu, L., Ma, T., Liu, X. L., and Ni, T. X. (2017b). Dynamic response analysis of the earth pressure in ground fissures area under vibration loads of metro train. Chin. J. Geol. Hazard Control 28 (4), 119–124. (In Chinese). doi:10.16031/j.cnki.issn.1003-8035.2017.04.19
Liu, L., Ma, T., Yan, J., and Wang, Z. (2022). Model test on effect of ground fissure on the behavior of oblique two-section subway tunnel. Appl. Sci. 12 (20), 10472. doi:10.3390/app122010472
Liu, N. N., Lu, Q. Z., Feng, X. Y., Fan, W., Peng, J. B., Liu, W. L., et al. (2019a). Dynamic characteristics of metro tunnel closely parallel to a ground fissure. Complexity 2019 (1), 1–11. doi:10.1155/2019/6450853
Liu, N. N., Lu, Q. Z., Li, J., Peng, J. B., Fan, W., and Liu, W. L. (2019b). Physical modeling and numerical simulation of the seismic responses of metro tunnel near active ground fissures. Complexity 2019 (1), 9014641–9014711. doi:10.1155/2019/9014641
Nezhadshahmohammad, F., Saeedi, M., and Pourrahimian, Y. (2021). Modelling of train-induced vibration in subway interactions. Int. J. Geotechnical Eng. 15 (1), 120–128. doi:10.1080/19386362.2019.1681816
Song, D. Q., Shi, W. P., Liu, M. X., He, X., Lu, R. H., and Zhang, J. W. (2024). Wave propagations in crossing-fault tunnels and their effects on the dynamic response characteristics of tunnel surrounding rock. Bull. Eng. Geol. Environ. 83 (6), 253–319. doi:10.1007/s10064-024-03751-5
Sun, L. G., Zhao, J. S., Qin, W. Q., Hou, D. Z., and Wang, X. R. (2023). Dynamic response analysis of soil around curve section tunnel under train vibration load. Appl. Sci. 13 (14), 8013. doi:10.3390/app13148013
Wang, D. K., Luo, J. J., Wang, G. Q., Li, F. L., and Su, J. (2022). Dynamic response of the tunnel bottom structure considering groundwater influence under heavy-haul train loading. Structures 46, 1469–1479. doi:10.1016/j.istruc.2022.11.020
Wang, L., Yang, S. F., and Hu, H. Q. (2023). Stochastic dynamic response and long-term settlement performance of superstructure–underground tunnel–soil systems subjected to subway-traffic excitation. Buildings 13 (3), 621. doi:10.3390/buildings13030621
Wang, S. R., Shi, K. P., Li, Z. H., Li, Z. C., and Wang, Y. F. (2019). Spatial distribution law of vibration acceleration of ultra-small-spacing tunnel under train moving loads. J. Eng. Sci. Technol. Rev. 12 (6), 96–104. doi:10.25103/jestr.126.12
Wu, L., Zhang, X. D., Kuang, F. M., Sui, J. L., Zhou, X. L., and Guo, H. (2021). Dynamic characteristics of adjacent tunnel and surroundings under the vibration of trains in the first tunnel with different buried depths. Arabian J. Sci. Eng. 46, 5105–5119. doi:10.1007/s13369-020-05246-3
Yan, Q. X., Zhang, J. C., Chen, W. Y., Yao, C. F., Yang, W. B., Chen, H., et al. (2020). Analysis on the dynamic responses of an overlapped circular shield tunnel under the different vibration loads. KSCE J. Civ. Eng. 24 (10), 3131–3144. doi:10.1007/s12205-020-2001-2
Yang, H. H., Wang, M. N., Zhang, X., and Yu, L. (2024). Improved semi-analytical solution for longitudinal mechanical response of tunnels crossing active faults considering nonlinear soil-tunnel interactions and shear effects. Thin-Walled Struct. 197, 111561. doi:10.1016/j.tws.2024.111561
Yang, L. W., Yang, M., Men, Y. M., Wang, P., and Li, J. (2019). Model teston dynamic interaction among ground fissure, tunnel, and surrounding rock. China Earthq. Eng. J. 41 (3), 710–716. (In Chinese). doi:10.3969/j.issn.1000-0844.2019.03.710
Yang, M., Men, Y. M., and Jia, P. J. (2015). There-dimensional dynamic response of metro tunnel and stratum due to subway moving loads in ground fissure area. J. Catastrophology 30 (3), 61–66. (In Chinese). doi:10.3969/j.issn.1000-811X.2015.03.012
Yang, W. B., Li, L. G., Shang, Y. C., Yan, Q. X., Fang, Y., He, C., et al. (2018). An experimental study of the dynamic response of shield tunnels under long-term train loads. Tunn. Undergr. Space Technol. 79, 67–75. doi:10.1016/j.tust.2018.04.031
Yang, W. B., Ma, G. Y., Tu, J. L., Kou, H., Zhang, Y. Y., Fang, Y., et al. (2023). Effects of voids on the dynamic response of tunnels under train-induced vibration loads. Int. J. Phys. Model. Geotechnics 23 (2), 77–91. doi:10.1680/jphmg.21.00023
Yu, L., Zhang, X., Wang, M. N., Yang, H. H., Luo, X., Qin, Y. L., et al. (2023). A simplified analytical method for the tunnels’ mechanical behaviour under the action of active fault zones. Comput. Geotechnics 164, 105789. doi:10.1016/j.compgeo.2023.105789
Zhang, M. X., Zhang, X. Q., Li, L., and Hong, C. Y. (2018). Experimental study on dynamic response of model shield tunnel induced by moving-axle loads of subway train. Int. J. Distributed Sens. Netw. 14 (10), 155014771880278. doi:10.1177/1550147718802785
Zhang, X., Yu, L., Wang, M. N., and Yang, H. H. (2024a). Mechanical response and failure characteristics of tunnels subjected to reverse faulting with nonuniform displacement: theoretical and numerical investigation. Eng. Fail. Anal. 156, 107809. doi:10.1016/j.engfailanal.2023.107809
Zhang, X., Yu, L., Wang, M. N., and Yang, H. H. (2024b). A mechanical analysis model for tunnels under strike-slip faulting considering the fault zone width and nonlinear tunnel-stratum interaction. Transp. Geotech. 44, 101171. doi:10.1016/j.trgeo.2023.101171
Keywords: ground fissure, subway tunnels, train dynamic load, dynamic response, model test
Citation: Liu L, Ren Z, Peng W and Yan J (2024) Experimental study on dynamic interaction between ground fissure and diagonal three-section subway tunnels. Front. Earth Sci. 12:1453210. doi: 10.3389/feart.2024.1453210
Received: 22 June 2024; Accepted: 06 August 2024;
Published: 23 August 2024.
Edited by:
Chong Xu, Ministry of Emergency Management, ChinaReviewed by:
Xiao Zhang, Southwest Jiaotong University, ChinaHuajin Li, Chengdu University, China
Bing Bai, Beijing Jiaotong University, China
Copyright © 2024 Liu, Ren, Peng and Yan. This is an open-access article distributed under the terms of the Creative Commons Attribution License (CC BY). The use, distribution or reproduction in other forums is permitted, provided the original author(s) and the copyright owner(s) are credited and that the original publication in this journal is cited, in accordance with accepted academic practice. No use, distribution or reproduction is permitted which does not comply with these terms.
*Correspondence: Jinkai Yan, amlua2FpeWFuZ2VvQDE2My5jb20=