 Buping Zhang
 Xinghua Zhu
 Xuewen Tao3*
- 1Department of Geological Engineering, Chang’an University, Xi’an, China
- 2Key Laboratory of Western China’s Mineral Resources and Geological Engineering, Ministry of Education, Xi’an, China
- 3Zhejiang Academy of Emergency Management Science and Technology, Hangzhou, China
- 4Institute of Earth Sciences, University of Poonch Rawalakot, Rawalakot, Pakistan
Introduction: Internal erosion triggered by water pipeline leaks seriously threatens the stability of the urban ground. Hangzhou, a city in Zhejiang Province, China, is facing critical challenges due to urban ground collapse (UGC) caused by internal erosion. However, there is a lack of research on the prevention of UGC by improving the internal erodibility of underground soil. Addressing this issue is of utmost importance to ensure the city’s stability and safety. This paper proposes to improve the internal erodibility of typical sandy silt soils with chemical stabilisers.
Methods: The effects of three chemical stabilisers, lignosulphonate (LS), lime (LI), and lignin fibre (LF), on the critical shear stress (τc) and erosion coefficient (kd) of sandy silt soils were investigated, which from Hangzhou, Zhejiang, China, by the hole erosion test (HET) at different mixing amounts and at different conservation times.
Results: The findings indicate that LF mainly improves the erosion resistance of sandy silt by increasing τc, and the maximum increase is 2.38 times; LI mainly improves the erosion resistance by decreasing kd, and the maximum decrease is 2.18 times. After adding LS, τc and kd did not change significantly. The scanning electron microscope (SEM) test revealed that the inclusion of LF led to the formation of larger agglomerates in the sandy silt soil. The microstructure of sandy silt soil remained dispersed even after adding LS. Various chemical stabilisers used to improve sandy silt soils exhibited distinct erosion mechanisms. Sandy silt soils improved with LF exfoliated into agglomerates, displaying high resistance to erosion. On the other hand, the sandy silt treated with LF still lacks a protective layer and shows minimal improvements in its ability to withstand erosion. In contrast, the LS-amended sandy silt remains stripped with individual soil particles with insignificant changes in erosion resistance.
Discussion: This study can provide a conceptual framework for choosing foundation treatment techniques in future urban development projects.
1 Introduction
With the warming of climate and the intensification of human activities, natural disasters such as landslide, debris flow and ground collapse occur frequently (Qiu et al., 2024; Wei et al., 2024; Ye et al., 2024). Ground subsidence is a common geological hazard worldwide. It is a dynamic geological phenomenon in which rock and soil bodies on the ground fall downwards under the action of natural or man-made factors and form a subsidence pit (hole) on the ground (Cheng et al., 2020; Dastpak et al., 2023). Urban ground collapse (UGC) is a specific type of ground collapse that occurs mainly on urban pavements (Zhang et al., 2023a). In recent years, UGC accidents have occurred frequently in Chinese cities, posing a serious threat to the safety of traffic facilities, passing vehicles, and pedestrians (Cheng et al., 2020; Tan and Long, 2021; Wang and Xu, 2022). According to statistics, the frequency of UGC accidents in China’s eastern coastal areas accounts for 38%, making it the region in China where UGC occurs most frequently (Cheng et al., 2020). Hangzhou City in Zhejiang Province, located on China’s eastern coast, suffered 16 UGC during 2018–2020 alone, causing severe economic losses (Wang and Xu, 2022). On 15 November 2008, a UGC occurred at the site of Hangzhou Metro Line 1, resulting in 21 deaths and 24 injuries, making it the most serious UGC in Hangzhou in recent years (Tan and Long, 2021). Therefore, it is urgent to conduct research on new technology for UGC prevention and control.
Internal soil erosion due to pipeline leaks is one of the major causes of UGC (Dastpak et al., 2023). According to statistics, the proportion of UGC accidents caused by pipeline leaks in China is as high as 40.87% (Cheng et al., 2020; Wang and Xu, 2022). Currently, the prevention and control of internal soil erosion caused by pipeline leakage, which in turn induces UGC, is still facing serious challenges. Internal soil erosion occurs when water picks up fine particles and flows through soil pores (Dastpak et al., 2023). The water flow generated by the leakage of the pipeline continuously erodes the soil around the pipeline, leading to the formation of voids around the pipeline, and with the gradual expansion of the size of the voids, the overhanging ground surface eventually collapses under the action of self-weight or external loads (Dave and Juneja, 2023a; Zhang et al., 2023a; Dave and Juneja, 2023b; Guo et al., 2023). Internal soil erosion is influenced by factors such as hydraulic loading, soil material composition, and microstructural characteristics (Dastpak et al., 2023). There have been many research results presenting test methods for erodibility within soils, such as the flume test, the submerged jet erosion test (JET), and the hole erosion test (HET) (Wan and Fell, 2004a; Benahmed and Bonelli, 2012; Haghighi et al., 2013). HET is the most widely used method for quantitative testing of erodibility thresholds within soils (Liang et al., 2021; Cai et al., 2022). The critical shear stress (τc) and the erodibility coefficient (kd) can be obtained by HET to quantitatively evaluate the internal erodibility of the soil (Wan and Fell, 2004a). HET has the advantages of economic, low-carbon, and quantitative testing, and it is currently being used to test the internal erodibility of modified soils (Liang et al., 2021; Banu and Attom, 2023).
Soil improvement techniques can increase soil strength and erosion resistance, thereby limiting the expansion of erosion cavities in the soil, and are generally categorised into physical and chemical methods (Banu and Attom, 2023). Based on the basic principles of chemical soil improvement (Firoozi et al., 2017), adding chemical stabilisers to the soil to change the composition of soil materials and enhance the cementation between soil particles can reduce soil porosity and increase soil compactness, which in turn improves soil resistance to erosion (Firoozi et al., 2017; Liang et al., 2021). Using chemical stabilisers to improve the erosion resistance of peripipe soils has a promising application in preventing future UGC accidents. In recent years, many scholars have explored research into green stabilisers that can improve soil erosion resistance while being low carbon and environmentally friendly (Liang et al., 2021; Konstadinou et al., 2023; Kwon et al., 2023). Multiple research findings show that lignin and cement can reduce the soil kd and significantly increase τc (Indraratna et al., 2008; Khabbaz, 2008; Vinod et al., 2010; Indraratna et al., 2013). Mehenni et al., 2016, found that addition of cement and lime can also increase τc of silt soils. In 2018, Vakili et al. (2018) showed that the combination of calcium lignosulphonate and polypropylene fibres can improve the erosion resistance and mechanical strength of dispersed clays. Scientists investigated the effect of three chemical stabilisers, water glass solution, calcium lignosulphonate, and sodium polyacrylate, on the erosion resistance of sandy soil (Liang et al., 2021). It has been shown that increasing the amount of chemical stabiliser added and prolonging the curing time can reduce the amount of erosion and particle loss (Liang et al., 2021). As the lignosulfonate content increased, τc of the treated soil samples increased, and kd decreased significantly (Vinod et al., 2010; Indraratna et al., 2013; Rasika et al., 2013). However, conventional chemical stabilisers effectively improve soil erosion resistance (Vinod et al., 2010; Herrier et al., 2018; Konstadinou et al., 2023). Human society is currently facing the trend of global warming, and the production of existing chemical stabilisers such as cement consumes a large number of natural resources and causes environmental pollution, which is a growing concern for many people (Liang et al., 2021). Therefore, it is increasingly important to use new environmentally friendly modifiers that are environmentally friendly, economical, and have better erosion resistance than traditional stabiliser such as cement.
In this study, the effects of calcium lignosulfonate, lignin fiber and lime on the critical shear stress and corrodibility coefficient of typical sandy silt in pavement collapse-prone area were investigated. First, the cylindrical samples were prepared under different dosage and curing time. Secondly, the internal erosion of sandy silty soil improved by chemical stabilizer is tested by the improved HET. Finally, the microscopic mechanism of chemical stabilizers improving soil internal erosion was analyzed based on SEM images. This research has a high engineering practical value for the prevention and control of UGC disasters in Hangzhou and its neighboring areas.
2 Materials and methods
2.1 Material properties
Hangzhou, located in Zhejiang Province, is a city in the southeast coastal area of China that experiences a significant number of UGC. Despite climate change and the ongoing development and use of urban underground spaces, Hangzhou continues to face a substantial risk of future UGC accidents (Wang and Xu, 2022; Zhang et al., 2023b; Zhou et al., 2024).
Figure 1A displays the dense distribution of historical occurrences of UGC in the eastern region of Hangzhou, with a particular focus on Xihu District. Upon examining a typical instance of UGC caused by a pipeline leaking in the city, it was noted that the formation of hollow spaces beneath the pavement primarily took place inside the sandy silt layer.
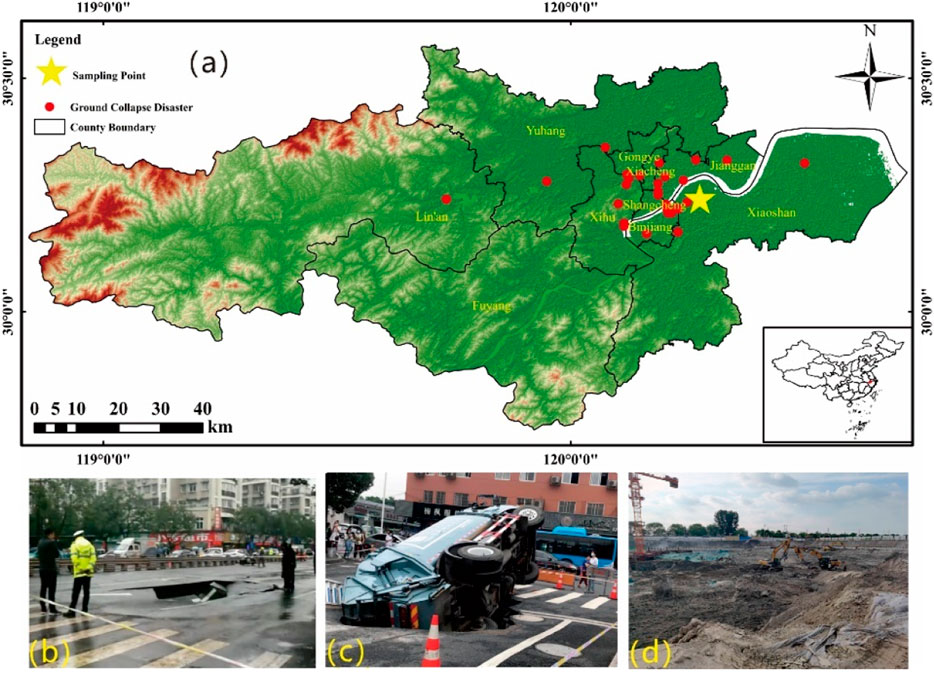
Figure 1. Historical UGC cases and sampling locations (A) Historical UGC and sampling locations; (B) Pavement collapse due to sewerage pipe breakage (Photo from Hangzhou Planning and Natural Resources Bureau); (C) Pavement collapse due to stormwater pipe leakage [Photo from Qianjiang Evening Post (newspaper)]; (D) Sampling location.
The sandy silt has a loose structure and very low erosion resistance, which is very easy to be hollowed out by leaking water pipeline, forming empty spaces under the road surface, leading to UGC accidents (Figures 1B, C). Therefore, a typical sandy silt soil was selected as the test soil sample in this study, and the sampling location is shown in Figure 1A, D. Sandy silt soil was used for the test at a sampling depth of about 12 m. The basic physical parameters of the soil samples obtained from the laboratory test are shown in Table 1. The maximum dry density of the soil sample was 1.55 g/cm3 and the optimum water content was 20.2%. LS has a broad application prospect as a chemical stabiliser for erodible soil. In this study, LS is produced by Qiangxing Chemical Company (Figure 2A). LF can form a three-dimensional mesh structure after being added to the soil, linking the individual soil particles together and increasing the stability of the soil in the flow of water, so it has a broad application in soil erosion enhancement, the lignin fibre used in this study is the white lignin fibre produced by China’s Shandong Yusuo Chemical Science and Technology Company (Figure 2C). LI has demonstrated effective performance in improving the erodibility of soils and in recent years more and more water conservation engineers are interested in this technology. The lime raw material used in this study was sourced from Fuchen (Tianjin) Chemical Reagent Company in China (Figure 2B).
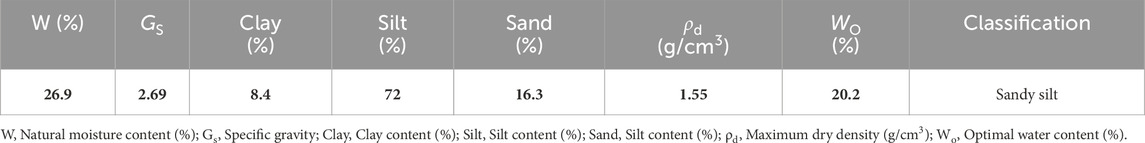
Table 1. Indicators of physical properties of soil samples used in the test.
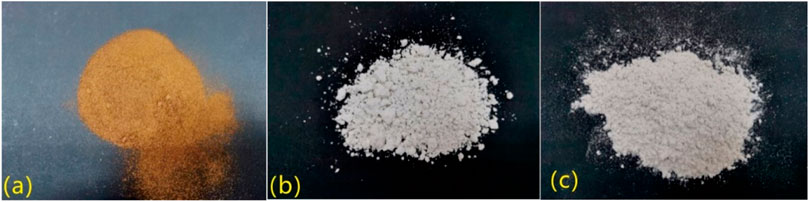
Figure 2. Chemical stabilisers (A) Calcium Lignosulphonate (LS); (B) Lignin Fibre (LF); (C) Lime (LI).
This study used three chemical stabilisers, LS, LF, and LI, to treat the soil samples. The additional amounts (m) of the three chemical stabilisers was calculated according to the following equations:
a = 0%, 2%, 4%, 6%, 8%, m is the mass of chemical stabiliser, g; m1 is the mass of dry soil required to prepare a specimen, g; w0 is the moisture content of air-dried soil, w0 = 0.68%;
This study explores the effect of maintenance time (T = 1 day, 3 days, 7 days, and 14 days) on the internal erodibility of improved soils at 8% dosing, considering the chronological nature of each of the three chemical stabilisers separately. The maintenance time in this study refers to the preparation of cylindrical samples with chemical stabilizers and preservation for 1–14 days under the same environmental conditions. The purpose of this is to make the chemical stabilizer in full contact with the soil particles, and at the same time, to explore the early change of the corrosion resistance of the soil modified by the chemical stabilizer. Table 2 provides an overview of the test conditions employed in the study.
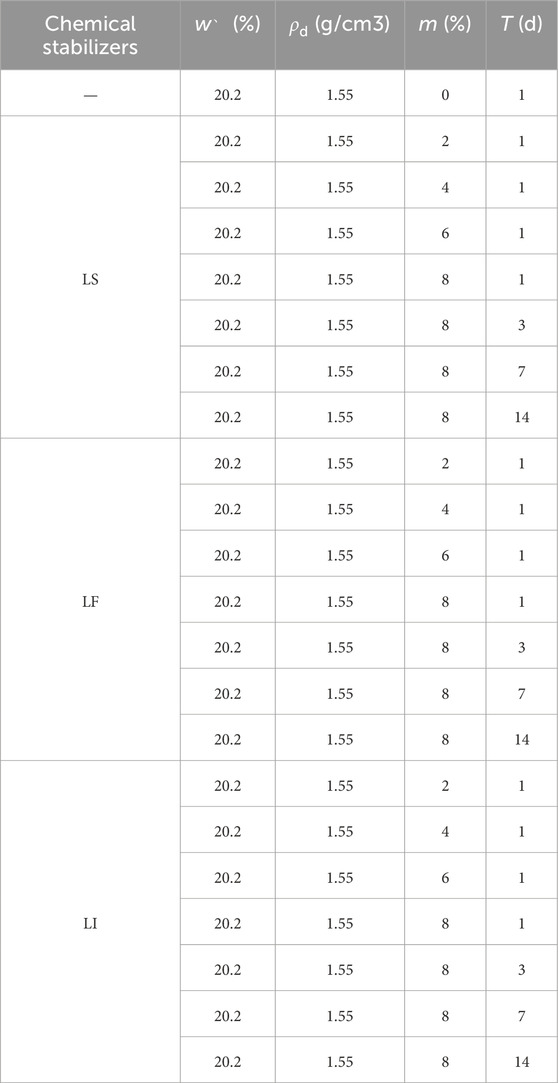
Table 2. Overview of employed test conditions.
2.2 Sample preparation
Following their retrieval, the soil samples were dried at 105°C and sieved using a regular 2 mm sieve to remove any remaining pebbles or debris. According to Equations 1–3, the calculations were carried out using the “Geotechnical Test Method Standard GB/T 50123–2019” to determine the dry soil mass (m1), water content (mw), and corresponding mass of the chemical stabiliser (m) required for the various working conditions shown in Table 2.
The dry soil was first mixed thoroughly with the weighed chemical stabiliser, then water was added, mixed thoroughly, and placed in a sealed bag for 24 h to allow for uniform water migration from the soil sample. The specimens used in the current study for the HET were cylindrical samples measuring 6 cm in diameter and 10 cm in height. Several procedures were followed to get the compacted soil samples ready for the HET. The initial step involved calculating the amount of soil samples required for each layer of the landfill and determining the intended height of the landfill. These calculations were based on the preparation procedure specified in the Standard GB/T 50123–2019 Geotechnical Test procedure. This calculation ensured precise measurements for the following processes. After that, soil samples were formed in layers (Figures 3A, B). The loose soil was carefully measured using an electronic scale and then put into the mould to create samples. A customised compactor was utilised to compress the dirt to get the appropriate height for each layer. The compacted soil sample’s upper surface was scraped and treated to execute layered interface shaving (Figure 3C). The process was repeated five times, following steps (1) and (2), until the sample-making mould was filled (Figure 3D). This ensured the soil samples were layered and compacted correctly. Following the preparation of the specimens, they entered a maintenance phase. The specimens were enclosed in airtight bags, marked for identification, and stored at room temperature for a duration ranging from 0 to 14 days. This provided an ample amount of time for the stabilisation and conditioning of the specimen. Every well-maintained cylindrical specimen was drilled before conducting the HET (Figure 3E). To minimise moisture leakage along the soil sample and the chamber wall, a coating of petroleum jelly was applied to the wall of the specimen chamber. Next, the cylindrical specimen was inserted into the specimen chamber, and a hole with a diameter of 6 mm was drilled along its central axis. The drilling method produced uniform conditions for subsequent experiments. Preparing and installing various HET specimens was conducted multiple times, following the specific circumstances outlined in Table 2.
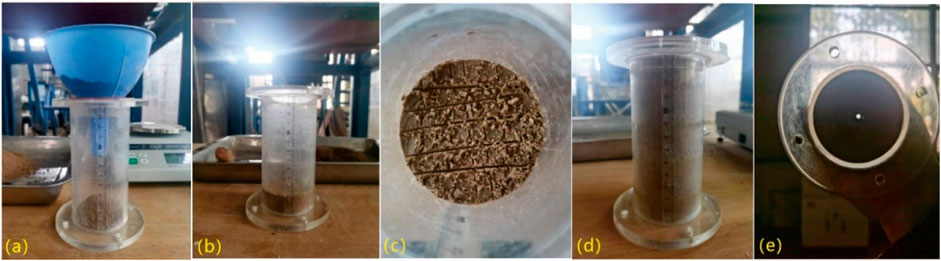
Figure 3. Specimen preparation process (A) Soil sample filling; (B) Layered compaction; (C) Interfacial scraping; (D) Columnar specimen; (E) Hole in the specimen.
2.3 Hole erosion test (HET)
2.3.1 HET steps
The modified HET setup used in this study is shown in Figure 4 (Wan and Fell, 2004b). The HET setup consists of an upstream water supply tank, a sample box, a downstream water supply tank, and associated linked valves and pipework. By adjusting the height of the upstream tank, it was possible to create 1–3 distinct hydraulic gradient test conditions in this study, considering a head difference of 10 cm (equivalent to a hydraulic gradient of 1). The upstream and downstream water supply tank volumes were 25 cm3. The water pipeline used for the experiments had an inner diameter of 25 mm. The test initiation and termination were controlled using a valve. The upstream pressure gauge position is set with a 3 cm thick gravel buffer layer to prevent erosion damage to the specimen surface, and the upstream and downstream pressure gauge range is 0–10 kPa, with a resolution of 0.001 kPa. The testing apparatus employed in this study can carry out a variety of conditions under the evaluation of fine-grained soil internal erosion characteristics.
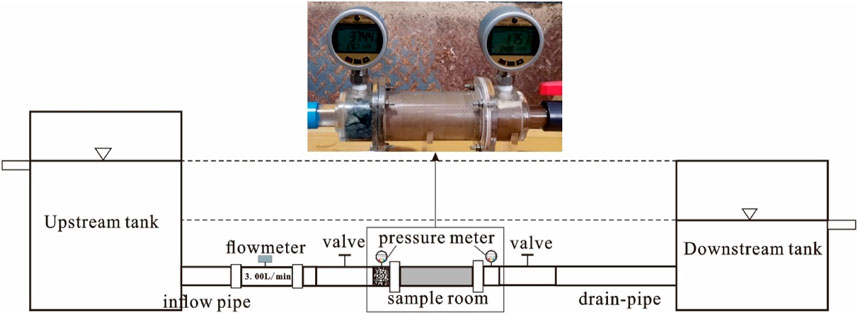
Figure 4. Schematic diagram of the HET setup.
The HET procedure is as follows: 1) Place the prepared mould containing round holes on the bracket and open the upstream and downstream pressure gauges; 2) Adjust the water supply device to the height required by the design; firstly, fill up the downstream of the mould with water so that the water fills up the holes until the air in the holes is excluded; 3) Open the valves of the water supply device, and at the same time, turn on the video camera and the timer, and start the experiment; 4) Pay attention to the erosion and collapse of the side wall of the specimen in the course of the experiment, and make timely Adjustment; 5) When the erosion to the side wall of the specimen box when the end of the experiment or the flow rate increased to the water supply valve and water flow at the same time when the end of the experiment; 6) Immediately after the end of the experiment, remove the specimen box, take a picture of the two ends of the specimen, and then melt the paraffin wax filled into the final hole, to be cooled down, the launch of the specimen, the direction of the axial dissection, the use of vernier calipers several times to measure the diameter of the final paraffin wax model, and seek the average value, to determine the final hole diameter; 7) Remove the waste soil in the test box, clean the specimen box, and then repeat the above steps to carry out the next test.
2.3.2 Erosivity threshold prediction
This paper adopts the basic assumptions of Wan and Fell for HET (Wan and Fell, 2004a). By analyzing the experimental data, shear stress
where
The internal erosion stability of the in situ loess was then evaluated based on the grading method of internal erosion stability of soils proposed by (Wan and Fell, 2004a). Where Pin and Pout are the water pressure at the entrance and exit of the hole in kPa, and L is the length of the specimen in m as shown in the Equation 7.
2.4 SEM test
This study studied the microscopic mechanism of three chemical stabilisers in enhancing soil’s internal erosion resistance. To do this, specimens were taken from the middle of the final pore wall after conducting a HET. These specimens were then subjected to scanning electron microscope (SEM) using a Phenom Pure-type microscope. An ion-sputtering device was used to apply gold to the test area in order to obtain a higher-resolution scanning electron microscope (SEM) image. A representative soil block, measuring approximately 1 cm × 1 cm × 1 cm, was chipped on the soil block, and the specimen was broken along the middle before the test to ensure that the specimen possessed a fresh section. The specimen containing the fresh section was then placed into a vacuum cold dryer to be cold-dried for 8 h. Two typical viewpoints were selected for picture taking in order to lessen the effect that differences in soil samples could have on the test results. Next, images captured with a scanning electron microscope (SEM) were obtained at magnifications of ×200, ×500, ×800, ×1,000, and ×2,000.
3 Results
3.1 Final hole diameter
The internal erosion test was conducted on 22 specimens, following the HET protocol described in the previous section. After preparing for the test, the upstream water supply valve was opened, and the water flowed through the prefabricated holes under the effect of the head difference. The holes eroded under the impact of runoff shear stress, and the diameter of the internal holes in the specimens increased gradually as the erosion proceeded. Figures 5A–C shows the morphological characteristics of the cross-section of the holes in different states. As can be seen from Figure 5B, the final pore morphology of the untreated specimen is elliptical, and the inner wall of the pore is smooth, indicating that the untreated specimen has a low frictional resistance to water flow. The most kind of morphology of the treated specimen is nearly circular, and the inner wall of the hole is rougher in terms of the hole opening, which results in a higher frictional resistance to the runoff. In addition, Figure 5 also shows that the final hole diameter of the treated specimen is reduced compared to the untreated specimen.
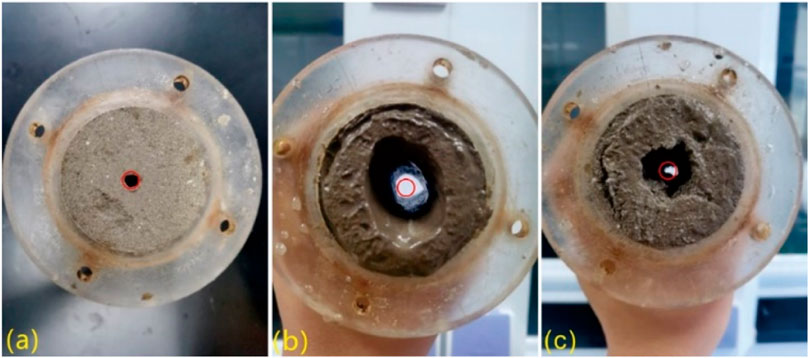
Figure 5. Morphological characteristics of final holes: (A) initial state; (B) untreated soil sample; (C) treated soil sample, whereas the red circles represent initial holes.
At the end of the test, the melted paraffin was poured into the final hole, and a three-dimensional paraffin model of the final hole was obtained. The diameter of the paraffin model was measured several times using electronic vernier callipers and averaged, and this average was taken as the diameter of the hole. Under the same hydraulic conditions, the size of the final hole diameter (D) in the sample after the HET reflects the ability of the improved soil sample to resist erosion by concentrated runoff, and the smaller D is, the stronger the ability to resist erosion.
The D of the specimens treated with different chemical stabilisers were counted as shown in Figure 6. D were reduced to varying degrees with the increase of the stabiliser dosage (m) as illustrated in Figure 6A. D of the specimens treated with different chemical stabilizers are shown in Figure 6A. Among them, the addition of 8% LS had the smallest final hole diameter of 2.2 cm. The addition of 2% LF specimens had the largest D of 3.8 cm. With the dosage increase from 2% to 8%, D of specimens treated with three kinds of stabilizers, namely, LS, LF, and LI, decreased by 0.7 cm, 1.2 cm, and 1.31 cm, respectively. D of the test, with the addition of 8% LI, had the most considerable reduction. The relationship between the maintenance time (T) and D of the soil samples treated with the three chemical stabilisers are shown in Figure 6B. From this, it can be seen that under the same dosage (8%), D of LS-treated specimens increased and then decreased, D of LI-treated specimens slowly reduced with the curing time, D ranged from 2.53 cm to 2.88 cm, and the average D was 2.74 cm. The LF demonstrated the most sensitive to the duration of the curing process. As the curing time increased, the final hole sizes also increased, ranging from 2.6 cm at 1 day to 1.46 cm at 14 days, resulting in a decrease of 1.14 cm. D is visual evidence of the phenomenological interpretation of chemical stabilisers to improve the internal erodibility of the soil and to evaluate the amelioration effect of the three chemical stabilisers quantitatively. Further quantitative analysis and evaluation are required.
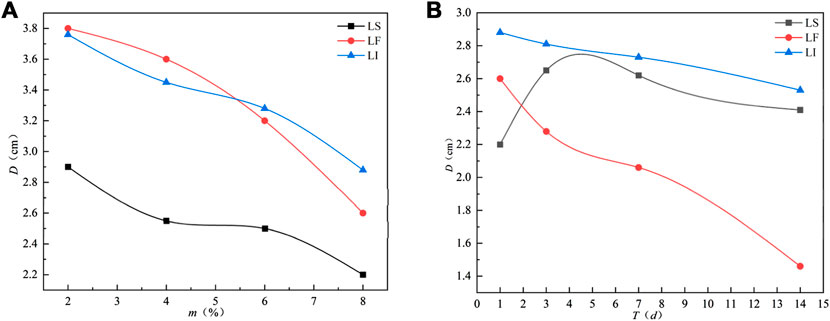
Figure 6. Final diameter (A) different addition amount; (B) different curing time.
3.2 Hole wall characteristics
After the test concluded, melted paraffin was put into the final hole. Once the paraffin solidified, it was divided into two equal parts along the centre of the specimen. This allowed us to observe the final pipe wall’s morphological characteristics after erosion (Figure 7). Comparison of the morphological characteristics of the final pore wall reveals that one type of pore wall is particularly rough, with many small holes distributed in beads of depressions (Figure 7A), which corresponds to the unevenness of the outer surface of the paraffin model. Figure 7B shows a typical representation of the smooth wall, and it can be seen that the outer surface of the paraffin model corresponds to the inner wall of the cut-open model, which are both relatively smooth. The specimen with a clear outlet water flow during the test has a rougher final wall (Figure 7A), while the turbid liquid containing sediment at the outlet location of the water flow for a long time during the test has a smoother final wall (Figure 7B). The roughness of the wall after erosion reflects some extent the pattern of pipe wall denudation under the action of concentrated runoff scour, which will be elaborated in the analysis of the improvement mechanism below.
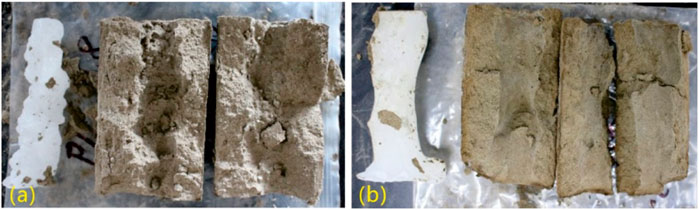
Figure 7. Morphological characteristics of the inner wall of the hole: (A) 8% LF-treated specimen; (B) 8% LS-treated specimen.
3.3 Critical shear stress
According to Equation 6, with τt as the horizontal coordinate and εt as the vertical coordinate to do the scatter plot, fitted to obtain the overshear stress equation of the modified specimen, as shown in Figure 8 (6% LS, conservation 1 day). In Figure 8, the intersection coordinate of the straight line and the horizontal axis is τc, and the slope of the straight line is kd.
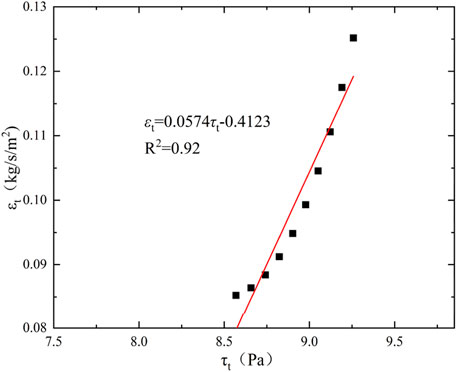
Figure 8. Typical 𝞃t-𝞮t curve.
As τc increases, the soil’s ability to withstand erosion increases. The erosion resistance of the soil body rises as kd decreases. According to this method, τc and kd under different working conditions are shown in Figures 9, 10, respectively.
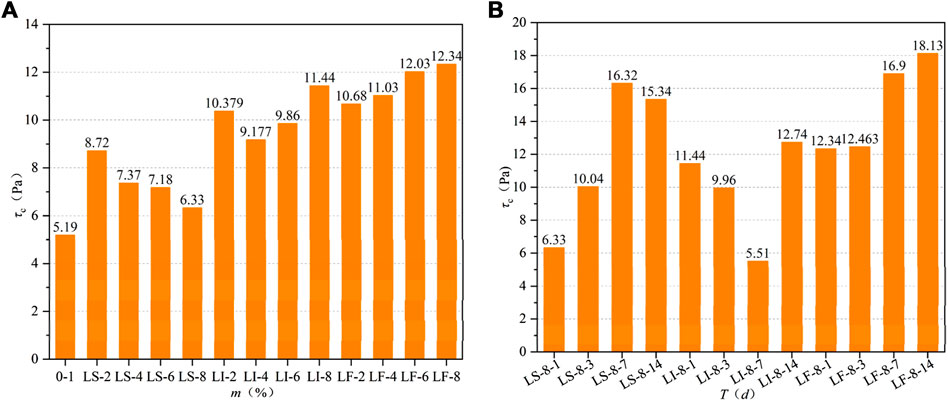
Figure 9. Critical shear stress of stabilised soil; (A) different dosage; (B) maintenance time.
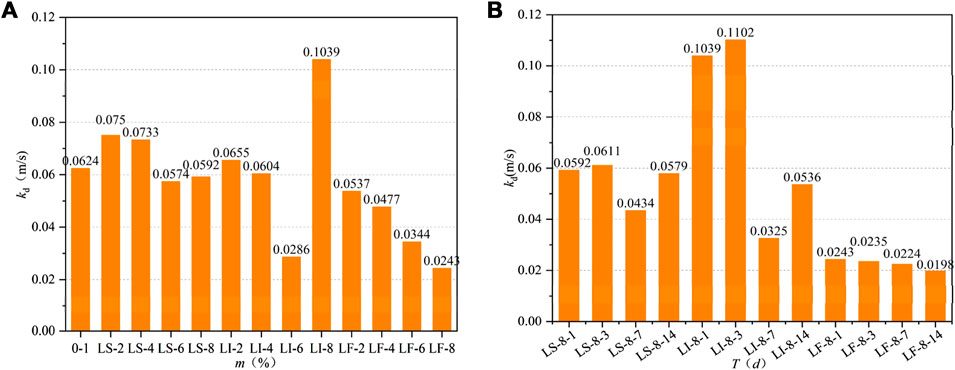
Figure 10. Erodibility coefficient of modified soil (A) Different dosage (B) Maintenance time.
The histogram of τc of the modified sandy silt soil is in Figure 9. The effect of ameliorant dosage on τc is demonstrated in Figure 9; it can be seen that τc of the powdered soil before amelioration is the smallest, which is only 5.19 Pa. Adding LS leads to an increase in LS dosage and a gradual decrease in the value of τc. Among different dosages, the highest τc is observed at a 2% LS dosage, measuring 8.72 Pa τc is similar for the 4% and 6% dosages, while the lowest value is observed at an 8% dosage, measuring 6.33 Pa. This value is 1.14 Pa higher than τc without adding ameliorant. The minimal τc is 6.33 Pa, representing an increase of 1.14 Pa compared to powdered soil without any additional stimulant. The growth trend of τc of powdered soil after adding LI is more noticeable; τc of powdered soil with 2% added reaches 10.38 Pa, which is twice as much as that of powdered soil without any addition of improver, and that of powdered soil with 8% added LI reaches 11.44 Pa, which is 1.06 Pa higher than that of powdered soil with 2% added LI. τc of LI-amended pulverised soil doped with 6% and 8% in the middle position increases by 3.987 Pa and 4.67 Pa, respectively, compared to the unmodified soil. It can also be seen that Figure 9A demonstrates that as the amount of LF doping increases, τc gradually increases. Notably, τc of LI doped with 2% LF is 2.05 times higher than that of the untreated LI, and τc of LI doped with 8% LF is 2.38 times higher than that of the non-doped LI. τc rose by a factor of 2.38 compared to the unadded condition.
The influence of an 8% dosage and various curing times on τc is shown in Figure 9B. For LS with an 8% dosage, τc gradually increased as the curing time extended. It was 6.33 Pa at 1-day curing, 3.71 Pa at 3-day curing (compared to 1-day curing), 9.99 Pa at 7-day curing (compared to 1-day curing), and 9.01 Pa at 14-day curing (compared to 1-day curing). On the other hand, for LF with an 8% dosage, τc did not exhibit significant changes at 1-day and 3-day curing. The difference was only 0.123 Pa at 7-day and 14-day curing compared to 1-day curing. With the addition of LI at an 8% dosage, τc initially decreased and then increased with the prolongation of curing time. The difference in τc between 14-day and 1-day curing was 1.3 Pa.
The influence of chemical stabiliser dose and maintenance time on τc is highly significant. Choosing the correct dosage and maintenance time can effectively enhance the soil’s resistance to erosion shear stress.
3.4 Coefficient of erodibility
kd is an important indicator in assessing the internal erodibility of soil. A smaller kd indicates a higher level of erosion resistance in the soil. Figure 10A displays the histogram depicting kd at various levels of chemical stabiliser doses. From the detailed analysis of Figure 10A, it can be seen that kd of pulverised soil without chemical stabiliser is 0.0624 m/s, and with the increase of LF doping, kd decreases significantly when 2% doping of LF is added, kd is 0.0537 m/s, and the minimum kd is 0.0243 m/s for 8% doping, which is 0.0381 m/s less than that of the un-added chemical stabiliser. The addition of a 6% dosage of LI also significantly reduced the corrosivity to 0.0286 m/s. It was observed that there was no significant pattern in kd with the addition of LS. The impact of maintenance time on kd of the modified chalk is depicted in Figure 10B. Analyzing the last four bars of the figure, it is evident that kd ranges between 0.0243 m/s and 0.0198 m/s when an 8% dosage of LF is added. This range represents a significant reduction in erodibility as compared to samples that did not include the chemical stabilizer. In comparison to samples without a stabilizer, there was a minor decrease in kd following the addition of 8% LS. At 7 days of maintenance, kd measured 0.0434 m/s. On the other hand, when 8% LI was added, an increase in kd was observed at 3 days and 7 days of maintenance, reaching values of 0.1039 m/s and 0.1102 m/s, respectively. These observations indicate that the relationship between kd of the pulverized soil and the dosage and maintenance time becomes more complex after the addition of a chemical stabilizer. Furthermore, it was noted that the relationship between kd and the dosage and maintenance time becomes more complicated after introducing a chemical stabilizer. Therefore, it is deemed more appropriate to select τc as the evaluation parameter for assessing the effectiveness of improvement.
4 Discussions
4.1 Improvement effect
Internal erosion presents a significant risk to the sustainable operation of structures such as dams and urban highways (Zhang et al., 2023a). To solve this problem, chemical stabilisers incorporated into the interior of erosion-prone soils can significantly improve the erosion resistance of soils (Banu and Attom, 2023). In this study, three chemical stabilisers, LS, LI, and LF, were selected to consider the effects of chemical stabiliser dosage (0%–8%) and maintenance time (1 day–14 days) after completion of specimen preparation on the internal erodibility of the soil (Liang et al., 2021). The most commonly used HET was used to obtain the parameters for evaluating the internal erodibility of the modified sandy silt: τc, kd, and εt (Wan and Fell, 2004a). The test results show that after adding chemical stabiliser, the internal erodibility of sandy silt soil will change significantly, and the overall trend will reduce (Liang et al., 2021). Still, the improvement effect is more sensitive to the type of chemical stabiliser, the amount of chemical stabiliser added, the maintenance time, and other factors (Vakili et al., 2018). By applying τc as a measure, it was observed that τc of LF increased consistently as the dosage increased. The maximum increase was 2.38 times compared to the specimen without a chemical stabiliser. Additionally, τc of LI was slightly lower than that of LS, with a maximum increase of 2.2 times (Ta’negonbadi and Noorzad, 2017). τc increased by 1.68 times when the amount of LS was added at 2% and gradually decreased when the amount of LS was higher than 2% (Liang et al., 2021). With the increase in maintenance time, τc of LF with 8% addition increases steadily, which aligns with the actual engineering requirements (Liang et al., 2021). Based on the economic benefits and improvement impact, using τc as the evaluation index, adding a 2% chemical stabiliser results in LF having the most significant improvement effect, followed by LI and LS having the least improvement effect. Using the kd as the assessment index, adding 6% of LI and 8% of LF and maintaining for 1 day lowers the kd by 2.18 times and 2.57 times, respectively (Rasika et al., 2013). The kd of the LF specimens fell significantly as the curing period increased, mainly when the additional amount was 8%. Thus, when kd is employed as the assessment criterion, LF exhibits the most significant improvement effect, followed by LI, and LS demonstrates the least improvement. Hence, based on τc and kd analysis, it is advisable to prioritise LF>LI>LS in practical applications.
4.2 Stabilisation mechanism
4.2.1 Microstructural characteristics
The structure of soil is the spatial arrangement of particles, aggregates, and pores in soil, and the development of the theory of microstructural mechanics has linked microstructure to the macroscopic behaviour of soils (Duan et al., 2024). Microstructure and macrostructure together determine soil’s mechanical behaviour and water stability (Duan et al., 2023). Soils with different structures have different internal erosion behaviour (Lefebvre et al., 1986). Therefore, by comparing the microstructural characteristics of pulverised soils before and after improvement, the mechanism of chemical stabiliser improvement of pulverised soils can be revealed (Hassan et al., 2023). Figure 11 displays scanning electron microscope (SEM) pictures of the pulverised soil in various conditions, observed at a magnification of ×1,000. Figure 11A displays the microstructure of the sandy silt soil in its natural state, without chemical stabilisers. The image reveals distinct particle boundaries, with particles primarily in direct contact with one another. There is evidence of microcementation, and no clumps or agglomerates are observed. Additionally, the soil exhibits well-developed pores (Cheng et al., 2021). Consequently, the natural sandy silt soil possesses minimal resistance to erosion (Lefebvre et al., 1986).
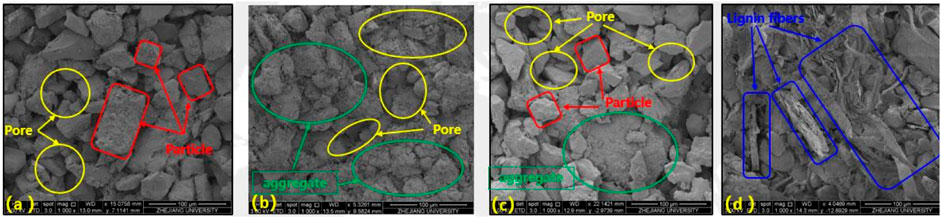
Figure 11. Microstructure images of powdered soil before and after modification; (A) 0%; (B) LI 8% 14 days; (C) LS 8% 14 days; (D) LF 8% 14 days.
With the addition of 8% content of LI, the maintenance time is 14 days, it can be seen that the pores in this specimen are all filled by LI, LI covers the particles around the particles, the particles form a microcementation between the particles, which enhances the erosion resistance as illustrated in Figure 11B (Shourijeh et al., 2020). The microstructure of pulverised soil after adding 8% content of LS and maintenance for 14 days is shown in Figure 11C. It can be seen that the microstructure of soil body did not change significantly, and insignificant cementation was formed between some particles, the pore space was still relatively developed, and the point-point contact still dominated the contact between the particles, and thus the stability was poor, which was also an intrinsic factor of the poor effect of the LS in improving the pulverised soil (Indraratna et al., 2009). The SEM image of 8% addition and 14 days maintenance, as shown in Figure 11D, can be seen that the picture is covered with a fibrous material, which tightly entangles the soil particles together, the number of pores is substantially less, distributed along the fibres, and the shape is elongated, which indicates that the LF-improved chalky soil is dense, and thus has the best amelioration effect (Liu et al., 2018).
4.2.2 Microscopic parameters
The software “Image-Pro Plus” (IPP) is one of the most commonly used tools for quantitative analysis of soil microstructure (Huo et al., 2023). Soil particles and pores can be quantitatively analyzed by using IPP software (Xu et al., 2021). The distribution characteristics of pore diameter have significant influence on soil erosivity (Khabbaz, 2008). The ×500 SEM image was used as the data source to analyze the pore distribution of the sample. There are four types of pores in the samples strengthened by different chemical stabilizers: macropore (Pore diameter >32 μm), mesopore (16–32 μm), small pore (8–16 μm) and micropore (<8 μm) (Figure 12). As shown in Figure 12, the addition of different chemical stabilizers had significant effects on soil pore distribution. The samples without any chemical stabilizer were dominated by macropores (>32 μm), and the number of macropores (>32 μm) was significantly reduced after the addition of chemical stabilizer, among which the addition of 8% LI could significantly reduce the number of macropores (>32 μm). This shows that the chemical stabilizer can fill the macropores (>32 μm) of the soil, so that the contact between the soil particles becomes tight, thereby improving the connection between the particles, and therefore, the erosion resistance is improved.
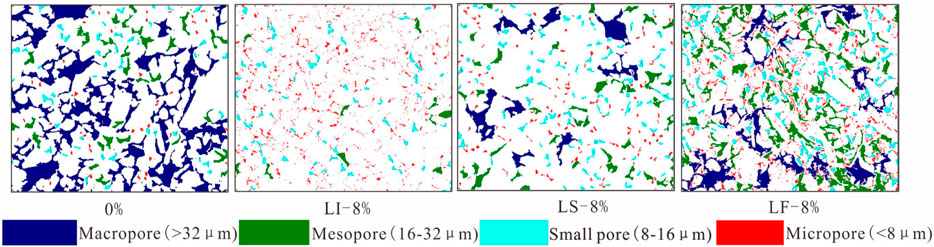
Figure 12. Pore distribution under different chemical stabilizers.
Figure 13 reveals the quantitative changes of various pore distribution characteristics after the addition of different chemical stabilizers. It can be seen from Figure 13 that the addition of chemical stabilizer will greatly increase the number of micropore (<8 μm) in the soil. For example, after adding 8% LI, the micropore (<8 μm) increased by 29.89%. Small pore (8–16 μm) percentage is not sensitive to chemical stabilizer. Figure 13 also shows that the percentage of mesopore (16–32 μm) and macropores (>32 μm) in the soil is greatly reduced after the addition of chemical stabilizer. In summary, the addition of chemical stabilizers can make the soil structure more dense, thus enhancing the critical shear stress and reducing the erodibility coefficient.
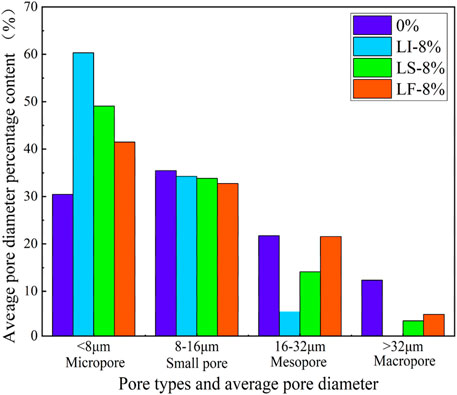
Figure 13. Percentage of mean pore diameter under different chemical stabilizers.
4.2.3 Internal erosion mechanisms in stabilised soils
The internal erosion mechanisms vary significantly depending on the soil structure (Lefebvre et al., 1986). The microstructure of the sandy silt soils changed substantially after the addition of different chemical stabilisation (Figure 11) (Reddy et al., 2020), resulting in a differentiated internal erosion behaviour (Figure 7) (Vakili et al., 2018). In fact, the variability in the internal erosion behaviour of the soil is an outward indicator of the difference in the internal erosion mechanism (Lefebvre et al., 1986). The addition of chemical stabilisers alters the microstructure of the natural sandy silt soil, leading to significant changes in the contact relationships between particles (Elandaloussi et al., 2018). There are two common ways in which runoff removes material when it comes into contact with the surface of the silt particles (as shown in Figure 14). As depicted in Figure 14A, the addition of chemical stabilisers resulted in the formation of a thin cover layer on the particle surface (Ta’negonbadi and Noorzad, 2017). However, this did not effectively enhance the contact relationship between the silt particles.
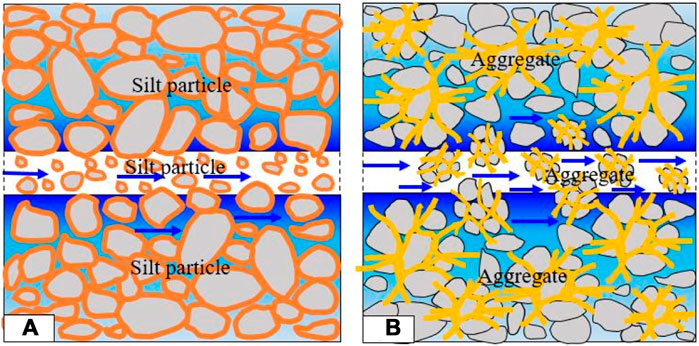
Figure 14. Schematic diagram of two typical exfoliation mechanisms for modified sandy silt soil: (A) particle exfoliation and (B) agglomerate exfoliation.
Consequently, the cementation between the particles was weak, and the silt particles remained separate (Khabbaz, 2008). Concentrated runoff scouring results in a remarkably high erosion rate, causing the swift displacement of soil particles. The fragmented soil particles are evenly carried away during this procedure, leading to a level surface after erosion, as depicted in Figure 7A. Under the conditions of soil being stripped and transformed, the ability to resist erosion is very low, as evidenced by the case of LS. Figure 14B shows another improved powder soil stripping mechanism; as can be seen in Figure 14B, a large number of agglomerates are formed within this improved soil body, and under the action of the runoff, the smaller, smaller agglomerates are peeled off in the form of agglomerates. Small pits are formed in the wall after peeling off in the form of agglomerates (Figure 7B). Due to the incorporation of amendments such as fibres, the initially dispersed and distributed particles are bonded together, the soil body is more holistic, and the agglomerates have a stronger resistance to erosive scouring than the dispersed individual soil particles. Therefore, the improvement effect is better than that of the LF.
5 Conclusion
This study investigated the stabilizing effects of three chemical stabilizers on sandy silt soil, and the following conclusions were drawn:
1) LF mainly improves the erosion resistance of sandy silt soil by increasing the critical shear stress (τc), and the maximum increase is 2.38 times; LI mainly improves the erosion resistance by decreasing the erodibility coefficient (kd), and the maximum decrease is 2.18 times. The critical shear stress (τc) and erodibility coefficient (kd) did not change significantly after adding LS; the improvement effect is general.
2) LF mainly enhances the erosion resistance through fibre entanglement of silt particles to improve the integrity of the soil body, while LI mainly enhances the erosion resistance through the formation of weak cementation between the particles;
3) The variability of morphological characteristics of the pore wall at the end of erosion reflects the differences in stripping patterns. The better modified LF was stripped in the form of larger agglomerates, which weighed more than the individual soil particles and thus had a higher erosion resistance; the modified soil samples stripped with individual soil particles, such as the LS modified soil samples, did not differ much from the natural silt microstructure, and thus did not have a significant improvement in erosion resistance.
This study conducted HET on three different chemical stabilisers to enhance the quality of sandy silt soil. The study additionally investigated the impact of dosage and maintenance time on the effectiveness of soil improvement. In the future, conducting HET will be essential for determining the ideal dosage of various chemical stabilisers. Furthermore, it is imperative to integrate the principles of pipeline hydrodynamics and soil chemistry in forthcoming research to understand the internal erosion mechanism of chemical stabilizer-treated soils completely.
Data availability statement
The raw data supporting the conclusions of this article will be made available by the authors, without undue reservation.
Author contributions
BZ: Data curation, Investigation, Writing–original draft. XZ: Conceptualization, Methodology, Supervision, Writing–original draft, Writing–review and editing. XT: Funding acquisition, Investigation, Resources, Writing–review and editing. MW: Formal Analysis, Validation, Visualization, Writing–review and editing. AA: Formal Analysis, Supervision, Validation, Writing–review and editing. GM: Data curation, Investigation, Resources, Writing–review and editing.
Funding
The author(s) declare that financial support was received for the research, authorship, and/or publication of this article. The research reported in this manuscript is funded by the Natural Science Foundation of China (Grants Nos 42041006, 42377158, and 42377163); Key R&D Program Projects in Zhejiang Province (2023C03177), and the Fundamental Research Foundation of the Central Universities of China (300102262905).
Conflict of interest
The authors declare that the research was conducted in the absence of any commercial or financial relationships that could be construed as a potential conflict of interest.
Publisher’s note
All claims expressed in this article are solely those of the authors and do not necessarily represent those of their affiliated organizations, or those of the publisher, the editors and the reviewers. Any product that may be evaluated in this article, or claim that may be made by its manufacturer, is not guaranteed or endorsed by the publisher.
References
Banu, S., and Attom, M. (2023). Internal erosion stabilization of cohesionless soil using lime. Water 15, 1992. doi:10.3390/w15111992
Benahmed, N., and Bonelli, S. (2012). Investigating concentrated leak erosion behaviour of cohesive soils by performing hole erosion tests. Eur. J. Environ. Civ. Eng. 16, 43–58. doi:10.1080/19648189.2012.667667
Cai, W., Bora, M. J., Pekkat, S., Bordoloi, S., Garg, A., and Sekharan, S. (2022). A new and simple model for predicting soil erosion based on hole erosion tests. Acta Geophys. 71, 823–836. doi:10.1007/s11600-022-00904-6
Cheng, Y., Tang, R., Fang, J., and Kong, F. (2020). Analysis on spatio-temporal law and causation of urban road collapse in China from 2014 to 2018. Water Resour. Hydropower Eng. 51 (8), 10. doi:10.13928/j.cnki.wrahe.2020.07.014
Cheng, Y.-J., Tang, C.-S., Pan, X.-H., Liu, B., Xie, Y. H., Cheng, Q., et al. (2021). Application of microbial induced carbonate precipitation for loess surface erosion control. Eng. Geol. 294, 106387. doi:10.1016/j.enggeo.2021.106387
Dastpak, P., Sousa, R. L., and Dias, D. (2023). Soil erosion due to defective pipes: a hidden hazard beneath our feet. Sustainability 15, 8931. doi:10.3390/su15118931
Dave, M., and Juneja, A. (2023a). Erosion of soil around damaged buried water pipes—a critical review. Arabian J. Geosciences 16, 317. doi:10.1007/s12517-023-11391-4
Dave, M., and Juneja, A. (2023b). “Sinkholes: trigger, development, and subsidence—a review,” in Soil behavior and characterization of geomaterials, 289–296. doi:10.1007/978-981-19-6513-5_25
Duan, Z., Song, K., Zhang, N., Zheng, L. C., Yan, X. S., and Zhang, M. M. (2024). Characteristics and mechanisms of soil structure damage under salt weathering. Soil Tillage Res. 238, 106030. doi:10.1016/j.still.2024.106030
Duan, Z., Wang, J., Yan, X., Song, K., Zheng, L., and Zhang, M. (2023). Study on the structure and strength characteristics of loess under the action of sodium sulfate. Environ. Sci. Pollut. Res. 30, 125609–125627. doi:10.1007/s11356-023-31038-x
Elandaloussi, R., Bennabi, A., Dupla, J. C., Canou, J., Benamar, A., and Gotteland, P. (2018). Effectiveness of lime treatment of coarse soils against internal erosion. Geotechnical Geol. Eng. 37, 139–154. doi:10.1007/s10706-018-0598-4
Firoozi, A. A., Guney Olgun, C., Firoozi, A. A., and Baghini, M. S. (2017). Fundamentals of soil stabilization. Int. J. Geo-Engineering 8, 26. doi:10.1186/s40703-017-0064-9
Guo, S., Jiang, Y., Tang, Y., Cheng, H., Luo, X., Lv, Y., et al. (2023). Experimental study on the soil erosion through a defective pipe under the cyclic infiltration-exfiltration flow. Transp. Geotech. 42, 101085. doi:10.1016/j.trgeo.2023.101085
Haghighi, I., Chevalier, C., Duc, M., Guédon, S., and Reiffsteck, P. (2013). Improvement of hole erosion test and results on reference soils. J. Geotechnical Geoenvironmental Eng. 139, 330–339. doi:10.1061/(asce)gt.1943-5606.0000747
Hassan, W., Alshameri, B., Maqsood, Z., Haider, A., Jamil, S. M., and Mujtaba, H. (2023). An innovative application of fine marble dust for the construction industry to mitigate the piping, internal erosion and dispersion problems of sodium-rich clays. Constr. Build. Mater. 408, 133834. doi:10.1016/j.conbuildmat.2023.133834
Herrier, G., Bonelli, S., Cornacchioli, F., Nerincx, N., Nicaise, S., and Puiatti, D. (2018). “Erosion resistant dikes thanks to soil treatment with lime,” in 3rd International Conference on Protection against Overtopping, Jun 2018, Grange-over-Sands, United Kingdom, 10. hal-01901804.
Huo, B., Huang, Q., Kang, X., Liu, X., Liu, M., and Peng, J. (2023). Experimental study on the disintegration characteristics of undisturbed loess under rainfall-induced leaching. Catena 233, 107482. doi:10.1016/j.catena.2023.107482
Indraratna, B., Athukorala, R., and Vinod, J. (2013). Estimating the rate of erosion of a silty sand treated with lignosulfonate. J. Geotechnical Geoenvironmental Eng. 139, 701–714. doi:10.1061/(asce)gt.1943-5606.0000766
Indraratna, B., Muttuvel, T., and Khabbaz, H. (2008). Investigating erosional behaviour of chemically stabilised erodible soils. GeoCongress 04, 670–677. doi:10.1061/40971(310)83
Indraratna, B., Muttuvel, T., and Khabbaz, H. (2009). Modelling the erosion rate of chemically stabilized soil incorporating tensile force – deformation characteristics. Can. Geotechnical J. 46, 57–68. doi:10.1139/t08-103
Khabbaz, B. (2008). “Predicting the erosion rate of chemically treated soil using a process simulation apparatus for inte,” in Journal of geotechnical and geoenvironmental engineering. doi:10.1061/(ASCE)1090-0241(2008)134:6(837)
Konstadinou, M., Herrier, G., Stoutjesdijk, T., Losma, F., Zwanenburg, C., and Dobbe, R. (2023). Lime treatment: evaluation for use in dike applications in the Netherlands. J. Mater. Civ. Eng. 35. doi:10.1061/(asce)mt.1943-5533.0004623
Kwon, Y.-M., Moon, J.-H., Cho, G.-C., Kim, Y. U., and Chang, I. (2023). Xanthan gum biopolymer-based soil treatment as a construction material to mitigate internal erosion of earthen embankment: a field-scale. Constr. Build. Mater. 389, 131716. doi:10.1016/j.conbuildmat.2023.131716
Lefebvre, G., Rohan, K., and Milette, J.-P. (1986). Erosivity of intact clay: influence of the natural structure. Can. Geotechnical J. 23, 427–434. doi:10.1139/t86-072
Liang, Y., Yeh, T.-C. J., Ma, C., Zhang, J., Xu, W., Yang, D., et al. (2021). Experimental investigation on hole erosion behaviors of chemical stabilizer treated soil. J. Hydrology 594, 125647. doi:10.1016/j.jhydrol.2020.125647
Liu, S., Zhang, T., and Cai, G. (2018). Research on technology and engineering application of silt subgrade solidified by lignin-based industrial by-product. China J. Highw. Transp. 31, 1–11. doi:10.19721/j.cnki.1001-7372.2018.03.001
Mehenni, A., Cuisinier, O., and Masrouri, F. (2016). Impact of lime, cement, and clay treatments on the internal erosion of compacted soils. J. Mater. Civ. Eng. 28. doi:10.1061/(asce)mt.1943-5533.0001573
Qiu, H., Su, L., Tang, B., Yang, D., Ullah, M., Zhu, Y., et al. (2024). The effect of location and geometric properties of landslides caused by rainstorms and earthquakes. Earth Surf. Process. Landforms 49, 2067–2079. doi:10.1002/esp.5816
Rasika, A., Indraratna, B., and Vinod, J. S. (2013). Modeling the internal erosion behavior of lignosulfonate treated soil. doi:10.1061/9780784412787.188
Reddy, J. J., Varaprasad, B. J. S., and Venkateshwar Reddy, P. (2020). Application of grey taguchi method to optimize the internal erosion parameters of stabilized soil. Multiscale Multidiscip. Model. Exp. Des. 4, 99–108. doi:10.1007/s41939-020-00077-z
Shourijeh, P. T., Soroush, A., and Daneshi-Sadr, A.-H. (2020). The effects of lime, bentonite and nano-clay on erosion characteristics of clay soils. Eur. J. Environ. Civ. Eng. 26, 3762–3787. doi:10.1080/19648189.2020.1818629
Tan, Y., and Long, Y.-Y. (2021). Review of cave-in failures of urban roadways in China: a database. J. Perform. Constr. Facil. 35. doi:10.1061/(asce)cf.1943-5509.0001658
Ta'negonbadi, B., and Noorzad, R. (2017). Stabilization of clayey soil using lignosulfonate. Transp. Geotech. 12, 45–55. doi:10.1016/j.trgeo.2017.08.004
Vakili, A. H., Ghasemi, J., bin Selamat, M. R., Salimi, M., and Farhadi, M. S. (2018). Internal erosional behaviour of dispersive clay stabilized with lignosulfonate and reinforced with polypropylene fiber. Constr. Build. Mater. 193, 405–415. doi:10.1016/j.conbuildmat.2018.10.213
Vinod, J. S., Indraratna, B., and Mahamud, M. A. A. (2010). Stabilisation of an erodible soil using a chemical admixture. Proc. Institution Civ. Eng.–Ground Improv. 163, 43–51. doi:10.1680/grim.2010.163.1.43
Wan, C. F., and Fell, R. (2004a). Investigation of rate of erosion of soils in embankment dams. J. Geotechnical Geoenvironmental Eng. 130, 373–380. doi:10.1061/(ASCE)1090-0241(2004)130:4(373)
Wan, C. F., and Fell, R. (2004b). Laboratory tests on the rate of piping erosion of soils in embankment dams. Geotechnical Test. J. 27, 295–303. doi:10.1520/gtj11903
Wang, X.-W., and Xu, Y.-S. (2022). Investigation on the phenomena and influence factors of urban ground collapse in China. Nat. Hazards 113, 1–33. doi:10.1007/s11069-022-05304-z
Wei, Y., Qiu, H., Liu, Z., Huangfu, W., Zhu, Y., Liu, Y., et al. (2024). Refined and dynamic susceptibility assessment of landslides using insar and machine learning models. Geosci. Front. 15, 101890. doi:10.1016/j.gsf.2024.101890
Xu, P., Zhang, Q., Qian, H., Qu, W., and Li, M. (2021). Microstructure and permeability evolution of remolded loess with different dry densities under saturated seepage. Eng. Geol. 282, 105875. doi:10.1016/j.enggeo.2020.105875
Ye, B., Qiu, H., Tang, B., Liu, Y., Liu, Z., Jiang, X., et al. (2024). Creep deformation monitoring of landslides in a reservoir area. J. Hydrology 632, 130905. doi:10.1016/j.jhydrol.2024.130905
Zhang, T., Jiang, S., Wu, F., Shao, Y., and Chu, S. (2023a). Experimental study of external pipe wall erosion due to water pipe leakage. J. Pipeline Syst. Eng. Pract. 14. doi:10.1061/jpsea2.Pseng-1352
Zhang, X. Y., Ruan, Y. C., Xuan, W. H., Bao, H., and Du, Z. (2023b). Risk assessment and spatial regulation on urban ground collapse based on geo-detector: a case study of hangzhou urban area. Nat. Hazards 118, 525–543. doi:10.1007/s11069-023-06016-8
Keywords: sandy silt, chemical stabilisers, internal erosion, hole erosion test (HET), urban ground collapse (UGC)
Citation: Zhang B, Zhu X, Tao X, Wang M, Asghar A and Mi G (2024) Investigating the internal erosion behavior and microscopic mechanisms of chemically stabilized soil: an experimental study. Front. Earth Sci. 12:1452449. doi: 10.3389/feart.2024.1452449
Received: 20 June 2024; Accepted: 09 August 2024;
Published: 27 August 2024.
Edited by:
Haijun Qiu, Northwest University, ChinaReviewed by:
Zhao Duan, Xi’an University of Science and Technology, ChinaXin Wei, Xi’an Jiaotong University, China
Copyright © 2024 Zhang, Zhu, Tao, Wang, Asghar and Mi. This is an open-access article distributed under the terms of the Creative Commons Attribution License (CC BY). The use, distribution or reproduction in other forums is permitted, provided the original author(s) and the copyright owner(s) are credited and that the original publication in this journal is cited, in accordance with accepted academic practice. No use, distribution or reproduction is permitted which does not comply with these terms.
*Correspondence: Xinghua Zhu, emh1eGluZ2h1YUBjaGQuZWR1LmNu; Xuewen Tao, dGFveHVld2VuMUBnbWFpbC5jb20=