- 1Lanzhou Institute of Seismology, China Earthquake Administration, Lanzhou, China
- 2Gansu Earthquake Agency, Lanzhou, China
A MS6.2 earthquake struck Jishishan Country in Gansu Province on 18 December 2023. The earthquake occurred on the eastern branch of the Northern Lajishan fault (NLJSF) which has never experienced such a violent seismic event in recorded history. In this study, multiple periods of GNSS campaign observation data and continuous observation data are collected to reveal the crustal deformation evolution characteristics of the eastern branch of the NLJSF before the earthquake, focusing on the dynamic behavior of the causative fault, regional strain parameter features, and the variation of GNSS baselines across the NLJSF. Velocity field data show that the differential movement on both sides of the fault zone before the earthquake accumulated energy for the occurrence of the earthquake. Cross-fault profile analyses indicate a noticeable weakening of horizontal shortening on both fault flanks, suggesting a nearing fault lockup. The baseline time series and strain parameter time series results both show that the study area is mainly NEE-trending compression deformation. In addition, before the earthquake, multiple baseline results and strain parameter time series deviated from the linear trend and gradually flattened, indicating a strain accumulation in the study area. The overall crustal deformation evolution shows a relatively high earthquake risk before the Lajishan earthquake.
1 Introduction
On 18 December 2023, a MS6.2 earthquake (hereinafter referred to as the Jishishan earthquake) struck Jishishan County, Gansu Province (35.70°N, 102.79°W), with a focal depth of 10 km. Initial studies following the earthquake primarily concentrated on coseismic slip and identifying the causative structure. However, consensus remains elusive (Yang J. Y. et al, 2024; Li et al., 2024; Liu et al., 2024; Lu et al., 2024). The eastern branch of the Northern Lajishan fault (NLJSF) lies merely 3 km from the epicenter and is widely regarded as the probable causative structure of the Jishishan earthquake (Lu et al., 2024; Tian and Chen, 2024; Yang P. X. et al, 2024; Yang and Su, 2024). The earthquake occurred on the Qilian Block in the northeast of the Qinghai-Xizang Plateau, a region known for its complex geological structure and significant crustal deformation. It is also one of the most tectonically active and earthquake-prone areas on the Qinghai-Xizang Plateau (Zhang et al., 2002). According to historical records, the basins flanking both the northern and southern sides of Lajishan have encountered over 20 moderate earthquakes, each registering approximately magnitude 5. Remarkably, seismic events of magnitude 6 or higher occurred only once, notably the 6.7 magnitude earthquake that occurred in the southwestern region of Kangle, Gansu, in 1936. The tectonic background of the Jishishan earthquake is shown in Figure 1.
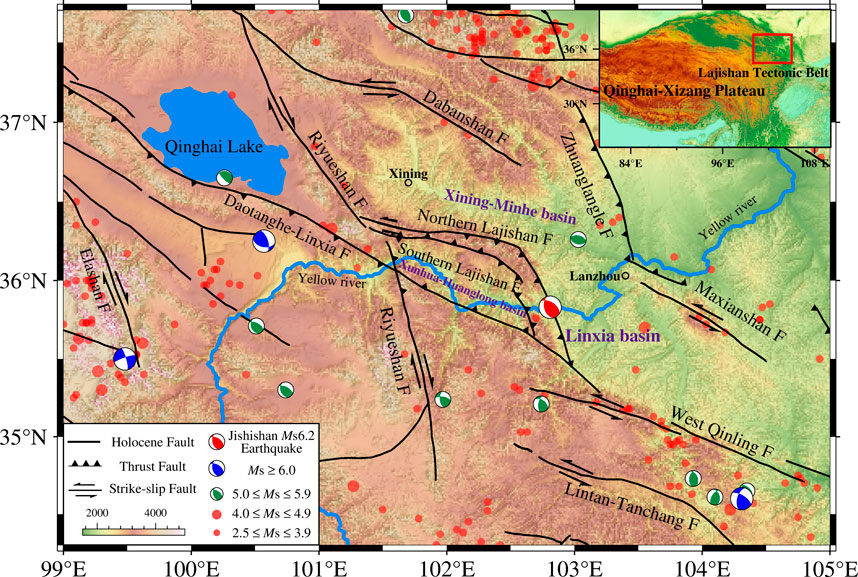
Figure 1. Tectonic background of the Lajishan earthquake. The focal mechanism solution from Global Centroid Moment Tensor database (GCMT), red dots represent historical earthquakes since 1970. The red solid box in the inset figure indicates the location of the study area relative to the Qinghai-Xizang Plateau.
Situated within the Qilian orogenic belt, the Lajishan tectonic belt (LTB) is an ancient geological feature formed during the Caledonian, which has experienced many episodes of strong tectonism (Wang et al., 2000; Lease et al., 2011; Lease et al., 2012; Yuan et al., 2013). The LTB is composed of two NE trending arc-shaped thrust structures, with the southern fault spanning approximately 220 km and the northern fault approximately 230 km. The overall orientation of the section is southwest, with a dip angle ranging between 45° and 55°. Due to the India-Eurasia collision, the northeastern margin of the Qinghai-Xizang Plateau has been in a state of compression for a long time (Molnar and Tapponnier, 1975; Tapponnier and Molnar, 1977). Several faults and basins emerged in the Qilian orogenic belt, such as the West Qinling fault, Lintan-Tanchang fault, Riyueshan fault, and Daotanghe-Linxia fault, as well as the following basins: Xining-Minhe basin, Xunhua-Huanglong basin, and Linxia basin. The Lajishan fault zone plays an important role in the Qilian orogenic belt. On one front, it delineates the boundary of several late Cenozoic graben basins, such as the Xining-Minhe basin to the north, the Xunhua-Hualong basin to the south, and the Linxi basin to the east. Simultaneously, it accommodates the structural transformation deformation associated with the interaction between the NNW-trending right-lateral Riyueshan fault and the NWW-trending left-lateral West Qinling fault, playing an important role in transmitting NE-trending stress within the Qinghai-Xizang Plateau. Yuan et al. (2005) suggests that due to the unique compression structures in the region, stress tends to concentrate and release easily, resulting in frequent small earthquakes and rare large ones. However, the region still maintains the structural conditions to trigger moderate or strong earthquakes. Satellite image analysis and field geological and geomorphological investigations reveal that the slip rate of the fault since the mid-to-late Holocene has been approximately 0.51 mm/year (Li et al., 2009). Geological timescales are vast while geodetic rates reflect movements over recent years or decades. Zhuang et al. (2023) obtained the slip rate of the Lajishan fault using GNSS data. It’s 0.3 ± 0.2 mm/year. Given the non-linear nature of geological processes and potential short-term influences, Zhuang et al. (2023) consider the 0.3 mm/year result to be unusually low and suggest that it may be related to fault locking. Therefore, the long-term slip rate for the region is estimated to be around 0.5 mm/year. The long-term vertical crustal movement trend obtained by Hao et al. (2014) using leveling data and GNSS data shows the uplift movement around the LTB. Zhao et al. (2022) integrated the latest and previous observation data to investigate the three-dimensional deep electrical structure of the entire LTB area. They found that the LTB is an important physical boundary zone separating a high-resistivity body to the north from a deep high-conductivity layer in the middle-lower crust to the south. The high-resistivity body on the northern side of the LTB blocks the northeastern extension of the high-conductivity layer in the middle and lower crust in the southern area, resulting in active orogenic and seismic activity.
Global Navigation Satellite Systems (GNSS) technology is widely used in many fields such as geodesy and geodynamics due to its high resolution, wide range, and all-weather characteristics. Its utilization has led to groundbreaking insights into numerous geophysical phenomena that would otherwise remain elusive, including regional crustal movement and tectonic deformation characteristics, fault zone deformation characteristics, regional stress and strain characteristics, and micro-dynamics of crustal movement, etc. (Li et al., 2003a; Li et al., 2003b; Gan et al., 2007; Du et al., 2018; Zhao et al., 2012; Deng et al., 2014; Liu et al., 2014). The northeast margin of the Qinghai-Xizang Plateau has attracted much attention due to complex geological conditions and strong tectonic activity. Wang et al. (2001) proposed the first relatively comprehensive velocity field with using 354 GPS stations. The results show that there is an obvious shortening in the interior of the Qinghai-Xizang Plateau, and the Qaidam Basin and Qilian Mountains on the northeastern margin of the Qinghai-Xizang Plateau accommodates the India-Eurasia collision at a rate of 10 mm/a, showing strong activity. Relative to the stable Eurasian plate, the entire northeastern margin of the Qinghai-Xizang Plateau rotates clockwise, transforming the NE-trending movement into SE-trending movement, resulting in the accumulation of strain in Liupanshan and Longmenshan, and this process is achieved through the WNW-trending left-lateral strike fault and the NNW-trending right-lateral strike fault (Wang et al., 2017). The active structures in the northeastern margin of the Qinghai-Xizang Plateau can be divided into three basic types: the NWW-trending main boundary left-lateral shear tectonic belt, the intra-block secondary right-lateral shear tectonic belt, and the compression convergence tectonic belt. Under the action of NE-trending regional tectonic stress, a series of complex tectonic deformation occurs in the crust, such as NE-trending compression shortening, clockwise rotation, and extrusion in the SEE direction. Nowadays, the northeastern margin of the Qinghai-Xizang Plateau has become the frontier area and sensitive part of the tectonic deformation on the plateau, accommodating and regulating the push and convergence of the Indian plate to the Eurasian plate in the direction of the NNE, and is still subjected to strong tectonization (Yuan et al., 2013; Liu et al., 2014; Wang and Shen, 2020).
The essential process of earthquake generation and occurrence involves the accumulation of strain through crustal movements. The release of accumulated strain energy will result in regional crustal rupture known as earthquakes.(Scholz, 1998; 2002; Zhang et al., 2013). Small earthquakes may occur every few decades or hundreds of years, while large earthquakes may occur for thousands of years, depending on the tectonic setting. However, there is limited documented seismic data available to study the recurrence cycles of earthquakes comprehensively. With the development of geodetic techniques such as GNSS and other geophysical observation techniques, the extent of strain accumulation can be quantified by using GNSS and other geophysical techniques to monitor small changes in the Earth’s crust. This kind of data can help researchers determine which regions are experiencing the greatest strain accumulation and are likely to be the key area for future seismic activity. Previous studies have suggested that the region should be characterized by frequent occurrence of small earthquakes and scarcity of large earthquakes (Yuan et al., 2013). However, an MS6.2 earthquake ruptured. It remains unknown whether the earthquake is associated with any changes in the LTB area’s activity. Furthermore, as the epicenter located in the transitional area between the Qinghai-Xizang Plateau and the Loess Plateau, the earthquake triggered extensive liquefaction and landslides, leading to severe loss of life and property damage. In total, 772,000 individuals in Gansu and Qinghai provinces were impacted by the disaster, with 151 fatalities and 983 injuries reported. The event led to the collapse of 70,000 homes, severe damage to 99,000 residences, and general damage to 252,000 structures. The direct economic losses amounted to 14.612 billion yuan. Therefore, it is essential to study the underlying causes of the earthquake and investigate the mechanisms and dynamics of regional tectonic deformations. This study will utilize GNSS observation data to analyze the overall characteristics of regional crustal movement and the deformation evolution characteristics of the LTB before the earthquake rupture. It aims to enhance the understanding of the regional tectonic environment and the laws of strong seismic activity and provide a basis for the judgment of future strong seismic activity risk areas in the region.
2 Data
The millimeter-sized relative precision can be obtained by using GNSS Carrier Phase Measurement for static relative positioning. GNSS measurements are the basic method used in high-precision geodesy at present. GNSS observation can be divided into continuous observation and campaign observation according to the observation mode. Continuous observation installs GNSS equipment on the permanent ground station for long-term continuous monitoring, while campaign observation periodically sets up GNSS equipment on the permanent ground station to conduct periodic observations. Each observation phase is generally 96 h, with observation intervals longer than 1 year. The data collected from continuous observation is continuously stored in the receiver storage device or transmitted back to the data center over a private network to produce GNSS time series results. The main output of campaign observation is GNSS velocity field results. In crustal deformation research, the high spatial resolution ensured by the campaign observation mode compensates for the spatial resolution limitations inherent in the continuous observation mode. Furthermore, the high temporal resolution provided by the continuous observation mode can reflect the temporal dynamic process of crustal deformation objectively (Zhang et al., 2011; Ma et al., 2018).
The GNSS velocity field data used in this paper are from Wang and Shen (2020). The velocity field results comprise GNSS data collected from both Crustal Movement Observation Network of China (CMONOC) I and II, supplemented by additional data from densified regional campaign GNSS networks and regional continuous GNSS sites within seismically active regions. This study uses GAMIT (Herring et al., 2010a) to process or reprocess all GNSS raw data. In addition, the velocity field data processing incorporates around 100 International GPS Service (IGS) sites distributed globally. Ultimately, the results from the same day are amalgamated using GLOBK (Herring et al., 2010a).
To enhance the understanding of the dynamic crustal deformation preceding the Jishishan earthquake, this study focuses on 15 GNSS continuous stations from CMONOC-I to analyze site displacement and baseline variations. The GNSS continuous data used in this paper is processed by GAMIT/GLOBK and QOCA software (Dong et al., 1998; Herring et al., 2010b; Zhao et al., 2021). This procedure is supplemented by the site coordinate time series results of the ITRF2014 reference frame processed by IGS stations around China Mainland (Liang et al., 2021). GNSS single time series are all the results after removing the period, correcting the earthquake events, replacing the instruments, and the step caused by unknown reasons, as the series are susceptible to various influences. The computation methods refer to Liang et al. and Nikolaidis (Nikolaidis, 2002; Liang et al., 2021).
3 Result
3.1 Analysis of GNSS campaign observation data
The velocity field can intuitively show the motion state of the block. In this paper, velocity field data spanning from 2017 to 2021 and from 2021 to 2023 are used to reveal the movement status of the study area in recent years. Velocity fields have been converted to results relative to the South China block through Euler rotation (Figure 2). Both velocity fields clearly show that in the continuous northward pushing of the Indian plate, the horizontal motion of the eastern Qinghai-Xizang Plateau is characterized by continuous changes. The predominant movement trend within the region is northeastward. Due to the blocking of the three rigid blocks of the Alxa block, Ordos block, and South China block, the overall movement rate of the eastern Qinghai-Xizang Plateau gradually decreases from south to north accompanied by a change in the direction of movement towards the east and southeast. Essentially, the obstruction by these three rigid blocks induces a clockwise rotation movement along the eastern margin of the Qinghai-Xizang Plateau relative to the South China block.
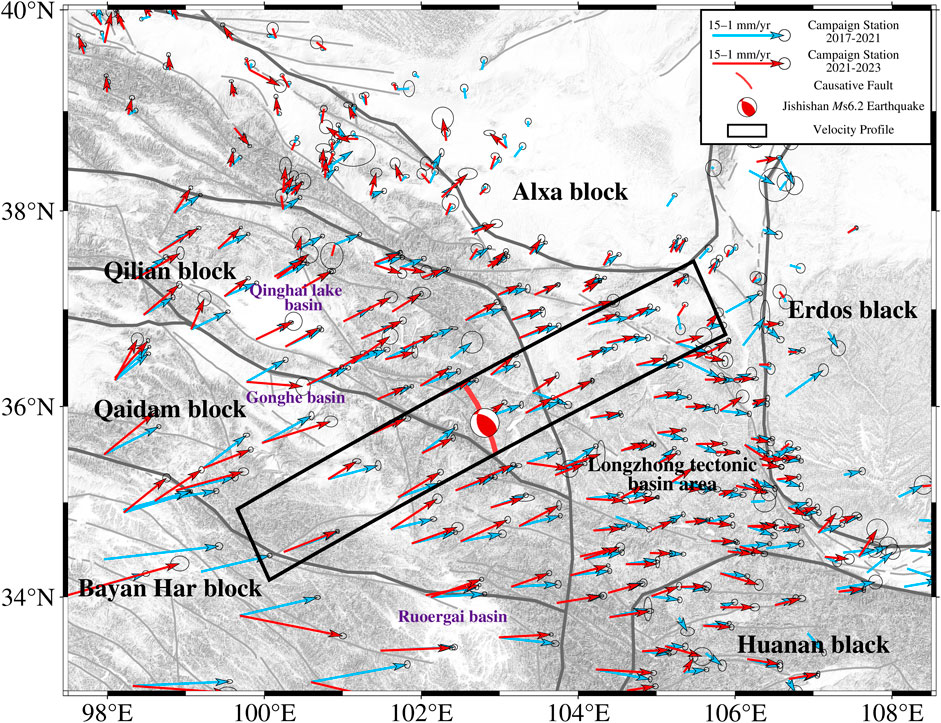
Figure 2. The horizontal GNSS velocities of crustal motion around the northeastern edge of the Qinghai-Xizang plateau relative to the South China block, the blue velocity vector represents the velocity field in 2017–2021, and the red velocity vector represents the velocity field in 2021–2023. The light black ellipse at the tip of each velocity vector is 95% confidence. The dark gray solid lines are the boundary of the blocks (Zhang et al., 2003), and the light gray solid lines indicate active faults in the Holocene (Deng et al., 2002). The red beachball is the focal mechanism of the Jishishan earthquake, red line shows the causative fault. The black quadrilateral frame represents the cross-fault velocity profile.
The comparison of the results during 2017–2021 and 2021–2023 reveals that the overall crustal movement in the eastern part of the Qinghai-Xizang Plateau shows a northward deflection. In the central and western part of the suture zone between Qilian block and Alxa block, the velocity field during 2021–2023 shows a movement to the north, while a northeastward movement was observed during 2017–2021. In the Qilian block, the central and western Qaidam block as well as the majority of the northern part of the Longzhong Basin tectonic area, crustal movement during 2021–2023 shows a slightly northward trend contrasting with the NE-trending or NEE-trending movement observed during 2017–2021. Similar northward deflection also occurred in the eastern Qaidam Block as well as the central and southern parts of the Longzhong Basin tectonic area, where crustal movement shifted from E-trending to NEE-trending or from SE-trending to E-trending. In addition, the comparison also presents the variations in the rate of crustal movement. The crustal movement rate of the Longzhong Basin tectonic zone has slowed down compared with 2017–2021. In the central and western parts of the Qaidam block, the velocity field rate during 2021–2023 is slightly greater than that during 2017–2021. Furthermore, distinct movements are observed on both sides of the eastern branch of the NLJSF. Comparing the periods of 2021–2023 with 2017–2021, crustal movement on the northeast side of the fault presents a notable counterclockwise rotation while a clockwise rotation on the southwest side. Additionally, the crustal movement rate of both sides of the fault slows down significantly. These differential crustal movements on both sides of the fault zone have contributed to the accumulation of strain energy for the Jishishan earthquake (Jiang et al., 2007).
Based on the above velocity field, the strain rate field in the study area before Jishishan earthquake is obtained by using the least square method (Jiang and Liu, 2010; Wu et al., 2009). The results of the principal pressure strain rate in the period 2017-2021 and 2021-2023 are −1.49 × 10⁻⁸/a and −1.94 × 10⁻⁸/a, respectively. The compressive strain rate in the source area is enhanced and there is compressive strain accumulation. The epicenter area shows an increased compressive strain rate, indicating the accumulation of compressive strain.
Figures 3A, B show the surface strain rate field of the velocity field during 2017–2021 and 2021-2023 respectively. Positive values indicates tension, negative values indicates compression. Both results show the compression background of the northeast margin region of the Qinghai-Xizang Plateau. I Figure 3B shows the most advanced region of the northeast margin of the Qinghai-Xizang Plateau is in the compression region, and the compressive strain is enhanced compared with Figure 3A.
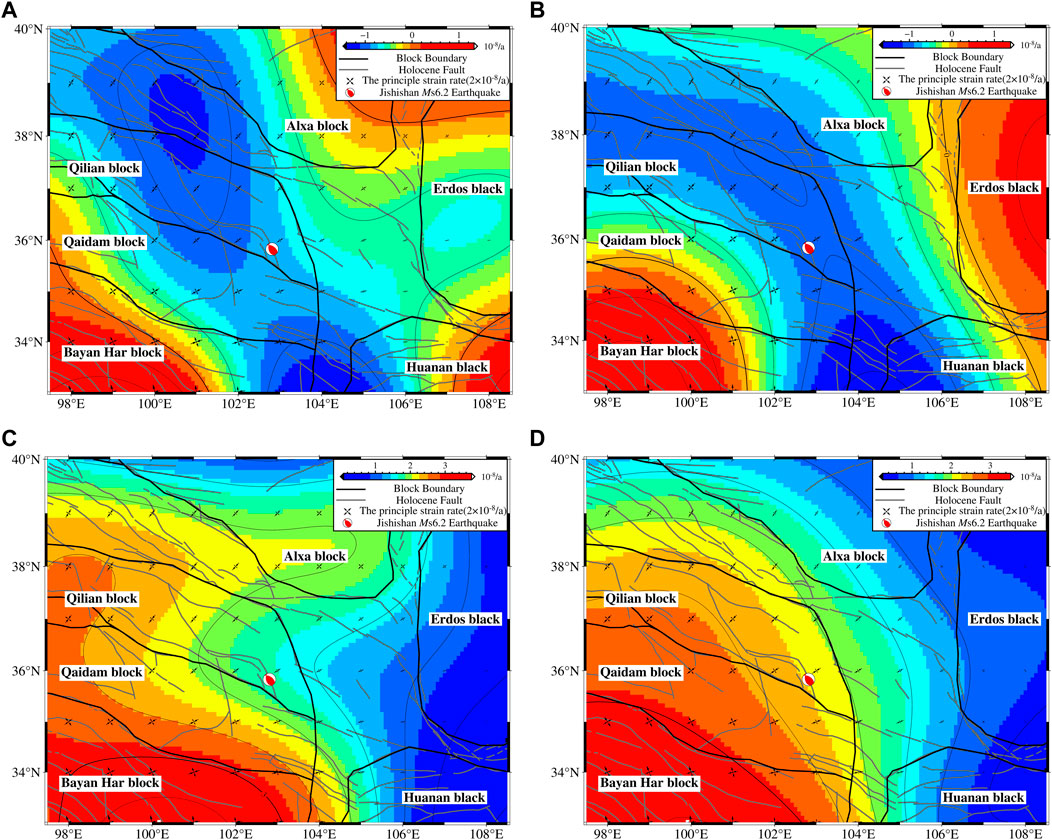
Figure 3. GNSS strain rate field derived from the velocity field in Figure 2. (A) the surface strain rate field derived from the velocity field 2017–2021, (B) the surface strain rate field derived from the velocity field 2021–2023, (C) the second strain rate invariant derived from the velocity field 2017-2021, (D) the second strain rate invariant derived from the velocity field 2021–2023.
The second strain rate invariant represents the total deformation in the study area. Unlike the maximum shear strain rate and the surface strain rate, the principal tensile strain rate and the principal compressive strain rate do not cancel each other out due to their differing signs. The formula for the second strain rate invariant is defined as:
In this formula, εφ represents the east-west strain, ελ represents the north-south strain, ελφ represents the shear strain.
Figures 3C, D show the second strain rate invariant derived from the velocity field during 2017–2021 and 2021-2023 respectively. Compared with the results of those two periods, the value of the second strain rate invariant increases somewhat and shifts from the low value region to the transition zone from the high value region to the low value region. The position of Jishishan earthquake in the second strain rate invariant aligns with most magnitude 6 earthquakes in history (Wu et al., 2021; Donglioni et al., 2015).
The differential crustal movements on both sides of the eastern branch of the NLJSF have accumulated energy for the Jishishan earthquake. In order to investigate the characteristics of compression and shear strain accumulation in the focal area of the Jishishan earthquake, the analysis results of the profile across causative fault based on the velocity field results during 2009–2015, 2015-2021 and 2021-2023 are given below (Figure 4). The left and right panels are fault-parallel (extensional positive) and fault-normal (shortening positive) components respectively. From top to bottom are the GNSS velocity filed during 2009–2015, 2015-2021, and 20221-2023, respectively.
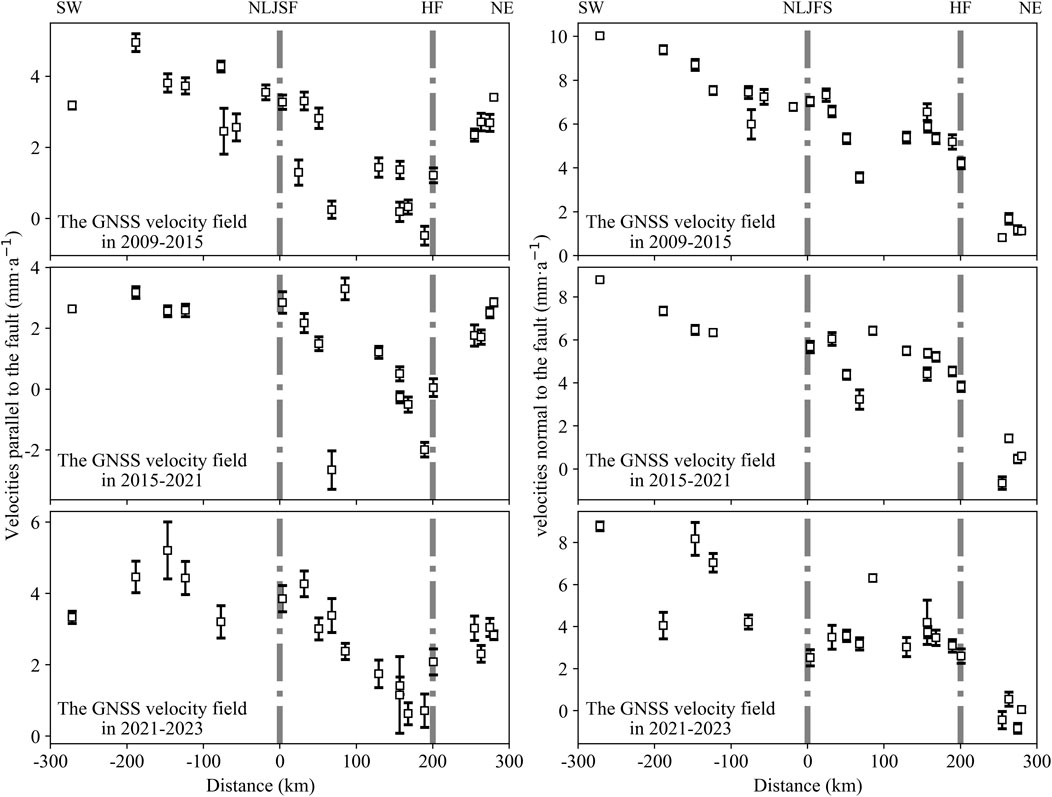
Figure 4. GNSS velocity profiles across the eastern branch of the Northern Lajishan fault. The range of profile refers to Figure 2. The left and right panels are fault-parallel (extensional positive) and fault-normal (shortening positive) components respectively. Gray dashed lines denote the locations of major faults on the profiles. From top to bottom are the GNSS velocity fields during 2009–2015, 2015–2021, and 20221-2023, respectively. Fault name abbreviations are as follows: NLJSF, the Northern Lajishan Fault; HF, the Haiyuan Fault.
On the northeast side of the eastern branch of the NLJSF, significant crustal compression and shear deformation are observed. The velocity component parallel to the NLJSF indicates predominant right-lateral shear deformation along the fault. Within 200 km northeast of the fault zone, the right-lateral shear deformation rate decreases from 4.84 mm/a in the 2015–2021 results to 3.15 mm/a in the 2021-2023 results. In addition, the velocity component perpendicular to the fault zone shows that the fault is mainly compressed. The horizontal shortening rate within 100 km of the northeast side of the fault zone is gradually decreasing, from 3.75 mm/a in 2009–2015 to 2.80 mm/a in 2015–2021. However, the deformation rate of the latest 2021–2023 results is 0.32 mm/a, indicating a strong strain accumulation.
3.2 Analysis of GNSS cross-fault baseline time series
Calculating the baseline time series between two stations in a unified reference frame is manageable. Since the variations in baseline length between two GNSS stations are theoretically only influenced by the scale factor of the observation system, the high precision of scale factor determination in the precise solutions of global reference frames greatly benefits baseline time series analysis. The analysis results can objectively and directly reflect the dynamic fluctuations in the relative movement between two GNSS stations, offering a direct method to extract micro-dynamic information on crustal movement. In this paper, a total of 27 baselines were obtained based on the data from 15 continuous stations around the LTB. The GNSS baseline length variations and distributions from 2016 to the earthquake are shown in Figures 5, 6, respectively. Specifically, the four baselines (QHME-GSMA, QHME-GSMX, QHME-GSLX, and QHME-GSDX) connected to the QHME station showed a linear elongation trend prior to the 2022 Menyuan MS6.4 earthquake, with movement rates ranging from 0.54 to 1.27 mm/year. After the earthquake, due to coseismic deformation and post-seismic adjustment, the multiyear average rates calculated for the four baselines indicated a shortening change. However, the study area is still dominated by slow elongation in the NW-trending. Together, the baseline results used in this paper have already removed the impact of the Menyuan earthquake.
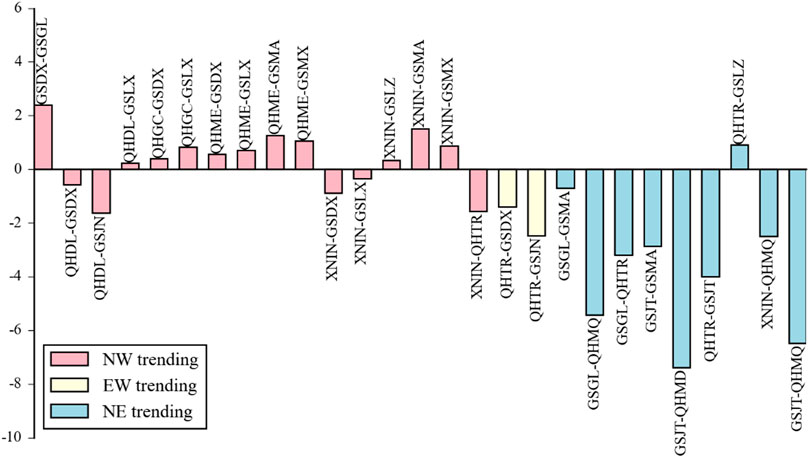
Figure 5. GNSS baseline length variation around the Lajishan Tectonic Belt. Positive values represent baseline extension, negative values represent baseline shortening. Color represents the trend of the fault.
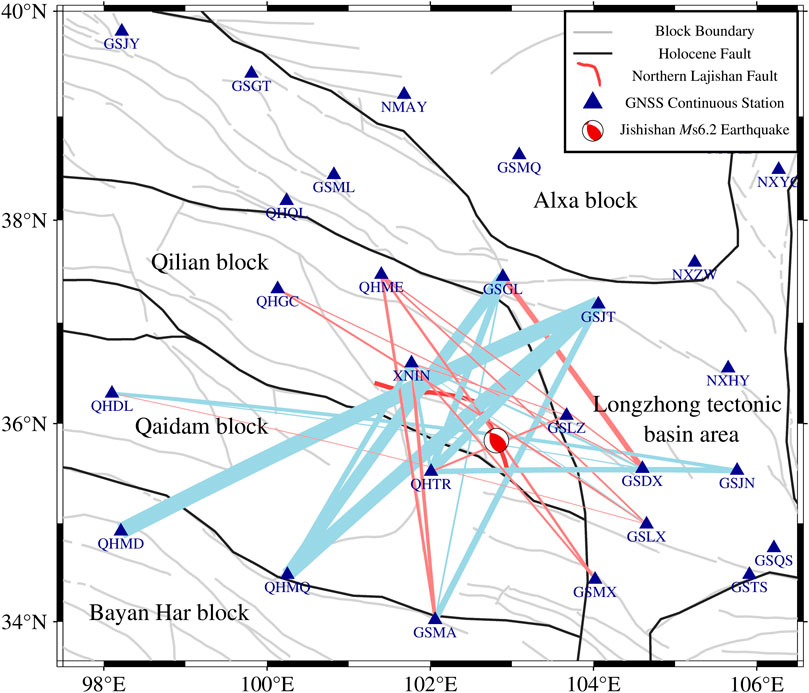
Figure 6. GNSS baseline distribution around the Lajishan Tectonic Belt. Deep blue triangles represent continuous GNSS stations, red beachball is the focal mechanism of Jishishan earthquake, black lines are the boundary lines of the blocks, the red line marks the causative fault of this earthquake. The light red lines represent baseline extension, light blue lines represent baseline shortening. The width of a line indicates the rate of extension or shortening, with the wider the line, the faster rate.
Figure 5 clearly shows that the overall baseline around the Jishishan earthquake is shortened in the NE-trending and elongated in the NW-trending. In addition, the NE-trending shortening rate is much greater than the NW-trending elongation rate.
Figure 6 intuitively shows the spatial distribution of GNSS baseline length variations around the epicenter. The light red line indicates baseline extension, and light blue line indicates baseline shortening, and the thickness of the line segment indicates the magnitude of baseline stretching deformation. The same conclusion can be obtained as in Figure 5: the baseline lengthens in the NE direction, and shorts in the NW direction. Furthermore, the baseline extending from northeast to southwest, connected to the same station and with similar lengths, consistently shows higher shortening rates when the baseline is inclined more toward the east direction. For instance, QHMQ-GSJT shortens at 6.48 mm/a compared to QHMQ-GSGL at 5.43 mm/a, QHTR-GSJT at 4.01 mm/a exceeds QHTR-GSGL at 3.19 mm/a and GSMA-GSJT at 2.82 mm/a surpasses GSMA-GSGL at 0.7 mm/a. This result indicates a predominant compression direction may be inclined more toward the east on the NLJSF.
The baselines (XNIN-GSMA, XNIN-GSMX, GSGL-QHMQ, and GSJT-QHTR) across causative fault before the Jishishan earthquake show significant anomalies deviating from the linear trend (Figure 7). The NE-SW spread baselines GSGL-QHMQ and GSJT-QHTR reflect compressions in localized regions under the northward thrust of the Indian plate. Among them, the baseline GSGL-QHMQ across the western segment of the NLJSF while the baseline GSJT-QHTR across the eastern segment of the NLJSF. The baseline GSGL-QHMQ is steadily shortened at a rate of 6.0 mm/a until May 2022. After a phase step, the baseline deviates from the normal steady state linear trend. Then the baseline shortening rate was reduced to 3.78 mm/a. The baseline GSJT-QHTR shortened at a rate of 5.63 mm/a before 2019, then began to show irregular fluctuations. The baseline no longer shows a clear linear shortening trend and the rate is reduced to 2.43 mm/a.
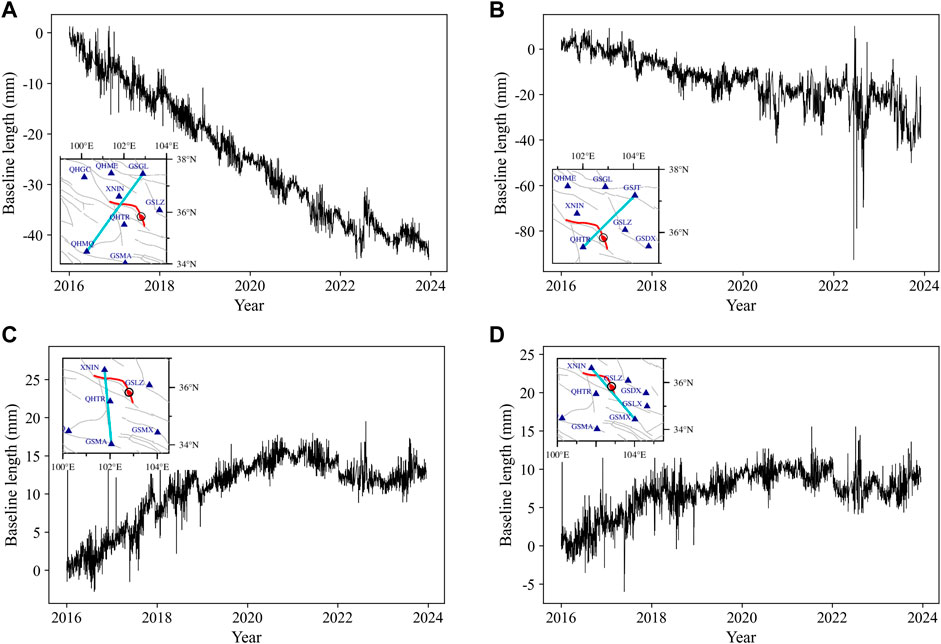
Figure 7. The GNSS baseline time series variations across the Lajishan Tectonic Belt. (A) the GSGL-QHMQ baseline, (B) the GSJT-QHTR baseline, (C) the XNIN-GSMA baseline, (D) the XNIN-GSMX baseline. Blue lines in the insert figures mark the spatial position of the baseline time series, deep blue triangles indicate continuous GNSS stations, red beachball is the focal mechanism of the earthquake, and red line shows the causative fault of the earthquake.
The GSMA station and the GSMX station are located in the Bayan Har block and Longzhong tectonic basin, respectively. However, the XNIN-GSMA and XNIN-GSMX have similar movement trends with a stable extension. The elongation result is consistent with the causative fault’s properties of right-lateral strike-slip. The two baselines extended at a steady rate from 2016 to 2018, then the elongation rate began to slow down in the following 3 years. After 2021, the movement trend of these two baselines flattens. In addition, the phase step change of the baseline on 8 January 2022, is the coseismic deformation caused by the 2022, Menyuan earthquake.
The baseline GSGL-QHMQ, GSJT-QHTR, XNIN-GSMA, and XNIN-GSMX all deviated from the original linear trend before the Jishishan earthquake, indicating a strain accumulation on the NLJSF before the earthquake rupture.
3.3 Analysis of regional strain parameter time series
Continuous observation data from three or more GNSS base stations can reveal strain distribution within the confined area bounded by these stations. The spherical element uniform strain model helps to calculate the time series of each strain parameter (Li et al., 2003b; Jiang et al., 2003). Melchier (1978) and Savage et al. (2001) mentioned the differential expression of spherical displacement and strain, as shown in Formula 1. In the equations, φ is latitude, λ is longitude, and R is the average radius of the earth. The strain rates εφ, ελ, and ελφ can be calculated using Formula 1 for the relation between GNSS strain rate established using the least-squares collocation method. Additional strain rate components are calculated using Formula 2 (Wu et al., 2015). Where ε1 is the principal tensile strain rate, ε2 is the principal compressive strain rate, γmax is the maximum shear strain rate, γ1 is the first shear strain rate, γ2 is the second shear strain rate. Δ is the plane strain rate, and τ2inv is the second strain rate invariant.
Figure 8 shows the time series of strain parameters derived from data at four reference stations: XNIN, QHTR, GSLZ, and GSGL. Figure 8A shows the time series of principal compressive strain parameter. The average annual compressive strain rate in this region is −2.3 × 10⁻⁸/a in the northeast direction. Since 2021, the principal compressive strain rate decreased significantly, and the principal compressive strain parameter curve no longer exhibits a linear trend. Figure 8B shows the time series of surface strain parameter. The average annual surface compression rate is 1.71 × 10⁻⁸/a, indicating this region with a compressed background. The surface strain parameter curve and the principal compressive strain parameter curve both show similar trend of change, initially decreasing linearly before slowing down significantly. However, the surface compression rate is lower than the principal compressive strain rate, indicating a NW-trending tension besides the dominant NE-trend compression in the region. The result is consistent with the baseline time series analysis, indicating a compressive strain accumulation in this area before the Jishishan earthquake. Figure 8C shows the variation of the second shear strain parameter, reflecting the E-W and N-S shear deformation. The negative value of the second shear strain rate indicates that the fault is dominated by nearly E-W and nearly N-S right-lateral shear deformation. The Jishishan earthquake occurred on the eastern branch of the NLJSF, which is nearly N-S. Together, the shear strain in this area is mainly right-lateral shear. Figure 8D is the variation of the maximum shear strain parameter. The average annual maximum shear strain is 2.89 × 10⁻⁸/a. The linear trend of the maximum shear strain parameter and the second shear strain parameter has deviated since 2021, with the linear trend flattened, indicating a shear strain accumulation in this region before the earthquake.
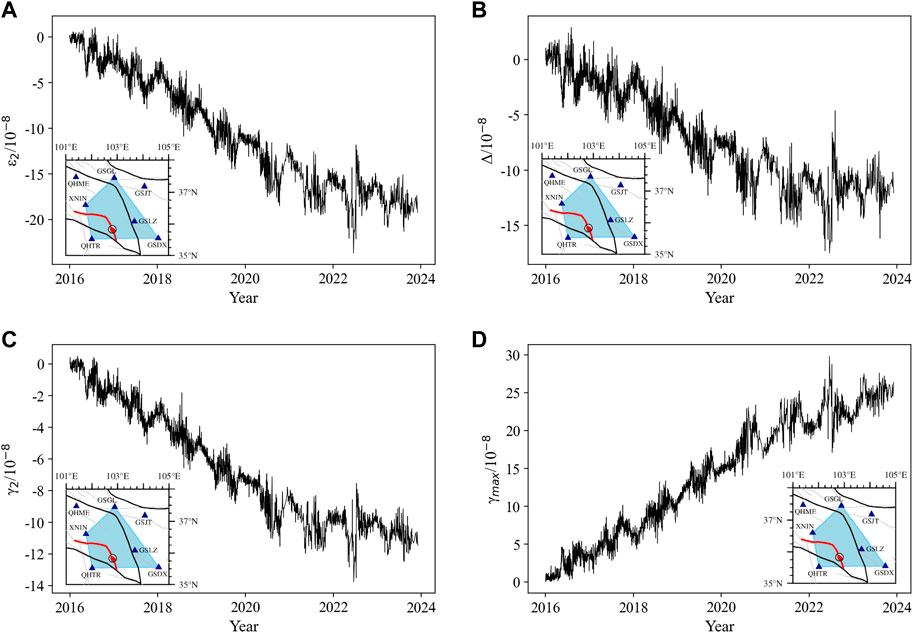
Figure 8. The time-series of the strain parameters in the epicenter of the Jishishan earthquake. (A) Principal compressive stress component in the region enclosed by stations GSGL-XNIN-QHTR-GSDX, (B) Plane strain components in the region enclosed by stations GSGL-XNIN-QHTR-GSDX, (C) Second shear stress component in the region enclosed by stations GSGL-XNIN-QHTR-GSDX, (D) Maximum shear stress component in the region enclosed by stations GSGL-XNIN-QHTR-GSDX. The blue shaded in the insert figures mark the spatial position of the strain parameters time series, deep blue triangles represent continuous GNSS stations, the red beachball is the focal mechanism of the earthquake, and the red line shows the causative fault of the earthquake.
4 Discussion
4.1 Pre-seismic anomaly
Based on the results of GNSS cross-fault profiles, baseline time series, and regional strain parameter time series, the Jishishan earthquake was a medium intensity event, featuring a slight right-lateral strike-slip component and predominantly thrust motion under the background of regional NE-trending compression. The velocity field results revealed significant differential movement on both sides of the causative fault before the earthquake, providing favorable conditions for energy accumulation leading to the event. The cross-fault velocity profile indicates a deceleration and eventual locking of horizontal shortening movement near the fault zone preceding the earthquake. According to elastic rebound theory, such relative movement along the fault zone accumulated strain energy on and near the fault plane. Additionally, 1.5–3 years before the earthquake, several baseline time series and strain parameter time series show deviations from their original linear trends, manifesting a slowdown or pause in elongation or shortening rates, indicating significant strain accumulation. Similar phenomena have preceded numerous major earthquakes in the past. For instance, a locked state was observed in the velocity profiles of the Longmenshan fault before the 2008 Wenchuan MS8.0 earthquake (Du et al., 2009), multiple baselines deviated from their linear trends before the 2011 Japan MS9.0 earthquake (Zhang et al., 2011), and high strain accumulation was detected in the near field area preceding the 2013 Lushan MS7.0 earthquake (Liu et al., 2015). The collective evidence in this paper suggests a significant accumulation of stress and strain in the area before the earthquake, indicative of high seismic risk.
4.2 Dynamic background of the study area
The GNSS velocity field (Figure 2) shows the motion status of the eastern Tibetan Plateau, revealing a predominant horizontal advancement towards the northeast. The motion rate in the western region notably exceeds that in the east. Upon comparing velocity field data during 2017–2021 and 2021–2023, a northward deflection in horizontal movement was observed in the area, particularly pronounced in the Qilian-Qaidam active block. This observation may be linked to the intensified northward movement of the Qinghai-Xizang Plateau (Zheng et al., 2017; Wang and Shen, 2020).
The similar regularity observed in three sets of baselines-QHMQ-GSJT and QHMQ-GSGL, QHTR-GSJT and QHTR-GSGL, as well as GSMA-GSJT and GSMA-GSGL—where baselines of similar length, connected to the same stations, and inclined more towards the east direction, demonstrate higher rates of shortening. This regularity suggests a compression direction in the region oriented NEE. However, since aside from the shared station, the other two stations linked to each set of baselines are the GSJT station and the GSGL station, thus the possibility of systematic differences stemming from variations in the two individual stations cannot be excluded. To ensure the reliability of the findings, it is imperative to conduct a single station time series analysis as well (Figure 9). The three components (N-trending movement, E-trending movement, and Uplift movement) of the GSJT and GSGL stations have maintained relatively consistent linear trends over many years. Specifically, the northward components of the two stations exhibited a reversal in motion approximately 6 months before the Jishishan earthquake. However, the magnitude of this anomaly was not sufficient to significantly affect the multiyear average motion rates of the baselines. Therefore, this conclusion from the two stations is reasonable and reliable. The shortening rate of baseline QHMD-GSJT (direction N65°E) is notably significant. In general, its direction should be the dominant direction of regional compression. However, due to the location of the QHMD station, the shortening rate of baseline QHMD-GSJT must include the coseismic deformation and post-seismic adjustments following the 2021 Madou MS7.4 earthquake. Thus, the shortening rate of baseline QHMD-GSJT is exaggerated, and the direction is also suspect. It is concluded that the primary compression direction in the study area is NEE trending.
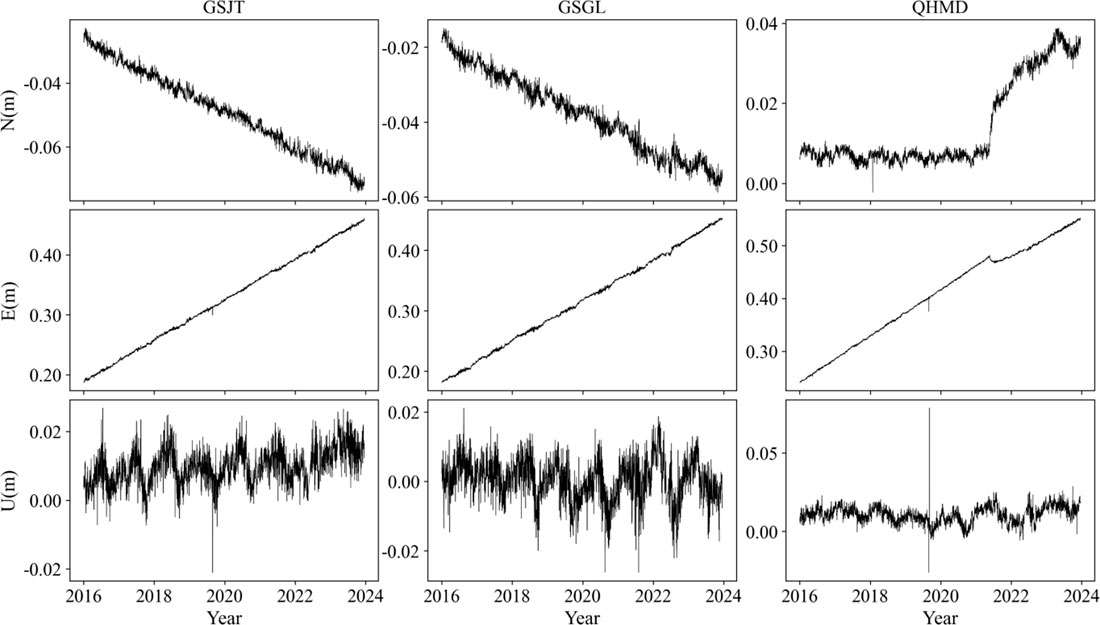
Figure 9. GNSS continuous station time series, from left panels to right panels are GSJT, GSGL and QHMD components respectively, from top to bottom are the N-trending movement component, E-trending movement component and uplift movement component respectively.
Under the background of the stronger northward thrust of the Qinghai–Xizang Plateau, the continuous deformation transmitted to the Qilian-Qaidam active block is more intense. The compression in the NEE direction, the rotation and extrusion of the Xining block within the study area, and the structural transition between the NNW-trending Riyueshan fault and the NWW-trending West Qinling fault contribute to a more complex regional tectonic pattern. However, this pattern also creates favorable conditions for seismic activity.
5 Conclusion
Through the analysis of the GNSS deformation field and GNSS continuous observation data before the Jishishan earthquake, the following understandings can be obtained:
(1) GNSS velocity field data show obvious different movements on both sides of the causative fault before the Jishishan earthquake, coupled with a notable level of strain accumulation. Furthermore, the cross-fault profile reveals nearly complete locking of the fault preceding the earthquake, fostering conditions conducive to seismic activity and indicating an overall heightened earthquake risk.
(2) GNSS baseline time series results show the predominant NEE-trending compression in the region. Approximately 1–1.5 years preceding the earthquake, several baselines began to deviate from the original linear trend, manifested as a slowdown or pause in elongation or shortening rates, showing strong strain accumulation, indicating the gradual enhancement of earthquake risk.
(3) The strain parameter time series results show prevalent compression deformation in the region, characterized by a high background strain accumulation rate, predominantly oriented towards NEE compression. Additionally, shear deformation near the fault zone is primarily characterized by right-lateral shear deformation in the nearly N-S direction, accompanied by shear strain accumulation.
Considering the structural background of the region and our research results, the Jishishan earthquake may represent the maximum seismogenic potential of the Northern Lajishan fault. The LTB area is a tectonic transition region. This unique position facilitates the accumulation and dissipation of stress, leading to a higher frequency of small earthquakes and a lower occurrence of large seismic events in the region. Based on this characteristic, the MS 6.2 earthquake was more severe than expected. Our findings indicate that the region started accumulating energy 1–1.5 years prior to the earthquake. This energy accumulation was not sufficiently relieved through smaller seismic activities, ultimately culminating in a more significant seismic event.
Data availability statement
The original contributions presented in the study are included in the article/supplementary material, further inquiries can be directed to the corresponding author.
Author contributions
JL: Visualization, Writing–original draft, Writing–review and editing. HM: Data curation, Methodology, Writing–review and editing. JF: Supervision, Writing–review and editing. ML: Formal Analysis, Writing–review and editing. JZ: Formal Analysis, Writing–review and editing.
Funding
The author(s) declare that financial support was received for the research, authorship, and/or publication of this article. This work was funded by grants from the Special Fund for Innovation Team, Gansu Earthquake Agency (Grant No. 2020TD-01-01), the Fund of Science for Earthquake Resilience (XH23042A, XH22039D, XH24015D), the Science and Technology Project of Gansu Province (22JR5RA823, 23JRRA1397), and the Earthquake Tracking Task of CEA (2024010205).
Acknowledgments
Thanks to the First Monitoring and Application Center, CEA for providing GNSS velocity field datasets and the time series data of GNSS continuous stations.
Conflict of interest
The authors declare that the research was conducted in the absence of any commercial or financial relationships that could be construed as a potential conflict of interest.
Publisher’s note
All claims expressed in this article are solely those of the authors and do not necessarily represent those of their affiliated organizations, or those of the publisher, the editors and the reviewers. Any product that may be evaluated in this article, or claim that may be made by its manufacturer, is not guaranteed or endorsed by the publisher.
References
Deng, Q. D., Cheng, S. P., Ma, J., and Du, P. (2014). Seismic activities and earthquake potential in the Tibetan Plateau. Chin. J. Geophys. in Chin. 57 (7), 2025–2042.
Deng, Q. D., Zhang, P. Z., Ran, K. Y., Yang, X. P., Min, W., and Chu, Q. Z. (2002). Basic characteristics of China's activity structure. Sci. Sin. (Terrae) 32 (12), 1020–1031. doi:10.3321/j.issn:1006-9267.2002.12.007
Dong, D., Herring, T., and King, R. W. (1998). Estimating regional deformation from a combination of space and terrestrial geodetic data. J. Geodesy 72, 200–214. doi:10.1007/s001900050161
Donglioni, C., Barba, S., Carminati, E., and Riguzzi, F. (2015). FaultOn-off versus strain rate and earthquakes energy. Geosci. Front. 6 (2), 265–276. doi:10.1016/j.gsf.2013.12.007
Du, F., Wen, Z. X., Feng, J. G., Liang, J. M., Long, F., and Wu, J. (2018). Seismo-tectonics and seismic potential of the Liupanshan fault zone (LPSFZ). Chin. J. Geophys. in Chin. 61 (2), 545–559. doi:10.6038/cjg2018L0181
Du, F., Wen, Z. X., Zhang, P. Z., and Wang, Q. L. (2009). Interseismic deformation across the Longmenshan fault zone before the 2008 M8.0 Wenchuan earthquake. Chin. J. Geophys. in Chin. 52 (11), 2730–2738. doi:10.3969/j.issn.0001-5733.2009.11.007
Gan, W. J., Zhang, P., Shen, Z., Niu, Z., Wang, M., Wan, Y., et al. (2007). Present-day crustal motion within the Tibetan plateau inferred from GPS measurements. J. Geophys. Res. Solid Earth 112, B08416. doi:10.1029/2005jb004120
Hao, M., Wang, Q. L., Shen, Z. K., Cui, D. X., Ji, L. Y., Li, Y. H., et al. (2014). Present day crustal vertical movement inferred from precise leveling data in eastern margin of Tibetan plateau. Tectonophysics 632, 281–292. doi:10.1016/j.tecto.2014.06.016
Herring, T. A., King, R. W., and McClusky, S. C. (2010a). Gamit reference manual, GPS analysis at mit. Cambridge, MA, USA: Massachussetts Institute Technology.
Herring, T. A., King, R. W., and McClusky, S. C. (2010b). “Globk reference manual,” in Global kalman filter VLBI and GPS analysis program. Cambridge, MA, USA: Massachussetts Institute Technology.
Jiang, Z. S., and Liu, J. N. (2010). The method in establishing strain field and velocity field of crustal movement using least squares collocation. Chin. J. . Geophys. in Chin. 53 (5), 1109–1117. doi:10.3969/j.issn.0001-5733.2010.05.011
Jiang, Z. S., Ma, Z. J., Zhang, X., Wang, Q., and Wang, S. X. (2003). Horizontal strain field and tectonic deformation of China Mainland revealed by preliminary GPS result. Chin. J. Geophys. in Chin. 46 (3), 352–358. doi:10.3321/j.issn:0001-5733.2003.03.012
Jiang, Z. S., Yang, G. H., Fang, Y., Zhang, X., Wu, Y. Q., and Ping, J. J. (2007). “Study on the relations between distribution of crustal movement and strong earthquakes using GPS survey,” in Paper presented at the GPS technology application research paper album.
Lease, R. O., Douglas, W. B., Hough, B., Wang, Z. C., and Yuan, D. Y. (2012). Pulsed miocene range growth in northeastern tibet: insights from Xunhua basin magnetostratigraphy and provenance. GSA Bull. 124, 657–677. doi:10.1130/B30524
Lease, R. O., Douglas, W. B., Marin, K. C., Kenneth, A. F., Zheng, D. W., and Zhang, H. P. (2011). Middle miocene reorganization of deformation along the northeastern Tibetan plateau. Geology 39 (4), 359–362. doi:10.1130/g31356.1
Li, Y. X., Yang, G. H., Li, Z., Guo, L. Q., Huang, C., Zhu, Y. W., et al. (2003b). Movement and strain state of active blocks in Chinese Mainland. Sci. Sin. (Terrae). 33 (1), 65–81. doi:10.3321/j.issn:1006-9267.2003.z1.008
Li, Y. X., Zhang, J. H., Li, Z., Guo, L. Q., Huang, C., Zhu, Y. W., et al. (2003a). Horizontal crustal movement in China’s main-land and its surrounding areas obtained from the combined GPS network. Acta Geod. Cartogr. Sinica 32 (4), 301–307. doi:10.3321/j.issn:1001-1595.2003.04.004
Li, Z. C., Chen, Z., Wu, J. L., Zhou, X., Zhang, Z. M., Zhao, , et al. (2024). Co-Seismic deformation of the jishishan 6.2 earthquake in Gansu province based on high-frequency GNSS observation. Geomatics Inf. Sci. Wuhan Univ. doi:10.13203/J.whugis20240004
Li, Z. M., Tian, Q. J., and Tu, H. W. (2009). Remote sensing characteristics of Lajishan Fault. Plateau Earthq. Res. 21 (1), 26–31. doi:10.3969/j.issn.1005-586X.2009.01.004
Liang, H. B., Zhan, W., and Li, J. W. (2021). Vertical surface displacement of Mainland China from GPS using the multisurface function method. Adv. Space Res. 68 (12), 4898–4915. doi:10.1016/j.asr.2021.02.024
Liu, Q. Y., Robert, D. van der H., Li, Y., Yao, H. J., Chen, J. H., Guo, B., et al. (2014). Eastward expansion of the Tibetan plateau by crustal flow and strain partitioning across faults. Nat. Geosci. 7 (5), 361–365. doi:10.1038/ngeo2130
Liu, X. X., Wu, Y. Q., Jiang, Z. S., Zhan, W., Li, Q., Wei, W. X., et al. (2015). Deformation evolution characteristics of the southern section of the Longmenshan fault zone before the Lushan Ms7.0 earthquake revealed by GPS observations. Sci. Sin. (Terrae). 45 (8), 1198–1207.
Liu, Z. J., Han, B. Q., Neng, R. H., Li, H. Z., Yu, C., Song, C., et al. (2024). Source parameters and slip distribution of the 2023 Mw 6.0 jishishan (Gansu, China) earthquake constrained by InSAR observations. Geomatics Inf. Sci. Wuhan Univ. doi:10.13203/J.whugis20240008
Lu, S. M., Wu, Z. H., and Li, Z. C. (2024). Seismic structure characteristics of the 18 december 2023 M6.2 jishishan earthquake, Gansu province. Prog. Earthq. Sci. 54 (1), 86–93. doi:10.19987/j.dzkxjz.2024-007
Ma, H. P., Feng, J. G., Wu, S. Y., Xu, R., Huang, Y. L., Li, N., et al. (2018). The analysis of the abnormal characteristics of GPS data before the 2013 minxian-zhangxian Ms6.6 earthquake. Earth Environ. Sci. 153, 062044. Paper presented at the IOP Conference Series. doi:10.1088/1755-1315/153/6/062044
Melchier, P. (1978). The tides of the planet Earth. New York, Oxford, Paris: Pergamon Press. Available at: https://api.semanticscholar.org/CorpusID:126790416.
Molnar, P., and Tapponnier, P. (1975). Cenozoic Tectonics of Asia: effects of a Continental Collision: features of recent continental tectonics in Asia can be interpreted as results of the India-Eurasia collision. Science 189 (4201), 419–426. doi:10.1126/science.189.4201.419
Nikolaidis, R. (2002). Observation of geodetic and seismic deformation with the global positioning system. San Diego: University of California.
Savage, J., Gan, W., and Svarc, J. L. (2001). Strain accumulation and rotation in the eastern California Shear Zone. J. Geophys. Res. 106 (B10), 21995–22007. doi:10.1029/2000JB000127
Scholz, C. H. (2002). The mechanics of earthquakes and faulting. Second edition. Cambridge University Press.
Tapponnier, P., and Molnar, P. (1977). Active faulting and tectonics in China. J. Geophys. Res. 82 (20), 2905–2930. doi:10.1029/jb082i020p02905
Tian, Q. J., and Chen, L. (2024). Discussion on the seismic structure of the Jishishan earthquake. Overv. Disaster Prev. 1, 10–15.
Wang, E. Q., Zhang, Q., and Clark, B. (2000). The Lajishan fault belt in Qinghai province: a multi-staged uplifting structural window. Chin. J. Geol. 35 (4), 493–500. doi:10.3321/j.issn:0563-5020.2000.04.013
Wang, M., and Shen, Z. K. (2020). Present-day crustal deformation of continental China derived from GPS and its tectonic implications. J. Geophys. Research-Solid Earth 125, e2019JB018774. doi:10.1029/2019jb018774
Wang, Q., Zhang, P. Z., Freymueller, J. T., Bilham, R., Larson, K. M., Lai, X. A., et al. (2001). Pre-sent-Day crustal deformation in China constrained by global positioning system measurements. Science 294, 574–577. doi:10.1126/science.1063647
Wang, Y. Z., Wang, M., and Shen, Z. K. (2017). Block-like versus distributed crustal deformation around the northeastern Tibetan plateau. J. Asian Earth Sci. 104, 31–47. doi:10.1016/j.jseaes.2017.02.040
Wu, Y. Q., Jiang, Z. S., Yang, G. H., Fang, Y., and Wang, W. X. (2009). The application and method of GPS strain calculation in whole mode using least square collocation in sphere surface. Chin. J. Geophys. in Chin. 52 (7), 1707–1714. doi:10.3969/j.issn.0001-5733.2009.07.005
Wu, Y. Q., Jiang, Z. S. Y., Pang, Y. J., and Chen, C. Y. (2021). Statistical correlation of seismicity and geodetic strain rate in the Chinese Mainland. Seismol. Res. Lett. 93, 268–276. doi:10.1785/0220200048
Wu, Y. Q., Jiang, Z. Z., Zhao, J., Liu, X. X., Wei, W. X., Liu, Q., et al. (2015). Crustal deformation before the 2008 Wenchuan MS 8.0 earthquake studied using GPS data. J. Geodyn. 85 (apr), 11–23. doi:10.1016/j.jog.2014.12.002
Yang, J. Y., Wen, Y. M., and Xu, C. J. (2024a). Seismogenic Fault structure of the 2023 jishishan (Gansu) ms 6.2 earthquake revealed by InSAR observations. Geomatics Inf. Sci. Wuhan Univ. doi:10.13203/j.whugis20230501
Yang, P. X., Xiong, R. W., Hu, C. Z., and Gao, Y. (2024b). Preliminary analysis of the seismogenie tectonics for the 2023 jishishan Ms6.2 earthquake in Gansu province. Earthquake 44 (1), 1–7. doi:10.12196/j.issn.1000-3274.2024.01.011
Yang, Y. M., and Su, S. J. (2024). The 2023 jishishan MS6.2 earthquake in Gansu province, China: a shallow strong earthquake with thrust-dominated components. Earthquake 44 (1), 1–8. doi:10.12196/j.issn.1000-3274.2024.01.013
Yuan, D. Y., Ge, W. P., Chen, Z. W., Li, C. Y., Wang, Z. C., Zhang, H. P., et al. (2013). The growth of northeastern tibet and its relevance to large-scale continental geodynamics: a review of recent studies. Tectonics 32 (5), 1358–1370. doi:10.1002/tect.20081
Yuan, D. Y., Zhang, P. Z., Lei, Z. S., Liu, B. C., and Liu, X. L. (2005). A preliminary study on the new activity features of the lajishan mountain fault zone in Qinghai province. Earthq. Res. China 21 (1), 93–102. doi:10.3969/j.issn.1001-4683.2005.01.010
Zhang, F. S., Wu, Y. Q., and Sun, D. Y. (2011). Analysis of the baseline time series from continuous GPS stations in the Mainland of China. Earthquake 31 (4), 86–97. doi:10.1007/s11442-011-0836-7
Zhang, P. Z., Deng, Q. D., Zhang, G. M., Ma, J., Gan, W. J., Min, W., et al. (2003). Strong earthquake activity and active blocks in Chinese Mainland. Sci. Sin. (Terrae). S1, 12–20. doi:10.3321/j.issn:1005-2321.2003.z1.012
Zhang, P. Z., Deng, Q. D., Zhang, Z. Q., and Li, H. B. (2013). Active faults, earthquake disasters and their dynamic processes in Chinese Main-land. Sci. Sin. (Terrae). 10, 14.
Zhang, P. Z., Wang, Q., and Ma, Z. J. (2002). GPS velocity field and active crustal blocks of contemporary tectonic deformation in continental China. Earth Sci. Front. 9 (2), 430–441. doi:10.3321/j.issn:1005-2321.2002.02.022
Zhao, J., Jiang, Z. S., Wu, Y. Q., Liu, X. X., Wei, W. X., and Li, Q. (2012). Study on fault locking and fault slip deficit of the Longmenshan fault zone before the Wenchuan earthquake. Chin. J. Geophys. in Chin. 55 (9), 2963–2972. doi:10.6038/j.issn.0001-5733.2012.09.015
Zhao, J., Zhen, W., Ren, J. W., Jiang, Z. S., Gu, T., Liu, J., et al. (2021). GPS time series inversion of the healing process of the middle segment of the Longmenshan fault after the 2008 wenchuan earthquake. Acta Geod. Cartogr. Sinica 50 (1), 37. doi:10.1016/j.jseaes.2021.104953
Zhao, L. Q., Zhan, Y., Wang, Q. L., Sun, X. Y., Hao, M., Zhu, Y. Q., et al. (2022). 3D electrical structure and crustal deformation of the lajishan tectonic belt, northeastern margin of the Tibetan plateau. J. Asian Earth Sci. 224, 104953. doi:10.1016/j.jseaes.2021.104953
Zheng, G., Wang, H., Wright, T. J., Lou, Y. D., Zhang, R., Zhang, W. X., et al. (2017). Crustal deformation in the India-eurasia collision zone from 25years of GPS measurements. J. Geophys. Research-Solid Earth 122 (11), 9290–9312. doi:10.1002/2017jb014465
Keywords: GNSS continuous observation, baseline time series, strain parameter time series, Jishishan earthquake, tectonic deformation evolution
Citation: Liao J, Ma H, Feng J, Li M and Zhang J (2024) Analysis of deformation evolution characteristics of the northern Lajishan fault before the Jishishan MS6.2 earthquake based on GNSS observations. Front. Earth Sci. 12:1450645. doi: 10.3389/feart.2024.1450645
Received: 17 June 2024; Accepted: 29 October 2024;
Published: 13 November 2024.
Edited by:
Aydın Büyüksaraç, Çanakkale Onsekiz Mart University, TürkiyeReviewed by:
Ameha Atnafu Muluneh, Addis Ababa University, EthiopiaAtinç Pirti, Yıldız Technical University, Türkiye
Copyright © 2024 Liao, Ma, Feng, Li and Zhang. This is an open-access article distributed under the terms of the Creative Commons Attribution License (CC BY). The use, distribution or reproduction in other forums is permitted, provided the original author(s) and the copyright owner(s) are credited and that the original publication in this journal is cited, in accordance with accepted academic practice. No use, distribution or reproduction is permitted which does not comply with these terms.
*Correspondence: Haiping Ma, bHV0bWhwQDE2My5jb20=
 Jiayan Liao
 Haiping Ma
 Jiangang Feng2