 Junchao Cai
- 1School of Civil Engineering and Architecture, Henan University of Science and Technology, Luoyang, China
- 2International Scientific and Technological Cooperation Base for Geological Disaster Prevention of Zhejiang Province, Shaoxing University, Shaoxing, China
- 3Shanxi Metallurgical Rock-Soil Engineering Investigation Co., Ltd, Taiyuan, China
- 4Central & Southern China Municipal Engineering Design and Research Institute Co., Ltd, Wuhan, China
- 5College of Geosciences and Engineering, North China University of Water Resources and Electric Power, Zhengzhou, China
Toppling deformation can be classified into deep toppling (DT) and shallow toppling (ST) based on deformation mechanisms and development depth of rock mass under different soft and hard rock conditions. Currently, the toppling zoning indicators and quantitative criteria are not uniform, and human factors have a significant influence on the toppling zoning indicators. Summerizing and analyzing the existing toppling cases and toppling zoning researches, this study selects rock layer toppled angle, maximum tension within layer, unit tension within layer, and longitudinal wave velocity as indicators for toppling zoning. Considering the differences in the characteristics of deep toppling (DT) and shallow toppling (ST), the quantitative criteria for the deep and shallow toppling zoning indicators are determined respectively. This study employs the Analytic Hierarchy Process (AHP) and fuzzy comprehensive evaluation method to establish toppling zoning evaluation models. The deep toppling dam site slope at Miaowei hydropower station and the shallow toppling bank slope of Xingguang Ⅲ formation at Xiluodu Hydropower Station were tested, respectively. These results are compared with toppling zoning of field surveys to verify the rationality and applicability of the models. This achievement holds significant reference value for the toppling zoning of rock masses in engineering slopes, especially in the construction, development, and engineering management of toppling slopes.
1 Introduction
Toppling deformation has been found in the construction of numerous engineering projects such as mines, highways, and hydropower (Cruden and Hu, 1994; Tamrakar et al., 2002; Liu et al., 2016; Ning et al., 2019; Sardana et al., 2019; Zhu et al., 2020; Tao et al., 2021; Zhao et al., 2021; Zhu et al., 2021; Cui et al., 2023). As a typical form of slope failure (Goodman, 2013; Hungr et al., 2014; Huang et al., 2017), toppling deformation failure is increasingly found in many places, especially in hydropower projects (Zhang et al., 2015; Liu et al., 2016; Xie et al., 2018; Cai et al., 2019; Xia et al., 2019; Tu et al., 2020; Haider et al., 2023; Cai et al., 2024; Ren et al., 2024), such as the left bank slope of the Jinping I Hydropower Station, the Yinshui Gully slope of the Xiaowan Hydropower Station, the dam site slope of the Miaowei Hydropower Station, the right dam shoulder slope of the Huangdeng Hydropower Station, the left bank slope of the Laxiwa Hydropower Station, the bank slope of the Shiziping Hydropower Station, the bank slope of the Xiluodu Hydropower Station, and so on. Many scholars have conducted in-depth research on its influencing factors, deformation and failure mechanisms, and occurrence conditions (Huang, 2007; Huang and Li, 2011; Huang et al., 2017; Xia et al., 2019; Xia et al., 2023; Zhang et al., 2023; Zhao et al., 2023; Zhou et al., 2024).
Huang (2007), Huang and Li 2011, Huang et al. (2017) summarized numerous toppling slope cases, and classified toppling deformation into three types: deep toppling (Figure 1A), shallow toppling (Figure 1B), and complex type toppling from the perspective of genetic mechanisms and evolutionary processes. Shallow toppling (ST) rock masses usually undergo minor toppling deformation, followed by the fracturing of rock layers. It often occurs in hard-layered rock masses or hard blocky rock masses, exhibiting primarily “brittle” fracturing of rock layers. After rock layers fracturing, toppling fracture surfaces are formed, with most of them remaining in the shallow parts of the slope. Shallow toppling generally develops to depths of tens of meters, typically within 100 m. Deep toppling (DT), on the other hand, typically occurs in inclined to near-vertical, medium to thin layers, low-strength metamorphic rock layers and soft rocks and is characterized by “flexible” deformation features. These toppling deformations occur over a long geological history, characterized by depths typically exceeding 100 m (Huang et al., 2017; Cai et al., 2019; Cai et al., 2022).
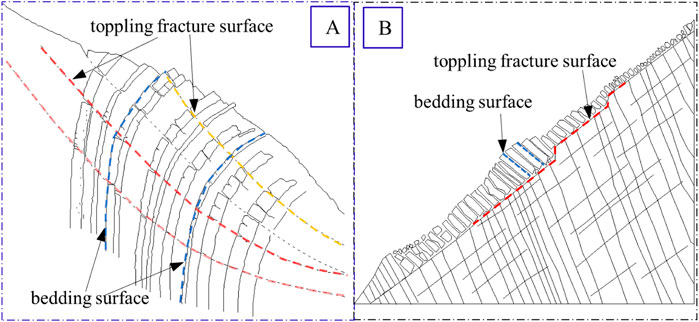
Figure 1. Schematic diagram of toppling model. (A) deep toppling model; (B) shallow toppling model.
The degree of toppling deformation in rock masses varies depending on their different geological origins, and when rock masses of the same type undergo varying degrees of toppling deformation, their engineering characteristics also exhibit significant differences. Therefore, it is of practical significance to define distinct deformation intensity zones for rock masses prone to toppling, particularly in the context of construction, development, and engineering treatment of toppling slopes.
Through precise zoning of toppling deformation, it is possible to better understand the toppling characteristics and deformation degree of rock masses, enabling the implementation of appropriate engineering measures to ensure slope stability and safety. Rock masses with different degrees of toppling deformation may require different engineering designs and engineering treatment methods, thus precise zoning of toppling rock masses can effectively reduce engineering risks and enhance the success rate of engineering projects. In summary, precise toppling zoning of rock masses is of significant importance for the construction and management of engineering slopes, ensuring the safety and sustainability of such projects.
Regarding the zoning of the intensity of rock mass toppling deformation, there is currently a lack of mature zoning evaluation system, and even fewer researches have been conducted on the quantitative assessment of such zoning. Huang (1983) divided the toppled rock mass into the main toppling deformation zone and the traction failure zone based on the size of the dip angle of the toppled rock layers and the degree of tensional deformation characteristics. Hong (1994) categorized the toppled rock mass into strong toppling and slight toppling based on the dip angle of the toppled rock layers, weathering and fragmentation degree, and the filling status of tension cracks. Li et al. (2004) classified the toppled rock mass into the toppling loose zone, bending fracture zone, and transitional zone based on the degree of weathering and the development characteristics of structural planes. Li et al. (2007) selected the dip angle of the toppled rock layers, maximum tension, unit tension, and longitudinal wave velocity as zoning indicators based on the development of deformation and fracture in the toppled rock mass and its engineering geological characteristics. They divided the toppled deformation rock mass into extremely strong toppling zone (A), strong toppling zone (B1), and weak toppling zone (C). Bai et al. (2009) used the dip angle of the toppled rock layers, maximum tension, unit tension, and longitudinal wave velocity as quantitative indicators to classify the intensity of toppling deformation in the dam shoulder rock mass of Miaowei Hydropower Station. Liu et al. (2017) conducted toppling deformation zoning based on changes in the pre-toppling and post-toppling dip angles, categorizing it as slight toppling, moderate toppling, and strong toppling. Huang et al. (2017) conducted a comprehensive analysis based on case studies. They used four quantitative indicators: rock layer toppled angle, maximum tension, unit tension, and longitudinal wave velocity, as well as three qualitative indicators: deformation and fracture characteristics, unloading characteristics, and weathering characteristics. They also considered rock mass structure types, rock mass categories, and stability coefficients to refine the classification of rock mass toppling into extremely strong toppling (zone A), strong toppling (zone B), weak toppling (zone C), and non toppling (zone D). Zhao et al. (2021) conducted a case study on the identification and toppling zoning of a deep-seated metamorphic rock slope based on this. Cai et al. (2014) and Zheng et al. (2018) calculated and analyzed the fracture surface and the toppling mechanical zoning of its upper rock mass based on the limit equilibrium theory of cantilever beam. The toppling deformation rock mass was divided into toppling zone, sliding zone, and toppling-sliding zone.
From the above, it can be concluded that the toppling zoning indicators extracted in these studies generally provide a visual reflection of the degree of toppling deformation in rock masses and are relatively easy to obtain in practical engineering. However, these indicators are all extracted for specific projects and lack standardization. Some zoning systems that rely on a single indicator can be influenced by external factors. Therefore, establishing a quantitative standard for toppling zoning that is applicable to various situations is of significant importance for engineering design and construction. In this study, based on the analysis and summary of existing data on rock mass toppling deformation, we propose toppling zoning indicators for rock mass toppling deformation. We also establish quantified criteria for each indicator and develop a quantitative assessment model for rock mass toppling zoning, providing a significant reference for the toppling zoning of engineering slopes.
2 Toppling cases
Previous studies have shown that as key controlling factors influencing the development of toppling deformation, in addition to the spatial relationship between rock layer orientation and slope surface, the rock soft and hard conditions are also crucial factors influencing the development of toppling slopes. The deep toppling (DT) primarily occurs in geological formations dominated by soft rocks, including layers with certain thicknesses of hard rocks or interlayers (Figure 1A). The shallow toppling (ST) primarily occurs in hard rock formations, such as carbonate rock formations, platy or blocky igneous rock formations subjected to jointing and fracturing (such as thin to moderately thick limestone, sandstone, and densely jointed granite) (Figure 1B). The failure characteristics of deep toppling (DT) and shallow toppling (ST) are described through case studies.
2.1 Shallow toppling (ST)
The Guobu bank slope of Laxiwa Hydropower Station is used to illustrate the basic characteristics of shallow toppling (ST). The bank slope is comprised of ditches and ridges. The lithology of the slope rock mass mainly contains granites, with a “plate-like” structure, formed in the Indosinian Period.
According to the field investigation characteristics of toppling deformation and structure, the toppling rock masses can be divided into intensified strong toppling (Zone A), strong toppling (Zone B), and weak toppling (Zone C) (Figure 2). The toppling zoning characteristics of the rock mass in the toppled slope are described as follows (Cai et al., 2019).
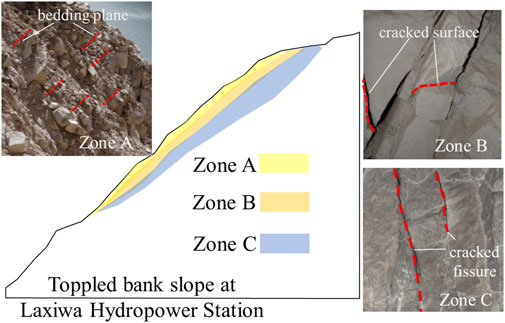
Figure 2. The toppling zones of bank slope at laxiwa hydropower station.
2.1.1 Zone A-intensified strong toppling zone
This type of rock mass exhibits intense toppling fracture. It generally has embedded fragmentation and blocky structures with some local fragmented structures, and it is in a state of intense unloading and relaxation. The plate-like granite rock mass begins to experience fracturing at a toppled angle exceeding 18°, with overall breaking and fracturing occurring at around 35°. These rock masses after toppling and fracturing experience partial collapse, and most of them remain in a “stacked” shape on the shallow surface of the slope. The shallow fractured rock mass near the slope surface undergoes gravity overturning along the toppling fracture surface (zone) inclined towards the outside of the slope. This situation often leads to shallow stability issues of the toppled slope.
2.1.2 Zone B-strong toppling zone
These rock slabs are partially fractured and broken, and the variation of toppled angle generally ranges from 10° to 15°. Toppling deformation results in tension cracks between granite rock slabs, resulting in wide tension cracks. The rock mass undergoes tensile and relaxation deformation, with an overall blocky structure and locally embedded fragmented structure. The rock mass is generally under overall strong unloading and local weak unloading, with relatively poor integrity.
2.1.3 Zone C- weak toppling zone
The toppled angle of the granite rock slabs in this zone is very small, less than 5°. There are only tensional fractures occurring between rock slabs, and there are localized minor tensile fractures within rock slabs. The rock mass is generally in a weak unloading state, with a blocky structure, and it exhibits relatively good overall integrity. This represents a weaker degree of toppling deformation and generally occurs in the deeper parts of the deformed rock mass, which is a relatively stable part within the slope.
These rock mass, at the bottom of Zone C, represents an elastic relaxation area in the deeper parts of the slope, resulting from the outward toppling effect. No significant toppling is observed, only localized relaxation and tensional fractures along joint surfaces are seen. The rock mass exhibits a blocky-whole structure. This phenomenon is one of the typical characteristics of the hard rock mass (granite), showing its prominent elastic properties.
2.2 Deep toppling (DT)
The slope in front of the dam at Miaowei Hydropower Station is a typical soft and hard structure slope, primarily composed of metamorphic rocks (soft rock). The rock types mainly include slate, phyllite, schist, and metamorphic quartz sandstone, with alternating soft and hard rock conditions. Due to factors such as slope terrain and rock mass structure, the slope in front of the dam experiences strong deep toppling deformation (Figure 3).
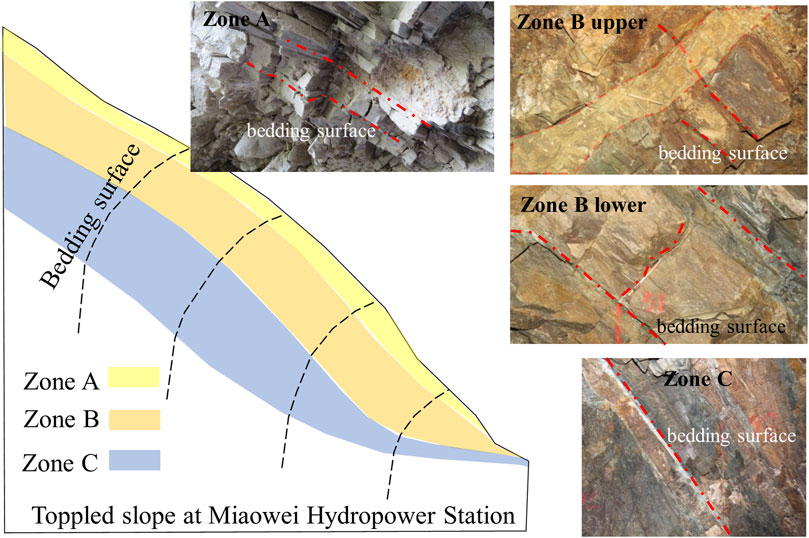
Figure 3. Toppling zones of the slope at Miaowei Hydropower Station.
2.2.1 Zone A-extremely strong toppling zone
The normal dip angle of the rock layer is 80°–85°. When the rock layers topple and rotate significantly, the rock mass undergoes intense fracturing and broken, forming a tensile fracture zone steep dip outside the slope. There is significant internal rock tensile fracture, strong relaxation, with cracks filled with gravel, angular fragments, and rock debris. The rock mass above the fracture zone is almost separated from the underlying bedrock, and local rockmass falls. This occurs in the shallow surface of the slope rock mass undergoing extremely intense toppling.
2.2.2 Zone B-strong toppling zone
This zone can be further divided into two subsections, upper and lower, based on the intensity of toppling and the different fracturing mechanisms.
The rock layers experience significant toppling at Zone B upper, in addition to intense tensile fracturing within the layers, shear deformation (tensile-shear) occurs along gentle dip outer joints of the slope, exhibiting significant development of cutting shear layer.
The vertical bedding tensile fracturing begins to develop within the layers or along existing structural planes at Zone B lower. This type of tensile fracturing generally occurs in the hard rock layers between two softer rock layers, representing a situation with a relatively strong toppling deformation. Spatially, it occurs in the deeper parts of the toppled slope.
2.2.3 Zone C-weak toppling zone
In this zone, the toppled angle of rock layers is relatively small, generally less than 10°. The layered rock masses experience shear sliding along interlayer or relatively weak rock zones. There are no significant fractures within the layers, and only minimal tensile fractures occur within the harder rock layers.
3 Toppling zoning indicators
Existing research has primarily used indicators that reflect the degree of rock mass toppling development or characteristics of the toppled rock mass when classifying it. The degree of toppling development indicators mainly include factors like dip angle of rock layer, maximum tension, unit tension, etc (Table 1). The deformation characteristic indicators of the toppled rock mass mainly include weathering features and rock mass structure characteristics. There is a certain correspondence between rock mass characteristic indicators and longitudinal wave velocity. Longitudinal wave velocity decreases as the integrity of the rock mass decreases. Different degrees of toppled rock masses have different wave velocities due to variations in their deformation and fracture levels. Additionally, the longitudinal wave velocity is relatively easy to measure in practical engineering. Therefore, it can be selected as a quantitative indicator for toppling zoning.
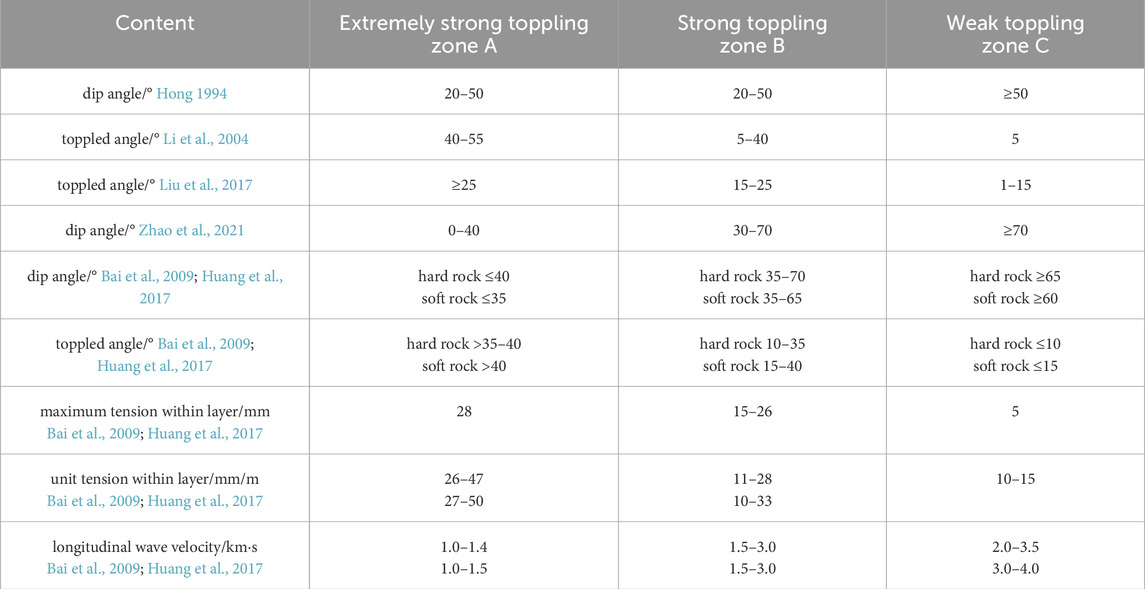
Table 1. Zoning indicators and quantification standards for toppling deformation.
Taking into consideration the ease of obtaining field indicators, this study plans to select rock layer dip angle (the change in dip angle of the toppled rock layers before and after toppling), maximum tension (the maximum tensile width between toppled rock layers), unit tension (the tensile width between toppled rock layers per unit length), and longitudinal wave velocity as quantitative indicators for rock mass toppling zoning. Shallow toppling (ST) often occurs in hard layered or hard block like rock masses, mainly manifested as the “brittle” fracture of the rock layer, and the unit interlayer tension is not significant. Therefore, the other three indicators are selected for shallow toppling. Deep toppling (DT) often occurs in low strength soft rock layers, exhibiting significant “flexible” deformation characteristics, primarily involving bending and creep deformation with relatively less fracturing of rock layers, so four indicators are selected (Huang et al., 2017; Cai et al., 2022).
Based on the quantitative standards of existing research, the quantitative zoning indicators selected for rock mass toppling zoning are the rock layer toppled angle (α), the maximum tension within the rock layer (S), the unit tension within the rock layer (s), and the longitudinal wave velocity (Vp). Referring to existing studies on toppling deformation zoning of rock mass, the degree of toppling deformation is categorized into the following zones: extremely strong toppling zone (zone A), strong toppling zone (zone B), and weak toppling zone (zone C). The quantified zoning criteria for each zone are as listed in Table 2 for shallow toppling rock masses and Table 3 for deep toppling rock masses.
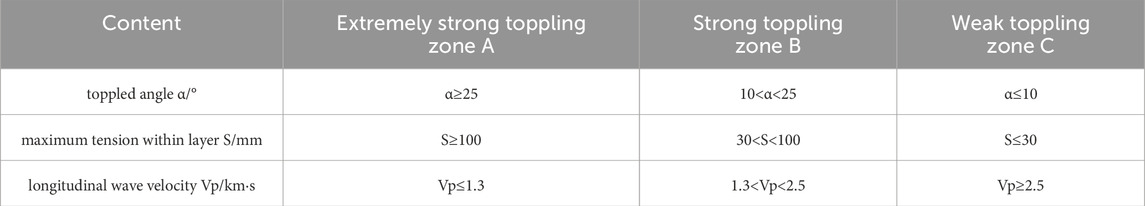
Table 2. Quantitative criteria values of shallow toppling zoning.
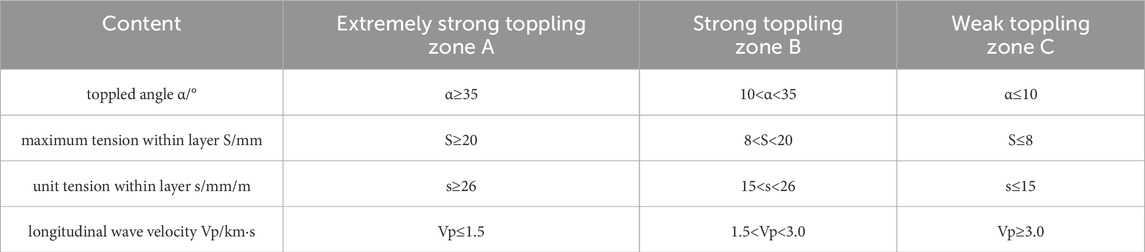
Table 3. Quantitative criteria values of deep toppling zoning.
4 Toppling zoning evaluation model
The current research mostly focuses on the extraction of indicators for rock mass toppling zoning and the quantification criteria for each indicator. However, mathematical models for evaluation have not been applied extensively.
Considering the randomness and variability of rock mass toppling, it is influenced by various factors such as rock properties, stress conditions, and other geological environmental conditions. Additionally, rock masses exhibit anisotropic behavior, non-linear deformation characteristics, and fuzzy boundaries between different toppling rockmass zones. This study uses the Analytic Hierarchy Process (AHP) to determine the weight of evaluation indicators and employ the Fuzzy Comprehensive Evaluation method to establish a toppling zoning evaluation model of rock mass. This method refers to a systematic approach used for addressing a complex multi-objective problem. It breaks down the overall objective of the problem into multiple sub-objectives, further dissecting them into several hierarchical levels of multiple indicators. By employing a qualitative indicator fuzzy quantification method, it calculates the individual rankings at each level and an overall ranking. This method serves as a systematic approach for optimizing decision-making related to objectives.
4.1 Evaluation indicators weight
This study uses the Analytic Hierarchy Process (AHP) to determine the weights of various factors. This method not only emphasizes mathematical approaches but also takes into account human factors, making it more accurate and reliable compared to other analytical methods. Taking the degree of rock mass toppling deformation as the overall objective layer (A), a single-level hierarchical model for quantifying toppling zoning indicators is established. The weight judgment matrix is constructed using a matrix scoring table, with the scales and meanings of the weight judgment matrix presented in Table 4.
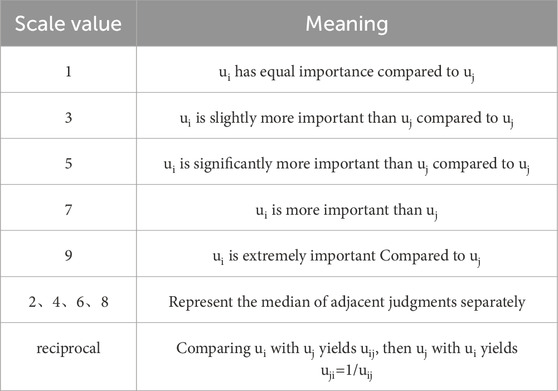
Table 4. Scale of judgment matrix and its meaning.
4.1.1 Determination of the indicators weight for shallow toppling
Shallow toppling failures are primarily characterized by “brittle” fracturing of rock layers after minor deformations, with more developed fractures. The toppled angle of rock layer determines the degree of toppling deformation. The maximum tension within the layer and the longitudinal wave velocity, relative to the toppled angle of rock layer, have less importance. The weight of the maximum tension within the layer is slightly greater than that of the longitudinal wave velocity.
By conducting a comprehensive analysis of the correlations between various field evaluation indicators and establishing a comparison of the weights between these evaluation indicators, a weight judgment matrix for the evaluation indicators of shallow toppling is constructed using a matrix scoring approach. The weighting comparison of the evaluation factors for shallow toppling is shown in Table 5.
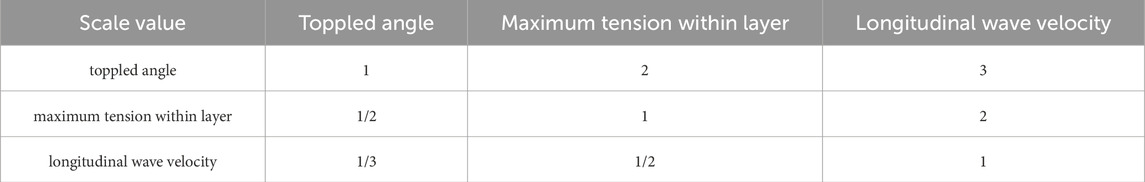
Table 5. Weight comparison of evaluation factors for shallow toppling.
From the mentioned weight comparison of the evaluation factors, we can obtain the single factor weight judgment matrix U1 through Equation 1.
By calculating the eigenvalues and eigenvectors of the judgment matrix U1, we obtain the maximum eigenvalue λmax = 3.0092, and the corresponding eigenvector is (0.8468, 0.4660, 0.2565), which can be used as the weight vector for evaluation indicators. After normalizing the weights of the various evaluation indicators mentioned above, we obtain the weight set M of the evaluation indicators for shallow toppling as follows: M = { 0.540, 0.297, 0.163}. To ensure the credibility and accuracy of the judgment matrix and eliminate interference from other factors, a consistency test is performed, and the test formula is as follows:
In the formula, UC represents the consistency ratio, UI = (λmax-n)/ (n-1), where n is the order of the judgment matrix, and λmax is the maximum eigenvalue determined for the judgment matrix. CI stands for the average random consistency index of the judgment matrix, and its values for lower-order judgment matrices are shown in Table 6.
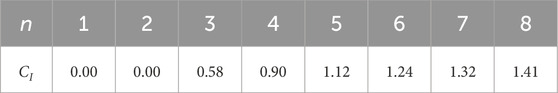
Table 6. Index value of AHP average random consistency.
When UC < 0.1, it is considered that the judgment matrix exhibits good consistency, indicating that the weight distribution is reasonable. Otherwise, it is necessary to adjust the values of each element in the judgment matrix until satisfactory consistency is achieved. Through calculations, it is determined that UI = 0.0046, CI = 0.58, UC = UI/CI ≈ 0.0079 < 0.1. This indicates that the construction of the judgment matrix for these evaluation indicators is reasonable.
4.1.2 Determination of the indicators weight for deep toppling
Deep toppling failures often occur in low-strength, soft rock layers and exhibit significant “flexible” deformation characteristics, primarily involving bending and creep deformation. Fracturing of rock layers is relatively less common in deep toppling. The deformation characteristics of deep toppling suggest that the rock layer toppled angle determines the degree of toppling deformation, and the flexible characteristics result in the weight of unit tension within layer being equal to that of the toppled angle. The weight of the maximum tension within layer and the longitudinal wave velocity used to test the bending and fracture failure characteristics of the rock mass take second place.
Similarly, to determine the weightings of evaluation indicators for deep toppling, a comprehensive analysis of the correlations between various evaluation indicators is conducted to establish a comparison of the weights between these evaluation indicators. A weight judgment matrix for the evaluation indicators of deep toppling is then constructed using a matrix scoring approach. The weighting comparison of the evaluation factors for deep toppling is shown in Table 7.
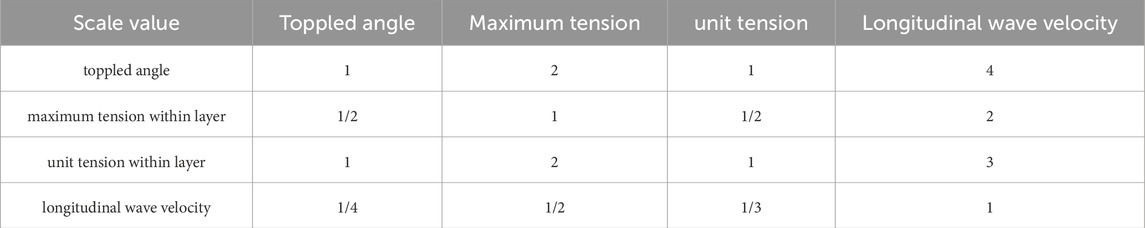
Table 7. Weight comparison of evaluation factors for deep toppling.
From the mentioned weight comparison of the evaluation factors, we can obtain the single factor weight judgment matrix U2 through Equation 3.
Solving for the eigenvalues and eigenvectors of the judgment matrix U2, we can obtain the maximum eigenvalue λmax = 4.0104, and the corresponding eigenvector is (0.6753, 0.3377, 0.6300, 0.1819). After normalizing the weights of the various evaluation indicators mentioned above, we obtain the weight set M of the evaluation indicators for rock mass deep toppling as follows: M = {0.370, 0.185, 0.345, 0.100}.
Similarly, to ensure the credibility and accuracy of the judgment matrix and eliminate interference from other factors, a consistency test is performed using the test formula (2) along with the indexv alues of the average random consistency for lower-order judgment matrices as shown in Table 5. Through calculations, it is determined that UI = 0.0035, CI = 0.90, UC = UI/CI ≈ 0.0039 < 0.1. When UC < 0.1, it is considered that the judgment matrix exhibits good consistency, indicating that the weight distribution is reasonable, and it also signifies that the construction of the judgment matrix for these evaluation factors is reasonable.
4.2 Evaluation model
Considering the characteristics of rock mass toppling deformation, a toppling zoning evaluation model is established based on the fuzzy comprehensive evaluation theory. The steps are as follows:
(1) Evaluation target set Y = {extremely strong toppling zone A, strong toppling zone B, weak toppling zone C};
(2) For shallow toppling, the evaluation factor set X = {rock layer toppled angle α, maximum tension within the layer S, longitudinal wave velocity Vp}; for deep toppling, the evaluation factor set X = {rock layer toppled angle α, maximum tension within the layer S, unit maximum tension within the layer s, longitudinal wave velocity Vp};
(3) Weight sets of factors for shallow toppling: M = {0.540, 0.297, 0.163}; Weight sets of factors for deep toppling: M = {0.370, 0.185, 0.345, 0.100};
(4) Based on the fuzzy membership of each evaluation factor, establish the toppling zoning evaluation judgment matrix K;
(5) Using the weight sets M and the judgment matrix K, calculate the evaluation target set Y. Based on the results of the evaluation target set, employ the maximum membership method to assess the intensity of rock mass toppling deformation.
4.3 Cases application
4.3.1 Case of shallow toppling
Taking the example of the slope of the Xingguang Ⅲ formation in the Xiluodu Hydropower Station, this paper employs the shallow toppling zoning evaluation model described in this study to perform a quantitative zoning of the toppled rock mass.
Taking PD07 as an example to illustrate the quantitative zoning of rock mass toppling deformation, the distribution of factors including rock layer toppled angle, maximum tension within layer, and longitudinal wave velocity with depth at the tunnel 07 (PD07) location is shown in Figures 2–4 (Mu, 2017). Taking a depth of 83 m at tunnel 07 as an example, calculations are carried out based on the data obtained from Figures 2–4. The evaluation factor values are extracted, resulting in the evaluation factor set X = {25, 0.7, 2.16}. Subsequently, the fuzzy membership degrees of each factor are determined based on their respective membership functions, and the evaluation judgment matrix K1 for toppling zoning is obtained through Equation 4.
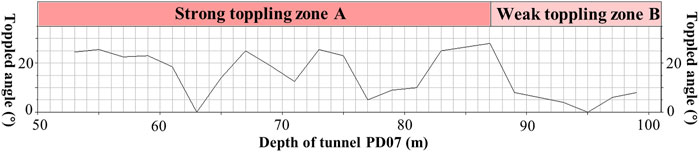
Figure 4. The toppled angle variation of rock layer with the depth of PD07.
Based on the previously determined weight sets M for the various factors in rock mass toppling zoning, it can be concluded that the evaluation target set result for this toppling location is Y = MK1 = {0.270, 0.433, 0.297}. According to the principle of maximum membership degree, this location belongs to the strong toppling zone B.
Similarly, by extracting the evaluation factor values and judgment matrices from Figures 4–6 for various points in the tunnel, the toppling zoning is determined. The toppling zoning results are detailed in Figures 4–6. It can be observed that within the tunnel PD07, the section from 53 to 87 m falls into the strong toppling zone, while the section from 87 to 100 m belongs to the weak toppling zone. The results obtained in this study are consistent with the toppling zoning made by the geological personnel on-site, where 53–85 m is classified as the strong toppling zone and 85–100 m as the weak toppling zone. This demonstrates the feasibility of using the evaluation model for quantitative toppling zoning.
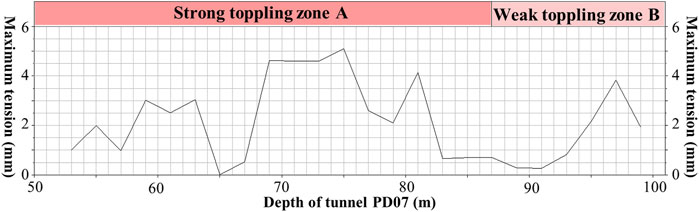
Figure 5. The maximum tension value variation of rock layer with the depth of PD07.
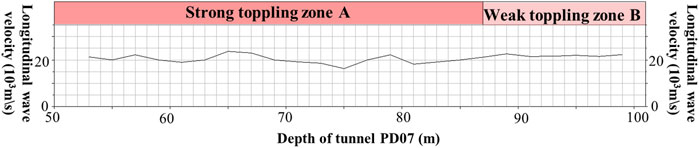
Figure 6. The longitudinal wave velocity variation of rock layer with the depth of PD07.
4.3.2 Case of deep toppling
Taking the example of the toppled dam site slope at the Miaowei Hydropower Station on the Lancang River, this paper employs the deep toppling zoning evaluation model described in this study to perform a quantitative zoning of the toppled rock mass.
Taking PD06 as an example to illustrate the quantitative zoning of rock mass toppling deformation, the distribution of factors including rock layer toppled angle, maximum tension within layer, unit tension within the layer, and longitudinal wave velocity with depth at the tunnel 06 (PD06) location is shown in Figures 7–10 (Li et al., 2007). Taking a depth of 48 m at tunnel 06 as an example, calculations are carried out based on the data obtained from Figures 7–10. The evaluation factor values are extracted, resulting in the evaluation factor set X = {25, 13, 23, 18}. Subsequently, the fuzzy membership degrees of each factor are determined based on their respective membership functions, and the evaluation judgment matrix K2 for toppling zoning is obtained through Equation 5.
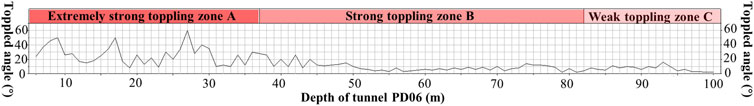
Figure 7. The toppled angle variation of rock layer with the depth of PD06.
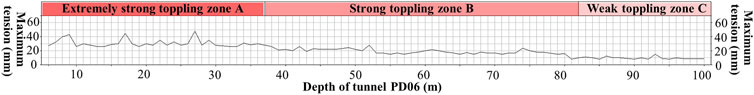
Figure 8. The maximum tension value variation of rock layer with the depth of PD06.
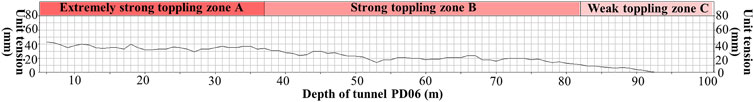
Figure 9. The unit tension value variation of rock layer with the depth of PD06.
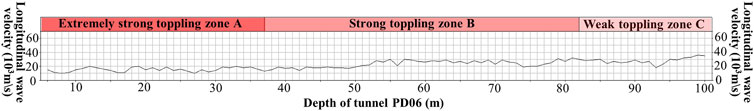
Figure 10. The longitudinal wave velocity variation of rock layer with the depth of PD06.
Based on the previously determined weight sets M for the various factors in rock mass toppling zoning, it can be concluded that the evaluation target set result for this toppling location is Y = MK2 = {0.050, 0.950, 0}. According to the principle of maximum membership degree, this location belongs to the strong toppling zone B.
Similarly, by extracting the evaluation factor values and judgment matrices from Figures 7–10 for various points in the tunnel PD06, the toppling zoning is determined. The toppling zoning results are detailed in Figures 7–10. It can be observed that within the tunnel PD06, the section from 0 to 38 m falls into the extremely strong toppling zone, the section from 38 to 81 m belongs to the strong toppling zone, and the section from 81 to 100 m is classified as the weak toppling zone.
The results obtained in this study are consistent with the toppling zoning made by the geological personnel on-site, where 0–35 m is classified as the extremely strong toppling zone and 35–80 m as the strong toppling zone. This demonstrates the feasibility of using the evaluation model for quantitative toppling zoning.
5 Conclusion
Based on case studies and analysis of rock soft and hard conditions, this study summarizes the toppling zoning characteristics of deep toppling (DT) and shallow toppling (ST). The toppling rock masses of ST divided into intensified strong toppling (Zone A), strong toppling (Zone B), weak toppling (Zone C), Zone A rock mass is in a state of intense unloading and relaxation. Zone B rock mass undergoes tensile and relaxation deformation. Zone C rock mass undergoes only tensional fractures occurring between rock slabs, and within rock slabs, there are localized minor tensile fractures. The toppling rock masses of DT also divided into intensified strong toppling (Zone A), strong toppling (Zone B), and weak toppling (Zone C). Zone A rock mass undergoes intense fracturing and broken, and there is significant internal rock tensile fracture, and strong relaxation. Zone B shows intense tensile fracturing within the layers, shear deformation occurs along gentle dip outer joints, and tensile fracturing generally occurs in the hard rock layers between two softer rock layers. Zone C rock masses experience shear sliding along interlayer, and only minimal tensile fractures occur within the harder rock layers.
The quantitative indicators selected for rock mass toppling zoning include rock layer toppled angle, maximum tension within layer, unit tension within layer, and longitudinal wave velocity. Considering the differences in characteristics between deep toppling and shallow toppling deformation, quantification criteria of toppling zoning were established respectively. Then, the Analytic Hierarchy Process (AHP) method was employed to determine the weights of each evaluation factor. A consistency test was conducted on the weight judgment matrix to validate the reasonability of the weight distribution. Finally, a fuzzy comprehensive evaluation method was used to construct toppling zoning evaluation models for both deep toppling and shallow toppling rock masses.
The deep toppling zoning evaluation model established was applied to classify the deep toppling rock mass in the dam site slope at the Miaowei hydropower station. The results obtained closely aligned with the field zoning. Similarly, the shallow toppling zoning evaluation model was used to classify the toppled rock mass of Xingguang Ⅲ formation in the bank slope at the Xiluodu hydropower station, and the results obtained were also relatively close to the on-site toppling zoning. This demonstrates the rationality of the toppling zoning evaluation model and the feasibility of the quantitative standards for toppling zoning. This achievement has significant reference value for the toppling zoning of toppled rock masses in engineering slopes.
This study has proposed a approach for constructing a quantitative zoning evaluation model for toppling rock masses based on mathematical methods. It can serve as a methodological reference to some extent for conducting quantitative analysis in similar cases that transition from qualitative judgments.
Data availability statement
The original contributions presented in the study are included in the article/supplementary material, further inquiries can be directed to the corresponding authors.
Author contributions
JCC: Investigation, Methodology, Validation, Writing–original draft, Writing–review and editing, Conceptualization, Data curation. JTL: Conceptualization, Investigation, Methodology, Supervision, Validation, Writing–review and editing. JZ: Data curation, Investigation, Methodology, Validation, Writing–original draft, Writing–review and editing. JPW: Investigation, Methodology, Validation, Writing–original draft. SZ: Investigation, Methodology, Validation, Writing–review and editing. GQQ: Investigation, Methodology, Supervision, Validation, Writing–review and editing, Conceptualization.
Funding
The author(s) declare that financial support was received for the research, authorship, and/or publication of this article. The study is financially supported by the International Scientific and Technological Cooperation Base for Geological Disaster Prevention of Zhejiang Province (IBGDP-2022-04), the National Natural Science Foundation of China (42107169), the Opening fund of State Key Laboratory of Geohazard Prevention and Geoenvironment Protection (Chengdu University of Technology, SKLGP2022K004, SKLGP2021K016), the Sichuan Provincial Engineering Research Center of City Solid Waste Energy and Building Materials Conversion and Utilization Technology (No. GF2024ZD05) and the Chongqing Engineering Research Center of Disaster Prevention & Control for Banks and Structures in Three Gorges Reservoir Area (No. SXAPGC24ZDI03).
Acknowledgments
We appreciate the linguistic assistance provided by AJE during the preparation of this manuscript. Special thanks go to the expertise comments from the reviewers and editors for improving the manuscript.
Conflict of interest
Author JTL was employed by Shanxi Metallurgical Rock-Soil Engineering Investigation Co., Ltd.
Author JZ was employed by Central & southern China municipal engineering design and research institute Co., Ltd.
The remaining authors declare that the research was conducted in the absence of any commercial or financial relationships that could be construed as a potential conflict of interest.
Publisher’s note
All claims expressed in this article are solely those of the authors and do not necessarily represent those of their affiliated organizations, or those of the publisher, the editors and the reviewers. Any product that may be evaluated in this article, or claim that may be made by its manufacturer, is not guaranteed or endorsed by the publisher.
References
Bai, Y. B., Zhang, L., and Li, Y. S. (2009). Classification system of toppling deformation at dam abutment slope of Miaowei Hydropower Station. Sci. & Technol. Inf. (06), 417–418.
Cai, J. C., Ju, N. P., Huang, R. Q., Zheng, D., Zhao, W. H., Li, L. Q., et al. (2019). Mechanism of toppling and deformation in hard rock slope: a case of bank slope of Hydropower Station, Qinghai Province, China. J. Mt. Sci. 16, 924–934. doi:10.1007/s11629-018-5096-x
Cai, J. C., Wang, J. P., Li, Z., Kong, Y., Zhang, L., and Qi, G. Q. (2024). Study on deformation characteristics of toppling failure of anti-dip rock slopes under different soft and hard rock conditions. Front. Earth Sci. 12 (1339169). doi:10.3389/feart.2024.1339169
Cai, J. C., Zheng, D., Ju, N. P., Wang, J., and Zhou, X. (2022). Time-varying effect of ductile flexural toppling failure on anti-dip layered rock slope. Front. Earth Sci. 10, 943700. doi:10.3389/feart.2022.943700
Cai, J. S., Yan, E. C., Wang, Z. Q., Yang, J. G., and Tang, R. X. (2014). Study of cantilever beam limit equilibrium model of anti-dip layered rock slopes. Rock Soil Mech. 35 (S1), 15–28. doi:10.16285/j.rsm.2014.s1.003
Cruden, D. M., and Hu, X. Q. (1994). Topples on underdip slopes in the highwood pass, alberta, Canada. Q. J. Eng. Geol. Hydrogeology 27, 57–68. doi:10.1144/GSL.QJEGH.1994.027.P1.08
Cui, S. H., Wang, H., Pei, X. J., Luo, L., Zeng, B., and Jiang, T. (2023). Research on deformation evolution of a large toppling based on comprehensive remote sensing interpretation and real-time monitoring. Remote Sens. 15 (23), 5596. doi:10.3390/rs15235596
Goodman, R. E. (2013). “Toppling- A fundamental failure mode in discontinuous materials Description and analysis,” in 2013 congress on stability and performance of slopes and embankments III, geo-congress 2013, San Diego, United States (ASCE: Geotechnical Special Publication), 2348–2378. doi:10.1061/9780784412787.227
Haider, M., Yuan, S. F., Li, T. L., Liu, Y., Lawrence, D. D., and Khan, R. K. M. (2023). Stability prediction of the toppling rock slope on the Heihe reservoir bank using discontinuous deformation analysis. Environ. Earth Sci. 82 (16), 383. doi:10.1007/s12665-023-11076-x
Hong, Y. H. (1994). Analysis and assessment of the topple slope’s stability at the right bank of bikou hydropower station. Northwest Hydropower 47 (1), 10–14.
Huang, R. Q. (2007). Large-scale Landslides and their sliding mechanisms in China since the 20th Century. Chin. J. Rock Mech. Eng. 26 (32), 433–454. doi:10.3321/j.issn:1000-6915.2007.03.001
Huang, R. Q., and Li, W. L. (2011). Formation, distribution and risk control of landslides in China. J. Rock Mech. Geotechnical Eng. 3 (2), 97–116. doi:10.3724/sp.j.1235.2011.00097
Huang, R. Q., Li, Y. S., and Yan, M. (2017). The implication and evaluation of toppling failure in Engineering geology practice. J. Eng. Geol. 25 (05), 1165–1181. doi:10.13544/j.cnki.jeg.2017.05.001
Hungr, O., Leroueil, S., and Picarelli, L. (2014). The Varnes classification of landslide types, an update. Landslides 11 (2), 167–194. doi:10.1007/s10346-013-0436-y
Li, X. Z., Li, D. G., and Li, J. N. (2004). Analysis and assessment on the stability of non-excavation slope with inverted creeping rock mass for Longtan Hydroelectric Project. Water Power 30 (6), 47–49+52.
Li, Y. S., Huang, R. Q., Ju, N. P., Zhao, J. J., Zheng, D., Bai, Y. B., et al. (2007). Characteristics of rock toppling deformation at the dam site of Miaowei Hydropower Station and its engineering impact. Chengdu: Chengdu University of Technology.
Liu, H. J., Ju, N. P., Zhao, J. J., and Zhang, X. Y. (2017). The implication and evaluation of toppling failure in Engineering geology practice. J. Hefei Univ. Technol. 40 (06), 793–798. doi:10.3969/j.issn.1003-5060.2017.06.015
Liu, M., Liu, F. Z., Huang, R. Q., and Pei, X. J. (2016). Deep-seated large-scale toppling failure in metamorphic rocks: a case study of the Erguxi slope in southwest China. J. Mt. Sci. 13, 2094–2110. doi:10.1007/s11629-015-3803-4
Mu, J. Q. (2017). “Research on the optimized shape of toppling fracture plane,” in Obsequent slope and the deformation stability analysis method (Chengdu, China: Chengdu University of Technology).
Ning, Y. B., Zhang, G. C., Tang, H. M., Shen, W., and Shen, P. (2019). Process analysis of toppling failure on anti-dip rock slopes under seismic load in southwest China. Rock Mech. Rock Eng. 52, 4439–4455. doi:10.1007/s00603-019-01855-z
Ren, K. Y., Li, R. J., Yao, X., Zhao, X., Ma, L., Yao, C., et al. (2024). Monitoring Yanwan deep-seated toppling deformation with the impact of water-level fluctuation by SAR observations. Landslides 21 (6), 1243–1254. doi:10.1007/s10346-024-02220-0
Sardana, S., Verma, A. K., Verma, R., and Singh, T. N. (2019). Rock slope stability along road cut of Kulikawn to Saikhamakawn of Aizawl, Mizoram, India. Nat. Hazards 99, 753–767. doi:10.1007/s11069-019-03772-4
Tamrakar, N. K., Yokota, S., and Osaka, O. (2002). A toppled structure with sliding in the Siwalik Hills, midwestern Nepal. Eng. Geol. 64, 339–350. doi:10.1016/S0013-7952(01)00095-3
Tao, Z. G., Zhu, C., He, M. C., and Karakus, M. (2021). A physical modeling-based study on the control mechanisms of Negative Poisson's ratio anchor cable on the stratified toppling deformation of anti-inclined slopes. Int. J. Rock Mech. Min. Sci. 138, 104632. doi:10.1016/j.ijrmms.2021.104632
Tu, G. X., Deng, H., Shang, Q., Zhang, Y., and Luo, X. (2020). Deep-seated large-scale toppling failure: a case study of the Lancang slope in southwest China. Rock Mech. Rock Eng. 53, 3417–3432. doi:10.1007/s00603-020-02132-0
Xia, K. Z., Chen, C. X., Liu, X. T., Yuan, J., and Dang, S. (2023). Assessing the stability of high-level pillars in deeply-buried metal mines stabilized using cemented backfill. Int. J. Rock Mech. Min. Sci. 170, 105489. doi:10.1016/j.ijrmms.2023.105489
Xia, M., Ren, G. M., Li, T. B., Cai, M., Yang, T. J., and Wan, Z. L. (2019). Complex rock slope deformation at Laxiwa Hydropower Station, China: background, characterization, and mechanism. Bull. Eng. Geol. Environ. 78, 3323–3336. doi:10.1007/s10064-018-1371-x
Xie, L. F., Yan, E. C., Wang, J. H., Lu, G., and Yu, G. (2018). Study on evolutionary characteristics of toppling deformation of reverse-dip layered rock slope based on surface displacement monitoring data. Environ. Earth Sci. 77 (4), 156. doi:10.1007/s12665-018-7352-3
Zhang, B. C., Ning, Y. B., Tang, H. M., Ding, B., Fang, K., and Zou, Z. (2023). Study on the evolutionary process of interbedded anti-inclined slope block-flexure toppling in the upper Yalong River. Bull. Eng. Geol. Environ. 82, 240. doi:10.1007/s10064-023-03223-2
Zhang, Z. L., Liu, G., Wu, S. R., Tang, H., Wang, T., Li, G. Y., et al. (2015). Rock slope deformation mechanism in the cihaxia hydropower station, northwest China. Bull. Eng. Geol. Environ. 74 (3), 943–958. doi:10.1007/s10064-014-0672-y
Zhao, B., Su, L. J., Wang, Y. S., and Li, W. (2023). Insights into some large-scale landslides in southeastern margin of Qinghai-Tibet Plateau. J. Rock Mech. Geotechnical Eng. 15 (8), 1960–1985. doi:10.1016/j.jrmge.2022.09.005
Zhao, W. H., Zhang, C. Q., and Ju, N. P. (2021). Identification and zonation of deep-seated toppling deformation in a metamorphic rock slope. Bull. Eng. Geol. Environ. 80 (3), 1981–1997. doi:10.1007/s10064-020-02027-y
Zheng, Y., Chen, C. X., Liu, T. T., Zhang, H., Xia, K., and Liu, F. (2018). Study on the mechanisms of flexural toppling failure in anti-inclined rock slopes using numerical and limit equilibrium models. Eng. Geol. 237, 116–128. doi:10.1016/j.enggeo.2018.02.006
Zhou, Z. K., Yao, X., Li, R. J., Jiang, S., Zhao, X. m., Ren, K. Y., et al. (2024). Deformation characteristics and mechanism of an impoundment-induced toppling landslide in Baihetan Reservoir based on multi-source remote sensing. J. Mt. Sci. 20 (12), 3614–3630. doi:10.1007/s11629-023-7903-2
Zhu, C., He, M. C., Karakus, M., Cui, X., and Tao, Z. (2020). Investigating toppling failure mechanism of anti-dip layered slope due to excavation by physical modelling. Rock Mech. Rock Eng. 53 (11), 5029–5050. doi:10.1007/s00603-020-02207-y
Keywords: toppling failure, antidip rock slope, toppling zoning, evaluation method, soft and hard rock conditions
Citation: Cai J, Liu J, Zhang J, Wang J, Zhang S and Qi G (2024) Quantitative study on toppling deformation zoning of antidip rock slope under different soft and hard rock conditions. Front. Earth Sci. 12:1447578. doi: 10.3389/feart.2024.1447578
Received: 11 June 2024; Accepted: 20 August 2024;
Published: 06 September 2024.
Edited by:
Chun Zhu, Hohai University, ChinaReviewed by:
Kaizong Xia, Chinese Academy of Sciences (CAS), ChinaTantan Zhu, Chang’an University, China
Copyright © 2024 Cai, Liu, Zhang, Wang, Zhang and Qi. This is an open-access article distributed under the terms of the Creative Commons Attribution License (CC BY). The use, distribution or reproduction in other forums is permitted, provided the original author(s) and the copyright owner(s) are credited and that the original publication in this journal is cited, in accordance with accepted academic practice. No use, distribution or reproduction is permitted which does not comply with these terms.
*Correspondence: Jiangtao Liu, 458515589@qq.com; Guoqing Qi, dr.guoqingqi@163.com