 Sobhi Nasir
 Nikos Economou
 Khalil Al Hooti
 Talal Al Hosni
- 1Earth Sciences Department, College of Science, Sultan Qaboos University, Muscat, Oman
- 2School of Mineral Resources Engineering, Technical University of Crete, Chania, Greece
Geophysical methods may provide crucial information for the characterization of buried impact structures. In this study, we report and comment on the results of the geophysical survey of an elliptical-shaped structure near Mahout at Oman’s central desert. Geophysical models describe the variation in the physical properties of this structure’s subsurface in terms of density, magnetic susceptibility, and electrical resistivity of the formations buried under the desert sand. For the two former physical properties, a 3D inversion scheme was utilized, while for the latter, the very-low-frequency electromagnetic (VLF-EM) method and 2D inversion were involved for the first time in a similar study. The resultant models are in good agreement for imaging a generally bowl-shaped structure buried under the desert sand with a low resistivity (<40 Ohmm), highly magnetic (magnetic susceptibility 0.03–0.08 SI), and mixed density center (2.2–3.2 g/cm3). The results of the integrated geophysical survey at Mahout enhance the information about the applicability of the specific geophysical techniques at structures buried by sandy formations with less than 1-km diameter, which, currently, mostly comes from large-scale impact craters (>100 km), and confirm that such a multi-geophysical approach can be successful for imaging similar structures.
1 Introduction
The almost 200 meteorite impact craters on Earth (Kenkmann, 2021) are of great research interest due to their significant effects on Earth’s surface and shallow formations (Osinski and Pierazzo, 2013) and their assumed connection with subsurface resources (James et al., 2022). Laboratory, geological, and remote sensing studies, as well as applied geophysics, have contributed to both the origin verification and the subsurface depiction of impact craters (Hanafy et al., 2022; Neville et al., 2014; Gilder et al., 2018). The expected physical properties of a hypervelocity impact-crater site have led researchers to apply several geophysical techniques for imaging the subsurface structure (Grieve and Pilkington, 1996; Riller et al., 2018; de Oliveira et al., 2022).
The geophysical techniques most commonly applied to possible impact structures are the gravity and magnetic methods (Grieve and Osinski, 2011). Electromagnetic methods such as the time-domain electromagnetic (TDEM) method can provide valuable information about the subsurface structure at sites where knowledge at large depths is valuable but at the expense of resolution (Hanafy et al., 2022). Ground-penetrating radar (GPR) could provide much higher resolution in imaging the subsurface structure but with limited depth extent due to the rapid attenuation of the propagated electromagnetic signal (Hanafy et al., 2022; Economou and Vafidis, 2010). Electrical resistivity surveys showed that post-impact sediments usually have higher resistivity than the impact breccias and fractured basement (Pohl et al., 1977; Tong et al., 2010). Still, electrical methods may be unsuitable at areas where contact resistance is not guaranteed (Economou et al., 2022). Seismic methods, such as the seismic refraction technique, can provide information about the buried formations’ porosity variation, which could be connected to the impact melt, while the seismic reflection method could be utilized for relatively large structures to image the subsurface seismic velocity variation with the aim to delineate the crater rim, or the depth of the impact disruption beneath (Grieve and Osinski, 2011). Hanafy et al. (2022) implemented an integrated geophysical study at the Wabar crater at Saudi Arabia, aiming to contribute to the studies of cratering processes in sandy sediments, which, currently, are poorly understood. A variety of geophysical methods were applied at possible impact craters, with most of the information provided by studies on structures of 100–1,000-km diameter (Morgan and Rebolledo-Vieyra, 2013; Grieve and Pilkington, 1996; Gilder et al., 2018). Further work is needed to assess the applicability of fast and reliable geophysical techniques at smaller structures.
The Sultanate of Oman has contributed to almost 14% of the world’s meteorite findings (except Antarctica), but no certain surface impact crater was reported. The Mahout structure at the Central Desert of Oman was recently suggested as a possible impact crater based on mineralogical, petrological, and geological studies complemented by the initial results of a geophysical campaign (Nasir et al., 2023). Further studies are required to enhance this characterization, such as universal stage studies, further analysis of shock features, and geophysical approaches. Going one step further to this structure's tracing of origin, we report and comment on the geophysical models derived from an integrated geophysical survey over this structure whose central part is mainly buried under the desert sand.
In this study, we demonstrate that the integration of geophysical methods in similar studies can be successful for imaging the subsurface structure on the basis of the estimation of different physical attributes. Three geophysical techniques were utilized at the Mahout structure in Central Oman to image the deformational structures, namely, magnetic field method, gravitational field method, and very-low-frequency electromagnetic (VLF-EM) method. These methods were chosen based on several factors such as the expected geophysical contrast of the impact depression, which would produce alterations in formation density, the possible metallic nature of the melt, which would induce magnetic anomalies, and the expected corresponding electrical properties’ variation. The gravity method strongly depends on density, which is valuable for the structural information derived, while the method is independent of moisture or metallic bodies, which may bias the structural imaging of the other methods. The magnetic method is a very fast method as it is implemented in the field and can also detect structures with impact-induced or remnant magnetization. This is the first time that the VLF-EM method has been applied in possible impact structure imaging, and its choice was mainly based on the lack of moisture at the upper desert surface, which, in several cases, has made electrical resistivity tomography (ERT) or similar electrical methods requiring contact with Earth, not efficient due to prohibitive contact resistance.
2 Materials and methods
2.1 Geophysical techniques
A variety of geophysical 3D inversion algorithms for potential data have been developed for subsurface modeling (Li and Oldenburg, 1996; Li and Oldenburg, 1998; Portniaguine and Zhdanov, 2002; Fergoso and Gallardo, 2009).
Measuring the magnetic field of Earth can provide valuable information about the subsurface structure. Even though Earth’s magnetic field dominates the magnetic field intensity measurements, weak local perturbations, mainly caused by rocks and minerals either permanently magnetic or magnetized by induction, are of great importance in subsurface studies, especially when formations consist of metallic minerals (Li and Oldenburg, 1996; Portniaguine and Zhdanov, 2002; Gilder et al., 2018). The induced magnetization of a material is proportional to the volume magnetic susceptibility of this material and the inducing field of Earth. Magnetic susceptibility variation is indicative to the characterization of different subsurface formations or structures. In geophysical studies, susceptibility values are usually given in SI units, and for most materials, these values are at the order of 10–6, with the most important exception of magnetite-bearing formations, which can reach up to several orders higher.
Earth’s gravity field is a potential field that can be measured at the surface and provides valuable information for the subsurface structures. Numerous applications have been introduced that are mainly based on lateral density (mass) variation (Pilkington and Grieve, 1992). Recently, the gravity method has been applied in investigations on shallow targets (Murty and Raghavan, 2002; Atef et al., 2016; Klokočník et al., 2022). The gravity method usually measures the gravity acceleration in mGals, with the scope to estimate the subsurface density distribution in g/m3 (Ervin, 1977). The measurements must first be reduced for instrument and tidal time drifts and further for the effect of latitude and elevation. The method does not estimate absolute density values but rather the subsurface density contrast, so the results must be tied to a known or estimated density value of a specific subsurface structure at the study area.
The VLF-EM method is a passive method that involves a receiver recording the signal of VLF stations at several positions in the world (with the main aim being long-distance marine communication) in the frequency band of 15–30 KHz (Sharma et al., 2014). Even though the signal is artificial and not naturally sourced, as with methods like magnetotellurics (MT), the method is considered passive for the following reasons:
1. The source is a long-range military or communication transmitter generating an electromagnetic signal continuously and is considered a pre-existing signal.
2. The signal is not generated on site, and the survey equipment consists of the VLF receiver, which detects the man-made signals.
3. The equipment is receiver-only, not including a transmitter, which is the main characteristic of active methods.
For the sake of precision, one could also refer to the method as semi-passive based on the fact that the source is man-made. In summary, one could describe the VLF-EM method as passive because it uses distant transmitters’ signals and does not generate its own, but the signals themselves are man-made (Telford et al., 1990; Zonge et al., 2005; Reynolds, 2011; Chung et al., 2016).
The VLF transmitters are antennas consisting of wires up to several hundred meters long and serve as monopole radiators producing a vertical electric field component and a horizontal magnetic field component, which, in turn, is vertical to the EM signal propagation. Secondary electrical currents arise due to the subsurface conductivity variation (existence of low-resistivity structures–induction), which create secondary magnetic fields. The VLF receiver records the inclination of the major axis of the polarization ellipse (real part) and the latter’s ellipticity (imaginary part). VLF-EM data processing is normally used to obtain qualitative information about the subsurface low-conductivity structures. Inversion is utilized to obtain an estimation of the subsurface electrical resistivity variation (geoelectrical model).
2.2 Data acquisition
To delineate the subsurface structure of the Mahout crater, we inverted magnetic, gravity, and VLF-EM data (Figures 1, 2). The data were acquired in late October 2022 within a 800 m × 1,000-m grid, over and between control points served as 200-m nodes (Figure 1, white points), and processing was applied on the data values before inversion. The control points were flagged marks at the site, which guided us for the measurements between them.
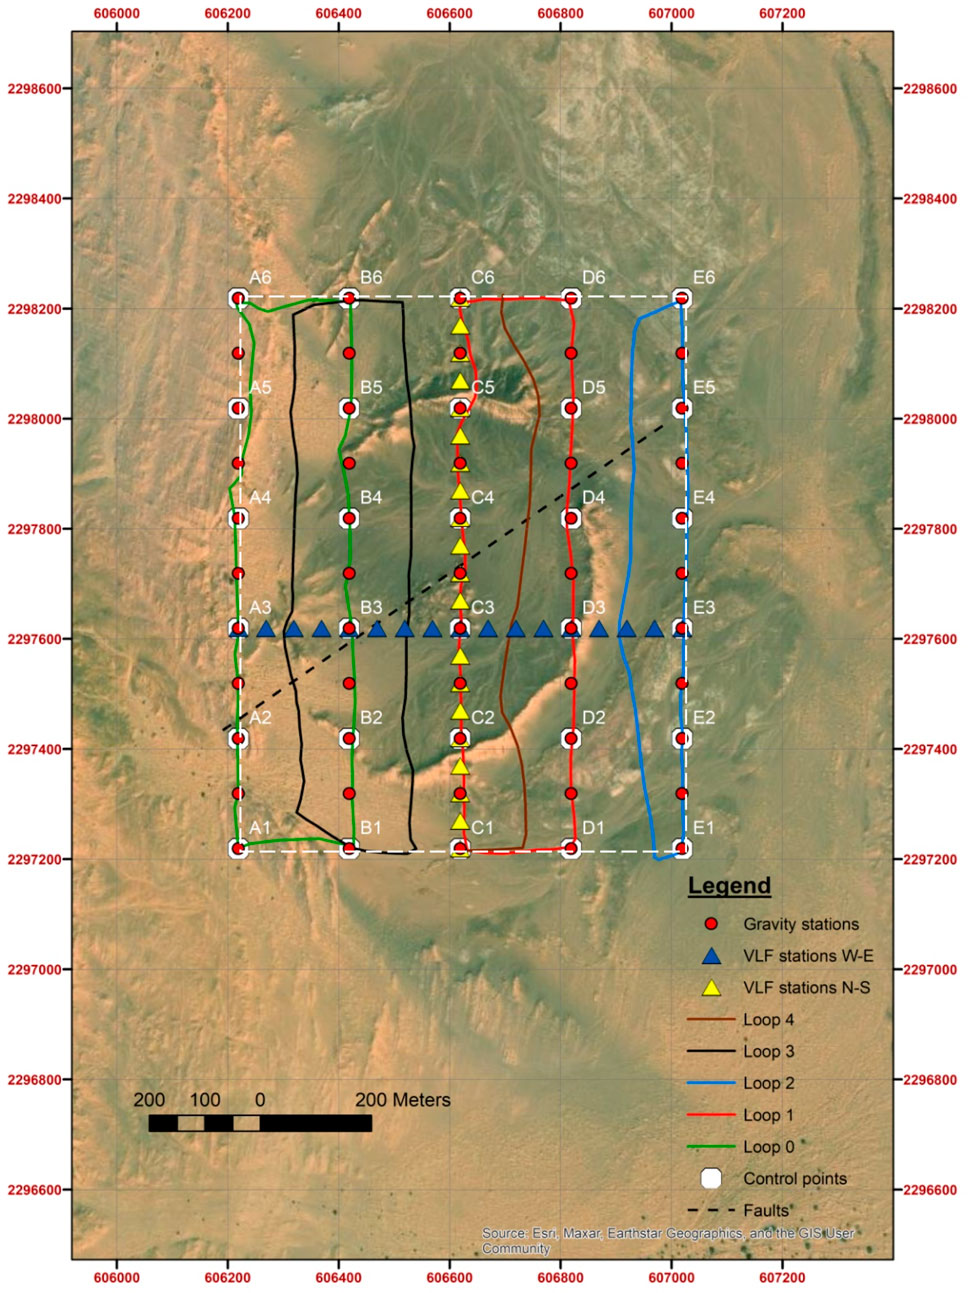
Figure 1. Location map of the crater area. White points indicate the control measurement points. All the area enclosed by these points was prospected by the gravity (red circles) and magnetic (loops) methods with different station intervals, while study lines indicated by points C1–C6 (yellow triangles) and points A3–E3 (blue triangles) were prospected by the VLF-EM method. The black dashed line indicates a fault most possibly running through the structure, which can be partially seen at the rims. White dashed line is the area of the data in Figures 2A, B. Coordinates are UTM zone 40 N.
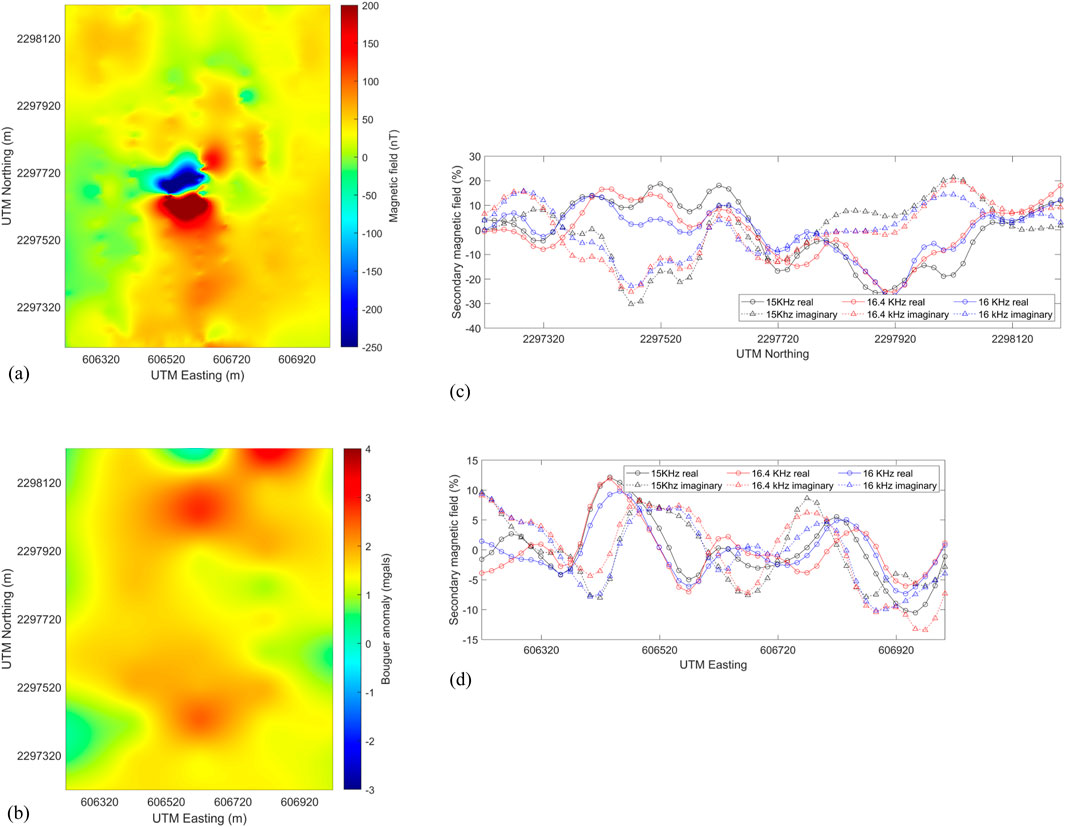
Figure 2. Geophysical data acquired at the crater area. (A) Map of the residual magnetic field of Earth (Nasir et al., 2023); (B) residual Bouguer anomaly map (Nasir et al., 2023); (C) images acquired after the VLF-EM data processing in the south–north direction (Figure 1, origin is C1 and end point is C6), yellow triangles; and (D) images of the corresponding VLF-EM data to the east–west direction (Figure 1, origin is A3 and end point is E3), blue triangles. For both the study lines, lines with circles denote the real part of the secondary magnetic field, while lines with triangles denote the imaginary part. Values are the vertical component of the secondary magnetic field in percent of the total magnetic field.
A GEM proton precession magnetometer measured in loops, starting from the desired origin point, ending at the same point (for diurnal corrections), and further measuring at a specific base point of the planned grid (Figure 1, reference point A1 for leveling all the loops together). The magnetic data were acquired with a relatively small interval due to the magnetometer’s advantage of auto-measuring both Earth’s magnetic field values and the position (Figures 1, 2A). This was a 0.2-s time interval, which was almost 10 cm inline spacing of a 100-m profile interval.
The gravity field of Earth was measured in south–north profiles with a 200-m interval and 100-m inline spacing using a CG-5 Scintrex gravimeter (Figures 1, 2B). Each profile line was initiated by a measurement at a base station, indicated by point C1 in Figure 1, and after the measurement at the last profile point, a measurement at the base station concluded to the end of the profile. Using this procedure, diurnal corrections were implemented for each profile. The rest of the data reduction steps, reaching to Bouguer anomaly values, were implemented in a grid correction manner (data processing section, Figure 2B).
The VLF-EM data covered two profiles, a south–north direction profile and a west–east direction profile. Indicative VLF-EM measurement stations are shown in Figure 1 (yellow and blue triangles with a 50-m distance). Between every two successive triangles, two more points were measured. Thus, the stations’ interval was 50/3 m (∼16.67 m) (Figures 1, 2C, D). The VLF-EM measurements utilized three frequencies, namely, 15 KHz, 16 KHz, and 16.4 KHz. These frequencies correspond to VLF stations producing the strongest signal to the receiver, which was a GEM GSM 19T geophysical device. The strongest signal means that the study lines were the closest possible to having a perpendicular direction compared to an imaginary line connecting the VLF station and the study area (electromagnetic field propagation direction).
The south–north profile had the direction of C1–C6 points and the west–east profile had the direction of A3–E3 points (Figure 1). For efficient VLF-EM measurements, the angle between the transmitter–receiver direction and the direction of the study lines should range between 45° and 90°, according to the literature (Palacky, 1986; McNeil and Labson, 1991; Telford et al., 1990; Zonge et al., 2005), but we used a stricter criterion of not being less than 60°. Here, the 15-KHz transmitter location corresponds to France, 16 KHz to South India, and 16.4 MHz to Norway. The first two transmitters referred above are on a line passing through the site with an azimuth of almost 298° (or an angle of −62°), which is also considered the angle with the south–north profile and, consequently, an angle of −28° with the west–east profile. The third transmitter of 16.4 KHz is over a line with direction almost 67° with the direction of the west–east study line and 23° with the south–north profile. Thus, the first two VLF transmitters were considered the most appropriate for the south–north profile and the third for the west–east profile, even though all three frequencies were measured during acquisition for both profiles.
The orientation of the study lines was chosen to be south–north and west–east because 1) the sections will have a normal orientation with the other types of geophysical data (parallel or vertical); 2) both study lines cross over the SW-NE fracture (even though not vertically), and it will be imaged within the VLF-EM resistivity sections; and 3) the signal strength of the data was considered adequate.
2.3 Data processing
The values of the magnetic field of Earth underwent corrections for time, based on the periodical measurements of the magnetic field at reference point A1 (Figure 1). The data were first corrected by subtracting the linear trend (the measurements were acquired in a relatively fast rhythm so that Earth’s magnetic field variation was considered linear for each measurement loop) for each loop, which was designed based on the first and last measurements of each loop. Then, the corrected data of each loop were further corrected according to the periodical measurements at point A1. For the position of point A1 (Figure 1), at latitude 20.771719° and longitude 58.020452°, we used the information provided by the National Centers for Environmental Information (NCEI) of National Oceanic and Atmospheric Administration (NOAA) to acquire the values of declination (1.1962°) and inclination (31.9036°), as well as the magnetic field strength of the area (42,611.6 nT) for the date of the measurements. The residual field data (Figure 2A), along with the information mentioned above, were imported into a 3D inversion scheme using the MAG3D code from the UBC-Geophysical Inversion Facility and a 10-m cell modeling mesh. The normalized root mean square error (NRMSE) was 0.0126; the RMSE values were normalized by the data amplitude range. Each prismatic cell was assumed to be characterized by the same magnetic susceptibility value, with the theoretical anomaly considered being the sum of the fields produced by the non-zero susceptibility valued cells. A least square inversion in three dimensions, including topography, involved a model objective function containing only power of 2 norms, favoring a smoother output susceptibility model.
The gravitational field data were processed following the conventional way of first applying diurnal corrections in a similar manner as the magnetic data above, with the difference that point C1 was used as reference (Figure 1). The data were reduced for latitude and height above the sea level, and the Bouguer anomaly was estimated using a density of 2.7 g/cm3, while we did not apply local and detailed terrain corrections as we imported the topography into the 3D inversion scheme. The part of the Bouguer anomaly that enhanced the long-wavelength contributions to the gravity field values was estimated over observation points outside the crater (Jimenez-Munt et al., 2012). Assuming a horizontally layered shallow subsurface surrounding the crater, we extracted the larger-wavenumber residual Bouguer anomaly (Fullea et al., 2008) describing only the crater’s contribution (Figure 2B). Inversion of these data in three dimensions was implemented similar to the magnetic data, using a 10-m prismatic cell mesh in a combination of parameters favoring a smooth output of the subsurface density contrast. The NRMSE was 0.066. The reference density value was the lowest of the study area, corresponding to the shallow subsurface sandy soils characterized by the lowest density value of 1.4 g/cm3.
Processing and inversion of VLF-EM data were implemented using VLFtomo software. The data were filtered using a 3-point moving average smoothing filter for high wavenumber noise removal. Even though, as referenced in the literature (McNeil and Labson, 1991; Telford et al., 1990), the angle of the study line and the propagation direction should be closer to 90° for the receiver to detect strong signals, the strength of the signal must also be checked frequently during acquisition. The VLF-EM instrument used in this study indicates the field strength for each measurement of each one of the three frequencies. The instrument’s directions denote that the field strength of 5 pT (or mgamma) and above is excellent, while lower strength is of lower quality down to 0.5 nT, which is characterized as unacceptable. For the south–north profile, the field strength for 15 KHz, 16 KHz, and 16.4 KHz varied within the ranges of 7pT–18pT, 6pT–11pT, and 2pT–5 pT, respectively, indicating that the first two are the most appropriate to be used in the inversion scheme, as already mentioned in the section above. Analogously, for the west–east profile, the field strength for the three frequencies previously mentioned was 2pT–4pT, 5pT–7pT, and 2pT–3 pT, respectively, indicating only the middle frequency as the most appropriate to be involved in the inversion scheme.
The VLF-EM method is, in general, sensitive to the initial model set before the inversion. A range of 100–1,500 Ohmm with a 200-Ohmm interval was tested as homogeneous half-space initial electrical resistivity models. All of them led to similar electrical resistivity modes after inversion with smoothing constraints, but the initial model of 300 Ohmm produced a lower misfit error between the measured and modeled data (Figure 7). The NRMSE was 0.036 and 0.0409 for the south–north-directed and the west–east-directed profiles, respectively.
3 Results
The models’ resolution varies depending on the geophysical technique used and the station interval. Their resolution in general increases from the natural potential methods to the electromagnetic method from relatively low up to intermediate, respectively, with the main rule being that the targeted subsurface structures can be imaged efficiently when they have a relatively large specific physical property contrast with the surroundings and are larger than their mass center burial depth.
High values of the magnetic field local variation having a magnitude of 450 nT (from -250nT to 200nT) were mapped at the center of the crater, dominating the magnetic data (Figure 2A, dark red and dark blue). Gilder et al. (2018) summarized magnetic characteristics from meteorite impact craters and demonstrated different magnetic responses of five examples. One of these was the Manicouagan (Canada) crater, which, even though is much larger than the Mahout structure (diameter of 90 km), has a center that depicts a similar dipole anomaly (high positive and moderate negative values) that is met when prospecting over metallic targets, assuming induced magnetization effects only at inclinations corresponding to the north hemisphere. This crater’s center consists of a >1-km-thick impact melt sheet and is characterized by titanomagnetite at its deeper level and meta-gabbroic rocks in the center (Eitel et al., 2016). Similar dipolar magnetic anomaly was observed in the Ries impact structure in Germany, while a different explanation of this feature was given by Pohl, 1977 that the negative values of the magnetic field are due to the thermoremanent phenomenon during which the melt adopted the negative magnetic field of the impact season, but no clear explanation was given for the positive values. Still, the Manicouagan crater is much more similar to the Mahout structure, and its interpretation, even though based also on drilling samples, is not definite, and Eitel et al. (2016) denoted that more research is needed. What is definite is the presence of metal-bearing magnetic bodies that induce semi-dipole anomalies (a moderate–low value of the magnetic field force to the north and a high value to the south) in the magnetic field since the inclination is around 72.7°. At Mahout, the inclination is almost 32°, where a magnetic dipole would produce a low magnetic force to the north and an almost equally high magnetic force to the south, as shown in Figure 2A, which means that if we interpret the magnetic anomalies based on induced magnetization, a relatively highly magnetic body exists in the center, probably metal-bearing.
The residual magnetic field data were inverted in three dimensions to acquire the susceptibility variation in the subsurface structure. Moderate susceptibility values (0.03 SI units) to the lower part of the 3D model indicate a bowl-shaped magnetic anomaly (Figure 3, light blue dashed line), which could be related to a possible structurally controlled post-impact hydrothermal alteration led from the deposition of magnetic mineral species (de Oliveira et al., 2022). A highly susceptibility structure was imaged near the center of the crater, with susceptibility values varying from 0.03 SI units up to 0.08 SI units (Figure 3, white dotted lines). This seems to be a highly magnetic body dipping to the north and south (Figure 3, white dotted lines) with uplift at its center, where lower susceptibility values are estimated (Figure 3, light blue arrow). The 3D modeling of the magnetic data indicated that this highly magnetic body has a similar structure to the east–west direction (Figure 4) but not so widely expanded. This high-susceptibility body could be partially attributed to the possible post-melt deposition of magnetic mineral species, as well as the melt itself, and is shown in Figure 5 where iso-surfaces similar to the susceptibility range referred above are only imaged.
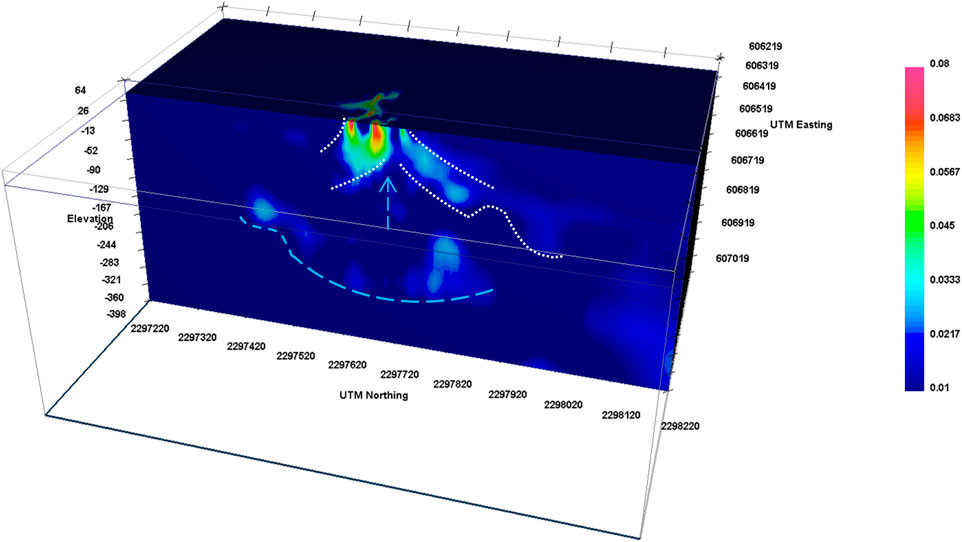
Figure 3. Magnetic method. Three-dimensional model of magnetic susceptibility of the area of the crater. Light blue arrow indicates the uplift, and light blue dashed line indicates the bowl-shaped deeper magnetic anomaly, while dotted white lines indicate a shallow high-magnetic susceptibility body. Color scale is magnetic susceptibility in SI units. View from the north-east.
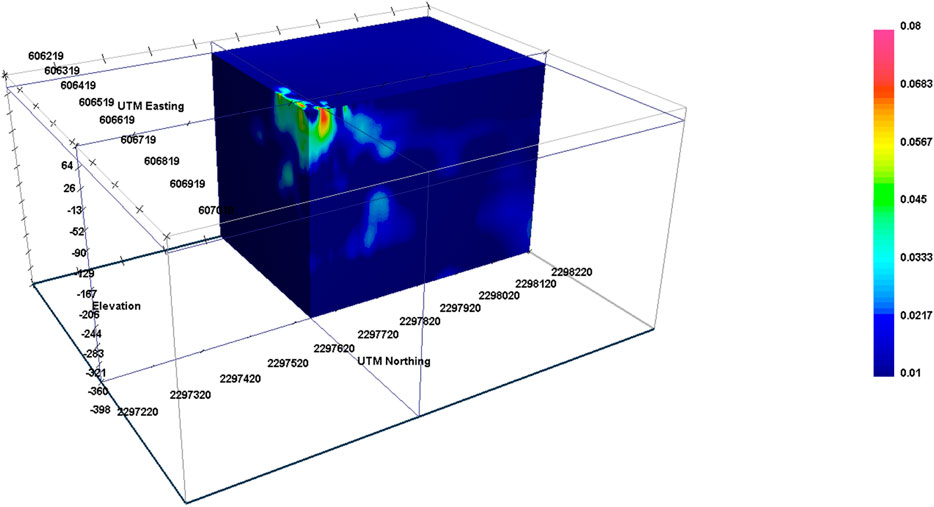
Figure 4. Magnetic method. Three-dimensional model of magnetic susceptibility of the area of the crater. Color scale is magnetic susceptibility in SI units. View from the south-east.
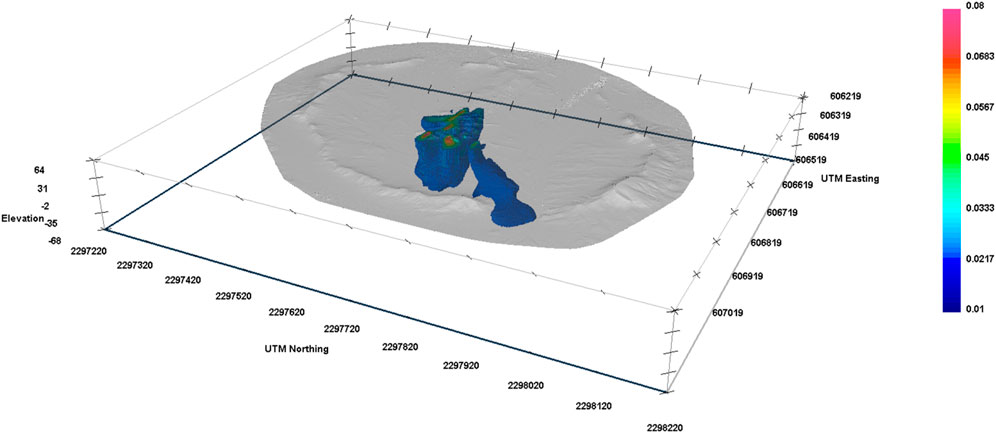
Figure 5. Magnetic method. Three-dimensional model of magnetic susceptibility isosurfaces of 0.025–0.08 SI units of the crater area. Color scale is magnetic susceptibility in SI units. View from the north-east.
The 3D inversion of the residual Bouguer gravity map data (Figure 2B) indicated a density variation of up to 1.9 g/cm3 (density contrast from 1.4 g/cm3 to 3.3 g/cm3; Figure 6). This variation indicates a gradual density increase with depth, due to both the increase in the upper formation pressure with depth and the impact. A low-density sandy formation overlaps the rest of the subsurface structures and is characterized by 1.4 g/cm3–1.8 g/cm3 density (corresponding to dark blue, Figure 6). At the shallower part of the center, it can be observed that the high-susceptibility body dipping to the north and south (Figures 3, 5) is also of higher density at its flanks than the surrounding materials (Figure 6; ∼2 g/cm3–2.5 g/cm3; lighter blue delineated by white dotted lines). The increased density could justify the existence of a melt, which could possibly be composed of both the meteorite and the surrounding material mix. Deeper at the center (lower than −45 m; Figure 6), an increase in the subsurface density indicates a possible aftershock uplift (density values of 2.5 g/cm3–2.9 g/cm3, indicated by light blue arrow). Even though it can be observed that a general semicircle-shaped increase in density with depth from 2.5 g/cm3 up to 3.3 g/cm3 dominates the gravity section (Figure 6, bowl-shaped light blue dashed line), a local density decrease with depth (increase toward the surface) is observed from −200 m and higher (Figure 6, red arrows). This general semicircle-shaped density increase indicates a possible impact effect on the subsurface formations, but the shallower decrease indicates the effect of a possible rebound resulting also in the central uplift. The combination of compression and dilatation is interpreted based on experience with other craters (Klokočník et al., 2020), i.e., compression inside the crater and dilatation toward the limits. The asymmetrical shape of the possible uplift indicates a NE-SW after-impact fault observed in the area (Figure 1) and a possible non-vertical impact.
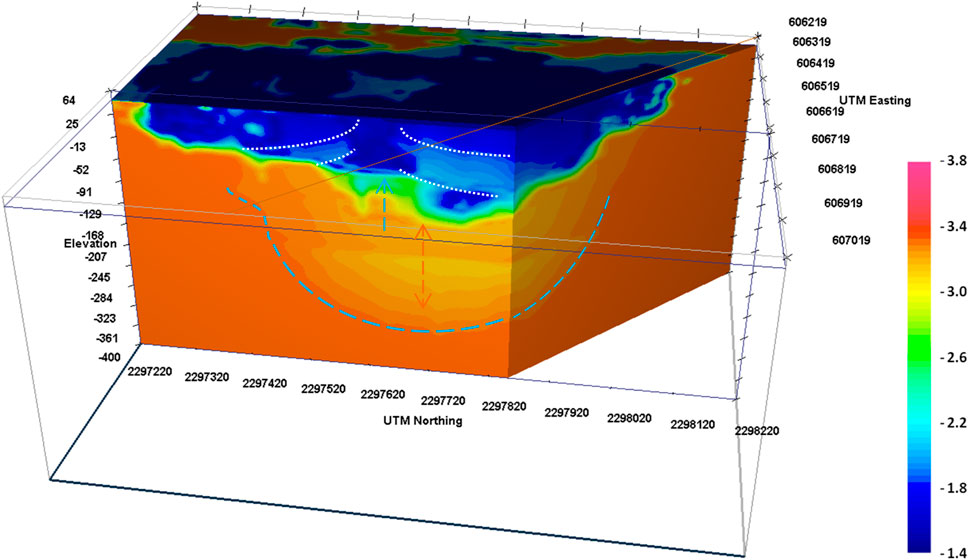
Figure 6. Gravity density model. Color scale is density in g/cm3. Light blue arrow indicates the uplift, while light blue dashed line delineates the bowl-shaped deeper limit of the high-density structure. Green arrows indicate the upward and downward increase of density from −200 m elevation, and dotted white lines indicate the intermediate density values of the possible melt. View from the east.
The VLF-EM data underwent a 2D inversion scheme (data processing). Quesnel et al. (2021) applied electrical methods at the Rochechouart impact structure and found that low resistivity values were due to the presence of melt rich or polymict breccia and impact melt rock, while very low resistivity values due to suevite deposits within the melt (<25 Ohmm) were estimated at the Bosumtwi impact crater by Habimana et al. (2020). The south–north profile (Figure 1, yellow triangles) indicates a similar structure with the magnetic and gravity methods, revealing a shallow low-resistivity structure dipping to the north and south (<40 Ohmm; blue, Figure 7A, white dotted lines) while centered over a structure of intermediate resistivity (150–400 Ohmm, green colors, indicated by light blue arrow), which could be connected to the possible post-impact uplift referred above. This specific structure is also asymmetrical as mapped with the gravity method due to the estimated inclined impact and the visible after-impact fault in the NE-SW direction, passing from the specific profile at approximately 530 m from its origin (Figure 7A, black dashed line). At lower elevation and after the possible uplift, higher resistivity values (>400 Ohmm, light green color) indicate the transition of the uplift down to the base rock. Higher resistivity values (>1,100 Ohmm, yellow to red colors) at the edges of the profile are attributed to the formations of the area (dolomites and shales) covered with ejecta. A similar structure is visible in the west-east profile (Figure 7B), that is, a central intermediate to higher-resistivity value uplift and the lower-resistivity possible melt at the sides. Further to the edges, relatively lower resistivity values (20–50 Ohmm, light blue colors at 100 m and 750 m from the profile origin) are attributed to faults possibly created by the impact, while at 250 m from the study line origin, the low resistivity values are attributed to the aftershock fault (Figure 7B, black arrow; Figure 1, black dashed line).

Figure 7. Electrical resistivity model derived from the inversion of the VLF-EM data. (A) Geoelectrical model of the study line at the middle of the crater in the south–north direction and (B) in the east–west direction. Black dashed arrows indicate the SW-NE fault depicted in Figure 1, and red arrows indicate the intersecting point of the two VLF-EM study lines. Light blue arrow indicates the possible uplift, and dotted white lines indicate the low-resistivity value areas, which coincide with the intermediate density values of the possible melt. Color scale is in Ohmm.
4 Discussion
The Mahout structure was recently suggested as a possible impact crater by Nasir et al. (2023), but further studies are required to enhance this characterization, such as universal stage studies, further analysis of shock features, and geophysical approaches. The present work provides an insight into whether the variation in the physical properties derived from geophysical models can be attributed to an impact crater or not. Mahout’s structure was clearly imaged by the geophysical models, which seem to have a fairly good structural agreement. The general bowl-shaped deeper structure at the geophysical models (Figures 3, 6) enhances the suggestion of a possible impact crater (Nasir et al., 2023). Based on this hypothesis, the bowl-shaped magnetic anomaly could be related to structurally controlled post-impact hydrothermal alteration due to the deposition of magnetic mineral species, and the low resistivity (Figure 7, white dotted lines) and highly magnetic anomaly (Figure 5) could partially or solely be related to the post-impact melt (de Oliveira et al., 2022). The inner edges of the melt magnetic anomaly correlate with the extension of the possible central-crater uplift (Figures 3, 6, 7, blue dashed arrows). The concurrence of the high susceptibility values with the low resistivity values enhances the hypothesis of the sole existence of only induced magnetization at least at the shallow parts of the crater. The density model, even though of relatively low resolution and very small gravity anomaly (from -3 mgals to 4 mgals; Figure 2B), confirms the hypothesis of both the northerly impact direction and a buried possible post-impact uplift of the structure. Still, due to the relatively subtle gravity anomaly, the magnetics are given much more consideration for the integrated interpretation.
Geophysical modeling indicates that the dominating magnetic anomaly is at a depth of no more than 30 m, which rules out post-impact sediments as a source. Even though the bowl-shaped Mahout structure was proposed to be a simple crater (Nasir et al., 2023), the occurrence of a central raised area in the crater is similar to a complex type of impact craters, which are usually >4 km in diameter (Engelhardt, 1997). Based on the geology of the area, as mentioned by Nasir et al. (2023), there is a possibility that in the center, there is a remaining part of erosion. This part is filled with shale, which is easily eroded, and the remaining part is the silica-rich hard part with two rims. The possibility of the existence of a small complex crater still remains and could update the relation between the impact crater size and the impact angle, impactor velocity, and size, which is of great importance in the predictions of crater populations on surfaces of a specific age and is not sufficiently defined yet. Laboratory experiments attempted to link crater size with both the impactor and the target properties, also taking into consideration the existing findings, with an emphasis on complex craters. We must mention that despite the agreement of the geophysical models, regarding the general structure of the subsurface, confirmatory studies such as subsurface studies are needed to enhance the accuracy of these models.
The VLF-EM method does not require contact with the ground, which is an advantage over electrical methods requiring electrodes inserted in the completely dry desert ground. Dry conditions in the subsurface enable the larger penetration depth of the electromagnetic waves, while on the contrary, electrodes with strong contact resistance and large power are required for the electric methods to eject current at a large depth of interest, which, here, is some decades of meters. An alternative to the VLF-EM method could be the transient electromagnetic (TEM) method, which, even though could reach higher depths than the VLF-EM method, is not easily applied in the field (especially under difficult conditions of the desert), needs horizontal transmitter loops not possible on the site’s edges (rims), and is inherently of lower resolution, while the inversion is based on 1D forward modeling, constraining the lateral resolution.
Despite the capability of the VLF-EM method at such areas, this method is prone to several limitations regarding its efficient use, such as the strength of the signal from VLF transmitters. Even though the strength of the signal was discussed above, and no sources of errors are present on the surface, some potential sources of errors due to low conductivity and complex buried structures still need to be discussed. Low conductivity attenuates the electromagnetic signal and constrains the ability to prospect at the desired depth in several cases. Here, the largest depth (skin depth) in the VLF-EM sections of Figure 7 is not the same for their whole length. Depending on the mean resistivity of the models, the depth varies from 60 m to 70 m at the center down to 160 m at the edges, which led to the inability to extend their interpretation not lower than 70 m, especially at areas of lower resistivity, and to also choose almost 130 m as the section’s maximum depth (Figure 7).
Additionally, the VLF-EM method uses electromagnetic radiation of some kHz, which, together with the increased attenuation at some low-resistivity areas, may lead to insufficient imaging of complex structures. Over the years of its applications, this method proved to have satisfactory lateral resolution, especially for good conductors as targets, but limited depth resolution (Beamish, 2000; Oskooi and Pedersen, 2006). The in-depth resolution requires initial resistivity models that are closer to reality, something that it is not always available. Here, trials of several initial models had similar outcome to resistivity models, which indicated that the results can be considered reliable, based also on the fact that the structure is similar to the results of the magnetic and the gravity methods, as well as that the target model should image structures of decades of meters large.
Except gravimetry and seismic methods, which are the most common methods in impact-cratering studies, other geophysical techniques have also been applied depending on the specific target (Pilkington and Grieve, 1992; Tong et al., 2010). The dependence on the survey target involves not only the subsurface structure, which is suspected to be of impact origin, but also the overburden when it exists. The electrical resistivity is a property based on which one can delineate the study of geoelectrical boundaries, which, in their turn, depend on the porosity and moisture content of the subsurface. Tong et al. (2010) showed that lithologic boundaries can be imaged when defined by resistivity changes. This can be especially true in dry environments like the desert at Mahout. Here, it is demonstrated that geoelectric models based on VLF-EM measurements can image lithologic boundaries when combined with other methods like gravity and magnetics. It can be considered a successful application of the VLF-EM method for two reasons. The first is that at areas like the desert, there is limited or no surrounding signal noise from man-made structures, and the second is that the lithologic boundaries can be delineated. The limited noise has an effect on receiving strong signals and on inversion models closer to uniqueness with less dependency on the initial model. So, here, we showed that at relatively small craters of possible impact origin, two commonly used methods, the gravity and magnetic methods in combination with the VLF-EM method, can provide valuable information for both the shallow and deeper parts of the structure and especially in a sandy environment (Hanafy et al., 2022).
The integration of the three geophysical methods used in this work delineated the subsurface structure efficiently in terms of the structure’s general geometrical characteristics. The interpretation presented here follows already justified approaches for similar studies. Impact craters are related to gravity anomalies lower in the center (Figure 2B) due to impact fracturing, basin infill, or impact breccias (Pilkington and Grieve, 1992; Grieve and Osinski, 2011; Grieve and Pilkington, 1996; Klokočník et al., 2022) and a combination of compression and dilatation indicated by an increase and decrease in the outer and inner density in the lower center, respectively (Figure 6) (Klokočník et al., 2022). Magnetic anomalies are, in general, dipolar when far from the poles and equator. Impact craters often produce low magnetic anomalies due to demagnetization by the impact process. Still, there are cases where central uplifts (Pilkington and Grieve, 1992) or metal-bearing centers (Eitel et al., 2016; Gilder et al., 2018) produce long-wavelength anomalies. In the present study, the derived magnetic susceptibility (Figures 3, 4) denotes the possible existence of a metal-bearing structure, like the thick impact melt sheet characterized by titanomagnetite in Manicouagan (Eitel et al., 2016). Resistivity surveys are sensitive to the electrical properties of subsurface formations. Low resistivity values indicate the presence of polymict breccias, or fractured rocks (Tong et al., 2010; Henkel, 1992; Elo et al., 1992), or melt rich rocks (Quesnel et al., 2021), or even due to suevite deposits within the melt, as reported by Habimana et al. (2020) on the Bosumtwi impact crater. Based on the above, here, low resistivity values were interpreted as fractured areas or melt-rich formations (Figure 7). The latter could also be attributed to eroded shale formations observed in the area (Nasir et al., 2023).
The geophysical research proved that more work is needed before drilling, even though the latter is expected to provide more information about the structure. Excavation activities should be avoided at this stage since they will disturb the subsurface structure, which deserves more research. The VLF-EM method is sensitive to lateral resistivity variations, which is why it images similar structures like the other two methods relatively efficiently. Still, this method is extremely dependent on the initial model used for inversion. Gravity data, on the other hand, do not reveal clearly the inner part of the structure, which is why dense geophysical measurements require additional geophysical techniques, such as GPR (Bano et al., 2022) for increased resolution or the TDEM method (Economou et al., 2022; Hanafy et al., 2022) for increased electrical resistivity prospection depth. Furthermore, seismic methods should be applied to image the crater’s centerin detail, and additional geophysical surveys covering a wider area than the crater' s visible extend should be implemented.
5 Conclusion
An integrated geophysical survey was applied on the Mahout structure in the desert in the eastern part of Oman to provide arguments in favor of this structure’s impact origin. Gravity and magnetic methods were used to delineate the bowl-shaped crater and image possible magnetic bodies, respectively. The VLF-EM method was chosen among the electromagnetic and electrical methods with the scope to image the electrical properties of the subsurface, with increased resolution and prospection depth, avoiding, at the same time, any contact resistance problems. The two former geophysical methods are traditionally applied in similar studies, while, here, the performance of the VLF-EM method demonstrates an additional efficient approach in environments with sandy overburden. Overall, the integration of different geophysical methods proved successful in delineating relatively small structures (<1,000 m diameter) buried under loose sandy sediments suspected of impact origin. An observation worth mentioning is that if this structure is an impact crater, the combination of its almost 800-m diameter and a possible buried central uplift does not coincide with the features of today’s typical complex impact craters. The geophysical models are in good agreement with each other in imaging a bowl-shaped buried structure of which the density mainly increases with depth, indicating a possible impact. Local density variations could be attributed to possible impact features like a melt or rebound. The highly magnetic center (0.03–0.08 SI units) was also imaged and coincided with low resistivity values (lower than 40 Ohmm), which could be connected to possible impact melt features. This suspected impact structure has a likely impact origin, and further studies are recommended.
Data availability statement
The raw data supporting the conclusion of this article will be made available by the authors, without undue reservation.
Author contributions
SN: investigation, validation, writing–original draft, writing–review and editing, funding acquisition, project administration, and resources. NE: investigation, validation, writing–original draft, writing–review and editing, data curation, and visualization. KA: investigation, writing–original draft, and writing–review and editing. TA: funding acquisition, investigation, resources, validation, writing–original draft, and writing–review and editing.
Funding
The author(s) declare that financial support was received for the research, authorship, and/or publication of this article. This study was supported by the Deanship of Research Internal grant, Sultan Qaboos University (grant number IG/SCI/ETHS/24/02).
Acknowledgments
The authors thank Mahmood Al Busaidi, Sultan Al Khamisi, Fatma Al Jabri, Bader Al Shaqsi, Arshad Ali, Saad Al Ismaili, Said Al Shamahi, and Al Motamid Al Shabibi for their help in the field work and geophysical survey. The authors acknowledge the UBC-Geophysical Inversion Facility, Department of Earth and Ocean Sciences, University of British Columbia, Vancouver, British Columbia for granting permission to use the GRAV3D and MAG3D codes version 6.0 (2023), developed under the consortium research project “Joint/Cooperative Inversion of Geophysical and Geological data”.
Conflict of interest
The authors declare that the research was conducted in the absence of any commercial or financial relationships that could be construed as a potential conflict of interest.
Publisher’s note
All claims expressed in this article are solely those of the authors and do not necessarily represent those of their affiliated organizations, or those of the publisher, the editors, and the reviewers. Any product that may be evaluated in this article, or claim that may be made by its manufacturer, is not guaranteed or endorsed by the publisher.
References
Atef, A. M. S., Abd El-Gawad, M., Abdel Zaher, K. S. I., and Farag, K. S. I. (2016). The contribution of gravity method in geothermal exploration of southern part of the Gulf of Suez–Sinai region, Egypt. NRIAG J. Astronomy Geophys. 5 (1), 173–185. doi:10.1016/j.nrjag.2016.02.005
Bano, M., Economou, N., Bradford, J., Giannopoulos, A., Klotzsche, A., Slob, E., et al. (2022). GPR data imaging and interpretation — introduction. Geophysics 87 (4). WBi–WBii. doi:10.1190/geo2022-0512-spseintro.1
Beamish, D. (2000). Quantitative 2D VLF data interpretation. J. Appl. Geophys. 45, 33–47. doi:10.1016/s0926-9851(00)00017-3
Chung, H., Ye, W., Vora, S., Rednour, S., and Allee, D. (2016). A passive very low-frequency (VLF) electric field imager. IEEE Sensors J. 16 (9), 3181–3187. doi:10.1109/JSEN.2016.2530741
de Oliveira, M., Tavares Melo, A., and Vasconcelos, M. (2022). 3D magnetic characterization of the Aimorés structure (Brazil) aiming to identify interpretation elements under cover: impact crater or circular intrusion? Interpretation 10, T483–T496. doi:10.1190/int-2021-0105.1
Economou, N., Kritikakis, G., Manoutsoglou, E., and andVafidis, A. (2022). Fast and efficient void detection in carbonates by combined ERT and borehole data: a case study from Chania Airport in Greece. Lead. Edge 41, 322–330. doi:10.1190/tle41050322.1
Economou, N., and Vafidis, A. (2010). Spectral balancing GPR data using time-variant bandwidth in the t-f domain. Geophysics 75 (3), J19–J27. doi:10.1190/1.3374464
Eitel, M., Gilder, S., Spray, J., Thompson, L., and Pohl, J. (2016). A paleomagnetic and rock magnetic study of the Manicouagan impact structure: implications for crater formation and geodynamo effects. J. Geophys. Res. 121, 436–454. doi:10.1002/2015jb012577
Elo, S., Jokinen, T., and Soininen, H. (1992). Geophysical investigations of the Lake Lappajarvi impact structure, western Finland. Tectonophysics 216, 99–109. doi:10.1016/0040-1951(92)90158-3
Engelhardt, W. V. (1997). Suevite breccia of the Ries impact crater, Germany: petrography, 473 chemistry and shock metamorphism of crystalline rock clasts. Meteorit. Planet. Sci. 32, 545–555. doi:10.1111/j.1945-5100.1997.tb01299.x
Fregoso, E., and Gallardo, L. (2009). Cross-gradients joint 3D inversion with applications to gravity and magnetic data. GEOPHYSICS. 74, 31–42.
Fullea, J., Fernández, M., and Zeyen, H. (2008). FA2BOUG-A FORTRAN 90 code to compute Bouguer gravity anomalies from gridded free air anomalies: application to the Atlantic-Mediterranean transition zone. Comput. Geosci. 34, 1665–1681. doi:10.1016/j.cageo.2008.02.018
Gilder, S. A., Pohl, J., and Eitel, M. (2018). “Magnetic signatures of terrestrial meteorite impact craters: a summary,” in Magnetic fields in the solar system. Astrophysics and space science library. Editors H. Lühr, J. Wicht, S. A. Gilder, and M. Holschneider (Cham: Springer), 448, 357–382. doi:10.1007/978-3-319-64292-5_13
Grieve, R. A. F., and Osinski, G. R. (2011). “Impact craters on earth,” in Encyclopedia of solid earth geophysics. Encyclopedia of earth sciences series. Editor H. K. Gupta (Dordrecht: Springer). doi:10.1007/978-90-481-8702-7_174
Grieve, R. A. F., and Pilkington, M. (1996). The signature of terrestrial impacts. AGSO J. Aust. Geol. Geophys. 16, 399–420.
Habimana, E., Acheampong Aning, A., Asare Sarpong, V., Danour, S. K., and Nero, C. (2020). Mapping the subsurface structure of the suevite deposit in the north of the Bosumtwi impact crater using electrical resistivity and seismic refraction tomographies. Ann. Geophys. 63 (2), SE218. doi:10.4401/ag-7752
Hanafy, S. M., Soupios, P., Stampolidis, A., Koch, C. B., Al-Ramadan, K., Al-Shuhail, A., et al. (2022). Comprehensive geophysical study at Wabar crater, Rub Al-Khali desert, Saudi Arabia. Earth Space Sci. 8. doi:10.1029/2020ea001432
Henkel, H. (1992). Geophysical aspects of meteorite impact craters in eroded shield environment, with special emphasis on electric resistivity. Tectonophysics 216, 63–89. doi:10.1016/0040-1951(92)90156-z
James, S., Chandran, R., Santosh, M., Pradeepkumar, A. P., Praveen, M. N., and Sajinkumar, K. S. (2022). Meteorite impact craters as hotspots for mineral resources and energy fuels: a global review. Energy Geosci. 3 (2), 136–146. doi:10.1016/j.engeos.2021.12.006
Jimenez-Munt, I., Fernandez, M., Saura, E., Verges, J., and Garcia-Castellanos, D. (2012). 3-D lithospheric structure and regional/residual Bouguer anomaliesin the Arabia–Eurasia collision (Iran). Geophys. J. Int. 190, 1311–1324. doi:10.1111/j.1365-246x.2012.05580.x
Kenkmann, T. (2021). The terrestrial impact crater record: a statistical analysis of morphologies, structures, ages, lithologies, and more. Meteorit. Planet Sci. 56 (5), 1024–1070. doi:10.1111/maps.13657
Klokočník, J., Bezděk, A., and Kostelecký, J. (2022). “Gravity field aspects for identification of cosmic impact structures on Earth,” in In the footsteps of warren B. Hamilton: new ideas in earth science. Editors G. R. Foulger, L. C. Hamilton, D. M. Jurdy, C. A. Stein, K. A. Howard, and S. Stein, 553, 251–260. doi:10.1130/2021.2553(21)
Klokočník, J., Kostelecký, J., Bezděk, A., Kletetschka, G., and Staňková, H. (2020). A 200 km suspected impact crater Kotuykanskaya near Popigai, Siberia, in the light of new gravity aspects from EIGEN 6C4, and other data. Sci. Rep. 10, 6093. doi:10.1038/s41598-020-62998-6
Li, Y., and Oldenburg, D. (1996). 3-D inversion of magnetic data. Geophysics 61, 394–408. doi:10.1190/1.1443968
Li, Y., and Oldenburg, D. (1998). 3-D inversion of gravity data. Geophysics 63, 109–119. doi:10.1190/1.1444302
McNeill, J. D., and Labson, V. F. (1991). “Geological mapping using VLF radio fields,” in Electromagnetic methods in applied geophysics, 2, applications. Editor M. N. Nabighian (USA: Society of Exploration Geophysicists).
Morgan, J., and Rebolledo-Vieyra, M. (2013). Impact cratering: processes and products. USA: Blackwell Publishing Ltd, 330.
Murty, B., and Raghavan, V. (2002). The gravity method in groundwater exploration in crystalline rocks: a study in the peninsular granitic region of Hyderabad, India. Hydrogeology J. 10, 307–321. doi:10.1007/s10040-001-0184-2
Nasir, S., Economou, N., Al Hooti, K., Al Hosni, T., Spratley, B., and Spratley, S. (2023). The Mahout structure in the central desert of Oman: a possible simple Impact Crater. Geosciences 13, 363. doi:10.3390/geosciences13120363
Neville, A. S., Cook, D. J., Afifi, A. M., and Stewart, S. A. (2014). Five buried crater structures imaged on reflection seismic data in Saudi Arabia. GeoArabia 19, 17–44. doi:10.2113/geoarabia190117
Osinski, G. R., and Pierazzo, E. (2013). Impact cratering processes and products. Wiley—Blackwell Publishing Ltd, 330.
Oskooi, B., and Pedersen, L. B. (2006). Resolution of airborne VLF data. J. Appl. Geophys. 58 (2), 158–175. doi:10.1016/j.jappgeo.2005.06.002
Pilkington, M., and Grieve, R. A. F. (1992). The geophysical signature of terrestrial impact craters. Rev. Geophys. 30 (2), 161–181. doi:10.1029/92RG00192
Pohl, J. (1977). Paläomagnetische und gesteinsmagnetischeUntersuchungenan den Kernen der ForschungsbohrungNördlingen 1973. Geol. Bavarica 75, 329–348.
Pohl, J., Stoeffler, D., Gall, H., and Erns, K. (1977). “The Ries impactcrater, in impact and explosion cratering: planetary and TerrestrialImplications,” in Proceedings of the symposium on planetary CrateringMechanics, flagstaff, ariz., september 13–17, 1976. Editors D. J. Roddy, R. O. Pepin, and R. B. Merrill (New York: Pergamon Press), 343–404.
Portniaguine, O., and Zhdanov, M. (2002). 3-D magnetic inversion with data compression and image focusing. Geophysics 67, 1532–1541. doi:10.1190/1.1512749
Quesnel, Y., Sailhac, P., Lofi, J., Lambert, P., Rochette, P., Uehara, M., et al. (2021). Multiscale geoelectrical properties of the Rochechouart impact structure, France. Geochem. Geophys. Geosystems 22, e2021GC010036. doi:10.1029/2021GC010036
Reynolds, J. M. (2011). An introduction to applied and environmental geophysics. 2nd ed. John Wiley and Sons.
Riller, U., Poelchau, M., Rae, S. P., Schulte, F., Collins, G., Melosh, H., et al. (2018). Rock fluidization during peak-ring formation of large impact structures. Nature 562, 511–518. doi:10.1038/s41586-018-0607-z
Sharma, S. P., Biswas, A., and Baranwal, V. C. (2014). “Very low-frequency electromagnetic method: a shallow subsurface investigation technique for geophysical applications,” in Recent trends in modelling of environmental contaminants (Springer India). Chapter.
Telford, W. M., Geldart, L. P., and Sheriff, R. E. (1990). Applied geophysics. 2nd ed. Cambridge University Press.
Tong, C. H., Lana, C., Marangoni, Y. R., and Elis, V. R. (2010). Geoelectric evidence for centripetal resurge of impact melt and breccias over central uplift of Araguainha impact structure. Geology 38, 91–94. doi:10.1130/g30459.1
Worthing, M. A., and Nasir, S. (2008). Cambro-Ordovician potassic (alkaline) magmatism in Central Oman: petrological and geochemical constraints on petrogenesis. Lithos 106 (1-2), 25–38. doi:10.1016/j.lithos.2008.05.012
Keywords: impact crater, applied geophysics, gravity, magnetics, VLF-EM, 3D inversion
Citation: Nasir S, Economou N, Al Hooti K and Al Hosni T (2024) Imaging the Mahout structure at the Oman desert with the aid of geophysical observations. Front. Earth Sci. 12:1447362. doi: 10.3389/feart.2024.1447362
Received: 11 June 2024; Accepted: 04 November 2024;
Published: 02 December 2024.
Edited by:
Haemyeong Jung, Seoul National University, Republic of KoreaReviewed by:
Sang-Mook Lee, Seoul National University, Republic of KoreaAydın Büyüksaraç, Çanakkale Onsekiz Mart University, Türkiye
Copyright © 2024 Nasir, Economou, Al Hooti and Al Hosni. This is an open-access article distributed under the terms of the Creative Commons Attribution License (CC BY). The use, distribution or reproduction in other forums is permitted, provided the original author(s) and the copyright owner(s) are credited and that the original publication in this journal is cited, in accordance with accepted academic practice. No use, distribution or reproduction is permitted which does not comply with these terms.
*Correspondence: Nikos Economou, bm9pa29ub21vdUB0dWMuZ3I=