 Weiji Sun1
 Xu Qin
 Qiang Liu
- 1School of Mechanics and Engineering, Liaoning Technical University, Fuxin, China
- 2Ordos Institute of Liaoning Technical University, Ordos, China
- 3CCTEG Coal Mining Research Institute, Beijing, China
- 4CCTEG Shenyang Research Institute, Fushun, China
- 5State Key Laboratory of Coal Mine Safety Technology, Fushun, China
To explore the influence of the working face excavation rate on the rock deformation mechanism and seepage characteristics, deformation and seepage tests of sandstone under different loading and unloading stress paths, such as constant axial pressure unloading confining pressure and loading axial pressure unloading confining pressure, were carried out. Particle Flow Code in 3 Dimensions (PFC3D) and Python were used to realize fluid-solid coupling, and numerical simulation calculations were performed along the test path to analyze the influence of the unloading rate on the fine-scale deformation mechanism and permeability characteristics of sandstone, and the relationship between crack type and permeability was obtained. A sandstone fracture mechanics model is established to analyze the stress concentration degree at the end of the branch crack of the test path. The results show that the rate of confining pressure unloading is inversely proportional to the strain. Additionally, permeability correlates with the principal stress difference in an exponential manner. Interestingly, the sensitivity of permeability to stress shows an inverse trend with the unloading rate of confining pressure. Furthermore, there exists a linear relationship between permeability and the number of cracks. During the unloading process, tensile cracks predominate, and the propagation of shear cracks lags behind that of tensile cracks. The proportion of tensile cracks decreases with the increase of the unloading rate when the axial pressure is unchanged but increases when axial pressure is added, resulting in axial compression deformation and expansion deformation along the unloading direction. These research outcomes offer theoretical insights for the prudent selection of mining rates, and they hold significant implications for mitigating water inrush disasters in deep mining operations.
1 Introduction
The gradual development of deep mineral mining, which puts the deep rock body under high geostress and osmotic pressure (He et al., 2005; Huang et al., 2019; Tan et al., 2021; Zhang et al., 2022; Huang et al., 2023a; Huang et al., 2023b; Gao et al., 2023; Tan et al., 2023), has resulted in a high occurrence frequency of geologic hazards with complex mechanisms. These may subsequently lead to strong, sudden water surges and sustained, large deformations of the rock body, among other effects (Liu et al., 2023a). In deep mining engineering, the radial stress (i.e., the confining pressure) on the rock layer gradually decreases during mining, whereas the stress perpendicular to the excavation (i.e., the axial pressure) is increased by the excavation disturbance in part of the rock layer (Xie et al., 2012; Tan et al., 2017; Huang et al., 2020; Zhu et al., 2021; Luo et al., 2022). This modifies the pore and fissure structure of the rock body, and leads to changes in its permeability that may induce peripheral rock disasters, such as water surges and the instability of the surrounding rock (Xie et al., 2015; Zhu et al., 2018; Liu et al., 2022; Zheng et al., 2022; He et al., 2023). The changes in the pore and fissure structure of the rock body are affected by both the stress magnitude and extraction rate. Therefore, studying the deformation mechanism and permeability characteristics of rock under the influence of the unloading rate could enable the prevention and control of disasters.
A series of studies on the deformation and infiltration characteristics of rock bodies under unloading have been conducted, with abundant research results. The unloading mechanical test has been used to consider the effects of the magnitude of the confining pressure and unloading rate on the mechanical properties of the rock (Qiu et al., 2010; Deng et al., 2016; Tan et al., 2019; Wang et al., 2019; Tan et al., 2020; Zhao et al., 2021; Fengda et al., 2022; Liu et al., 2023; Ma et al., 2023), and it has elucidated the deformation and damage characteristics of sandstone specimens under different confining pressures (Alam et al., 2014; Takeda and Manaka, 2018; Wu et al., 2023; JI et al., 2023; Kozhevnikov et al., 2023). Chen et al. (Chen and Feng, 2006) demonstrated that the unloading damage of rock under high stress conditions includes tensile damage, shear damage, and tensile-shear damage using an unloading test. Li et al. (Li et al., 2022) investigated how the unloading effect of excavation affects the mechanical properties of rock under high stress conditions by employing triaxial loading and unloading tests. The deformation of rocks during unloading has been shown to be closely associated with their infiltration characteristics (Yin et al., 2015; Yuan and Zhang, 2017; Zhang et al., 2019). Chen et al. (Chen et al., 2018) conducted an experimental study on the deformation characteristics and infiltration evolution of rocks under confining pressure unloading conditions, and they found that confining pressure unloading is a process of cumulative damage and strength deterioration. Moreover, Yu et al. (Yu et al., 2014) investigated the permeability law and acoustic emission characteristics of rock samples during deformation and damage from unloading confining pressure. Further, Wang et al. (Wang et al., 2023) investigated the effects of the initial confining pressure and unloading rate on the deformation characteristics and permeability evolution of sandstone.
Considerable effort has been directed toward studying the deformation and permeability characteristics of the rock body under unloading rates at the macroscopic level (Huang et al., 2018; Chi et al., 2024; Cui et al., 2024; Shi et al., 2024). Owing to the limitations of indoor experiments, further exploration of the deformation mechanism and permeability characteristics of highly stressed rocks under different stress unloading rate paths at a fine-scale level is necessary (Song et al., 2017; Song et al., 2020; Huang et al., 2022; Song et al., 2022; Wu et al., 2023; Liu et al., 2023c; Sun et al., 2024). Using particle flow discrete element software facilitates the study of internal changes and permeability characteristics of rocks under complex stress paths from a fine-scale perspective. Wang et al. (Wang et al., 2014) used a particle flow code (PFC) fluid-solid coupling model to simulate the hydraulic fracture extension process, thereby verifying the reasonableness of the PFC fluid–solid coupling model. Zeng et al. (Zeng et al., 2018) improved this fluid-solid coupling algorithm to study the permeability evolution behaviors of rocks. Bian et al. (Bian et al., 2020) used PFC to simulate the damage characteristics of shale under unloading conditions with different water absorption times. Conversely, Rong et al. (Rong et al., 2022) used PFC to simulate the mechanical properties and damage mechanisms of granite under different stress unloading paths. Liu et al. (Liu et al., 2023) further simulated the initial seepage, damage seepage, and seepage evolution of shale under stress by using an improved three-dimensional PFC fluid-solid coupling model.
An in-depth study of the deformation characteristics and permeability properties of the rock mass during unloading is a prerequisite to the accurate prediction of the safety of the surrounding rock. There are many research results on the deformation and failure test of rock under confining pressure unloading rate, but there are few reports on the influence of confining pressure unloading rate on rock permeability evolution and deformation under high osmotic pressure. In addition, it is not clear to analyze the deformation mechanism and permeability characteristics of rock under confining pressure unloading rate from macro and micro perspectives by using particle flow software. Therefore, this paper carried out the test of confining pressure unloading rate under high osmotic pressure, and used particle flow software to study the permeability coefficient and meso-deformation of sandstone during the test. To gain a deeper understanding of the mechanical behavior of a highly stressed rock mass under different confining pressure unloading rates, this study aims to analyze the effects of confining pressure unloading rates on the deformation and permeability characteristics of a rock mass under a constant axial pressure (loading) path. The effects of confining pressure unloading were explored from both macroscopic and microscopic viewpoints via indoor experiments and numerical simulations of granular flow with different stress paths (Liu et al., 2020a; Liu et al., 2020b; Liu et al., 2020c).
2 Materials and methods
2.1 Sample preparation
Samples were taken from the Xin’an mine. A sandstone rock mass was collected from the study area and cored to obtain standard cylindrical specimens with a diameter of 50 mm and height of 100 mm. Each sandstone rock sample was processed with a test precision that conformed to the “Standard for Experimental Methods for Engineering Rocks” (GB/T 50266-2013) and was prepared as shown in Figure 1. Then the wave velocity test of the sample was carried out by using the DS5 full information acoustic emission analysis device of Beijing Soft Island Time Technology Co., Ltd., and the samples with similar wave velocity were selected for the test.
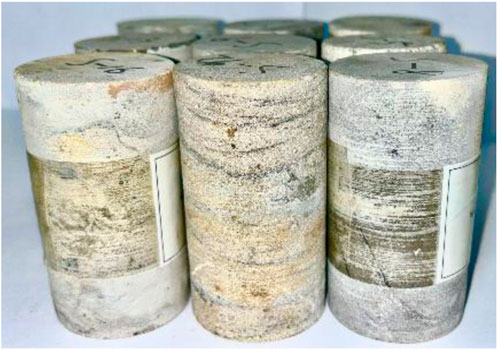
Figure 1. Sandstone specimens.
2.2 Test system
Experiments were carried out on an independently developed coal rock variable-rate loading system. As shown in Figure 2, the system consisted of confining, osmotic, and axial pressure control devices, a data acquisition device, and a seepage device. This experimental system could perform permeability experiments on sandstone under variable stress loading and unloading rate conditions. The confining pressure loading system is mainly composed of a TC-100 double-cylinder constant-speed constant-pressure pump, and its allowable working pressure is 70 MPa. The device can effectively control the loading and unloading rates of confining pressure. The allowable confining pressure of the triaxial seepage device is 40 MPa, and the axial pressure is 100 MPa.
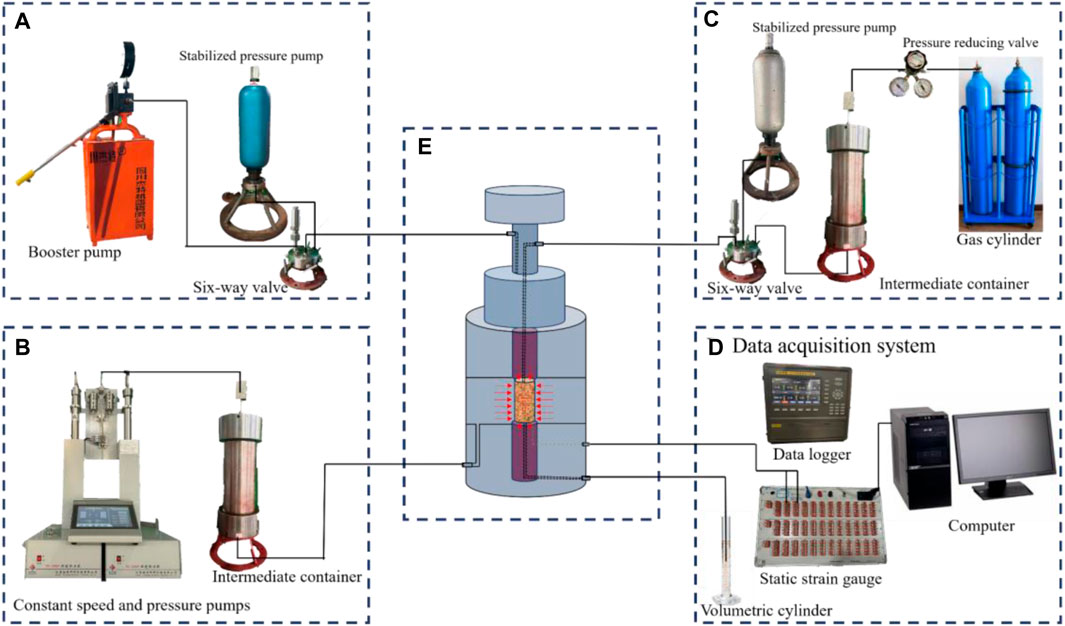
Figure 2. Coal rock variable-rate loading system. (A) Axial pressure control device; (B) Osmotic pressure control device; (C) Confining pressure control device; (D) Data acquisition device; (E) Seepage device.
2.3 Test methods and procedures
There are two states of vertical stress concentration and vertical stress release near the coal wall. When it is transmitted to the coal seam floor, a compression zone, com-pression-shear failure zone, and tension-shear failure zone are produced are shown in Figure 3. The compression zone is in the stress state region where both axial stress and lateral stress increase. The compression-shear failure zone is the stress state area where the axial stress increases and the lateral stress decreases. The tensile-shear failure zone is a stress state area where the axial stress decreases slightly or remains unchanged and the lateral stress decreases.
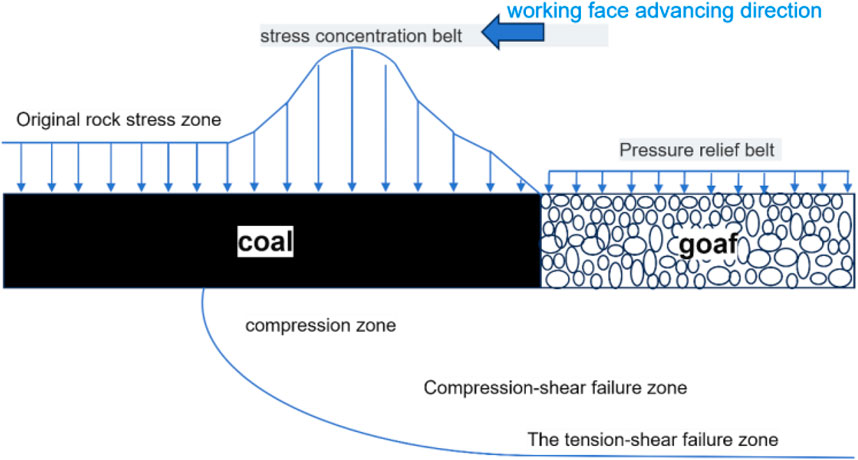
Figure 3. Mining failure zone of deep coal seam floor.
To analyze the deformation mechanism and permeability characteristics of rock under the action of the heading rate of the working face in combination with the stress distribution characteristics of the floor in the compression-shear failure zone and tension-shear failure zone, the corresponding stress path is designed, as shown in Figure 4. Path 1 involved constant axial pressure with the confining pressure unloaded at different unloading rates, whereas Path 2 included loading axial pressure with the confining pressure unloaded at different unloading rates (1:1, 1:5, and 1:10 loading and unloading ratios).
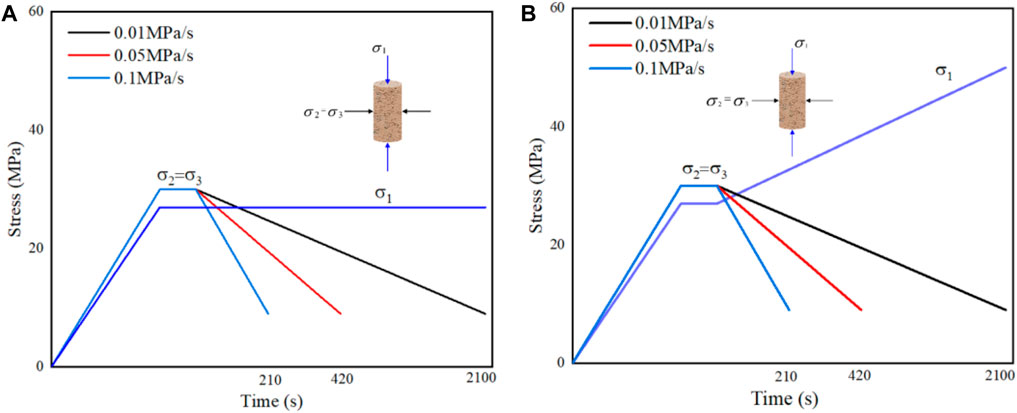
Figure 4. Loading and unloading paths. (A) Path 1: Constant axial pressure and unloading confining pressure; (B) Path 2: Loading axial pressure and unloading confining pressure.
To simulate the stress environment to which the rock is subjected, the confining and axial pressures were alternately loaded to 30 MPa and 27.5 MPa, respectively. Because the greatest threat to coal seam mining is the ordovician limestone water pressure, which is 6.11 MPa, the seepage water pressure in the experiment is set to 6 MPa. Experiments were carried out according to the loading and unloading paths described in Figure 3, following the experimental steps listed below.
(1) The specimen was sealed with a heat-shrinkable sealing sleeve and placed in a self-developed triaxial permeability test device, as shown in Figure 2, to verify the airtightness of the device.
(2) Using a double-cylinder drive pump and a hydraulic pump, the axial and confining pressures were alternately loaded to 27.5 MPa and 30 MPa, respectively. Once the pressure in the experimental system was stabilized, the valve was opened to apply pore pressure at a predetermined pressure value.
(3) The double-cylinder drive pump was used to unload the confining pressure at a rate of 0.01 MPa/s. The hydraulic pump constant (loaded) axial pressure was recorded every 30 s, downstream of the emergence of the fluid. When the confining pressure was unloaded to 9 MPa, the experiment was terminated (the confining pressure was always greater than the permeate pressure to ensure that fluid did not flow from the gap between the rock samples and the rubber sleeve of the grippers).
(4) Steps one to three were repeated for each axial pressure loading rate and confining pressure unloading rate combination listed in Table 1.
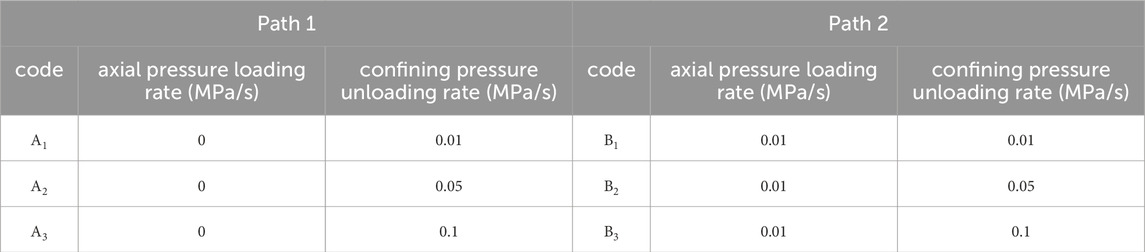
Table 1. Stress loading and unloading rates.
In this study, the steady-state method was used to test the permeability of sandstone, with the following control equation:
where Q is the fluid flow rate, L is the length of the rock sample, P0 is the standard atmospheric pressure, μ is the fluid viscosity, A is the area of the specimen end face, and P1 and P2 are the inlet and outlet pressures, respectively.
2.4 Numerical simulation model and validation
A numerical simulation of triaxial permeability was carried out using particle flow numerical software to establish a numerical model, as shown in Figure 5. The resulting model was a cylinder with a diameter of 50 mm and a height of 100 mm. Stress was applied to a preset value under the control of a servo wall with axial pressure loading realized by the face-to-face motion of the upper and lower servo walls. Conversely, confining pressure unloading was realized by the reverse motion of the cylindrical servo wall.
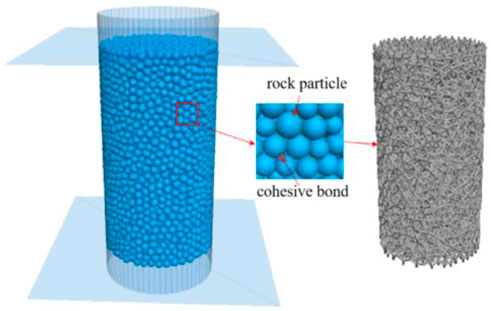
Figure 5. Numerical modeling.
The parallel bonding model, which has fine mechanical parameters, was selected as the contact model. The calculated macro-mechanical parameters of the specimen were compared with the indoor test results, after which the fine mechanical parameters were adjusted. Then, a set of parameters was determined to ensure consistency between the simulation and test results. These parameters were used for the subsequent simulation calculations. To determine reasonable microscopic parameters for calibration, the 50 × 100 mm cylinder model was established for uniaxial compression and compared with the indoor uniaxial compression experiments. Table 2 shows the resulting model macro and microscopic parameters using the trial and error method.
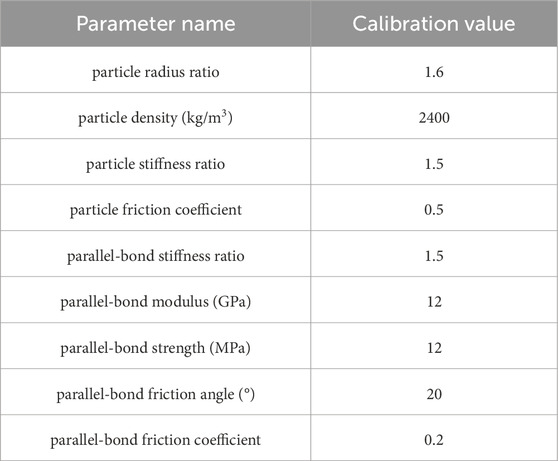
Table 2. Model mesoscopic parameters.
Figure 6A shows a comparison of the results between the model simulation and experiments. The simulation results are biased because the numerical model has difficulty accounting for the initial defects of natural rock samples. Owing to the existence of natural microcracks inside the sandstone specimens, the experiments curve shows a nonlinear growth in the compaction stage. In contrast, the contact between particles is uniform in the simulation, and its curve shows a linear growth. Nevertheless, the peak strength, elastic modulus, and damage morphology of sandstone obtained by the test and simulation are mostly consistent. Thus, it is reasonable and feasible to carry out numerical tests for the fine-grained parameters presented in Table 2. The steady-state method was implemented to analyze the permeability of sandstone using the FiPy library in Python to establish the flow field. Subsequently, the Fish module of particle flow was used to establish the particle model, and the Python interface in the particle flow was used to carry out the exchange of parameters between the flow field and particles. In the seepage test model, the upper and lower boundaries of the model are set as the water pressure boundary, and the seepage direction is guaranteed to be top-down, owing to the setting of the water pressure difference. The surrounding boundary is an impermeable symmetrical boundary, and the moving speed of the boundary is set to apply confining pressure to the sample. The top of the model applied inlet permeability water pressure of
where
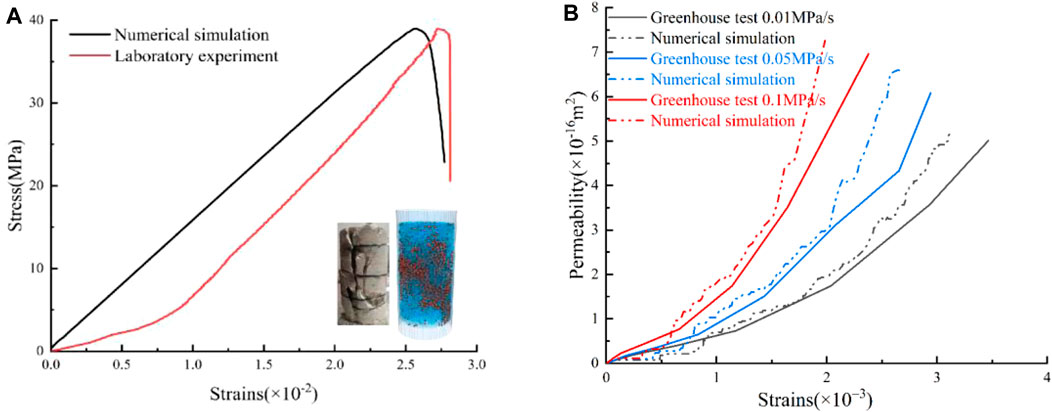
Figure 6. Comparison between the experiment and simulation results. (A) Comparative stress-strain curves for uniaxial compression experiments; (B) Comparative permeability-strain curves under Path 1. Simulated results are represented by dashed lines.
The permeability of the model specimen, denoted
The simulation test only considers the case of single-direction penetration, and the pressure gradient changes only in the direction of seepage. In the grid, the drag force act-ing on the particles is calculated by Equation 4:
where
The seepage module is calculated by solving the basic equation of seepage, and the basic equation of seepage stability is as follows:
where
The calculation of the fluid affected by the particles in the grid is completed by the following formula:
where
Figure 6B shows a comparison between the simulated and experimental strain-permeability curves under Path 1. The simulated permeability is the real-time dynamic permeability. Hence, it differs from that of the laboratory experiments. Due to the existence of natural micro-cracks in the sandstone specimen, the permeability of the experimental curve in the early stage shows that the permeability of the experimental value is greater than that of the numerical simulation. As the sandstone specimen is loaded and deformed, the pore structure may change significantly, such as the deformation, closure or local collapse of the pore, which will lead to the decrease of the actual permeability. The initial stage of the permeability value of the sandstone test is greater than that of the numerical simulation may be due to the advantages of the pretest conditions, while the permeability after the test is less than that of the numerical simulation is mainly due to the change of pore structure and seepage path caused by loading. However, as the numerical results were in good agreement with those of the experiments, the numerical model was able to approximately simulate the fine-grained deformation and permeability characteristics of sandstone under the effects of the confining pressure unloading rate in the indoor experiments.
3 Results
3.1 Sandstone axial strain curves
The variability in the unloading rate led to different sandstone axial strains with two distinctive curves. As shown in Figures 7, 8, a slow growth stage and a stable growth stage were observed in the early stage of confining pressure unloading in Paths 1 and 2, respectively. Owing to the axial tensile state caused by the pre-stress loading process, the strain response of the early stage of the confining pressure unloading was lagged. Thus, the strain growth was slow, leading to a more evident lag in the strain response with the increasing unloading rate. In the middle and late stages of confining pressure unloading, the difference between the principal stresses gradually increased as the confining pressure was continually unloading, resulting in the axial strains showing a stable growth tendency.
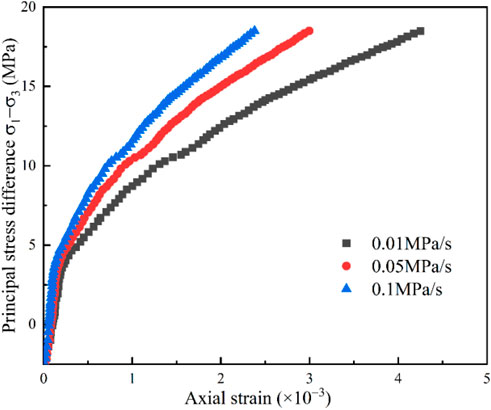
Figure 7. Principal stress differential-axial strain curve under Path 1.
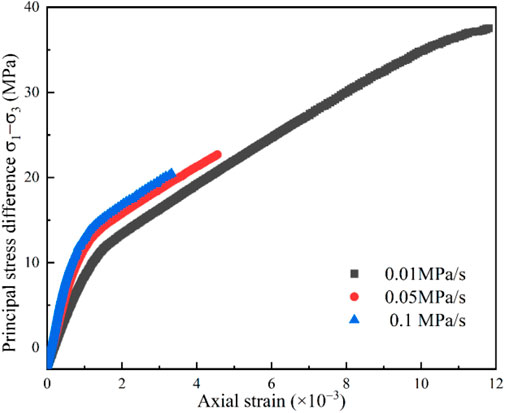
Figure 8. Principal stress differential-axial strain curve under Path 2.
Figure 9 shows that the axial strain in Path 2 is larger than that in Path 1 under an equal unloading rate, and this is mainly because the increase in axial pressure during unloading in Path 2 provided more energy during sandstone deformation. In Path 1, the peak strains corresponding to the 0.05 and 0.1 MPa/s confining pressure unloading rates were reduced by 29.5% and 44%, respectively, compared with the strains at 0.01 MPa/s. In Path 2, the peak strains corresponding to the 0.05 and 0.1 MPa/s confining pressure unloading rates were reduced by 61.5% and 71.8%, respectively. These results indicate that the increase in the unloading rate leads to a decrease in the strength and plastic strain of sandstone and the axial strain change, with the magnitude of change gradually decreasing.
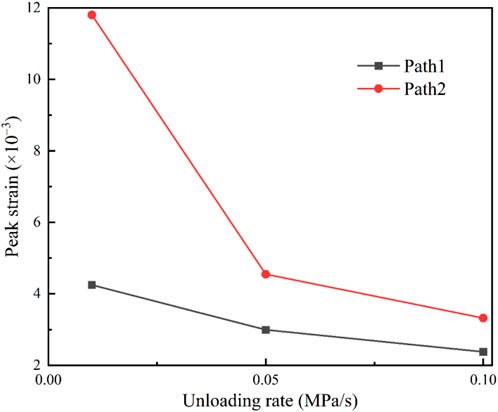
Figure 9. Peak strain curves as functions of the unloading rate.
3.2 Sandstone permeability curves
Figures 10, 11 present the permeability change curves. The relationship between the permeability and principal stress difference under the unloading rates of confining pressure satisfied the exponential function
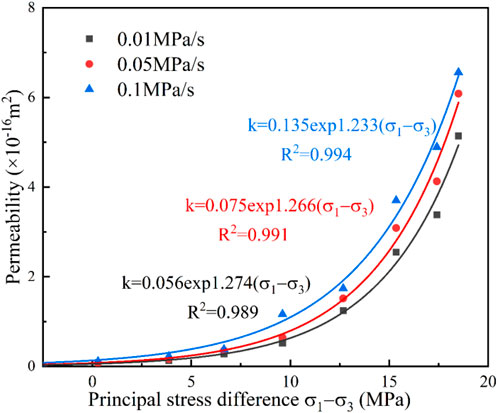
Figure 10. Permeability-differential principal stress curves in Path 1.
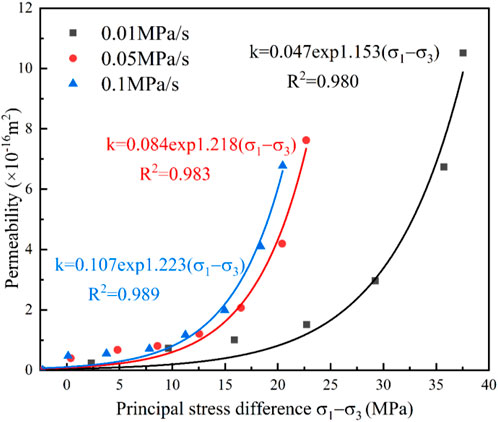
Figure 11. Permeability-differential principal stress curves in Path 2.
As shown in Figure 12, in Path 1, the peak permeability with unloading rates of 0.05 MPa/s and 0.1 MPa/s increased by 18.4% and 27.6%, respectively, compared with that under a 0.01 MPa/s rate. The confining pressure inhibited the emergence, expansion, and penetration of cracks, thereby preventing the internal fissures of sandstone from increasing and blocking the expansion of seepage channels. Thus, when the difference of principal stresses was the same, the permeability increased with the increase in the unloading rate of the confining pressure. In Path 2, the permeability with unloading rates of 0.05 MPa/s and 0.1 MPa/s decreased by 54% and 27.5%, respectively, compared with that under a 0.01 MPa/s rate, which is affected by the loading axial pressure. As the unloading rate of the confining pressure increased, the difference of the principal stresses decreased, and permeability showed a decreasing tendency.
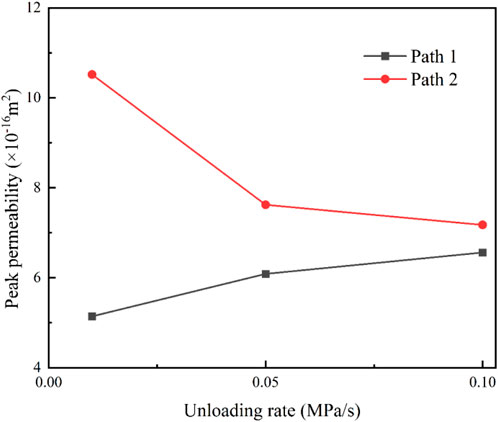
Figure 12. Peak permeability curve under the effect of the unloading rate.
3.3 Numerical study of particle flow
3.3.1 Microscopic crack analysis during unloading
The particle flow numerical simulation program can automatically monitor the particle displacement, velocity, permeability coefficient, and force of the bonding contact. Microcracks are considered to arise from parallel bonding contact failure and are classified into shear and tension cracks when performing a fine-scale simulation of the damage process of the rock. Figures 13, 14 show the statistics associated with the number of internal microcracks and proportion of different types in the deformation process for the numerical model under different unloading rates.
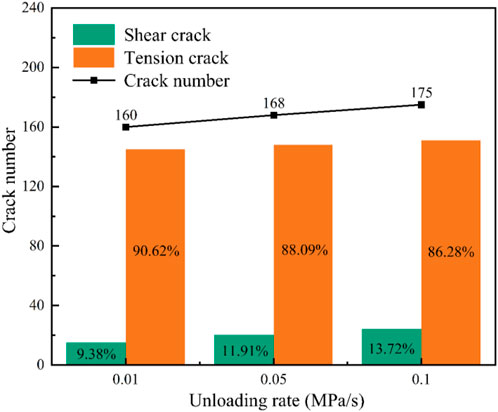
Figure 13. Crack type percentage statistics in Path 1.
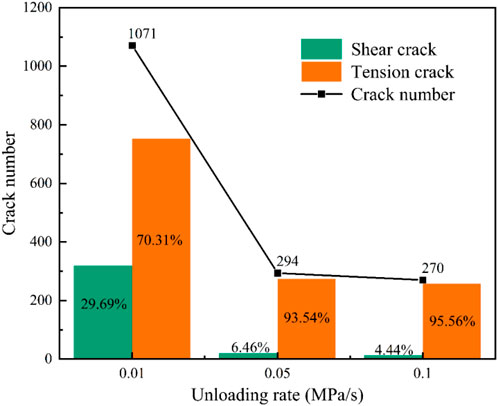
Figure 14. Crack type percentage statistics in Path 2.
The total number of internal microcracks in sandstone in Path 2 was larger than that in Path 1, suggesting that loaded axial pressure promotes internal sandstone crack development and expansion more intensely. The inhibitory effect of the confining pressure on the internal cracks of the rock was rapidly weakened with an increase in its unloading rate, and the internal microcracks and pores were more likely to expand and open. In Path 1, the model showed an increase in the total number of cracks with the increase in the rate of unloading confining pressure as well as an increase in the ratio of shear cracks within the specimen. Contrastingly, in Path 2, a decrease in the number of cracks and a reduction in the ratio of internal shear cracks in the specimen were observed with the increase in the rate of unloading confining pressure. The results observed in Path 1 are attributed to the effect of axial pressure loading. In Path 2, as the ratio of the confining pressure unloading rate to the axial pressure loading rate increased (1:1, 5:1, and 10:1), the loaded axial pressure decreased, and the difference in the principal stresses decreased.
The particle flow numerical model can monitor the real-time spatial information of internal microcracks in the sandstone model during unloading deformation. Figure 15 shows an example of a 1:1 ratio of the axial pressure loading rate to the confining pressure unloading rate in Path 2. The distribution of microscopic cracks in the model was investigated when the confining pressure was unloaded at different proportions during the deformation process. As shown in Figure 15, when the confining pressure was unloaded at 70%, tensile cracks in the sandstone started to appear, scattered inside the rock. When the confining pressure was unloaded at 60%, the microcracks inside the rock were concentrated at the two ends of the specimen, and shear cracks started to appear. When the confining pressure was unloaded at 50%, the microcracks inside the rock expanded from the two ends to the middle of the specimen. When the confining pressure was unloaded at 40%, the microcracks penetrated the rock, and the tensile cracks spread out in the main body. Finally, when the confining pressure was unloaded at 30%, the shear cracks were distributed in the main rupture surface, whereas the tensile cracks formed a macro-damage surface. Therefore, the microcracks formed during the unloading process were mainly tensile cracks, and the expansion of shear cracks lagged behind that of the tensile cracks. The distribution of sandstone cracks in the indoor experiments was similar to the expansion of the sandstone model cracks, which showed tensile-shear composite damage.
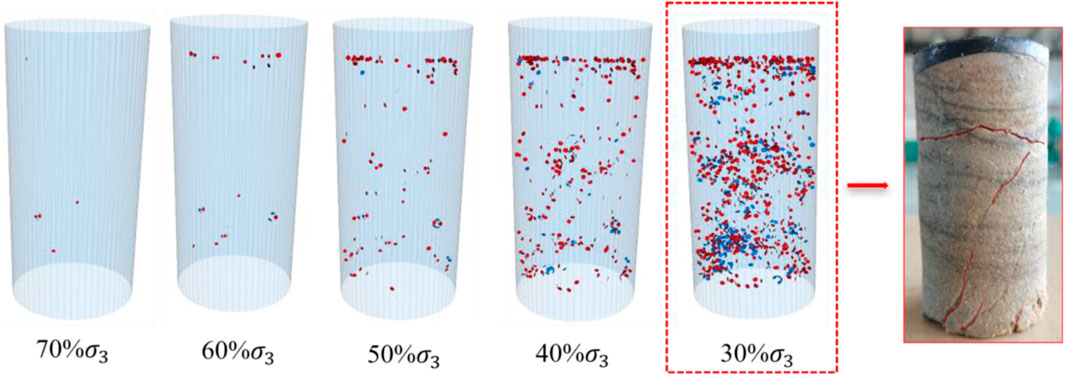
Figure 15. Fine-scale crack evolution under a confining pressure unloading rate of 0.01 MPa/s in Path 2. Red and blue represent tensile and shear cracks, respectively.
Figures 16, 17 show the relationship between the axial strain and number of cracks during the deformation process of the sandstone model. Under the same unloading conditions, the growth trend of microcracks with increasing strain was the same for both models. At the early unloading stage, the microcrack curve was approximately horizontal, with almost no microcracks inside the model. The larger the unloading rate was, the shorter this stationary phase was. In the middle stage of unloading in Path 1, the cracks showed stepwise growth with an increasing axial strain. In the late stage of unloading in Path 1, the microcrack curve was approximately linear, and its slope increased with the increase in the unloading rate. However, in Path 2, the cracks showed nonlinear growth with the increase in axial strain in the middle and late stages of unloading.
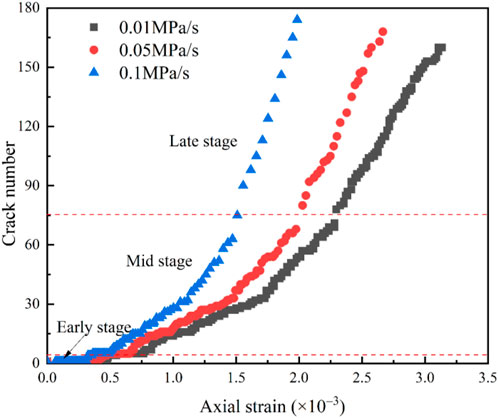
Figure 16. Number of microscopic cracks as a function of the axial strain in Path 1.
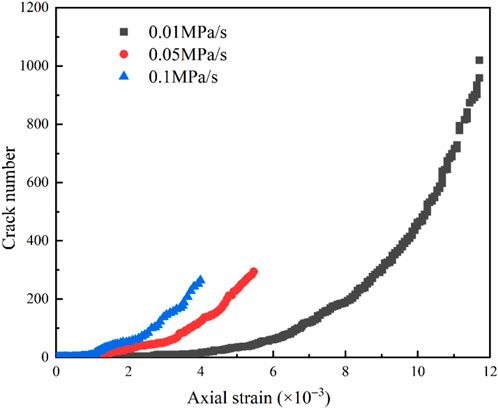
Figure 17. Number of microscopic cracks as a function of the axial strain in Path 2.
3.3.2 Relationship between acoustic emission (AE) events, cracks, and permeability
The particle flow program can obtain and record information, such as cracks generated by interparticle contact fractures, that can accurately respond to the damage and crack evolution information of sandstone during the unloading process. AE events were simulated by counting the number of cracks using the Fish command. Figures 18A–F show the variation curves of the strain and principal stress difference, permeability, crack number, and AE events for the sandstone model under Paths 1 and 2, respectively. In Figure 18, the curves of the principal stress difference, permeability, crack number, and AE events show good correspondence under different confining pressure unloading rates and can be divided into three stages.
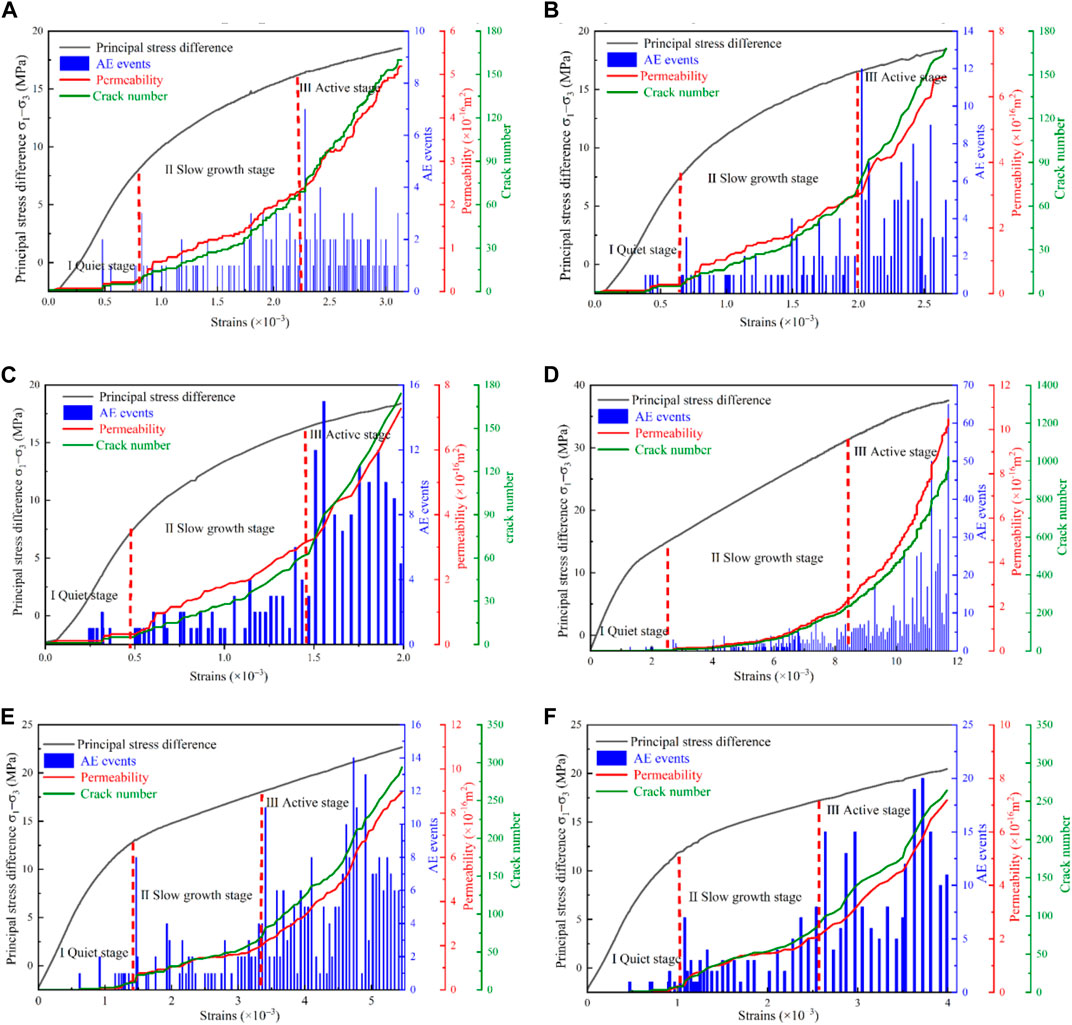
Figure 18. Principal stress difference, permeability, crack number, and acoustic emission (AE) events as a function of the axial strain under different confining pressure unloading rates: (A) Path 1, confining pressure unloading rate of 0.01 MPa/s; (B) Path 1, confining pressure unloading rate of 0.05 MPa/s; (C) Path 1, confining pressure unloading rate of 0.1 MPa/s; (D) Path 2, confining pressure unloading rate of 0.01 MPa/s; (E) Path 2, confining pressure unloading rate of 0.05 MPa/s; (F) Path 2, confining pressure unloading rate of 0.1 MPa/s.
In the early stage of confining pressure unloading, the principal stress difference was small, the axial strain increased slowly, fewer cracks were produced, the permeability did not change significantly, and the AE events were low. In the middle stage of confining pressure unloading, under the joint pore pressure and axial pressure, the internal cracks of the sandstone model started to develop and produce new cracks. The permeability and cracks started to slowly increase, and AE events showed gradual activity with slow growth. In the middle and late stages of confining pressure unloading, the model expanded along the unloading direction, the internal microcracks grew, AE event peaks appeared and entered an active state, and the permeability and cracks increased significantly.
AE signals reflect changes in the internal structure of a model, whereas permeability changes are determined by changes in the internal structure. In Path 1, the peak values of AE events, corresponding to unloading rates of 0.01, 0.05, and 0.1 MPa/s, were 7, 12, and 15, respectively, and they increased with the increase in the unloading rate. In Path 2, which is more affected by axial pressure loading, the peaks of the AE events corresponding to unloading rates of 0.01, 0.05, and 0.1 MPa/s were 50, 14, and 20, respectively. Therefore, the activity of AE events decreased with the increase in the confining pressure unloading rate, with its peaks first decreasing and then increasing. The evolution of permeability and cracking corresponded well with the active degree of AE events, indicating that the changes in permeability and cracking inside the rock could be reflected by AE events. Hence, AE signals may be monitored to infer the mechanical and permeability properties of a rock body during engineering excavation and mining.
4 Discussion
4.1 Analysis of deformation mechanism under the action of unloading rate
In order to analyze the deformation mechanism of sandstone under different loading paths, a fracture mechanics model is constructed for the fractured rock body, assuming that there is a crack of length 2a within the unit length of the rock mass, that under the joint action of the axial pressure σ1 and peripheral pressure σ3 (Feng-da et al., 2016), a branch crack of length l is generated, and that the stress concentration degree of the end of the branch crack is analyzed under the action of unloading and loading so that the unloading and deformation characteristics of the rock body can be revealed to provide a reference, as is specifically shown in Figure 19.

Figure 19. Schematic of branch crack extension during unloading.
The effect of seepage water pressure is expressed by the parameter
where:
The shear stress τ_ⅇ is calculated as shown in Equation 8:
According to fracture mechanics, the stress intensity factor K1 (He et al., 2023) will be the stress intensity factor at the crack end when the crack end is subjected to tensile stress, as shown in Equation 9:
Under the action of shear stress τ, the branch crack produces tensile deformation perpendicular to the airfoil crack, while the horizontal stress σ3 restricts the tensile deformation of the crack. Combining Equations 7–9, the stress factor K1 at the end of the crack face in the biaxial state of stress is calculated as shown in Eq. Equation 10:
where f is the friction factor of the cracked surface of the rock mass.
The increase of the principal stress difference under the condition of loading axial pressure unloading perimeter pressure (path 2) is larger than that of constant axial pressure unloading perimeter pressure (path 1). Equation 10 shows that under the condition of the same rate of perimeter pressure unloading, loading axial pressure easily increases the increment of the principal stress difference, and the stress concentration coefficient of the ends of cracks is bigger than that of the path of constant axial pressure. Hence, it is easier for the rock samples to be damaged during the process of unloading, and the number of cracks reflected in the conditions of Path 2 is much larger than that of Path 1. Under the conditions of Path 1, with the continuous increase of the unloading rate of the peripheral pressure, the vertical stress of the crack surface decreases while the shear stress of the crack surface increases, which leads to the rock body being more prone to shear damage, which is reflected in the increase of the percentage of shear cracks with the increase of the unloading rate of the peripheral pressure. The percentages of shear cracks are 9.37%, 11.91%, and 13.72% at the peripheral pressure unloading rates of 0.01, 0.05, and 0.1 MPa/s, and the damage deterioration of speed, tensile cleavage is locall the rock samples increases subsequently. Under the conditions of Path 2, with the increase of the perimeter pressure unloading rate, the loaded axial pressure increment decreases, and the vertical stress on the crack surface decreases, but is much larger than that of Path 1, which results in the rock body being prone to tensile shear composite damage.
4.2 Mechanisms of fine-scale deformation in sandstone owing to the unloading rate
Figure 20 shows the velocity distributions of the model particles under different stress paths. Under Path 1, the particle motions were mainly dominated by the radial unloading direction, as shown in Figures 20A–C. Simultaneously, under the constant axial pressure, the particles at the upper and lower ends of the model tended to move vertically to the bottom. Thus, model deformation was mainly manifested in the direction of unloading expansion, and this was accompanied by axial pressure deformation. Under Path 2, particle motion mainly manifested in the axial motion to the interior of the model and expanded along the radial unloading direction, as shown in Figures 20D–F. Deformation manifested in the axial pressure and expanded along the direction of unloading.
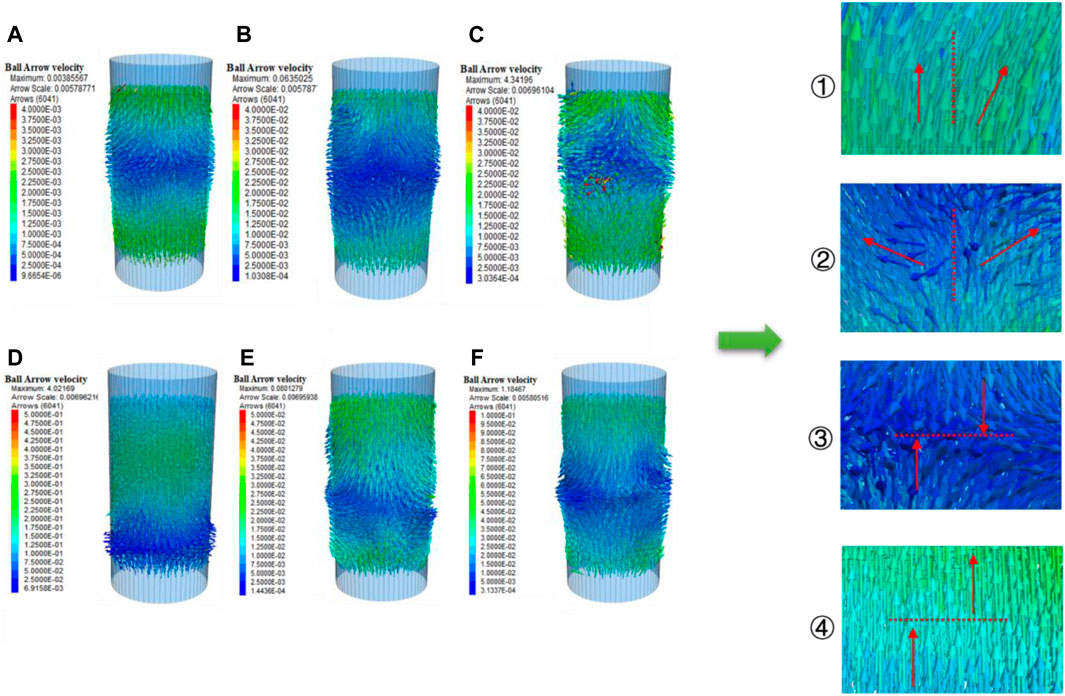
Figure 20. Velocity distribution of particles under the effect of the unloading rate: (A) Path 1, confining pressure unloading rate of 0.01 MPa/s; (B) Path 1, confining pressure unloading rate of 0.05 MPa/s; (C) Path 1, confining pressure unloading rate of 0.1 MPa/s; (D) Path 2, confining pressure unloading rate of 0.01 MPa/s; (E) Path 2, confining pressure unloading rate of 0.05 MPa/s; (F) Path 2, confining pressure unloading rate of 0.1 MPa/s.
In Path 1, as the internal particles were subjected to confining pressure unloading and constant axial stress, the particle velocity increased with the increase in the confining pressure unloading rate, and the particle motion was concentrated in the middle region of the model. The maximum particle velocities displayed in Figure 20A–C are 0.00385567, 0.0635025, and 4.34196 m/s, respectively. The large difference observed among these maximum particle velocities arises from faster confining pressure unloading rates resulting in a rapid decrease in the radial constraints on the particles, which leads to local particles being damaged by axial stress. In Path 2, the particle velocities decreased as the confining pressure unloading rate increased, with the overall particle velocities being larger than the axial pressure constant. Additionally, the particle motion concentrated in the middle region of the model. The overall particle velocity was greater than the particle velocity when the axial pressure was constant. As the unloading rate increases, the axial pressure loaded per unit of time decreases, which changes the particle velocity aggregation and expansion. In Figures 20D–F, the increase of the unloading rate leads to a decrease in the loading axial pressure, resulting in the particle velocity aggregation and expansion moving to the upper part of the model.
Based on Figure 20, the formation of cracks within the sandstone has the following characteristics: ① Local particles move with each other at an acute angle, as shown in Figure 21A, and the model locally forms tensile cracks. ② Local particles move with each other in an obtuse angle, as shown in Figure 21B, forming tensile-shear composite cracks. ③ The motion direction between local particles is parallel and opposite, forming shear cracks. ④ The local inter-particle motion direction is the same, but the particle motion speed is different. As the front particle motion speed is faster than the back particle speed, tensile cleavage is locally formed.
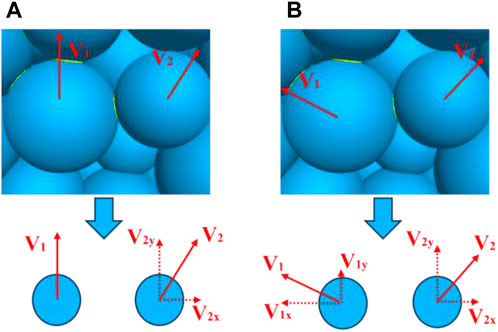
Figure 21. Particle velocity decomposition.
4.3 Crack expansion and permeability
The permeability increases with the increase of the number of fine cracks in the model during the unloading process, and the relationship between the two is a linear function. The R2 values were greater than 0.97 in both paths, and the fitting correlation was good. In Path 1, the slope of the linear function increases with the increase in the confining pressure unloading rate, indicating an increase in the permeability and number of cracks (Figure 22). In Path 2, the slopes of the linear functions increased and then decreased, and the loaded axial pressure decreased with the increase in the confining pressure unloading rate, which led to a decrease in the number of cracks and permeability (Figure 23). When the ratio of loading and unloading rate was 1:1, the number of micro-cracks was the highest. These agglomerated into macro-cracks, and permeability was the largest, confirming that the number of cracks has a significant effect on the increase in permeability. The results of the previous analysis show that in Path 1, the permeability increases and the percentage of shear cracks increases with the increase of the perimeter pressure unloading rate. In path 2, the permeability and the percentage of shear cracks both decrease with the increase of the perimeter pressure unloading rate. Hence, the permeability is positively correlated with the proportion of shear cracks.
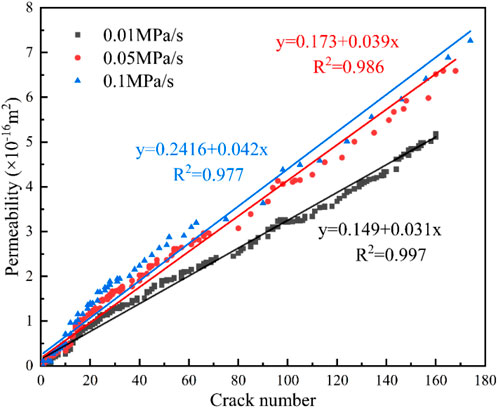
Figure 22. Permeability as a function of the number of cracks in Path 1.
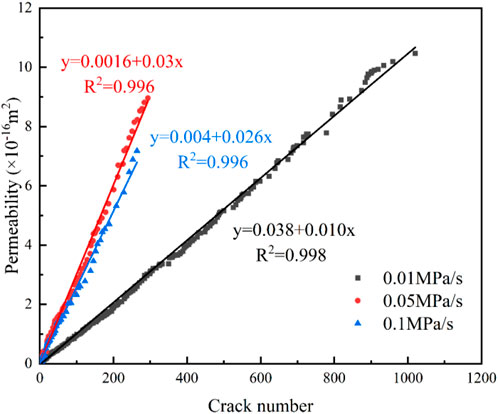
Figure 23. Permeability as a function of the number of cracks in Path 2.
5 Conclusion
In this study, indoor experiments and numerical simulations were used to investigate the fine-scale deformation and permeability characteristics of sandstone under constant (loaded) axial stresses. Different rates of unloading confining pressures were applied using a self-developed multifunctional triaxial permeability experimental system and particle flow software. The main conclusions follow.
(1) During pressure unloading, the axial strain decreases as the rate of confining pressure unloading increases. Moreover, the rate of change in axial strain diminishes with higher rates of confining pressure unloading. With constant axial pressure, increasing the rate of confining pressure unloading reduces the permeability’s sensitivity to the principal stress difference. Conversely, increasing axial pressure enhances the permeability’s sensitivity to the principal stress difference.
(2) When the confining pressure unloading rate is 0.01, 0.05 and 0.1 MPa/s, the total number of cracks increases with the increase of confining pressure unloading rate and the proportion of tensile cracks decreases by 90.63%, 88.09% and 86.28% respectively under the constant action of axial pressure. Under the axial compressive load, the total number of cracks decreased and the proportion of tensile cracks increased with the increase of confining pressure unloading rate, which were 70.31%, 93.54% and 95.56%, respectively.
(3) Permeability satisfies a linear functional relationship with the number of cracks, where the permeability is directly proportional to the number of shear cracks and inversely proportional to the number of tension cracks.
(4) In the sandstone model under confining pressure unloading, the internal particles move outward in the direction of confining pressure unloading and inward along the vertical axis relative to the model. In path 1, as the confining pressure unloading velocity increases, the particle velocity increases, causing expansion deformation along the unloading direction. In path 2, as the confining pressure unloading rate increases, the particle velocity decreases and then increases. The particle velocity aggregation moves towards the upper part of the model, causing expansion and deformation in the axial compression and unloading directions.
Data availability statement
The original contributions presented in the study are included in the article/Supplementary Material, further inquiries can be directed to the corresponding author.
Author contributions
WS: Investigation, Writing–original draft, XQ: Data curation, Formal Analysis, Writing–original draft. QL: Funding acquisition, Investigation, Methodology, Writing–review and editing. YZ: Resources, Supervision, Writing–review and editing. WM: Project administration, Software, Validation, Writing–original draft. YM: Project administration, Visualization, Writing–original draft. JG: Writing–review and editing, Investigation.
Funding
The author(s) declare that financial support was received for the research, authorship, and/or publication of this article. This research was funded by the National Natural Science Foundation of China, grant number 51874177, and supported by the Department of Science and Technology of Liaoning province (2023-BS-083), National Natural Science Foundation of China (grant no. 52304029), Autonomous Region Science and Technology Major Project of Inner Mongolia (grant no. 2021ZD0034-2), and Liaoning Provincial Education Department Project (grant no. LJKQZ20222325).
Conflict of interest
The authors declare that the research was conducted in the absence of any commercial or financial relationships that could be construed as a potential conflict of interest.
Publisher’s note
All claims expressed in this article are solely those of the authors and do not necessarily represent those of their affiliated organizations, or those of the publisher, the editors and the reviewers. Any product that may be evaluated in this article, or claim that may be made by its manufacturer, is not guaranteed or endorsed by the publisher.
References
Alam, A. K. M. B., Niioka, M., Fujii, Y., Fukuda, D., and Kodama, J. i. (2014). Effects of confining pressure on the permeability of three rock types under compression. Int. J. Rock Mech. Min. Sci. 65, 49–61. doi:10.1016/j.ijrmms.2013.11.006
Bian, K., Chen, Y. A., Liu, J., et al. (2020). The unloading failure characteristics of shale under different water absorption time using the PFC numerical method. Rock Soil Mech. 41, 355–367. doi:10.16285/j.rsm.2019.1158
Chen, J., and Feng, X. (2006). True triaxial experimental study on rock with high geostress. Yanshilixue Yu Gongcheng Xuebao/Chinese J. Rock Mech. Eng. 25 (8), 1537–1543. doi:10.3321/j.issn:1000-6915.2006.08.004
Chen, X., Tang, C., Yu, J., Zhou, J. f., and Cai, Y. y. (2018). Experimental investigation on deformation characteristics and permeability evolution of rock under confining pressure unloading conditions. J. Central South Univ. 25 (8), 1987–2001. doi:10.1007/s11771-018-3889-2
Chi, P., Sun, J., Yan, W., and Luo, X. (2024). Multiscale fusion of tight sandstone digital rocks using attention-guided generative adversarial network. Mar. Petroleum Geol. 160, 106647. doi:10.1016/j.marpetgeo.2023.106647
Cui, R., Sun, J., Liu, H., Dong, H., and Yan, W. (2024). Pore structure and gas adsorption characteristics in stress-loaded shale on molecular simulation. Energy 286, 129658. doi:10.1016/j.energy.2023.129658
Deng, H. F., Zhou, M. L., Li, J. L., et al. (2016). Experimental research on unloading triaxial rheological mechanical properties of sandy mudstone. Rock Soil Mech. 37 (2), 315–322. doi:10.16285/j.rsm.2016.02.002
Feng-da, Z., Bao-hong, S., and Yong-hua, K. (2016). Water inrush failure mechanism of mining floor under unloading effect. Rock Soil Mech. 37 (2), 431–438. doi:10.16285/j.rsm.2016.02.016
Fengda, Z., Yujun, Z., and Qiuge, Y. (2022). Unloading deterioration and mechanism of rock under different loading and unloading stress paths. Coal Sci. Technol. 50 (12), 117–127. doi:10.13199/j.cnki.cst.QN21-008
Gao, J., Li, X., Cheng, G., Luo, H., and Zhu, H. (2023). Structural evolution and characterization of organic-rich shale from macroscopic to microscopic resolution: the significance of tectonic activity. Adv. Geo-Energy Res. 10 (2), 84–90. doi:10.46690/ager.2023.11.03
He, M., Xie, H., Peng, S., et al. (2005). Study on rock mechanics in deep mining engineering. Yanshilixue Yu Gongcheng Xuebao/Chin. J. Rock Mech. Eng. 24 (16), 2803–2813. doi:10.3321/j.issn:1000-6915.2005.16.001
He, R., Yang, J., Li, L., Yang, Z., Chen, W., Zeng, J., et al. (2023). Investigating the simultaneous fracture propagation from multiple perforation clusters in horizontal wells using 3D block discrete element method. Front. Earth Sci. 11, 35. doi:10.3389/feart.2023.1115054
Huang, L., Dontsov, E., Fu, H., Lei, Y., Weng, D., and Zhang, F. (2022). Hydraulic fracture height growth in layered rocks: perspective from DEM simulation of different propagation regimes. Int. J. Solids Struct. 238, 111395. doi:10.1016/j.ijsolstr.2021.111395
Huang, L., He, R., Yang, Z., Tan, P., Chen, W., Li, X., et al. (2023a). Exploring hydraulic fracture behavior in glutenite formation with strong heterogeneity and variable lithology based on DEM simulation. Eng. Fract. Mech. 278, 109020. doi:10.1016/j.engfracmech.2022.109020
Huang, L., Liu, J., Ji, Y., Gong, X., and Qin, L. (2018). A review of multiscale expansion of low permeability reservoir cracks. Petroleum 4, 115–125. doi:10.1016/j.petlm.2017.09.002
Huang, L., Liu, J., Zhang, F., Dontsov, E., and Damjanac, B. (2019). Exploring the influence of rock inherent heterogeneity and grain size on hydraulic fracturing using discrete element modeling. Int. J. Solids Struct. 176, 207–220. doi:10.1016/j.ijsolstr.2019.06.018
Huang, L., Liu, J., Zhang, F., Fu, H., Zhu, H., and Damjanac, B. (2020). 3D lattice modeling of hydraulic fracture initiation and near-wellbore propagation for different perforation models. J. Petroleum Sci. Eng. 191, 107169. doi:10.1016/j.petrol.2020.107169
Huang, L., Tan, J., Fu, H., Liu, J., Chen, X., Liao, X., et al. (2023b). The non-plane initiation and propagation mechanism of multiple hydraulic fractures in tight reservoirs considering stress shadow effects. Eng. Fract. Mech. 292, 109570. doi:10.1016/j.engfracmech.2023.109570
Ji, H., Chen, D., Su, X., et al. (2023). Analysis of elastic modulus variation and energy evolution of Granite based on triaxial loading and unloading test. J. Northeast. Univ. Nat. Sci. 44 (3), 415. doi:10.12068/j.issn.1005-3026.2023.03.015
Kozhevnikov, E. V., Turbakov, M. S., Riabokon, E. P., Gladkikh, E. A., and Poplygin, V. V. (2023). Cyclic confining pressure and rock permeability: mechanical compaction or fines migration. Heliyon 9 (11), e21600. doi:10.1016/j.heliyon.2023.e21600
Li, S., Wang, C., Zhang, D., Yu, B., and Ren, K. (2022). Failure and deformation characteristics of shale subject to true triaxial stress loading and unloading under water retention and seepage. R. Soc. Open Sci. 9 (7), 220530. doi:10.1098/rsos.220530
Liu, J., Li, Q., Lu, S., Wang, Z., and Wang, H. (2023b). Study on failure mechanical behavior of coal in triaxial stress loading and unloading path. Bull. Eng. Geol. Environ. 82 (11), 417. doi:10.1007/s10064-023-03446-3
Liu, Q., Li, J., Liang, B., Liu, J., Sun, W., He, J., et al. (2023c). Complex wettability behavior triggering mechanism on imbibition: a model construction and comparative study based on analysis at multiple scales. Energy 275, 127434. doi:10.1016/j.energy.2023.127434
Liu, Q., Li, J., Liang, B., Sun, W., Liu, J., and Lei, Y. (2023a). Microscopic flow of CO2 in complex pore structures: a recent 10-year review. Sustainability 15, 12959. doi:10.3390/su151712959
Liu, Q., Liu, J., Liang, B., Sun, W., He, J., and Lei, Y. (2022). The influence of pore structure of the core-scale fracture-controlled matrix unit on imbibition: model construction and definition of the fractal coefficient. Lithosphere 2022, 6245345. doi:10.2113/2022/6245345
Liu, Q., Liu, J., Pei, G., Zhu, Z., and Lei, Y. (2020c). A new method for artificial core reconstruction of a fracture-control matrix unit. Adv. Civ. Eng. 2020, 1–10. doi:10.1155/2020/7469584
Liu, Q., Song, R., Liu, J., Lei, Y., and Zhu, X. (2020b). Pore-scale visualization and quantitative analysis of the spontaneous imbibition based on experiments and micro-CT technology in low-permeability mixed-wettability rock. Energy Sci. Eng. 8, 1840–1856. doi:10.1002/ese3.636
Liu, Q., Song, R., Liu, J., Pei, G., and Lei, Y. (2020a). Mass transfer model of fracture-controlled matrix unit: model derivation and experimental verification based on fractal theory and micro-CT scanning technology. Energy Rep. 6, 3067–3079. doi:10.1016/j.egyr.2020.11.016
Liu, X. S., Zeng, N. D., Zhang, L. J., Hou, Z. L., Pan, Y. H., Hao, Z. Y., et al. (2023d). Improved fluid-solid coupling model based on PFC and corresponding numerical simulation of seepage failure for the reservoir shale. J. Basic Sci. Eng. 31 (2), 467–482. doi:10.1016/j.energy.2023.127434
Luo, H., Xie, J., Huang, L., Wu, J., Shi, X., Bai, Y., et al. (2022). Multiscale sensitivity analysis of hydraulic fracturing parameters based on dimensionless analysis method. Lithosphere 2022 (Special 12), 9708300. doi:10.2113/2022/9708300
Ma, B., Ding, X., and Chen, X. (2023). Reloading mechanical properties and particle flow simulation of pre-peak confining pressure unloading sandstone. Appl. Sci. 13 (9), 5775. doi:10.3390/app13095775
Qiu, S. L., Feng, X. T., Zhang, C. Q., et al. (2010). Experimental research on mechanical properties of deep-buried marble under different unloading rates of confining pressures. Chin. J. Rock Mech. Eng. 29 (9), 1807–1817
Rong, H., Li, G., Liang, D., et al. (2022). Particle flow simulation of mechanical properties of high stress rock under the influence of stress path. J. Min. Saf. Eng. 39, 163–173. doi:10.13545/j.cnki.jmse.2021.0191
Shi, K., Jin, G., Yan, W., and Xing, H. (2024). Permeability estimation for deformable porous media with convolutional neural network. Int. J. Numer. Methods Heat Fluid Flow. doi:10.1108/hff-10-2023-0644
Song, R., Liu, J., and Cui, M. (2017). A new method to reconstruct structured mesh model from micro-computed tomography images of porous media and its application. Int. J. Heat Mass Transf. 109, 705–715. doi:10.1016/j.ijheatmasstransfer.2017.02.053
Song, R., Liu, J., Yang, C., and Sun, S. (2022). Study on the multiphase heat and mass transfer mechanism in the dissociation of methane hydrate in reconstructed real-shape porous sediments. Energy 254, 124421. doi:10.1016/j.energy.2022.124421
Song, R., Wang, Y., Ishutov, S., Zambrano-Narvaez, G., Hodder, K. J., Chalaturnyk, R. J., et al. (2020). A comprehensive experimental study on mechanical behavior, microstructure and transport properties of 3D-printed rock analogs. Rock Mech. Rock Eng. 53, 5745–5765. doi:10.1007/s00603-020-02239-4
Sun, W., Li, J., Liu, Q., Liang, B., and Lei, Y. (2024). Complexity upgrade and triggering mechanism of mixed-wettability: comparative study of CO2 displacement in different phases. Fuel 369, 131798. doi:10.1016/j.fuel.2024.131798
Takeda, M., and Manaka, M. (2018). Effects of confining stress on the semipermeability of siliceous mudstones: implications for identifying geologic membrane behaviors of argillaceous formations. Geophys. Res. Lett. 45 (11), 5427–5435. doi:10.1029/2018gl078591
Tan, P., Chen, Z., Fu, S., and Zhao, Q. (2023). Experimental investigation on fracture growth for integrated hydraulic fracturing in multiple gas bearing formations. Geoenergy Sci. Eng. 231, 212316. doi:10.1016/j.geoen.2023.212316
Tan, P., Jin, Y., Han, K., Hou, B., Chen, M., Guo, X., et al. (2017). Analysis of hydraulic fracture initiation and vertical propagation behavior in laminated shale formation. Fuel 206, 482–493. doi:10.1016/j.fuel.2017.05.033
Tan, P., Jin, Y., and Pang, H. (2021). Hydraulic fracture vertical propagation behavior in transversely isotropic layered shale formation with transition zone using XFEM-based CZM method. Eng. Fract. Mech. 248, 107707. doi:10.1016/j.engfracmech.2021.107707
Tan, P., Jin, Y., Yuan, L., Xiong, Z. Y., Hou, B., Chen, M., et al. (2019). Understanding hydraulic fracture propagation behavior in tight sandstone–coal interbedded formations: an experimental investigation. Petroleum Sci. 16, 148–160. doi:10.1007/s12182-018-0297-z
Tan, P., Pang, H., Zhang, R., Jin, Y., Zhou, Y., Kao, J., et al. (2020). Experimental investigation into hydraulic fracture geometry and proppant migration characteristics for southeastern Sichuan deep shale reservoirs. J. Petroleum Sci. Eng. 184, 106517. doi:10.1016/j.petrol.2019.106517
Wang, H., Xu, W., Shao, J., and Skoczylas, F. (2014). The gas permeability properties of low-permeability rock in the process of triaxial compression test. Mater. Lett. 116, 386–388. doi:10.1016/j.matlet.2013.11.061
Wang, L. H., Niu, C. Y., Zhang, B., et al. (2019). Experimental study on mechanical properties of deep-buried soft rock under different stress paths. Chin. J. Rock Mech. Eng. 38, 973–981. doi:10.13722/j.cnki.jrme.2018.0973
Wang, R., Xu, B., Wan, Y., Wang, H., Wang, W., and Meng, Q. (2023). Characteristics of unloading damage and permeability evolution of sandstone under hydro-mechanical coupling. Eur. J. Environ. Civ. Eng. 27 (7), 2566–2575. doi:10.1080/19648189.2020.1763855
Wu, M., Jiang, C., Song, R., Liu, J., Li, M., Liu, B., et al. (2023b). Comparative study on hydraulic fracturing using different discrete fracture network modeling: insight from homogeneous to heterogeneity reservoirs. Eng. Fract. Mech. 284, 109274. doi:10.1016/j.engfracmech.2023.109274
Wu, W., Gong, F., Jiang, Q., and He, L. (2023a). Strength reduction of initial high-stress rock pillars under different triaxial unloading paths. Rock Mech. Rock Eng. 56 (5), 3519–3537. doi:10.1007/s00603-023-03223-4
Xie, H., Zhao, X., Liu, J., Zhang, R., and Xue, D. (2012). Influence of different mining layouts on the mechanical properties of coal. Int. J. Min. Sci. Technol. 22 (6), 749–755. doi:10.1016/j.ijmst.2012.12.010
Xie, H. P., Gao, F., and Ju, Y. (2015). Research and exploration of rock mechanics in deep ground engineering. Chin. Rock Mech. Eng. 34, 2161–2178. doi:10.13722/j.cnki.jrme.2015.1369
Yin, G., Jiang, C., Wang, J. G., and Xu, J. (2015). Geomechanical and flow properties of coal from loading axial stress and unloading confining pressure tests. Int. J. Rock Mech. Min. Sci. 76, 155–161. doi:10.1016/j.ijrmms.2015.03.019
Yu, J., Li, H., Chen, X., et al. (2014). Experimental study of permeability and acoustic emission characteristics of sandstone during processes of unloading confining pressure and deformation. Chin. J. Rock Mech. Eng. 33 (1), 69–79. doi:10.13722/j.cnki.jrme.2014.01.007
Yuan, X., and Zhang, J. W. (2017). Deformation and permeability characteristic of outburst coal under step unloading conditions. J. China Coal Soc. 42 (6), 1451–1457. doi:10.13225/j.cnki.jccs.2016.1179
Zeng, W., Yang, S., Tian, W., and Wen, K. (2018). Numerical investigation on permeability evolution behavior of rock by an improved flow-coupling algorithm in particle flow code. J. Central South Univ. 25 (6), 1367–1385. doi:10.1007/s11771-018-3833-5
Zhang, F. S., Huang, L. K., Yang, L., Dontsov, E., Weng, D. W., Liang, H. B., et al. (2022). Numerical investigation on the effect of depletion-induced stress reorientation on infill well hydraulic fracture propagation. Petroleum Sci. 19 (1), 296–308. doi:10.1016/j.petsci.2021.09.014
Zhang, P. S., Sun, Y. N., Yan, W., et al. (2019). Experimental study on pressure deformation and seepage characteristics of 541 saturated crushed rock. J. Min. Saf. Eng. 36, 1016–1024. doi:10.13545/j.cnki.jmse.2019.05.020
Zhao, H., Song, Z., Zhang, D., Liu, C., and Yu, B. (2021). True triaxial experimental study on mechanical characteristics and energy evolution of sandstone under various loading and unloading rates. Geomechanics Geophys. Geo-Energy Geo-Resources 7, 22–17. doi:10.1007/s40948-020-00212-7
Zheng, Y., He, R., Huang, L., Bai, Y., Wang, C., Chen, W., et al. (2022). Exploring the effect of engineering parameters on the penetration of hydraulic fractures through bedding planes in different propagation regimes. Comput. Geotechnics 146, 104736. doi:10.1016/j.compgeo.2022.104736
Zhu, H., Huang, C., Ju, Y., Bu, H., Li, X., Yang, M., et al. (2021). Multi-scale multi-dimensional characterization of clay-hosted pore networks of shale using FIBSEM, TEM, and X-ray micro-tomography: implications for methane storage and migration. Appl. Clay Sci. 213, 106239. doi:10.1016/j.clay.2021.106239
Keywords: unloading rate, fluid-solid coupling, permeability, cracks, deformation
Citation: Sun W, Qin X, Liu Q, Zhang Y, Ma W, Ma Y and Gao J (2024) Effect of stress unloading rate on fine-scale deformation mechanism of rock under high osmotic pressure. Front. Earth Sci. 12:1445254. doi: 10.3389/feart.2024.1445254
Received: 07 June 2024; Accepted: 18 July 2024;
Published: 03 September 2024.
Edited by:
Hongjian Zhu, Yanshan University, ChinaReviewed by:
Shuaifeng Wang, Tongji University, ChinaXunchang Fei, Nanyang Technological University, Singapore
Copyright © 2024 Sun, Qin, Liu, Zhang, Ma, Ma and Gao. This is an open-access article distributed under the terms of the Creative Commons Attribution License (CC BY). The use, distribution or reproduction in other forums is permitted, provided the original author(s) and the copyright owner(s) are credited and that the original publication in this journal is cited, in accordance with accepted academic practice. No use, distribution or reproduction is permitted which does not comply with these terms.
*Correspondence: Qiang Liu, bGl1cWlhbmdAbG50dS5lZHUuY24=