 Suhua Zhou
 Jinfeng Li1,2
 Jiuchang Zhang
- 1College of Civil Engineering, Hunan University, Changsha, Hunan, China
- 2Key Laboratory of Building Safety and Energy Efficiency of Ministry of Education, Changsha, China
- 3Integrated Space-Air-Ground Structural Health Monitoring and Maintenance Center, Hunan University, Changsha, China
- 4Department of Information and Civil Engineering, Yunnan Minzu University, Kunming, Yunnan, China
- 5Key Laboratory for Geological Disaster Prevention and Control in Hilly and Mountainous Areas, Ministry of Land and Resources, Fuzhou, Fujian, China
Machine learning models have been increasingly popular in landslide susceptibility mapping based on the correlations among landslides and their inducing factors. However, mislabeled data in model training sets would deteriorate model accuracy. This study employed a Bayesian network to analyze influencing factors on landslides in Fujian Province, China, prone to typhoons and landslides. An inventory of 5,992 historical landslides informs Bayesian network modeling, with ten geoenvironmental factors as predictors. We introduced a progressive noise filtering method to mitigate the mislabeling effects of non-landslide points. The results show that altitude, wind speed, and lithology are the most important factors of landslides in the study area. The accuracy of the resultant landslide susceptibility map was verified using the area under the receiver operating characteristic curve (AUC) and Moran’s I index. The AUC value was improved from 0.838 to 0.931 during the progressive noise filtering. The correlation between historical landslide number density (LND) and resultant landslide susceptibility index (LSI) was evaluated. The Local Indicators of Spatial Association based on Moran’s I index shows consistent distribution patterns for high LND and high LSI regions. This study provides a useful reference for reliable landslide susceptibility mapping in the study area and similar areas.
1 Introduction
Landslides are natural geological phenomena characterized by the gravity-driven downhill movement of earth or rocky materials, with the potential to cause substantial damage to communities, infrastructure, and ecosystems. As per the United Nations, landslides are one of the most destructive and widespread natural hazards on a global scale (United Nations, 2019). Due to the global climate change, the occurrence of extreme weather events such as typhoons and extreme rainfall has become increasingly frequent. It has notably heightened the potential for landslide incidents. This surge has resulted in a substantial upswing in the rates of mortality associated with landslides (Tian et al., 2020; Yang et al., 2020). In response to this challenge, landslide susceptibility mapping has been positioned as an indispensable instrument to identify landslide-prone areas and mitigate landslide hazards.
In recent years, machine learning techniques have gained increasing popularity in landslide susceptibility modelling (LSM) (Pradhan, 2013). Numerous machine learning (ML) algorithms, including random forest (RF) (Yuan and Chen, 2022), convolutional neural networks (CNN) (Youssef et al., 2022), Bayesian network (BN) (Mihaljevic et al., 2021; Huang, et al., 2022), etc., have been developed and applied in mapping landslide susceptibility. By depicting a collection of stochastic attributes and their conditional dependencies, BN is a probabilistic model widely used in solving problems related to complex systems. The notable features of BN lie in its incremental learning properties (Huang et al., 2022). While getting an acceptable performance, the trained model was applied to predict landslide susceptibility over the whole study area (Cengiz and Ercanoglu, 2022). However, in practical engineering, as new landslides occur in the study area, the landslide dataset undergoes continuous updates over time. Consequently, the training dataset should be adjusted accordingly to incorporate the new knowledge (Huang et al., 2022). Another distinctive characteristic of BN is found in their interpretability (Mihaljevic et al., 2021), as many ML techniques exhibited a black-box nature that was non-transparent to humans. In this regard, BN can furnish decision-makers with a prioritized list of input landslide controlling factors, along with potential interactions among these factors. Given the aforementioned, an increasing number of scholars are employing BN in LSM studies (Cui et al., 2022; Lan et al., 2021).
The establishment of sample sets and the selection of evaluation factors are critical for LSM (Singh et al., 2023). The construction of sample data for machine learning models is typically based on known landslide data (Chakrabortty et al., 2022). To extract more information from limited sample data, many researchers have focused on expanding landslide samples and selecting high-quality non-landslide samples (Sukristiyanti et al., 2020). Yang et al. (2023) have identified landslides from satellite maps to augment the landslide samples. Huang et al. (2022) incorporated the temporal attributes of landslide samples in LSM to analyze the characteristics of landslides over different periods. However, previous studies often randomly chose non-landslide samples from the study area, which can introduce mislabeled samples and uncertainties into the LSM (Abraham et al., 2023; Huang et al., 2020). The inclusion of mislabeled samples can indeed impact the performance of machine learning models, potentially resulting in suboptimal outcomes. In this study, noise is progressively filtered from subsequent training sets using a trained BN model as prior knowledge to identify and filter out mislabeled data.
The triggering effect of tropical cyclones (TCs) on landslides is manifested in the combined action of strong winds and heavy rainfall. On one hand, rainwater infiltration increases the gravitational force on the soil and reduces its shear strength; on the other hand, strong winds increase the instability of slopes by exerting an uplift force on the vegetation (Qi et al., 2023; Zhuang et al., 2022). Therefore, when modeling landslide susceptibility in coastal areas and other regions prone to typhoons, considering only the impact of rainfall on landslide triggering is insufficient. Although some researchers have analyzed landslide characteristics under individual typical typhoon events, they have not proposed a general quantitative assessment method for typhoon impacts to be integrated into LSM (Wu, 2019; Cui et al., 2022).
This study aims to construct a noise filtering method based on a Bayesian Network model to mitigate the mislabeling effects of non-landslide points. Ten geoenvironmental predictors are selected to form the LSM. Additionally, considering the study area is a typhoon-prone region, we used the Rankine vortex model to quantify and assess the impact of historical tropical cyclones and the extreme rainfall.
2 Study area and data sources
2.1 Study area
Fujian Province (115°50′-120°40′E, 23°33′-28°20′N) is situated in the southeast of China (Figure 1). It covers an area of 121,400 km2 with over 90% of it characterized by hills and mountains with an altitude ranging from −51 m to 2,148 m. Shaped by the new Huaxia structure, the elevational trend ascends towards the northwest and descends towards the southeast (Lin et al., 2021). The geological foundation of Fujian Province is typified by dynamism, with high-angle faults and jointed structures. In the study area, magmatic rocks consist of intrusive rocks alongside Jurassic and Cretaceous volcanic formations. Igneous rocks form a significant component of the lithology, occupying a substantial portion of the province’s land area. Metamorphic rocks primarily characterize the northwestern region, while sedimentary rocks constitute a smaller fraction of the landscape, concentrated mainly in the southwest.
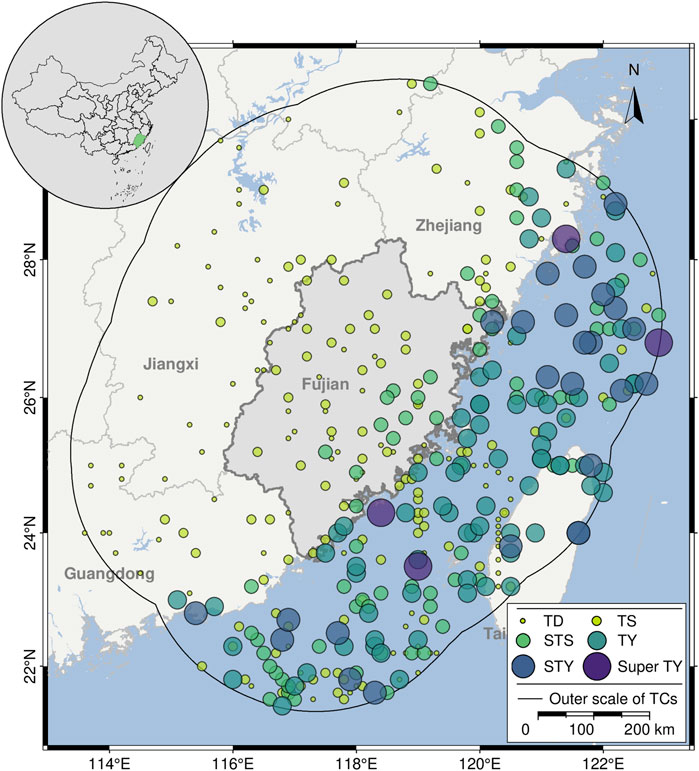
Figure 1. Location of the study area and paths of TCs.
Fujian Province is located near the Tropic of Cancer. The prevailing climatic pattern corresponds to a warm and humid subtropical monsoon climate. The region experiences higher levels of precipitation. Facing the Pacific Ocean on the east, Fujian Province is vulnerable to maritime tropical cyclones in the Pacific Ocean. Rainfall distribution displays notable heterogeneity across the region (Ma et al., 2023; Ye et al., 2022). For instance, the coastal plains and mountainous zones of Fujian Province typically encounter an annual average rainfall within the range of 900 mm–1,100 mm. In contrast, the hilly mountain areas experience heightened precipitation levels, with figures approximating 1,500 mm–1,700 mm.
A combination of factors, including heavy rainfall, typhoons, steep terrain, fractured rock, soil formations, and human engineering activities, collectively contribute to geotechnical hazards in the region. Generally, the geohazard profile of Fujian Province is characterized by its widespread occurrence, frequent events, and sudden emergence.
2.2 Data sources
The dataset employed for this study, as outlined in Table 1, encompasses a comprehensive array of variables encompassing the landslide inventory, a spectrum of contributing factors, tropical cyclone data, and the counts of landslides and associated rainfall. The landslide inventory encapsulates historical records detailing 5,992 instances of landslides that have transpired within Fujian Province. A subset of the Digital Elevation Model (DEM), integral to the analysis of landslide susceptibility, was derived via DEM with a spatial resolution of 30 m through ArcGIS 10.6 software. Concurrently, the tropical cyclone dataset encompasses a wealth of information about the geographical location, intensity level, and wind speed of tropical cyclones within the northwest Pacific Ocean. The dataset is sourced primarily from government disaster reports and authoritative websites maintained by scientific institutions.
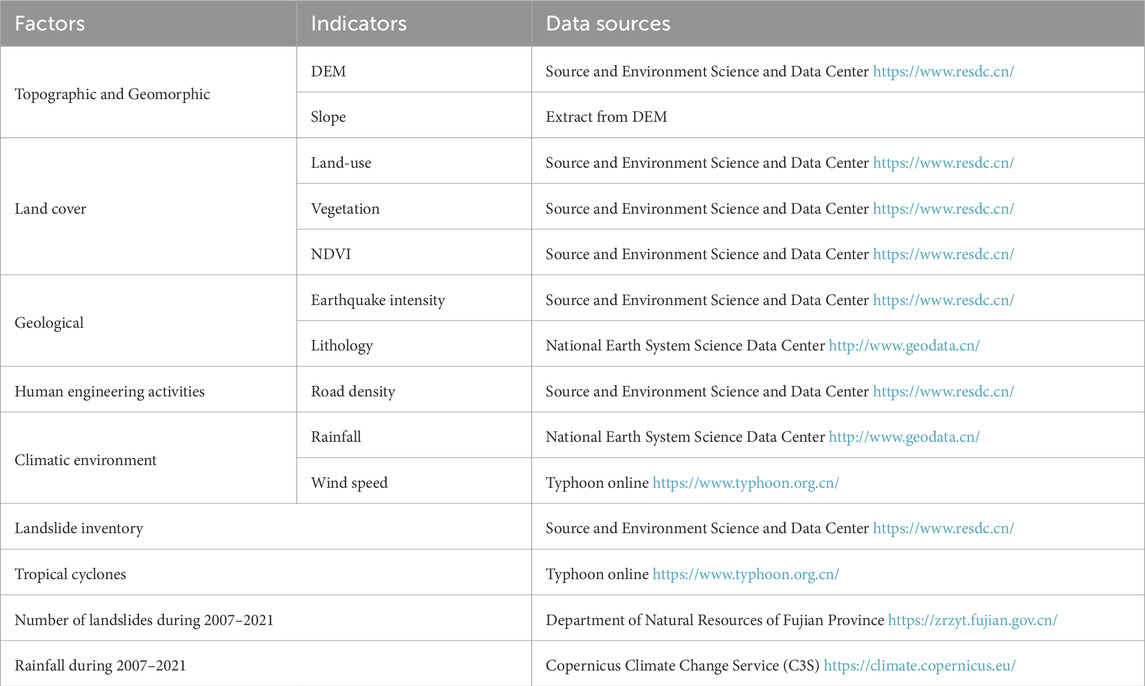
Table 1. Data sources.
2.3 Inventory of TCs in the period of 2007–2020
Mature TCs often generate spiral rainbands, which can result in local winds, heavy rainfall, and storm surges (Tang et al., 2018). These convective phenomena can trigger various disasters such as landslides, floods, and urban waterlogging, particularly before and after TC landfall. Situated in the coastal region of southeastern China, the study area is highly susceptible to geological disasters influenced by precipitation patterns. Although annual rainfall offers a general overview of precipitation levels over the year, it may need to accurately reflect the impact of short-term heavy rainfall events associated with TCs. Hence, it is essential to consider TCs when assessing the influence of slope failures.
TCs and their consequent rainfall wield a substantial influence in instigating landslides within Fujian Province (Xiao et al., 2011). The national standard “Grade of tropical cyclones” (GB/T 19201–2006) classifies tropical cyclones into six categories based on wind speed, as shown in Table 2. This study used all TCs from 2007 to 2020, which are within a 250 km buffer from Fujian Province recorded. The 250 km buffer was created as it averages the outer scale of the TCs we used (Qi et al., 2023). Within this buffer zone, TCs were primarily characterized as TY and STY. Over the interval spanning from 2007 to 2020, Fujian Province experienced the landfall of 67 TCs, including 19 instances of TYs and 13 cases of STYs (Lu et al., 2021; Ying et al., 2014). Typically, TCs undergo rapid weakening and gradual dissipation following landfall. As depicted in Figure 1, the intensity of TCs decreases swiftly from TY and STY strength over the sea to TS and TD strength upon landfall. This transition, known as the “after-landfall phase,” would extend for several days following landfall. Though the intensity of TCs decreases during this period, heavy rainfall persists, leading to increased runoff and exacerbating landslide risks. As TCs continue to dissipate, the probability of new landslides occurring may decrease, enabling affected areas to commence recovery from the initial impacts.

Table 2. Tropical cyclone classification table.
2.4 Distribution pattern of landslides
2.4.1 Spatial distribution pattern
A total of 5,992 landslides across Fujian Province were detailed and documented. The distribution pattern of landslides in the region shows an apparent spatial characteristic. Most landslides concentrate in the hilly terrains of the central and western areas, extending northeastward through the region. Conversely, landslides occur less frequently in the relatively flat terrain of the southeastern coastal areas. In this study, we employed landslide number density (LND) as a metric to quantify the level of aggregation, providing deeper insights into the spatial distribution of landslide activity. As depicted in Figure 2, landslides in Fujian Province cluster near the mountain belts in central and western Fujian. Significant clustering was observed in cities such as Quanzhou and Sanming, which experienced an accumulation of over 1,000 geological incidents during the specified period. In contrast, southeastern coastal municipalities like Xiamen and Zhangzhou were relatively less affected, recording fewer than 500 geological events within the same timeframe.
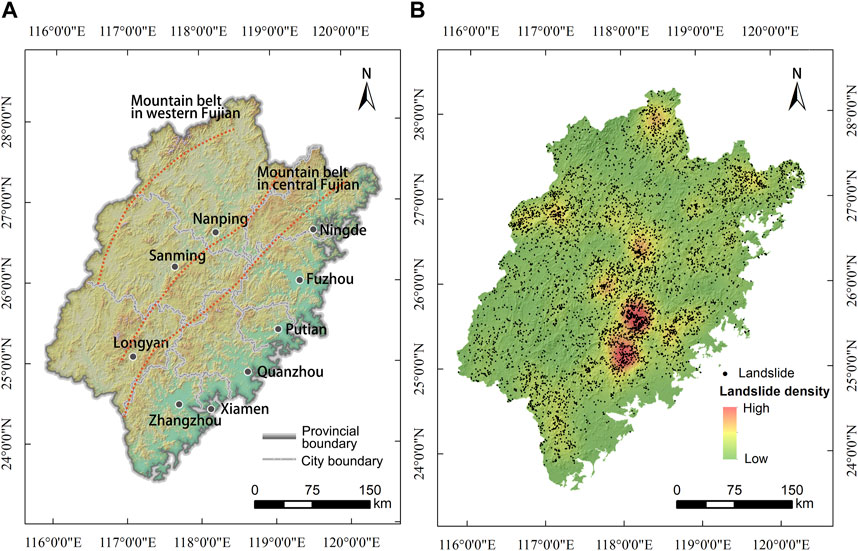
Figure 2. (A) Terrian of Fujian province; (B) Spatial distribution of landslides and landslide number density.
The impact of the physical geography on landslides can be categorized into internal and external triggering factors. External triggers such as typhoons and prolonged heavy rainfall are the primary causes of slope failures. Internal factors such as steep slopes and loose soils create a conducive environment for landslide occurrences. These unfavorable conditions are especially pronounced in the hilly areas of the western and central regions.
2.4.2 Temporal distribution characteristics
Since the landslide inventory lacks temporal attributes, this study supplemented by collecting a historical landslide dataset from the Department of Natural Resources of Fujian Province spanning from 2007 to 2021. This additional dataset enabled us to examine the relationship between the frequency of landslides and the prevailing conditions over time.
As depicted in Figure 3C, a consistent correlation is observed between the frequency of landslides and the magnitude of rainfall across varying temporal scales, encompassing monthly and yearly periods (Figures 3A, B). Monthly data reveals noticeable seasonal variations in both precipitation and landslide occurrences. The incidence of landslides increased during the rainy season from May to August. Over 70% of landslides throughout the entire year occurred during this period. Moreover, monthly average precipitation exceeding 200 mm correlates with a monthly landslide count surpassing 30 instances on average. The incidence of extreme rainfall tends to precipitate a surge in landslide occurrences. Annual data analysis underscores a pronounced positive correlation between rainfall and landslide frequencies. In most instances, peak rainfall coincides closely with the highest landslide events throughout the year. By tracing back to periods with abnormally high numbers of landslides, such as June 2010, May 2015, and July 2016, we found that the study area was indeed affected by typhoons or heavy rainfall during these periods (Figure 3B).
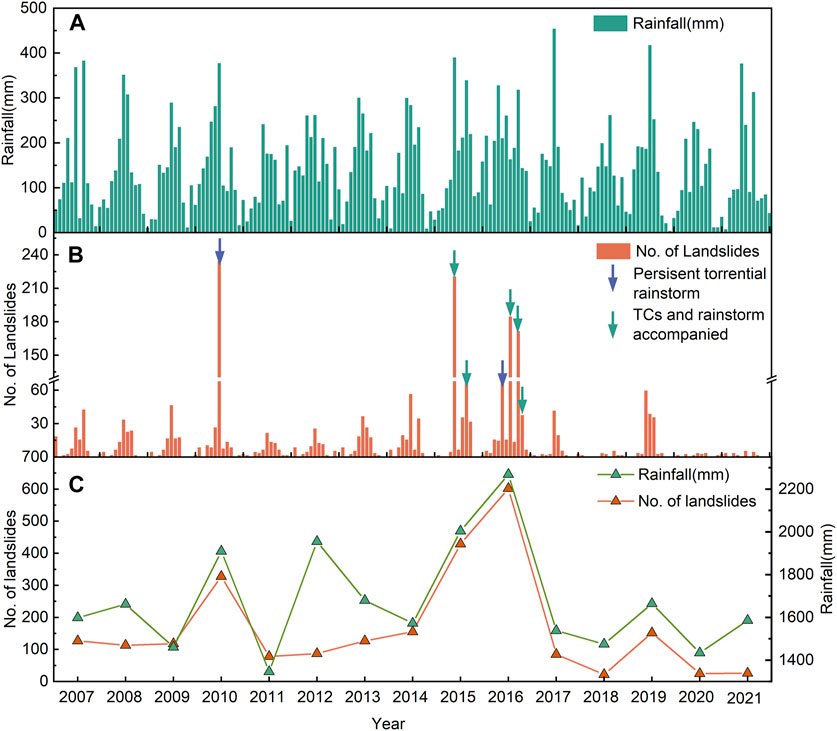
Figure 3. The temporal distribution of landslides in Fujian Province (A) Monthly rainfall during 2007∼2021; (B) Monthly landslides; (C) Annual rainfall and landslides.
2.5 Thematic layers of landslide-inducing factors
It is crucial to comprehensively consider various inducing factors to achieve an accurate LSA. Therefore, the selection of a wide range of inducing factors is essential. These factors should encompass all relevant environmental variables that may influence landslide occurrence. In this study, we identified ten inducing factors of landslides based on both the natural geographical environment and human engineering activities (Figure 4). These factors were classified into 5 clusters: topography (altitude and slope), land cover (vegetation, NDVI, and land-use), geological (lithology and earthquake intensity), human engineering activities (road density), and climate environment (rainfall and wind speed). Differences in environmental attributes can lead to landslides with different degrees of aggregation, and selecting the inducing factors as comprehensively as possible is a prerequisite for an accurate LSA.
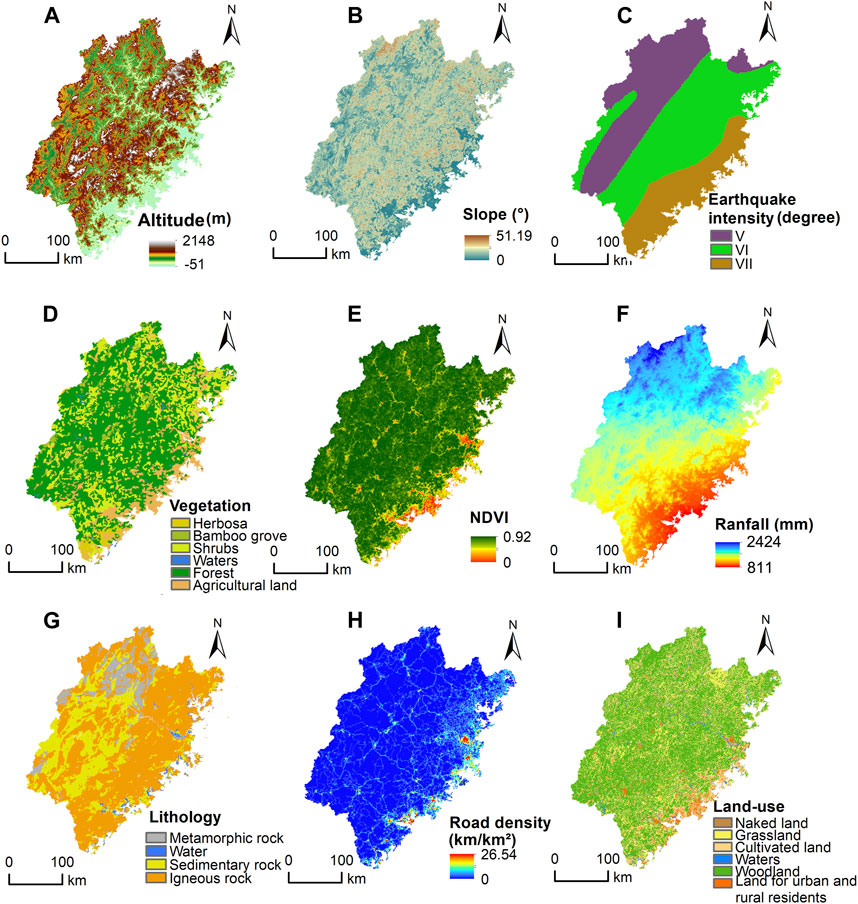
Figure 4. Inducing factors map of landslides in Fujian Province: (A) Lithology; (B) Earthquake intensity; (C) Land-use; (D) Vegetation; (E) NDVI; (F) Road density; (G) Altitude; (H) Rainfall; (I) Slope.
3 Materials and methods
3.1 Modelling of the wind fields
Wind speed is the foundational metric for assessing the intensity of a TC. It encapsulates the broader repercussions of a TC and its associated secondary calamities. Aiming to explore the complexities of TC influence on landslide susceptibility within Fujian Province, we compiled the wind speed of the TCs into an inducing factor and incorporated it into the LSA framework. In this study, the classical Rankine vortex model was used to compute the wind fields of the TCs within the study area. The formula employed to calculate the wind speed is presented in Equation 1:
In the equation, vm is the maximum wind speed of a TC, rm is the radial distance from a TC center which is the distance from a TC center to the place of maximum wind speed, and r is the distance to a TC center. The Rankine vortex model conceptualizes a TC as a solid rotating entity, where the allocation of tangential wind speed is governed by two primary parameters: the maximum wind speed and the radial distance from the TC center. At the center of the TC, the tangential wind speed begins at a value of 0 m per second and linearly increases until it reaches the maximum wind speed at the radius of maximum wind speed. Beyond this radius, the wind speed decreases inversely as the distance from the center increases. Valuable insights from Wu and Lei (2012) provided a compilation of statistics regarding the average maximum wind speed radius of TCs.
The computation of the wind field of TCs within Fujian Province was conducted using ArcGIS 10.7 software. The systematic process was as follows (Figure 5): 1) Selection of Path Collection Points: In the initial phase, path collection points were identified for each TC located within a 250 km radius of Fujian Province. 2) Application of the Classical Rankine Vortex Model: The wind field emanating from each path collection point associated with a specific TC was computed using the classical Rankine Vortex model. 3) Identification of maximum wind field: Within the context of each TC, the maximum wind field magnitude was determined from the array of wind fields generated by the various collection points. This pivotal value represented the characteristic wind field of the respective cyclone. 4) Calculation of Average Wind Speed: The mean value of the maximum wind speed was calculated across all TCs within the study area. This value served as an indicative measure of the mean wind speed. This systematic approach not only facilitated the determination of wind field distribution but also allowed for the quantification of cumulative influences resulting from multiple TCs.
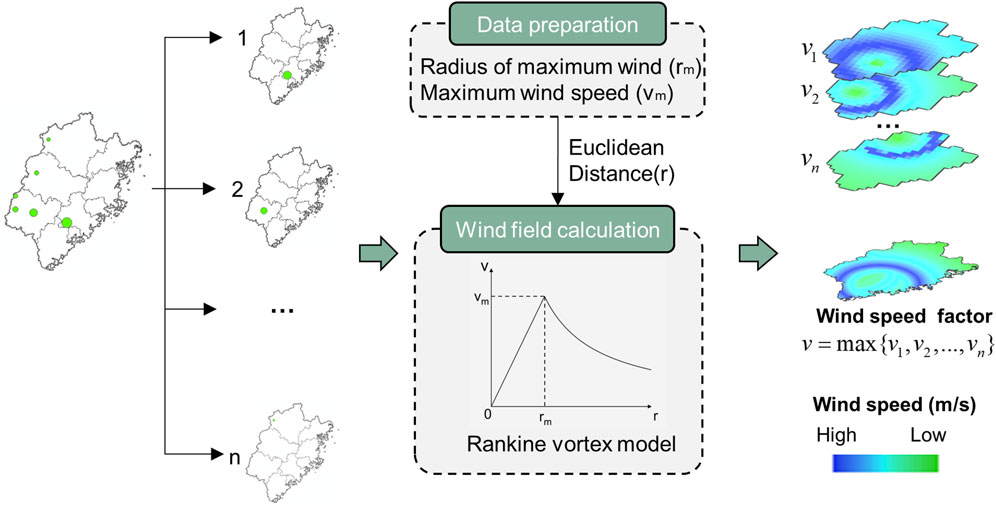
Figure 5. Illustration of wind field calculation for a TC in the study area (The illustration shows a TC named bilis that made landfall from Fujian in 2000).
Figure 6 illustrates the wind speed factor derived from the TCs. Wind speed gradually decreases from the southeastern coastal areas of Fujian Province to the northwestern regions. The rapid deterioration and dissipation of the TCs are attributed to several factors, including the gradual depletion of energy sourced from the ocean, an elevation in surface roughness, and alterations in circulation pattern (Ito et al., 2020; Houze, 2010). These factors contribute to the diminished wind speed experienced by TCs as they move away from the coast. In Fujian province, the typhoon is uplifted by the terrain of the inland mountainous areas, so that a typhoon rainstorm center is formed in the east of the mountain belts in central Fujian, which often leads to landslides, debris flows, collapses and other disasters.
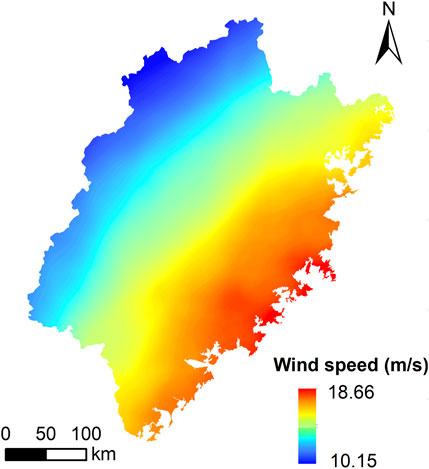
Figure 6. Wind speed factor calculated from TCs.
3.2 Bayesian network model
A BN model integrates Bayesian theory and graph theory. The inference is based on a priori knowledge and objective evidence and belongs to classification models. Its framework comprises two essential elements: the network structure and network parameters, as represented by the equation:
3.2.1 Structure learning
This study determines the structure and parameters of a BN and conducts inference by learning from the available data. The Hill Climbing (HC) search strategy, coupled with the Bayesian Information Criterion (BIC) scoring function, was employed to learn the network relationships among the inducing factors in the process of LSA. The HC algorithm emerges as a strategic choice within structural learning algorithms, particularly when dealing with extensive datasets. Its effectiveness is particularly salient in circumventing the challenges associated with local optima, a common issue encountered by conventional greedy algorithms during structural optimization. It effectively avoids being ensnared in local optima by prioritizing an optimization approach grounded in singular solutions. Simultaneously, the BIC scoring technique is a robust tool for identifying the network structure yielding the most favorable score. Incorporating a complexity penalty term within the BIC framework mitigates overfitting, thereby ensuring that the network structure retains its capacity for generalization. The visual representation of the network structure derived from the structural learning process is depicted in Figure 4.
3.2.2 Parameter learning
Within the context of independent identical distribution, parameter learning commonly employs two principal methodologies: Maximum Likelihood Estimation (MLE) and Bayesian Estimation (BE). BE, in particular, stands out as it utilizes prior parameter distribution and selection principles, effectively mitigating the overfitting risks inherent in MLE. The integration of hyperparameters refines BE, rendering it robust and stable even when handling small-sample data.
3.2.3 Inference
Bayesian inference relies on the interaction of the network structure and the Conditional Probability Table (CPT). Within this context, the Variable Elimination (VE) algorithm is a preferred choice, simplifying the calculation process by decomposing the joint distribution. VE’s key characteristics of simplicity and generality align well with its exact inference. Moreover, the versatility of VE allows it to handle complex network scenarios effectively. Expanding upon VE’s framework, a suite of algorithms, such as the bucket elimination algorithm, further enhances the inference ability by accommodating various optimal elimination orders.
3.3 Noise filtering
We conducted a noise filtering method to filter out mislabeled data and enhance the quality of the model-training dataset. Detailed steps of the noise filtering process are as follows (Figure 7): 1) Dataset partitioning: The dataset was randomly divided into equal subsets, with one segment earmarked for testing and the remaining segments designated for training; 2) Initial training set selection: Initially, one subset was chosen to train a BN model and predict the subsequent subset.; 3) Noise filtering: If the difference between the predicted value and the actual value for an instance within the subset exceeded the predefined threshold “t,” the instance would be removed. Conversely, the instance would be included in the training set if the difference fell within the threshold. The threshold value “t” is calculated using the equation:
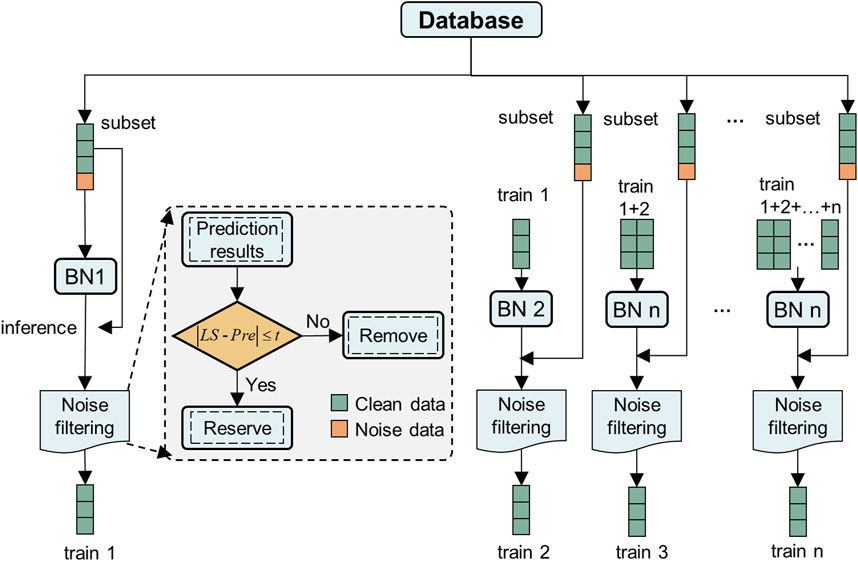
Figure 7. Illustration of the noise filtering process.
3.4 Moran’s I index
This study utilized Moran’s I to investigate the spatial relationship between landslide density and susceptibility. Moran’s I is a widely employed metric for assessing spatial autocorrelation, encompassing global and local Moran’s I. The computation of global Moran’s I yields results within the range of [−1, 1], where a value greater than zero indicates a positive spatial autocorrelation. There is a clustering phenomenon across the entire spatial domain. The magnitude of the index indicates the degree of clustering, with larger values indicating more pronounced clustering. Conversely, a value less than zero suggests a spatial negative correlation, indicating a dispersion pattern in the spatial distribution of the study object. A zero value denotes no spatial autocorrelation or an absence of spatial correlation. The equation of Moran’s I is as Equation 3:
In the equation, n represents the total number of samples, wij denotes the distance weight between i and j, Yi and Yj represent the variable values for the i th and jth samples respectively,
Compared to global Moran’s I, local Moran’s I emphasize assessing local spatial clustering patterns. While global Moran’s I indicates overall spatial clustering, it lacks specificity in identifying the regions where clustering phenomena occur. Additionally, even if global Moran’s I indicates no overall spatial autocorrelation, local spatial clustering may still manifest in specific areas. The equation of local Moran’s I is as Equation 4:
In the equation,
4 Results
4.1 Correlations between landslides and influencing factors
To better analyze the relationships between landslides and inducing factors, the frequency density of landslides and landscape (non-landslide) areas was compared, as shown in Figure 5. A slope is more likely to fail where the frequency density of landslides is higher than the landscape. Regions with a history of frequent landslides are more susceptible to future landslides due to persistent geological and environmental conditions that favor such occurrences.
4.1.1 Topographic and geomorphic factors
Topography, particularly micro-topography, significantly contributes to landslide occurrences within Fujian Province, particularly regarding slope angle and height. Most landslides tend to occur on convex slopes. This study selected altitude and slope as topographic and geomorphic factors. For the analysis of altitude (Figure 8E), landslides are more likely to transpire in areas between 200–400 m, as these regions typically feature loose deposits. Concerning slope, landslides are prevalent when the slope ranges between 3°–10° (Figure 8C). Regions within this slope interval tend to possess more loose sediments on the surface. As the slope steepens, although it provides greater energy for sliding, the heightened slope also indicates that the soil or rock has increased strength, which can hinder landslide occurrences (Wu et al., 2021).
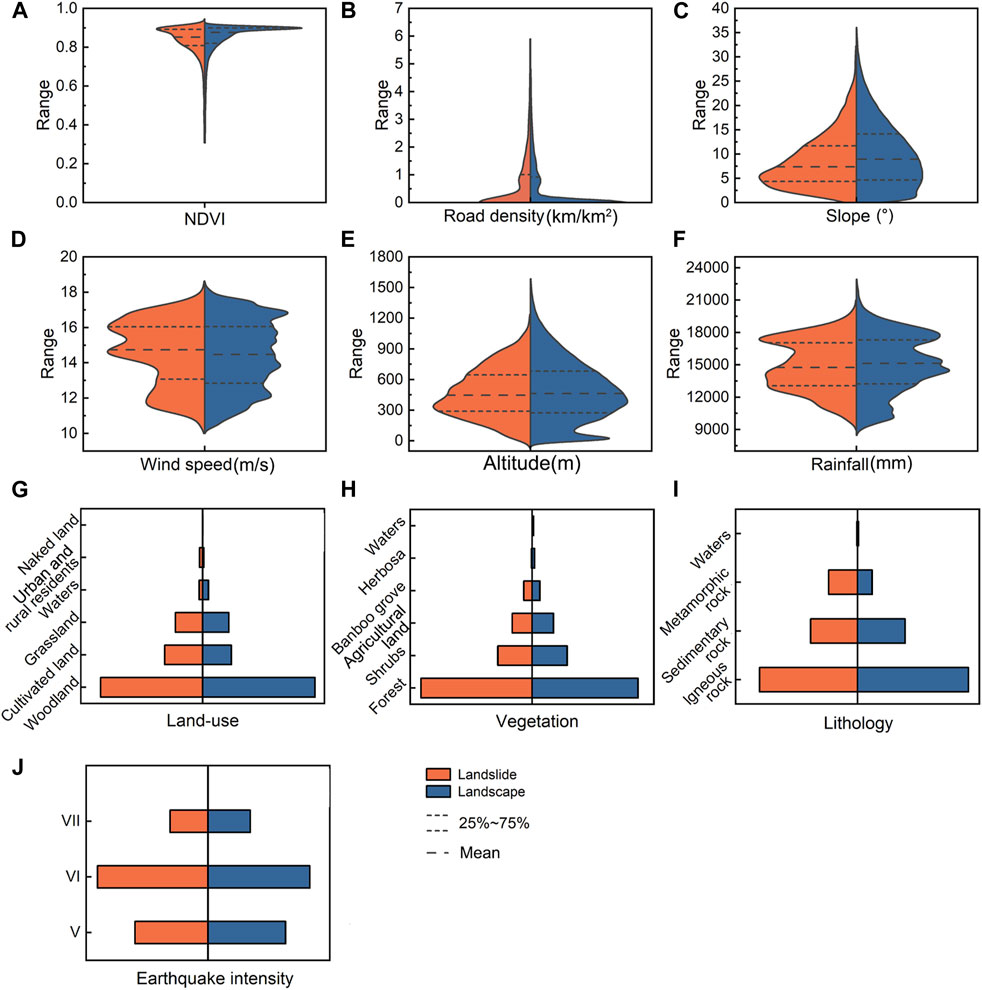
Figure 8. Landslide frequency density estimates of the influencing factors; (A) NDVI; (B) Road density; (C) Slope; (D) Wind speed; (E) Altitude; (F) Rainfall; (G) Land-use; (H) Vegetation; (I) Lithology; (J) Earthquake intensity.
4.1.2 Basic geology factors
Geological factors are vital in shaping geomorphic features. Different lithologies exhibit varying degrees of hardness and weathering. The occurrence of landslides is influenced by the lithology and weathering degree of the underlying bedrock. Soft rocks and fragmented rock-soil materials are more prone to landslides. Landslide densities are generally higher on metamorphic rocks (Figure 8I). Earthquakes are usually accompanied by varying collapse, landslides, and debris flow. Classification of earthquake intensity also reflects the distribution of faults. As shown in Figure 8J, landslides in Fujian tend to occur with seismic intensity levels of VI degree or higher.
4.1.3 Land cover factors
In this study, we investigated the impact of land use practices on shallow soil landslides, focusing on vegetation, NDVI, and land use as land cover factors. For NDVI, higher values are commonly associated with lower landslide susceptibility (Figure 8A). However, the analysis results also reveal the complexity of landslide causation. Despite the perceived stability related to regions with high NDVI and forests, landslides still occur in these areas. These regions usually feature hilly and mountainous terrain, which are more prone to landslides. Vegetation with well-developed roots stabilizes the slopes, creating a complex network of fibers within the soil, enhancing its shear strength. Thick roots can penetrate deep into the bedrock, serving as anchoring elements for the shallow soil. These factors collectively contribute to the slope stability (Bordoloi and Ng, 2020; Pandey et al., 2022). However, the stabilizing effect of trees on slope stability may be limited under certain wind load conditions (Zhuang et al., 2022). This observation may explain why landslides are more prevalent in forested areas when considering the vegetation factor (Figure 8H). Regarding the Land-use factor; landslides are concentrated in cultivated land (Figure 8G). In Fujian Province, where arable land is scarce, many farmers have reshaped slopes for agricultural purposes, leading to numerous unstable cut slopes and an increased risk of landslides.
4.1.4 Human engineering activities factors
As for road density, areas with higher road density generally exhibit higher landslide densities (Figure 8B). The imbalanced alteration of rock and soil mass resulting from construction projects such as housing and road development, including excavation and slope-cutting activities, can increase the susceptibility of mountain slopes to instability and damage. Moreover, the high population density and extensive engineering activities in these areas exacerbate the occurrence of geological disasters. However, regions with the highest road density are less susceptible to landslides due to their high level of urbanization and superior infrastructure management.
4.1.5 Climate environmental factors
Situated adjacent to the Pacific Ocean, Fujian Province and its coastal areas are frequently affected by typhoon rainstorms. The heavy rainfall accompanying typhoons decreases the mechanical strength of the soil, serving as an important triggering factor for landslides. Areas with annual rainfall ranging between 12,000–14,000 mm are more susceptible to landslides than those with higher or lower rainfall levels (Figure 8D). These areas mainly concentrate in central Fujian Province. The rapid uplift of the terrain in the region creates a center of intense rainfall in its vicinity. Additionally, areas with wind speeds in the range of 14–16 m/s also exhibit a higher density of landslides, which can be attributed to the increased erosion and soil instability caused by strong winds (Figure 8F).
4.2 Landslide susceptibility mapping
This study uses the landslide inventory consisting of 5,992 distinct points as a fundamental dataset. These points were identified as positive samples and designated with a value 1. Additionally, an equivalent number of points were randomly selected from the study area, serving as negative samples designated with a value of 0. The dataset of this study consists of both landslide and non-landslide points. The entirety of the modeling procedure proposed a Bayesian Network model to analyze the distribution characteristics of landslide disasters in Fujian Province. Within this method, noise filtering was implemented after the inference of the Bayesian Network model. This iterative process progressively filters noise in the subsets, thereby reducing the impact of mislabeled data on prediction accuracy (Figure 9).
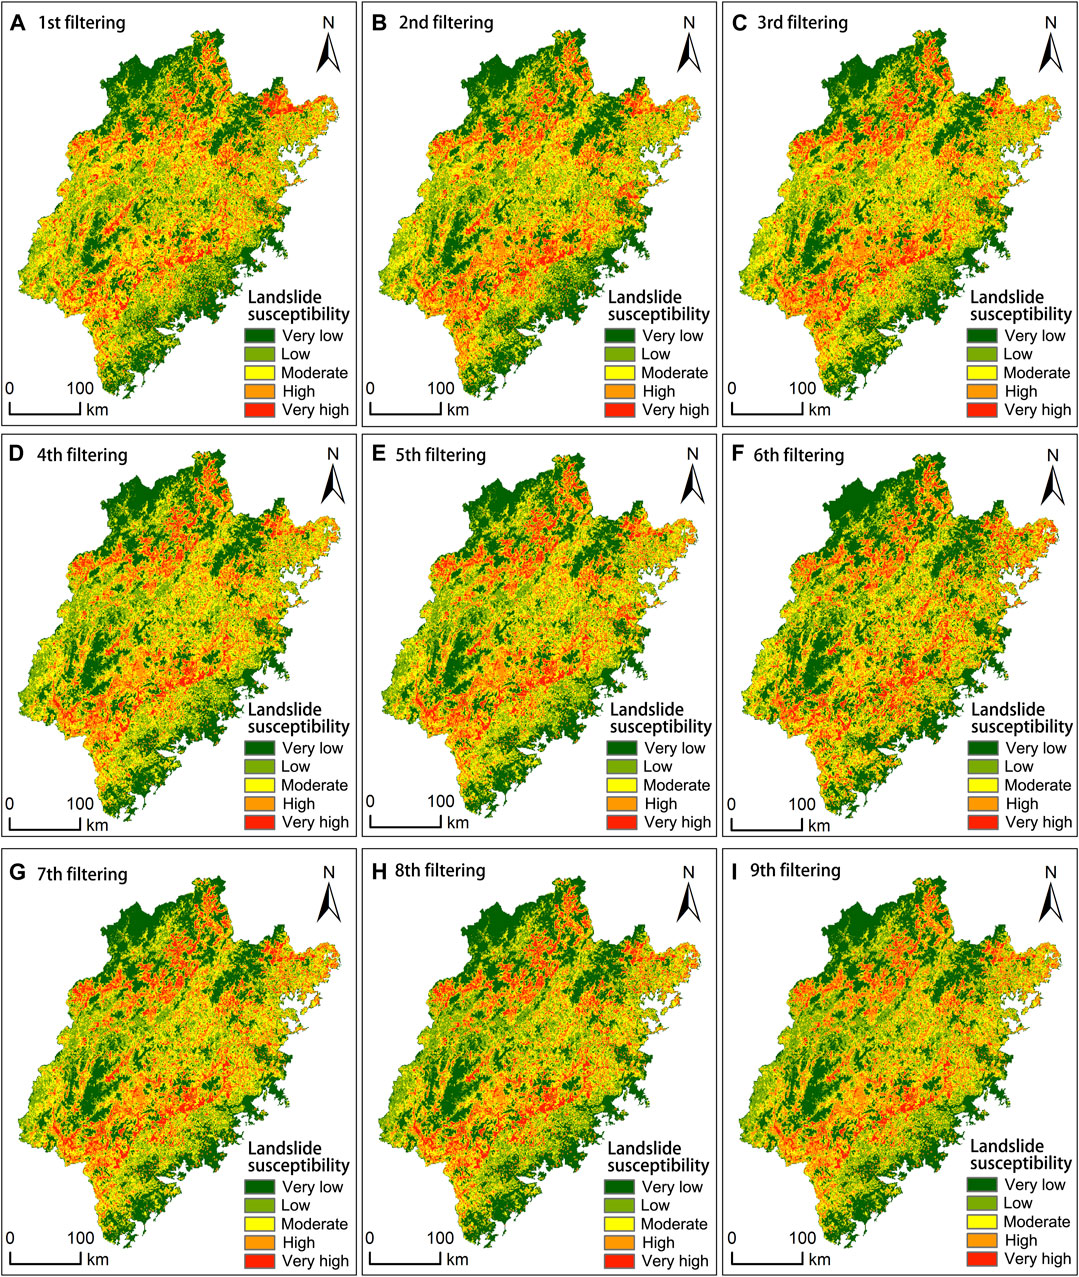
Figure 9. Landslide susceptibility map of Fujian Province during the process of noise filtering; (A) 1st filtering; (B) 2nd filtering; (C) 3rd filtering; (D) 4th filtering; (E) 5th filtering; (F) 6th filtering; (G) 7th filtering; (H) 8th filtering; (I) 9th filtering.
This study incorporated a comprehensive array of factors as inputs for the landslide susceptibility modeling. The variables included altitude, slope, vegetation cover, land-use patterns, NDVI, lithology, earthquake intensity, rainfall patterns, wind speed, and road density. A noise filtering method was adopted to enhance the accuracy of LSA, which served as a primary strategy in this investigation. After the training process with noise filtering, the landslide susceptibility index (LSI) was effectively forecasted. The spatial distribution of landslide susceptibility predicted by noise-filtered samples in Fujian Province is presented in Figure 9. It can be seen from Figure 9 that the high and extremely high susceptibility areas in Fujian Province are mainly located near the mountain belts in central and western Fujian which aligns with the actual spatial distribution pattern of landslide occurrences. The relatively flat areas in the East and southeast coast of the province are mostly low and extremely low susceptibility. With the progress of the noise filtering, the proportion of each susceptibility level changes, the proportion of high and extremely high susceptibility areas increases, and the identifiability of landslide susceptibility mapping gradually increases.
4.3 Results analysis
4.3.1 Factor importance
Altitude, wind speed, and lithology respectively were identified as the main controlling factors of landslides (Figure 10). Wind speed stands out with a factor importance score of 0.23, ranking as the second most influential factor in our landslide susceptibility modelling. This highlights the significant impact of wind speed on landslide occurrences in the study area, emphasizing the necessity of incorporating this factor in landslide risk assessments.
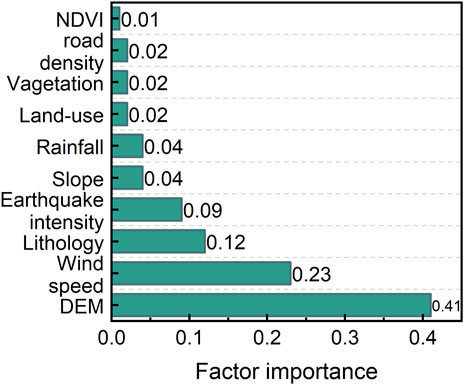
Figure 10. Factor importance of wind speed factor.
4.3.2 Accuracy analysis
To assess the accuracy, the Area Under the Curve (AUC) metric was adopted as the evaluation criterion for the performance of the machine learning model. A higher AUC value signifies greater accuracy in predictive results. The results of this evaluation are depicted in Figure 11A, where the AUC value steadily increases from 0.838 to 0.931, while the standard deviation gradually decreases. This trend indicates a consistent improvement in model accuracy and reliability, as the model becomes more consistent and dependable in its predictions. This trend highlights the progressive efficacy of the noise filtering approach in enhancing the precision and reliability of the machine learning model for LSA.
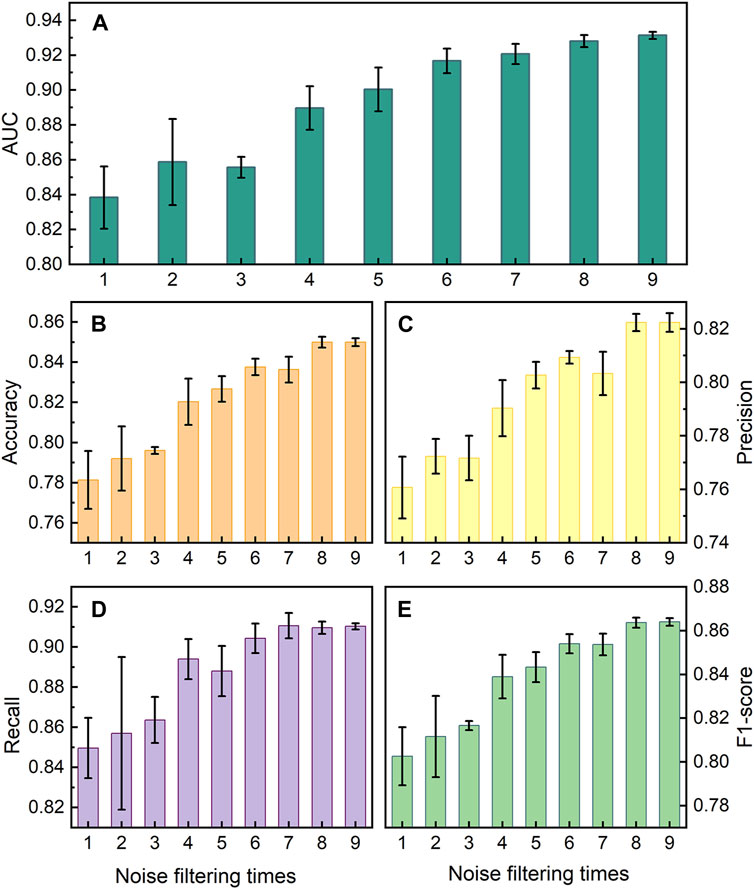
Figure 11. Accuracy of each time noise filtering (A) AUC; (B) Accuracy; (C) Precision; (D) Recall; (E) F1-score.
Additionally, other key indicators including accuracy, precision, recall, and the F1-score were also involved in the assessment of model classification performance. Higher values of the indicators indicate better classification performance of a model. As shown in Figures 11B–E, these indicators collectively manifest a demonstrably enhanced model performance as the noise filtering times increase. A consistently increasing metric accompanied by a gradually decreasing standard deviation suggests that the model is enhancing and getting more stable throughout the noise filtering process While precision is vital in minimizing false positives, a high recall rate is essential for capturing all instances of landslides. In the context of LSA, prioritizing recall is vital to correctly identify potential landslide-prone areas. According to the results, although both metrics showed improvement during the noise filtering process, the precision reaches a maximum of 0.82 and the recall reaches a maximum of 0.91.
4.3.3 Spatial correlation analysis
The LSI also possesses a high level of accuracy spatially. We employed the GeoDa software to obtain Moran’s I and evaluate the spatial correlation between LND and LSI. The calculated values for Moran’s I, p-value, and Z-score were 0.335, 0.012, and 529, respectively. At a 95% confidence level, both the p-value and z-value passed the significance tests. These results indicate a positive correlation between LND and LSI, which indicates that the predicted values closely align with actual values.
To further analysing local clustering patterns, we computed the Local Indicators of Spatial Association (LISA) based on the local Moran’s I index. Figure 12 depicts the LISA map for LND and LSI. Elevated high-high regions on the map indicate areas with high LND and LSI values, while low-low regions signify areas with low values for both variables. The predominant distribution of high-high areas closely aligns with regions characterized by high and very high LSI. These regions are mainly in the central and western parts of Fujian Province and run north-east through the province. Similarly, low-low regions correspond to areas with low and very low LSI in the southeastern coastal areas. These findings provide further validation of the predictive accuracy of this study.
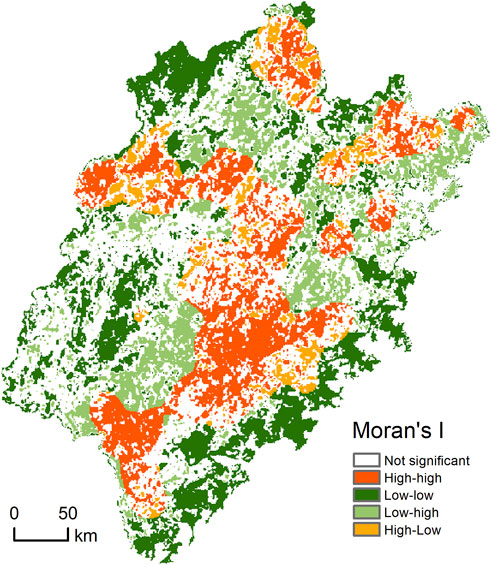
Figure 12. Local Moran’s I index between LND and LSI.
4.4 Landslide susceptibility assessment in Fujian
Figure 13 presents the cumulative percentage of landslide susceptibility levels for different cities and counties in Fujian Province. In Figure 13A, the proportion of varying susceptibility intervals within the cities. Correspondence between abbreviations and full names is in Supplementary Table 1. Cities such as QZ and ND have a higher percentage of high and very high susceptibility areas, while cities like XM have a smaller percentage. Figure 13B presents the percentage distribution of different susceptibility levels across various cities. Most areas fall into the low susceptibility category, followed by moderate and very low susceptibility. The high and very high landslide susceptibility is the least prevalent, accounting for less than 10%. Figure 13C displays the distribution of susceptibility levels in subordinate counties and districts across different cities. The susceptibility levels exhibit an uneven distribution among the counties and districts of different cities. Overall, the percentage of landslide susceptibility levels across different cities is controlled by the mountainous regions of central and western Fujian. The cities of SM, NP, and LY, traversed by the mountain belt in western Fujian, have higher susceptibility levels. The southeastern coastal cities of Xiamen and Putian with flatter terrain thus have lower susceptibility levels. In cities such as QZ and FZ, the western regions are characterized by the complex terrain of the mountain belt in central Fujian, while the eastern regions are coastal plains. The complex terrain results in highly uneven susceptibility levels across districts and counties.
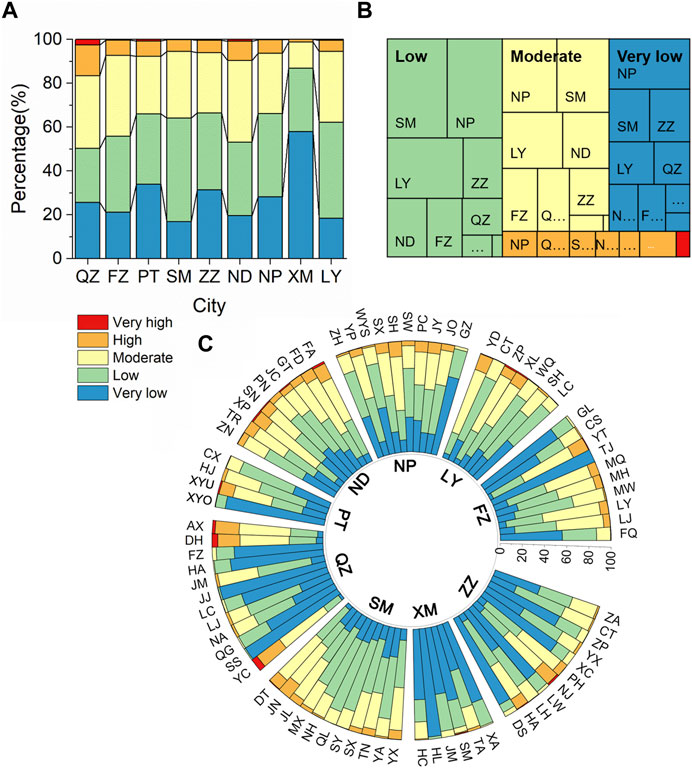
Figure 13. Percentage accumulation diagram of landslide susceptibility (A) Percentage accumulation diagram of each city; (B) Percentage accumulation diagram of susceptibility level; (C) Percentage accumulation diagram of each county.
5 Discussion
The study of extreme weather and the disasters it brings has been extended through various mathematical and physical methods. In this research work, a wind speed factor was built based on Rankine vortex model and history TCs. We have analyzed the landslide distribution pattern and constructed a noise filtering method based on the BN model to investigate how mislabeled samples impact the model performance.
Mature TCs often produce spiral rainbands that can lead to local winds, heavy rainfall, and storm surges (Tang et al., 2018). This convective effect can cause a series of disasters, including landslides, floods, and urban waterlogging, especially before and after a TC makes landfall (Zhuang et al., 2022). While annual rainfall provides an indication of the level of rainfall in a year, it may not accurately reflect or measure the impact of short-term heavy rainfall brought by TCs. The Rankine vortex model was used to quantify historical tropical cyclone data and derive the wind speed factor (Figure 6). Methods for quantifying the impact of typhoons include: 1) The wind pressure model, which describes the relationship between wind speed and distance from the typhoon center, enabling a more accurate assessment of the damage caused by TCs and serving as crucial tool for evaluating typhoon impacts; 2) Integration of historical typhoons, which characterizes the impact of typhoons by combining the intensity and frequency of historical events (Batke et al., 2014; Qi et al., 2023). Qi et al. (2023) quantified the destructiveness of TCs by this method.
The predictive performance of classification learning algorithms is limited by data quality (Khoshgoftaar and Rebours, 2007; Johnson and Khoshgoftaar, 2022). Non-landslide points in most existing studies were just randomly selected from the entire study area (Wu, 2019; Cui et al., 2022). There’s a possibility of mislabeling some points with high landslide susceptibility as non-landslide points, what is known as label noise. Huang et al. (2020) highlighted the issue of selecting non-landslide samples and chose non-landslide points from areas with very low susceptibility under a semi-supervised algorithm. Our study proposes a noise filtering method that gradually eliminates lower-quality samples, which significantly improved the quality of non-landslide samples (Figure 11). The threshold for the noise filtering method is set to 0.7, effectively filtering out samples with large deviations between predicted and actual values. Additionally, adjusting the threshold allows for controlling the balance between the acceptable sample deviation and the number of samples removed (Khoshgoftaar and Rebours, 2007).
It’s worth acknowledging that certain limitations might be associated with this study. Landslides are affected by terrain, geology, hydrology, and other factors, leading it impossible to identify areas that will never experience landslides. Selecting non-landslide points that are completely accurate and reliable is challenging. Therefore, we can only work to improve this issue, but we cannot entirely resolve it. The primary focus of our study was to tackle sample noise and amplify the model’s classification performance by addressing noise within the samples. The noise instances that get filtered is contingent on the selected threshold value. Although this study did not extensively delve into exploring the optimal threshold value selection, this aspect doesn’t detract from the performance enhancement achieved through the noise filtering methodology. Determining the optimal threshold value and further enhancing the methodology may involve employing various search algorithms, such as hill-climbing, simulated annealing, or genetic algorithms.
6 Conclusion
We have analyzed the landslide distribution pattern and constructed a noise filtering method based on the BN model to investigate how mislabeled samples impact the model performance. In the landslide-prone region, landslides are mainly located in the central and western parts of Fujian Province and run north-east through the province. Over 70% of landslides occurred during the rainy season from May to August. In the landslide susceptibility assessment process, 10 geoenvironmental factors have informed the BN model as predictors. Moreover, we have calculated the historical tropical cyclone dataset as a wind speed geoenvironmental factor to consider the impact of tropical cyclones on landslides. And it was proved to be the second most significant factor.
We have also progressively filtered the mislabeled data in non-landslide sets with the noise filtering method in this study. As expected, the AUC value has been improved from 0.838 to 0.931 during the process. Furthermore, the final landslide susceptibility results have been made into a landslide susceptibility map. The reliability was confirmed by Moran’s I index. The LISA shows consistent distribution patterns for high LND and LSI regions, further highlighting the reliability. The results demonstrate the ability of the noise filtering method in the quality enhancement of training sets and the performance of machine learning models. The noise filtering method offers a viable approach for enhancing the quality of the non-landslide dataset and a useful reference for reliable landslide susceptibility mapping in the study area and similar areas.
Data availability statement
The original contributions presented in the study are included in the article/Supplementary Material, further inquiries can be directed to the corresponding authors.
Author contributions
SZ: Supervision, Writing–review and editing, Conceptualization, Funding acquisition, Methodology, Project administration, Software. JL: Methodology, Software, Data curation, Formal Analysis, Investigation, Visualization, Writing–original draft. JZ: Supervision, Writing–review and editing. ZX: Methodology, Writing–review and editing. XL: Data curation, Resources, Writing–review and editing.
Funding
The author(s) declare that financial support was received for the research, authorship, and/or publication of this article. The authors declare that financial support was received for the research, authorship, and/or publication of this article. This work has received funding from the Natural Science Foundation of China (Grant No. 12062026), the Science and Technology Infrastructure Program of Guizhou Province (2020-4Y047), Natural Resources Science and Technology Project of Fujian Province (KY-070000-04-2021-025), Natural Science Foundation of Hunan Province, China (2023JJ30135), and Natural Science Foundation of Changsha (kq2208031). All these fundings are greatly acknowledged.
Acknowledgments
We express our appreciation to ChatGPT 3.5 from OpenAI, which we used to improve the readability and language of the manuscript during the writing process. We also extend our gratitude to the reviewers for their constructive comments, which significantly enhanced the quality of the manuscript.
Conflict of interest
The authors declare that the research was conducted in the absence of any commercial or financial relationships that could be construed as a potential conflict of interest.
Publisher’s note
All claims expressed in this article are solely those of the authors and do not necessarily represent those of their affiliated organizations, or those of the publisher, the editors and the reviewers. Any product that may be evaluated in this article, or claim that may be made by its manufacturer, is not guaranteed or endorsed by the publisher.
Supplementary material
The Supplementary Material for this article can be found online at: https://www.frontiersin.org/articles/10.3389/feart.2024.1444882/full#supplementary-material
References
Abraham, M. T., Vaddapally, M., Satyam, N., and Pradhan, B. (2023). Spatio-temporal landslide forecasting using process-based and data-driven approaches: a case study from Western Ghats, India. Catena 223, 106948. doi:10.1016/j.catena.2023.106948
Batke, S. P., Jocque, M., and Kelly, D. L. (2014). Modelling hurricane exposure and wind speed on a mesoclimate scale: a case study from cusuco NP, Honduras. Plos One 9, e91306. doi:10.1371/journal.pone.0091306
Bordoloi, S., and Ng, C. W. W. (2020). The effects of vegetation traits and their stability functions in bio-engineered slopes: a perspective review. Eng. Geol. 275, 105742. doi:10.1016/j.enggeo.2020.105742
Cengiz, L. D., and Ercanoglu, M. (2022). A novel data-driven approach to pairwise comparisons in AHP using fuzzy relations and matrices for landslide susceptibility assessments. Environ. Earth Sci. 81, 222. doi:10.1007/s12665-022-10312-0
Chakrabortty, R., Pal, S. C., Roy, P., Saha, A., and Chowdhuri, I. (2022). Novel ensemble approach for landslide susceptibility index assessment in a mountainous environment of India. Geocarto Int. 37, 13311–13336. doi:10.1080/10106049.2022.2076924
Cui, Y. L., Jin, J. L., Huang, Q. B., Yuan, K., and Xu, C. (2022). A data-driven model for spatial shallow landslide probability of occurrence due to a typhoon in ningguo city, anhui province, China. Forests 13, 732. doi:10.3390/f13050732
Houze, R. A. (2010). Clouds in tropical cyclones. Mon. Weather Rev. 138, 293–344. doi:10.1175/2009mwr2989.1
Huang, F. M., Cao, Z. S., Jiang, S. H., Zhou, C. B., Huang, J. S., and Guo, Z. Z. (2020). Landslide susceptibility prediction based on a semi-supervised multiple-layer perceptron model. Landslides 17, 2919–2930. doi:10.1007/s10346-020-01473-9
Huang, F. M., Ye, Z., Zhou, X. T., Huang, J. S., and Zhou, C. B. (2022). Landslide susceptibility prediction using an incremental learning Bayesian Network model considering the continuously updated landslide inventories. Bull. Eng. Geol. Environ. 81, 250. doi:10.1007/s10064-022-02748-2
Ito, K., Wu, C.-C., Chan, K. T. F., Toumi, R., and Davis, C. (2020). Recent progress in the fundamental understanding of tropical cyclone motion. J. Meteorological Soc. Jpn. 98, 5–17. doi:10.2151/jmsj.2020-001
Johnson, J. M., and Khoshgoftaar, T. M. (2022). A survey on classifying big data with label noise. Acm J. Data Inf. Qual. 14, 1–43. doi:10.1145/3492546
Khoshgoftaar, T. M., and Rebours, P. (2007). Improving software quality prediction by noise filtering techniques. J. Comput. Sci. Technol. 22, 387–396. doi:10.1007/s11390-007-9054-2
Lan, M., Zhu, J. P., and Lo, S. M. (2021). Hybrid Bayesian network-based landslide risk assessment method for modeling risk for industrial facilities subjected to landslides. Reliab. Eng. and Syst. Saf. 215, 107851. doi:10.1016/j.ress.2021.107851
Lin, J., Chen, W., Qi, X., and Hou, H. (2021). Risk assessment and its influencing factors analysis of geological hazards in typical mountain environment. J. Clean. Prod. 309, 127077. doi:10.1016/j.jclepro.2021.127077
Lu, X., Yu, H., Ying, M., Zhao, B., Zhang, S., Lin, L., et al. (2021). Western North pacific tropical cyclone database created by the China meteorological administration. Adv. Atmos. Sci. 38, 690–699. doi:10.1007/s00376-020-0211-7
Ma, S., Shao, X., and Xu, C. (2023). Landslides triggered by the 2016 heavy rainfall event in sanming, fujian province: distribution pattern analysis and spatio-temporal susceptibility assessment. Remote Sens. 15, 2738. doi:10.3390/rs15112738
Mihaljevic, B., Bielza, C., and Larrañaga, P. (2021). Bayesian networks for interpretable machine learning and optimization. Neurocomputing 456, 648–665. doi:10.1016/j.neucom.2021.01.138
Nie, W., Feng, D., Lohpaisankrit, W., Li, C., Yuan, J., and Chen, Y. (2019). A dynamic Bayesian network-based model for evaluating rainfall-induced landslides. Bull. Eng. Geol. Environ. 78, 2069–2080. doi:10.1007/s10064-017-1221-2
Pandey, H. P., Gnyawali, K., Dahal, K., Pokhrel, N. P., and Maraseni, T. N. (2022). Vegetation loss and recovery analysis from the 2015 Gorkha earthquake (7.8 Mw) triggered landslides. Land Use Policy 119, 106185. doi:10.1016/j.landusepol.2022.106185
Pradhan, B. (2013). A comparative study on the predictive ability of the decision tree, support vector machine and neuro-fuzzy models in landslide susceptibility mapping using GIS. Comput. and Geosciences 51, 350–365. doi:10.1016/j.cageo.2012.08.023
Qi, J. D., He, B. J., Cao, Y., Dong, J. Y., and Lin, E. S. (2023). Risk assessment of terrestrial protected areas to extreme wind hazards: a case study in Queensland, Australia. Landsc. Urban Plan. 240, 104888. doi:10.1016/j.landurbplan.2023.104888
Singh, A., Chhetri, N. K., Nitesh, , Gupta, S. K., and Shukla, D. P. (2023). Strategies for sampling pseudo-absences of landslide locations for landslide susceptibility mapping in complex mountainous terrain of Northwest Himalaya. Bull. Eng. Geol. Environ. 82, 321. doi:10.1007/s10064-023-03333-x
Song, Y., Gong, J., Gao, S., Wang, D., Cui, T., Li, Y., et al. (2012). Susceptibility assessment of earthquake-induced landslides using Bayesian network: a case study in Beichuan, China. Comput. and Geosciences 42, 189–199. doi:10.1016/j.cageo.2011.09.011
Sukristiyanti, S., Wikantika, K., Sadisun, I. A., Yayusman, L. F., and Pamela, P. (2020). “Utilization of google maps for depicting landslide pattern in Indonesia,” in Fifth International Conferences of Indonesian Society for Remote Sensing: The Revolution of Earth Observation for a Better Human Life, West Java, Indonesia, 17-20 September 2019.
Tang, X., Lee, W.-C., and Bell, M. (2018). Subrainband structure and dynamic characteristics in the principal rainband of typhoon hagupit (2008). Mon. Weather Rev. 146, 157–173. doi:10.1175/mwr-d-17-0178.1
Tian, Y. Y., Owen, L. A., Xu, C., Shen, L. L., Zhou, Q., and Figueiredo, P. M. (2020). Geomorphometry and statistical analyses of landslides triggered by the 2015 MW 7.8 gorkha earthquake and the MW7.3 aftershock, Nepal. Front. Earth Sci. 8. doi:10.3389/feart.2020.572449
United Nations (2019). Asia-pacific disaster report 2019: pathways for resilience, inclusion and empowerment.
Wu, C. H. (2019). Landslide susceptibility based on extreme rainfall-induced landslide inventories and the following landslide evolution. Water 11, 2609. doi:10.3390/w11122609
Wu, J. L., Ma, C., Yang, W. T., Lyu, L. Q., and Miao, L. (2021). Recent expansion of talus slopes in the northern taihang mountain range, China: an example from the xiaowutai region. Landslides 18, 3027–3040. doi:10.1007/s10346-021-01715-4
Wu, L. Y., and Lei, X. T. (2012). Preliminary research on the size of inner core and periphery and their relationship with the intensity of tropical cyclones. J. Trop. Meteorology 28 (05), 719–725. doi:10.3969/j.issn.1004-4965.2012.05.011
Xiao, F., Yin, Y., Luo, Y., Song, L., and Ye, D. (2011). Tropical cyclone hazards analysis based on tropical cyclone potential impact index. J. Geogr. Sci. 21, 791–800. doi:10.1007/s11442-011-0880-3
Yang, H. J., Yang, T. Q., Zhang, S. J., Zhao, F. H., Hu, K. H., and Jiang, Y. H. (2020). Rainfall-induced landslides and debris flows in mengdong town, yunnan province, China. Landslides 17, 931–941. doi:10.1007/s10346-019-01336-y
Yang, N., Wang, R., Liu, Z. F., and Yao, Z. J. (2023). Landslide susceptibility prediction improvements based on a semi-integrated supervised machine learning model. Environ. Sci. Pollut. Res. 30, 50280–50294. doi:10.1007/s11356-023-25650-0
Ye, P., Yu, B., Chen, W., Liu, K., and Ye, L. (2022). Rainfall-induced landslide susceptibility mapping using machine learning algorithms and comparison of their performance in Hilly area of Fujian Province, China. Nat. Hazards 113, 965–995. doi:10.1007/s11069-022-05332-9
Ying, M., Zhang, W., Yu, H., Lu, X., Feng, J., Fan, Y., et al. (2014). An overview of the China meteorological administration tropical cyclone database. J. Atmos. Ocean. Technol. 31, 287–301. doi:10.1175/jtech-d-12-00119.1
Youssef, A. M., Pradhan, B., Dikshit, A., Al-Katheri, M. M., Matar, S. S., and Mahdi, A. M. (2022). Landslide susceptibility mapping using CNN-1D and 2D deep learning algorithms: comparison of their performance at Asir Region, KSA. Bull. Eng. Geol. Environ. 81, 165. doi:10.1007/s10064-022-02657-4
Yuan, R., and Chen, J. (2022). A hybrid deep learning method for landslide susceptibility analysis with the application of InSAR data. Nat. Hazards 114, 1393–1426. doi:10.1007/s11069-022-05430-8
Keywords: landslide susceptibility mapping, GIS, tropical cyclone, Bayesian network model, noise filtering
Citation: Zhou S, Li J, Zhang J, Xu Z and Lu X (2024) Exploring Bayesian network model with noise filtering for rainfall-induced landslide susceptibility assessment in Fujian, China. Front. Earth Sci. 12:1444882. doi: 10.3389/feart.2024.1444882
Received: 06 June 2024; Accepted: 07 August 2024;
Published: 29 August 2024.
Edited by:
Lingling Shen, Beijing Meteorological Information Center, ChinaReviewed by:
Chong Xu, Ministry of Emergency Management, ChinaHuiran Gao, Ministry of Emergency Management, China
Copyright © 2024 Zhou, Li, Zhang, Xu and Lu. This is an open-access article distributed under the terms of the Creative Commons Attribution License (CC BY). The use, distribution or reproduction in other forums is permitted, provided the original author(s) and the copyright owner(s) are credited and that the original publication in this journal is cited, in accordance with accepted academic practice. No use, distribution or reproduction is permitted which does not comply with these terms.
*Correspondence: Suhua Zhou, emhvdXN1aHVhQGhudS5lZHUuY24=; Jiuchang Zhang, emhhbmdqaXVjaGFuZ0Bmb3htYWlsLmNvbQ==