 Yiming Wang
 Dengcai Xu3
 Youjian Yang
- 1College of Civil Engineering and Architecture, Wenzhou University, Wenzhou, China
- 2Zhejiang Engineering Research Center of Disaster Prevention and Mitigation for Coastal Soft Soil Foundation, Wenzhou, China
- 3Wenzhou Geological Environment Monitoring Center, Wenzhou, China
- 4Lishui Geological Environment Monitoring Center, Lishui, China
Typhoon-induced debris flows pose a significant threat to the southeastern coastal regions of China. The existing typhoon-induced debris flow warning models, however, are largely limited in the refinement of their rainfall thresholds and in their lack of integration with geological factors. This study proposes a typhoon-induced debris flow warning model based on refined rainfall thresholds by integrating them with geological factors. Firstly, based on the characteristic rainfall of 159 debris flows in seven typhoon rainstorms between 1999 and 2019, the rainfall thresholds of debris flow under different geological conditions were obtained. Close relationships were noticed between rainfall thresholds and the number and density of debris flow disasters. The deterministic coefficient method (DCM) and sensitivity index were used to derive the weights of the geological factors, and the geological groups of the rock masses and vegetation type were the most important geological factors for debris flows. Finally, a typhoon-induced debris flow warning model was constructed, and refined rainfall thresholds were obtained. Due to different geological backgrounds, there were significant differences in the warning rainfall thresholds for debris flow disasters in different regions of the study area. The ROC indicator showed the high accuracy of this debris flow warning model. This research provides a scientific basis for the early warning and prediction of debris flows in typhoon-prone area of China.
1 Introduction
Typhoon-induced debris flows are a specific rainfall-induced geological hazards. In the past few decades, typhoon-induced landslides and debris flows have caused serious damage and casualties in the southeastern coastal areas of China (Chang et al., 2020; Tang and Xu, 2021; Qin et al., 2022; Zhuang et al., 2023; Huang et al., 2024). To effectively mitigate typhoon-induced debris flows, establishing a warning model is both urgent and necessary (Giannecchini et al., 2012).
As debris flows are always induced by typhoon rainstorms, appropriate rainfall thresholds are the key to ensuring the accuracy of debris flow warnings. A variety of models have been developed to obtain rainfall thresholds for debris flows and landslides. Traditional methods include empirical models and process-based models (Sengupta et al., 2010; Segoni et al., 2018; Dikshit et al., 2020; Guzzetti et al., 2020). Empirical models are based on historical and statistical thresholds, they can predict the general time when a debris flow is initiated but cannot predict the location. Process-based models attempt to extend spatially the slope stability models, they can predict the timing and location, but require detailed geological factors of the slopes (and gullies) (Jiang et al., 2017; Chen et al., 2020; Chen et al., 2023; Zhang et al., 2024a; 2024b). Therefore, at a larger regional scale, empirical models are still better suited for establishing rainfall thresholds than process-based models (Huang et al., 2022a). Among numerous empirical models, Caine proposed the first expression of the rainfall threshold (the I-D expression) for the relationship between intensity and duration of rainfall in 1980, which largely described the effects of the rainfall’s intensity and duration on landslide hazards (Caine, 1980). Since then, rainfall threshold models based on the I-D expression have been widely used at local, regional, and global scales. As to typhoon-induced debris flows warning models, they are established with different combinations of rainfall, such as cumulative rainfall, duration, intensity, effective rainfall, and stimulated rainfall. (Li et al., 2017; Yang et al., 2020; Lee et al., 2021). Among these models, the I-D expression is the most mainstream model.
Given the complexity of the formation process and mechanism of geo-disasters induced by rainfall under different geological backgrounds (Zhang et al., 2024c, 2024d), it is difficult to quantify the combination of geological backgrounds in geo-hazard warning. So far, most of the rainfall thresholds for inducing geo-hazards have been established without considering the region’s geological environment, which has made it difficult to reflect the influence of geological factors and has thus increased the uncertainty of debris flow warnings (Zhu et al., 2004; Martelloni et al., 2012). Obviously, different geological background conditions have played a controlling role in the occurrence of debris flows. If geological factors are integrated into the geological disaster prediction model, it will inevitably improve the accuracy of the prediction model. Therefore, the establishment of refined rainfall thresholds for typhoon-induced disasters, considering the geological conditions, is key to regional disaster prevention and control efforts. In recent years, some studies have tried to integrate rainfall thresholds with geological backgrounds (Segoni et al., 2018; Guzzetti et al., 2020; Ciccarese et al., 2021). In these studies, rainfall thresholds were used for temporal predictions, and the geological backgrounds were used for spatial predictions. At the early stage, matrix-based approaches consisting of rainfall thresholds and susceptibility to landslides were used to predict landslides and debris flows (Segoni et al., 2015; Pradhan et al., 2019). The results represented the varying landslide hazards according to rainfall threshold-based warning levels. More recently, some quantitative approaches have been used. A landslide warning model using the automatic modified frequency ratio method (MFRM) was proposed to couple the temporal and spatial probabilities of landslides. The temporal probability was obtained by the rainfall thresholds, and the spatial probability was obtained by the susceptibility to landslides (Cao et al., 2022). Other studies combined catalogs of typhoon-induced geo-hazards with regional rainfall thresholds using regression methods (Nolasco-Javier and Kumar. 2018) and reliability methods (Jiang and Huang, 2016; Jiang and Huang, 2018; Huang et al., 2021; Huang et al., 2022b). For some geo-hazards, when information was lacking on the physical mechanisms for a disaster’s occurrence, machine learning approaches were applied to determine rainfall thresholds for different recurrence periods of rainfall intensity (Wei et al., 2019; Lin and Wang, 2024).
Although significant progress has been made in building geo-hazard warning models based on rainfall thresholds, there are still many shortcomings in the refinement and application of rainfall thresholds for typhoon-induced debris flows. Firstly, most studies have focused on large-scale geo-hazard warnings, but the refinement and application of small-scale geo-hazard warnings has been insufficient. Secondly, the combinations of rainfall thresholds and geological factors were qualitative or semi-quantitative, the methods of combination were mostly subjective, causing research results to vary from person to person. Lastly, the geological factors considered were mostly expressed in terms of susceptibility to geo-hazards and were not directly combined with rainfall thresholds.
This study proposes a typhoon-induced debris flow warning model based on the integration of rainfall thresholds and geological factors. Firstly, based on the characteristic rainfall of 159 debris flows in seven typhoon rainstorms between 1999 and 2019, the rainfall thresholds of debris flow under different geological conditions were obtained. Then the deterministic coefficient method (DCM) was used to construct a warning model for typhoon-induced debris flows by integrating rainfall thresholds with geological factors. Due to different geological backgrounds, there were significant differences in the warning rainfall thresholds for debris flow disasters in different regions of the study area. The typhoon-induced debris flow warning model provides a scientific basis for the early warning and prediction of debris flows in typhoon-prone area of China.
2 Data sources and analytical methods
The development of the proposed warning model included the following three major steps (Figure 1): 1) Statistics on characteristic rainfall of typhoon-induced debris flows; 2) obtaining rainfall thresholds for five geological factors; 3) building a warning model for typhoon-induced debris flows by integrating rainfall thresholds with geological factors; and validate the warning model.
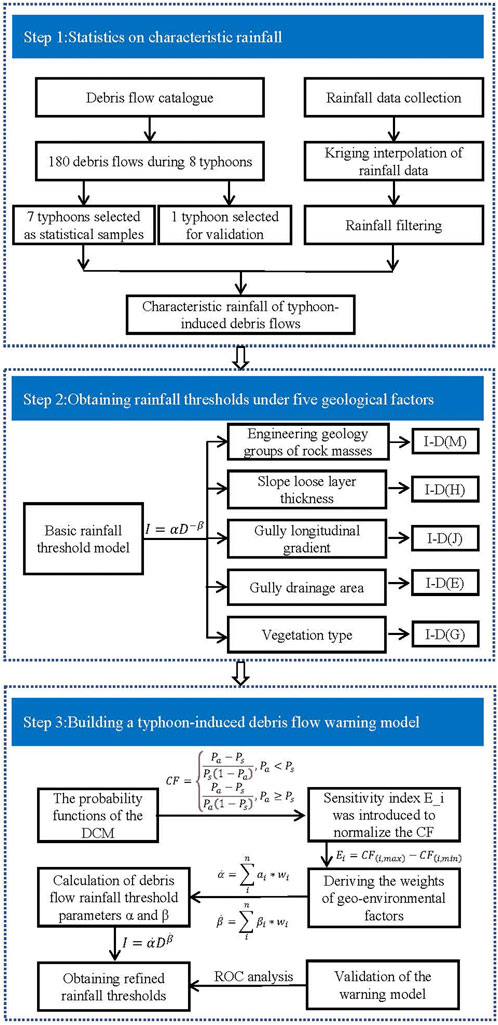
Figure 1. Flowchart of the procedure for constructing the warning model for typhoon-induced debris flows.
2.1 Research data
Wenzhou, located in the southeastern region of Zhejiang Province, China, was chosen as the study area in this research. This city had a population of approximately 8.318 million at the end of 2022 and occupies a land area of approximately 12,102.7 km2, four-fifths of which is mountainous with a fragile geological environment. The geological structure belongs to the southeastern Zhejiang Fold Belt of the South China Fold System, with a large amount of volcanic clastic rocks, extrusive rocks, and intrusive rocks. The geomorphic unit belongs to the southern branch of the Lingnan Mountains in China, mainly consisting of medium and low mountains. The mountains are generally oriented in a northeast to southwest direction, and the slopes are in a stepped shape from southwest to northeast. The highest point has an altitude of 1,611.3 m (Bai Yun Jian). The area falls within the subtropical marine monsoon climate zone, characterized by distinct seasons and abundant rainfall. The annual average temperature ranges from 16.0°C to 18.1°C, and the annual average rainfall ranges from 1,255 mm to 2009 mm. The rainfall shows a bimodal pattern, with relatively less rainfall in summer and winter, and abundant rainfall in the rainy season and typhoon season. The vegetation types in the area include subtropical evergreen broadleaf forests, subtropical mixed evergreen broadleaf and deciduous broadleaf forests, mixed coniferous and broadleaf forests, pure coniferous forests, and bamboo forests.
Debris flow data were collected from Wenzhou Natural Resources and Planning Bureau. Between 1999 and 2022, 279 debris flows occurred in the study area, with an average of 11.6 per year. The temporal distribution was extremely uneven, with 85.6% of the debris flows occurring from August to September. Of the 279 debris flows, 184 were directly induced by typhoon rainstorms, accounting for 65.9%. Among the 184 typhoon-induced debris flows, detailed rainfall data were available for 180 debris flows that were induced by eight typhoons. These 180 debris flows were selected as the calculation objects in this study. Among the eight typhoons, seven typhoons were selected as statistical samples, and the last typhoon (Lekima) was selected for validation of the model, in which 21 debris flows occurred (Zhou et al., 2022) (Table 1; Figure 2).
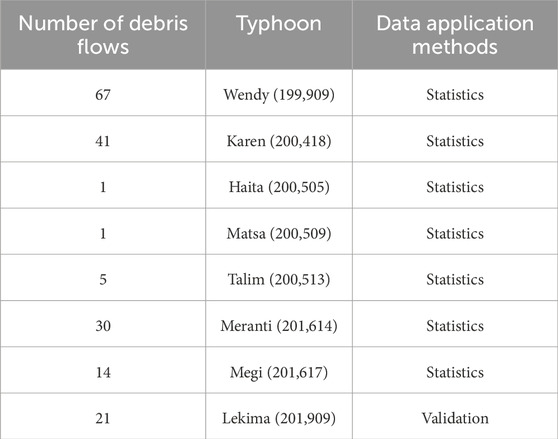
Table 1. Table of 180 typhoon-induced debris flows in the study area.
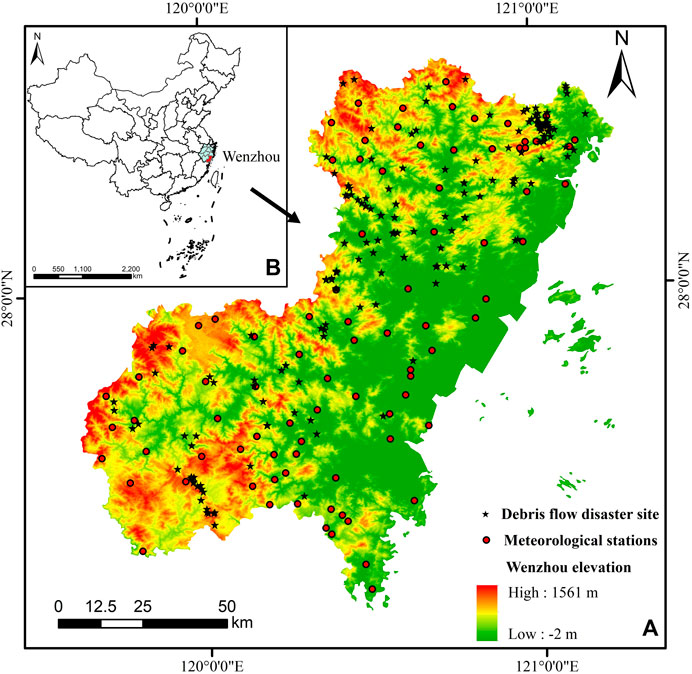
Figure 2. Map of the meteorological stations and debris flows in the study area (Wenzhou City, Zhejiang Province, China).
Hourly rainfall data during the eight typhoons that triggered the abovementioned debris flows were collected from the Department of Meteorology and Water Resources of Wenzhou, and the accuracy of the rainfall data was 0.1 mm. According to the time when each debris flow occurred, the maximum rainfall of the characteristic periods (1, 3, 6, 12, 24, and 48 h) before the disasters’ occurrence was calculated as the characteristic rainfall and used for statistical analysis.
There were 91 meteorological rainfall stations in the study area at the time, and they were relatively scattered in their spatial distribution. Due to the differences in the spatial distribution of the rainfall data measured by the stations, some filtering steps were implemented to reduce the spatiotemporal variability of the rainfall data. Firstly, Kriging interpolation was used to analyze the spatial distribution of rainfall throughout the study area. Then the points of debris flow disasters were projected onto the rainfall isoline map of the corresponding typhoon rainstorms, and the characteristic rainfall was obtained. Further, to eliminate the interference of abnormally low value data, characteristic rainfall was filtered according to China’s Meteorological Administration’s definition. The screening principles were as follows: 1) 1-h rainfall ≥ 16 mm, 2) 12-h rainfall ≥30 mm, or 3) 24-h rainfall ≥50 mm. After filtering, 911 sets of rainfall data were obtained for calculating the rainfall thresholds for debris flows.
According to the China Geological Hazard Meteorological Risk Early Alert Standard, the early alert level for the meteorological risk of geological hazards is divided into four levels: a blue alert corresponds to a 0%–30% probability of a burst of debris flow, a yellow alert corresponds to a 30%–50% probability of a burst of debris flow, an orange alert corresponds to a 50%–80% probability of a burst of debris flow, and a red alert corresponds to a ≥80% probability of a burst of debris flow (Table 2).

Table 2. Correspondence between the probability of the exceeding the rainfall threshold of debris flows and alert levels.
2.2 Basic rainfall threshold model
The basic rainfall threshold model in this research is the intensity–duration (I-D) rainfall model (Equation 1), which is a strong and valid simplification of the rainfall thresholds of debris flows (Caine, 1980). I-D rainfall model has been used worldwide. In this model, the rainfall parameters are representative and operable, and the formula is a simple power law, making it relatively easier to combine with geological background for rainfall threshold statistical analysis. Therefore, this study adopts this model as the basic model. The I-D rainfall model has been proven workable for rainfall with a duration from 10 min to 10 days (Ozturk et al., 2018). Its form is:
where
2.3 Choice of geological factors
Typhoon-induced debris flow is mainly started in the form of collapse and landslide during typhoon rainstorm. The selection of geological factors is mainly based on this specific formation conditions of typhoon-induced debris flow. First, distribution of rock and soil determine the source of solid materials, the geological groups of the rock masses (M) and the thickness of the loose layer on the slope (H) were selected to reflect the formation of debris flows. Second, the terrain conditions are selected. The longitudinal drop of the gully (J) represent the terrain potential energy, under which the debris flow was formed, and the gully’s drainage area (E) reflected the water conditions. Finally, more and more studies show that Vegetation types (G) have a great impact on slope stability, so it is used as a factor affecting the outbreak of debris flow.
1) Geological groups of the rock masses (Li et al., 2011): These reflected the changes in the physical and mechanical properties of the loose layer on the slope’s surface during the initiation of a debris flow caused by the infiltration of rainfall. Based on the combination of the geological lithology, rock strength, weathering resistance, structural types, and geological characteristics of the rock masses in the study area, the rock masses were divided into four groups, as shown in Figure 3.
2) Thickness of the loose layer on the slope: This reflected the sources of solid material in debris flows. According to the drilling data and the statistical thickness of landslides in the study area, most of the slopes’ loose layers had a thickness of 0.5–3.5 m, so the maximum and minimum soil thicknesses were assumed to be from 3.5 to 0.5 m (Salciarini et al., 2008); therefore the thickness of the loose layer on the slope was as shown in Equation 2.
where
3) Longitudinal gradient of the gully: This reflected the conditions of potential energy for outbreaks of debris flows. The height difference and the length of the main ditch were taken from the 1:10,000 topographic map. This characteristic was calculated as shown in Equation 3:
where
4) The gully’s drainage area: This reflected the convergence conditions and hydrodynamic characteristics of the watershed. It determined the water source conditions for the outbreak of debris flows. The drainage area was derived from 1:10,000 topographic maps.
5) Vegetation types: These reflected the consolidating effects of the vegetation’s roots on the soil during outbreaks of debris flows. Vegetation data in this study were obtained from ESA Landcover’s 300 m dataset (Harper et al., 2023), as shown in Figure 3.
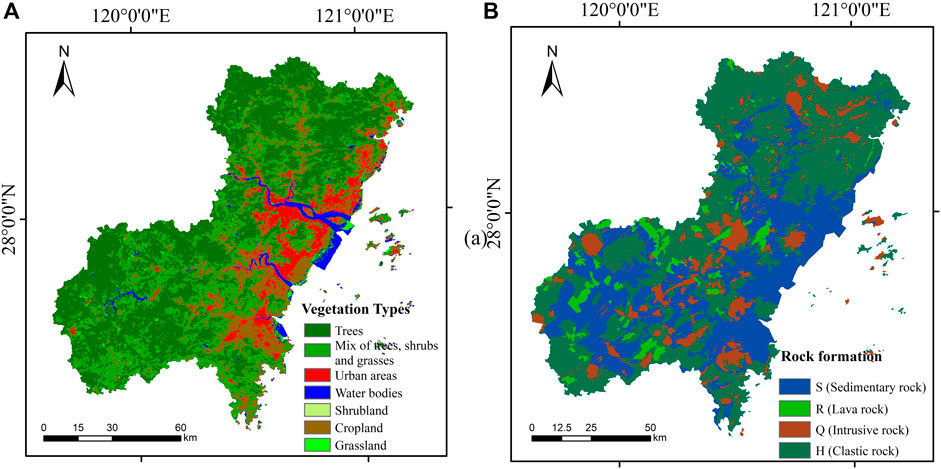
Figure 3. Map of vegetation types (left) and geological groups of the rock masses (right) in the study area.
The geological factors and their groupings are shown in Table 3.
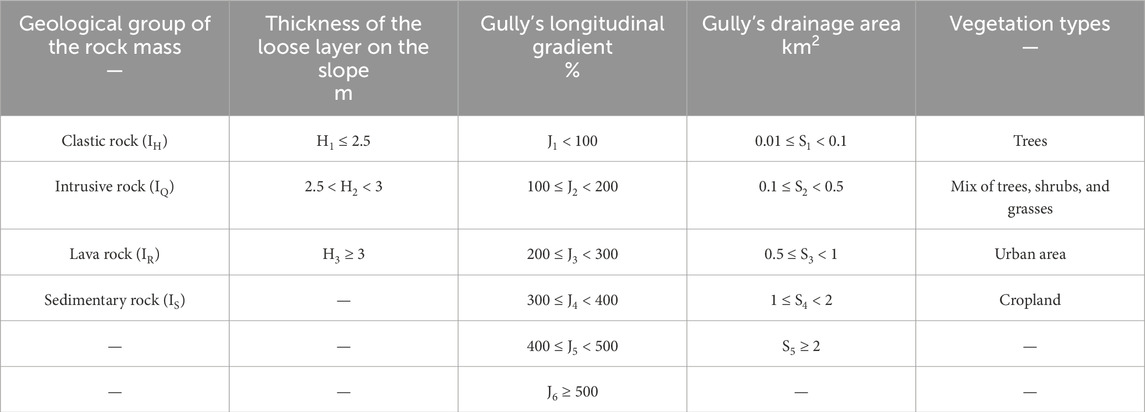
Table 3. Table of geological factors.
2.4 Weights of geological factors
DCM was proposed by Shortliffe (Shortliffe and Buchanan, 1975) and improved by Heckerman (Heckerman, 1986). As a probabilistic function, the DCM can analyze the sensitivities of different factors at the time of an event, and it has been widely used in research on the assessment of rainfall hazards.
In this study, the DCM was used to derive the weights of the geological factors and to establish the refined rainfall thresholds of debris flows. The probability functions of the DCM are shown in Equation 4.
where
After the
where
2.5 A warning model for debris flow
Based on the I-D curve parameters obtained from the various geological factors and the weights of each factor, refined rainfall thresholds for typhoon-induced debris flows were obtained, and the warning model for typhoon-induced debris flows was constructed as shown in Equations 6–8.
Where
2.6 Validation by ROC analysis
The ROC analysis technique is a binary classifier model that typically quantitatively describes the threshold model’s performance in terms of true positives
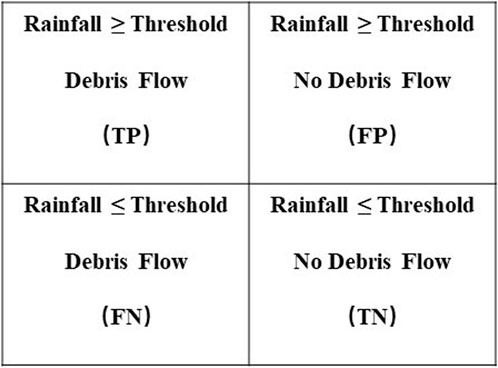
Figure 4. The validation matrix.
3 Construction of a warning model for typhoon-induced debris flows
3.1 Rainfall thresholds of different geological factors
Typhoon-induced debris flows are affected by a combination of many internal and external factors. Previous studies only considered them in terms of unified threshold indicators. To improve the accuracy of the rainfall threshold, debris flow disaster points were classified by geological factors, and the rainfall thresholds of debris flows were calculated separately. The rainfall threshold curves were obtained for each geological factor (Figure 5; Table 4).
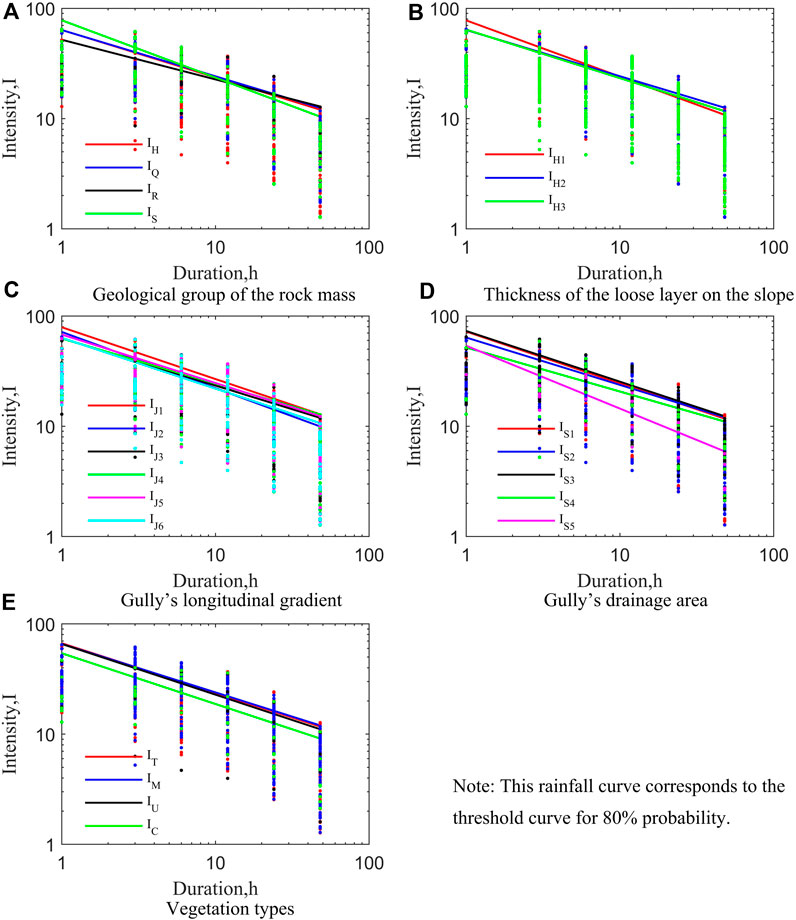
Figure 5. Debris flow rainfall threshold curves for geo-environmental factors under red alerts.
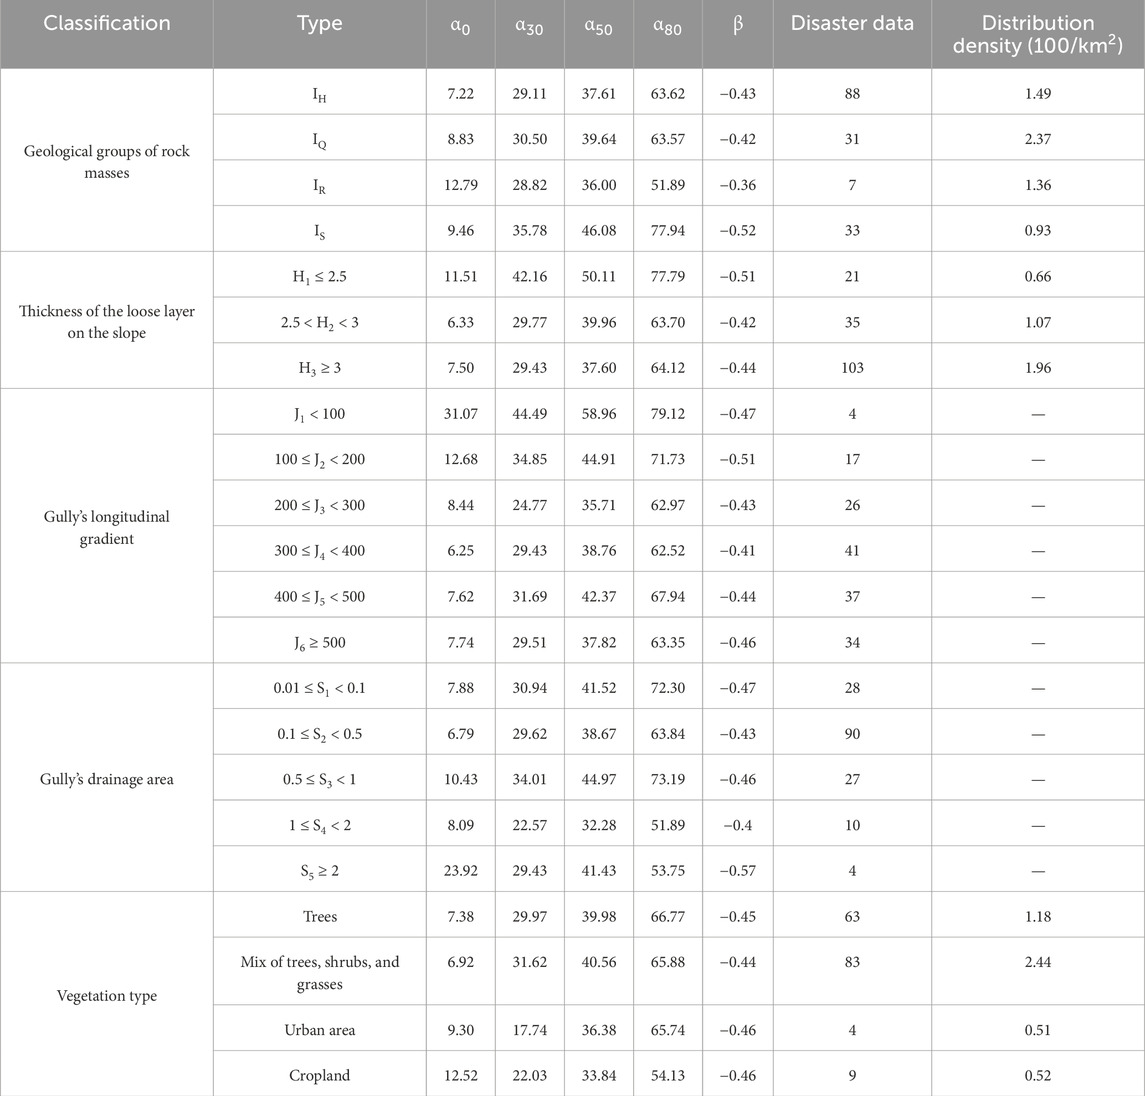
Table 4. Parameters of the rainfall threshold curves for debris flow for the geological factors at different alert levels.
In the rainfall threshold curves, α is a proportional constant. Its physical meaning is the amount of rainfall that triggers a geological disaster when the duration of rainfall (D) is one. For the different geological factors in the study area, the trend of the α-value varied greatly from 32.28 to 58.96. Another influencing factor of α is the probability of a burst of debris flows; α increased obviously as the probability of a burst of debris flows increased. Regarding another important parameter β in the rainfall threshold curves, the β-value characterizes the rate at which the intensity of rainfall (I) that triggers geological hazards decreases with increasing duration. The β-value varied from 0.36 to 0.57 in the study area.
There were four geological groups of the rock masses in the study area. Among them, the thresholds for volcanic clastic rock formations (IH), intrusive rock formations (IQ), and lava rock formations (IR) were relatively low, indicating that these three geological groups were prone to debris flow disasters, while the thresholds for sedimentary rock formations (IS) were relatively high. As for the thicknesses of the loose layer on the slope, the rainfall thresholds for debris flows decreased as the thickness of the loose layer on the slope in-creased. As for the gully’s longitudinal gradient, the rainfall threshold decreased as the longitudinal gradient increased in the study area, reaching the lowest thresholds within the range of 200‰ and 400‰. Regarding the gully’s drainage area, the rainfall thresholds of debris flow were relatively low in the interval of S ≥1.0 km2, followed by the interval within 0.1 km2 ≤ S < 0.5 km2. As for the vegetation types, the rainfall threshold for the occurrence of debris flows in urban areas was the lowest, indicating that the lack of the roots of vegetation in urban areas made it easier for debris flows to occur. The rainfall thresholds for outbreaks of debris flow for mixed trees and shrubs were relatively high.
3.2 Deriving the weights of the geological factors
The DCM was used to derive the weights of the geological factors, as shown in Table 5. The deterministic coefficient showed that the maximum
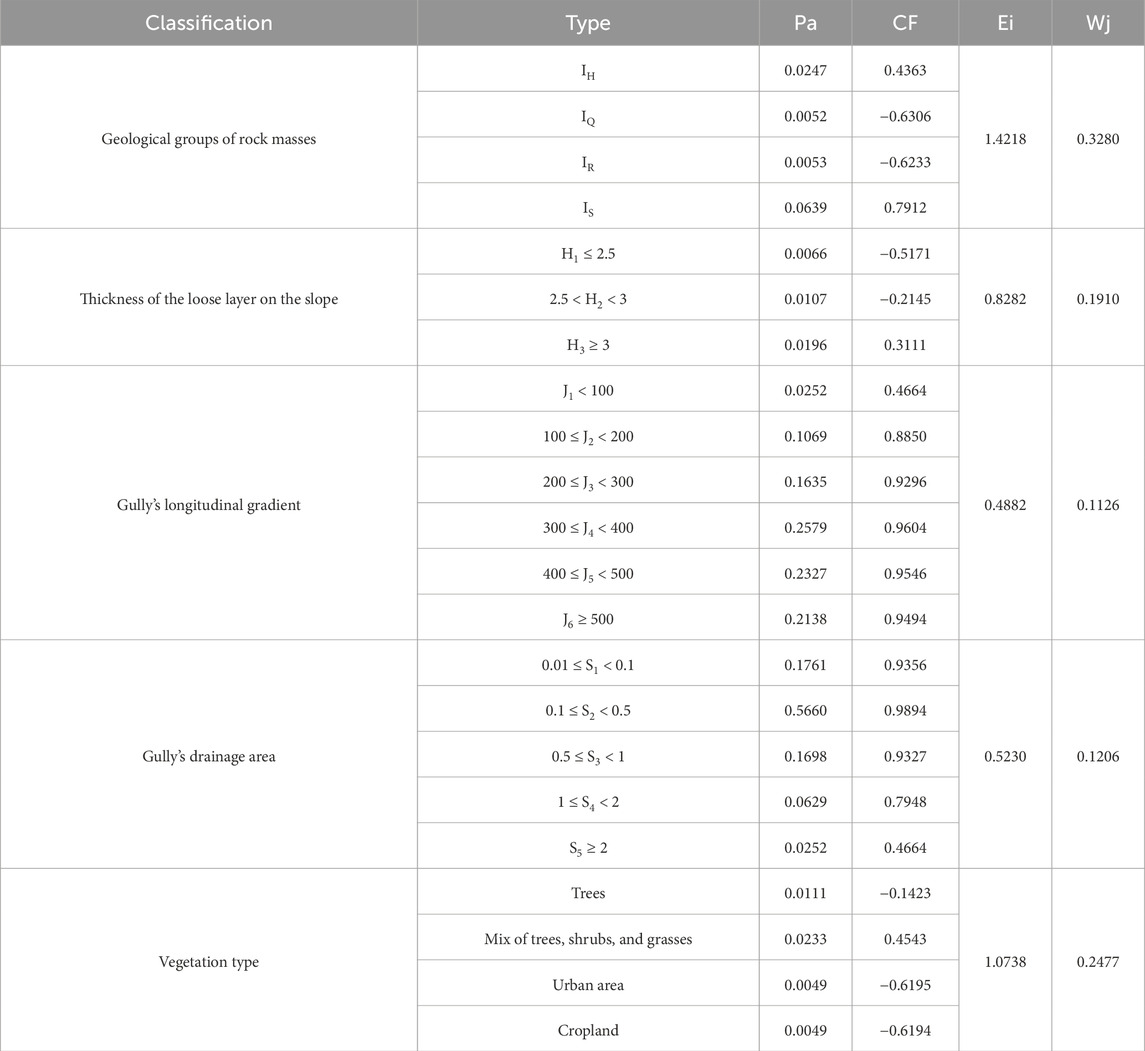
Table 5. Calculated weighting coefficients of the geological factors.
Typhoon-induced debris flows occurred because of multiple factors, and there were complex interactions among the factors, so a sensitivity index was used in this study to investigate the factors’ interactions. The results showed that the sensitivity indexes of the geological group of the rocks and vegetation type were greater than 1, which were the main controlling factors for debris flows in the study area (Ma et al., 2015).
3.3 Obtaining refined rainfall thresholds
Based on the weights of the various geological factors, and the rainfall threshold parameters for the different geological factors, refined rainfall threshold parameters were obtained for typhoon-induced debris flow disasters in the study area (Figure 6). The results showed that the change in the α-value under a blue alert was between 6.69 and 12.54, with an average of 8.17. As the alert level increased, the α-values also increased accordingly; the α-value under a red alert varied between 56.47 and 73.64, with an average of 65.96. The β-values ranged from −0.41 to −0.49, with an average of −0.45, and the variation was more than that of the α-values.
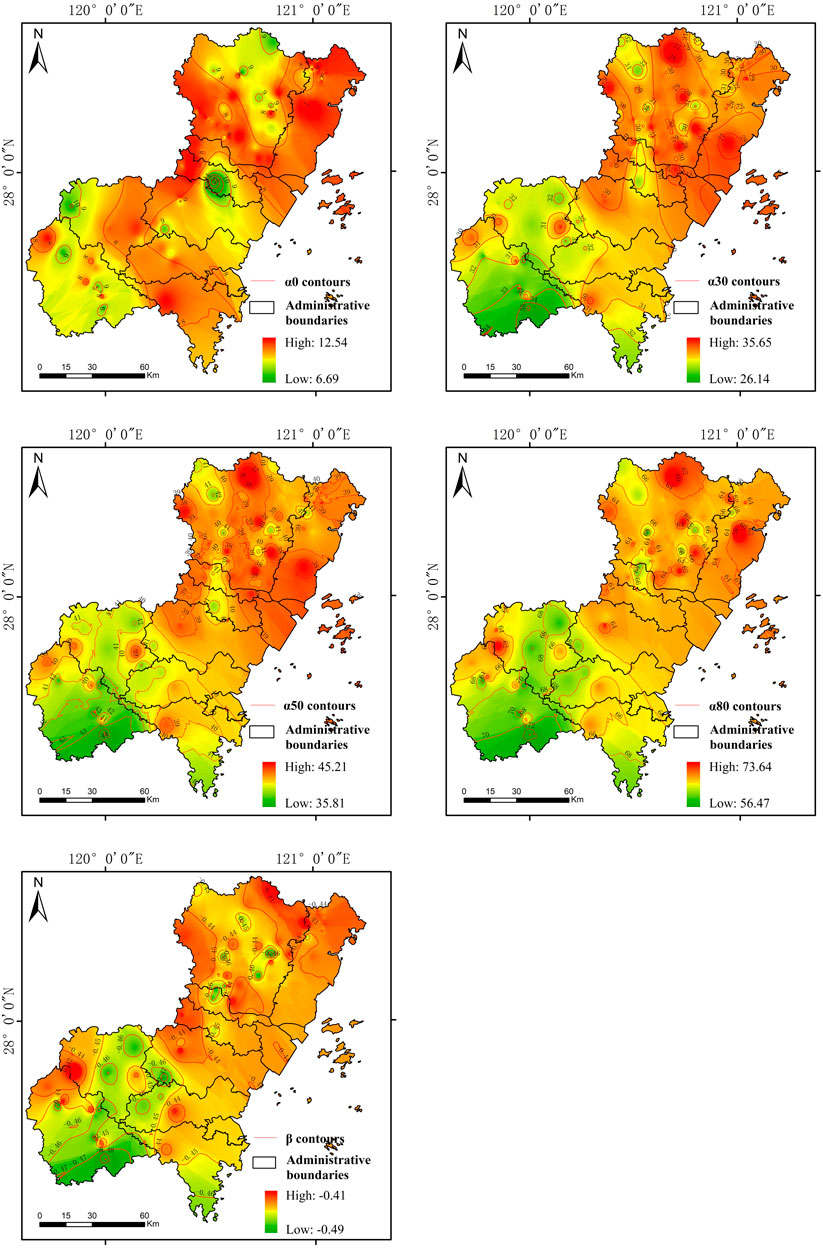
Figure 6. Distribution of the refined rainfall threshold parameters (α and β) at different alert levels in the study area.
According to the refined rainfall threshold parameters, the rainfall thresholds for debris flow within different time intervals between 1 h and 48 h were calculated under four alert levels (blue, yellow, orange, and red), as shown in Figure 7; Table 6. The results showed that there were significant differences in the rainfall thresholds in regions with different geological backgrounds. The north-central region of the study area was prone to outbreaks of debris flows with short rainfall durations, while the probability was higher in the northern and western mountainous regions under long durations, influenced by the change in the β-values.
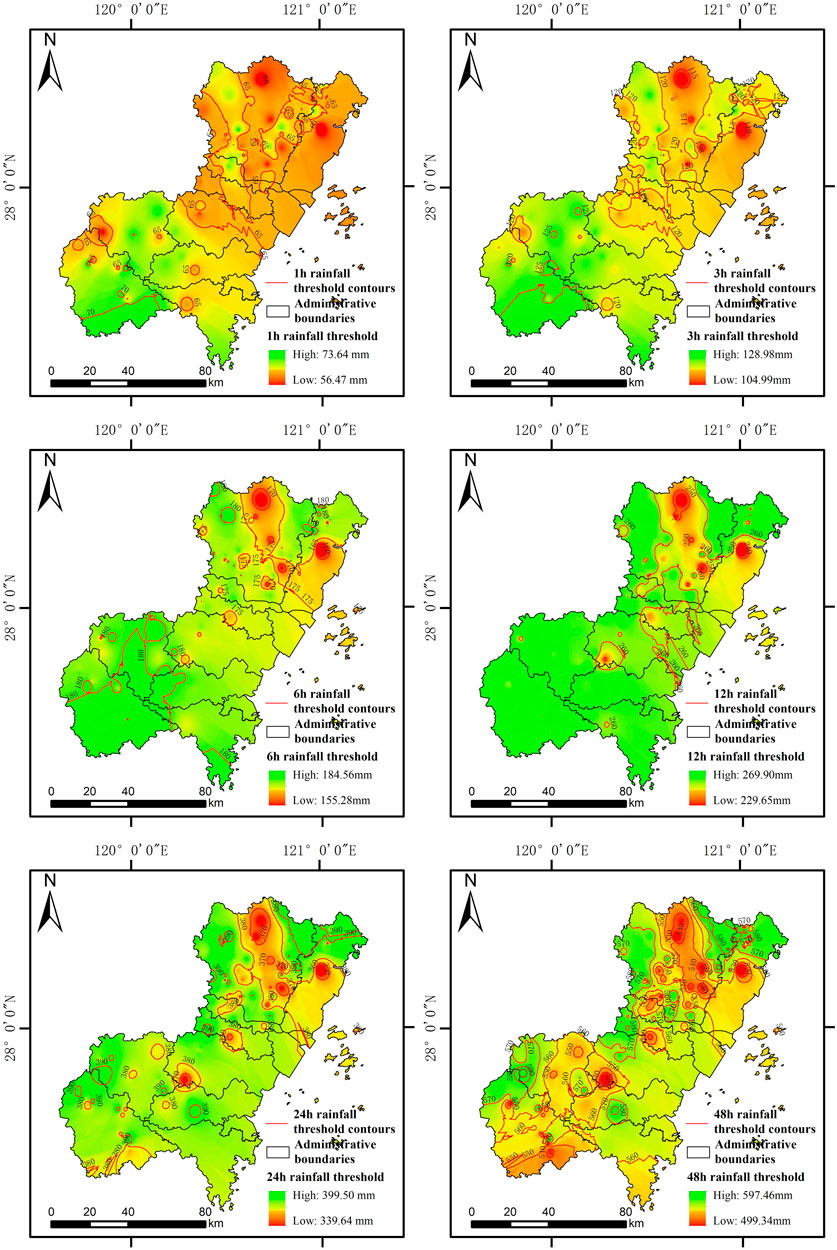
Figure 7. Contour plot of 1–48 h rainfall thresholds of debris flow under red alerts.
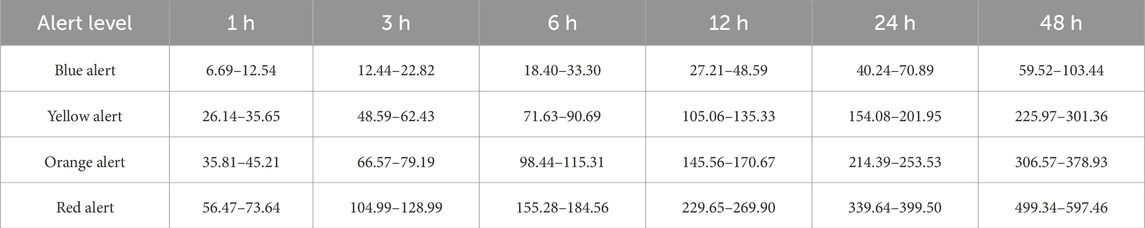
Table 6. The rainfall thresholds of debris flow with different time intervals under the four alert levels.
Compared with the rainfall thresholds of single statistics, the refined rainfall thresholds demonstrated significant variation in the rainfall thresholds at different alert levels for each duration. It also visualized the results of the geological factors and rainfall thresholds of debris flows to provide references for further early alert methods for typhoon-induced debris flows.
3.4 Validation of the warning model for debris flows
The 21 debris flows triggered by Typhoon Lekima were selected for validation of the warning model. As shown in Section 2.1, the cumulative rainfall over 1–48 h during this typhoon was calculated, interpolated via the IDW method, and dynamically compared with the 1–48 h rainfall thresholds under different alert levels to determine the alert level of the study area, and to validate the warning model using the ROC indicator.
Figure 8 shows the alert levels and the distribution of debris flows in the study area during Typhoon Lekima. The results showed that 95.23% of the debris flows in the study area occurred in the area above the orange alert level, and only one debris flow occurred in the blue alert area, so the rainfall thresholds proposed in this study have considerably high accuracy for debris flow warnings. Table 7 shows the evaluation indicators for the alert levels in the study area during Typhoon Lekima, where only the corresponding alert grids and safe area grids were considered for a single alert level. The results showed that considering the performance of a single warning level, the
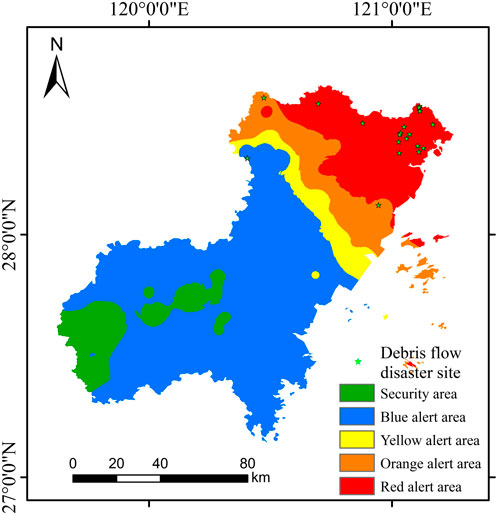
Figure 8. Map of alert levels and debris flows during Typhoon Lekima.
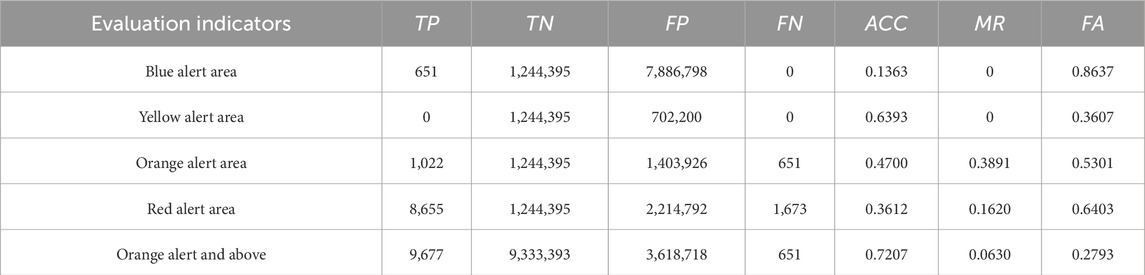
Table 7. Evaluation indicators of the warning model of debris flows during Typhoon Lekima.
4 Discussion
At the regional scale, traditional rainfall thresholds of geo-hazards generally only had a simple form without considering the geological background. In some studies, rainfall thresholds and the geological background were both considered, but the data were acquired separately, and their combination was qualitative or subjective. In this study, a warning model for typhoon-induced debris flows was proposed based on the integration of rainfall thresholds and geological factors. They were acquired synchronously and quantified objectively. Therefore, this research provides a feasible approach for the spatial refinement of rainfall thresholds and high-precision warnings.
Five geological factors were integrated with the rainfall thresholds of debris flows, and the results showed that there were close relationships between rainfall thresholds and the number and density of debris flow disasters. For example, the geological groups of rock masses had a significant controlling effect on the outbreak of debris flows. The thresholds for volcanic clastic rock formations (IH), intrusive rock formations (IQ), and lava rock formations (IR) were relatively low, while the thresholds for sedimentary rock formations (IS) were relatively high. This was consistent with the distribution of debris flows in the study area, in which volcanic debris rock (H) was the group with the highest number of debris flows, the intrusive rock group (Q) was the group with the highest distribution density of debris flows, and sedimentary rock group (S) was the geological group with the lowest distribution density. Moreover, as the thickness of the loose layer increased, the distribution and density of debris flows increased as well, and the rainfall thresholds of debris flows decreased when the thickness of the loose layer on the slope increased. As for the gully’s longitudinal gradient, the rainfall thresholds were also consistent with the distribution of debris flows: there was a significant increase in the number of debris flows were distributed in areas with a gradient above 200‰, with the highest number of debris flows were distributed in areas with gradients between 300‰ and 400‰. The rainfall threshold decreased as the longitudinal gradient increased, reaching the lowest threshold within the range of 200‰ and 400‰. As for the gully’s drainage area, the number of debris flows in gullies with a drainage area between 0.1 km2 and 0.5 km2 was the highest, indicating that this interval was the catchment area most prone to debris flows, while the rainfall threshold for debris flows was relatively low in areas with S ≥ 1.0 km2 and 0.1 km2 ≤ S < 0.5 km2. There were only a few debris flows in locations with a drainage area of S ≥ 1.0 km2; their rainfall thresholds were the lowest, indicating a larger catchment area can more efficiently capture rainfall to stimulate debris flows. Regarding the vegetation types, the rainfall thresholds indicated that anthropogenic destruction of vegetation lowered the rainfall thresholds of debris flows and aggravated outbreaks.
It was found that due to different geological background conditions, there were significant differences in the warning rainfall thresholds for debris flow disasters in different regions of the study area. From the perspective of short-term rainfall thresholds (1 h and 3 h), the effect of the α-values was more obvious. There was a significant trend of the rainfall thresholds in the southern part of the study area being significantly higher than those in the northern part of the study area. As the duration of rainfall increased, the effect of the β-values became increasingly apparent. The rainfall thresholds for 6 to 48 h showed a relatively small overall change, with locally high or low values. For example, the rainfall thresholds in the northern central parts of the study area were always significantly lower than in other areas, while the rainfall thresholds in the western part of the study area were significantly higher than those in other areas.
Verification using data from a typhoon rainstorm showed that our proposed early warning model for debris flows was very effective, which may greatly improve the efficiency of early warning systems and reduce the waste of social resources. Nevertheless, similar to other statistical models, it was inadequate in simulating the physical mechanism of debris flows using only the rainfall thresholds. From an ideal perspective, combining the physical mechanisms of debris flows with statistical models will further improve the efficiency of early warnings of debris flow disasters.
This study innovatively integrated geological factors with rainfall thresholds. However, due to the complexity of typhoon-induced debris flows, the proposed method cannot completely reflect the process and mechanism of slope failure and instability caused by typhoon rainstorm during debris flow formation. Therefore, in the future, it is worth exploring how to combine the regional-scale debris flow warning model with debris flow formation process and mechanism, so that the warning model can fully reflect the development process of debris flow.
5 Conclusion
In this study, 159 debris flows induced by seven typhoons were taken as the research object, and the rainfall thresholds of debris flows were integrated with the geo-environment factors to build an early warning model for typhoon-induced debris flows. Based on this model, refined rainfall thresholds were obtained for different alert levels and time intervals in the study area. The conclusions of this study are as shown below.
(1) To improve the accuracy of the rainfall threshold, points where debris flows occurred were classified according to five geological factors, and the rainfall thresholds of debris flows were calculated separately. Rainfall threshold curves were obtained for each geological factor. The results revealed close relationships between rainfall thresholds and the number and density of debris flow disasters.
(2) The DCM was used to derive the weights of the geological factors. Among them, the geological groups of the rock masses and the vegetation type were the most important geological factors for debris flows.
(3) Based on the parameters of the I-D curve obtained from various geological factors and the weights of each factor, refined rainfall thresholds for typhoon-induced debris flows were obtained, and the warning model was constructed. The results showed that because of different geological backgrounds, there were significant differences in the warning rainfall thresholds for debris flow disasters in different regions of the study area.
(4) The ROC indicator showed that the accuracy of the warning model for debris flows was high. For alerts at orange level and above, the ACC was 0.7207 and the MR was 0.063; 95.23% of the debris flows in the validation cases happened in areas with these alert levels. The results of the study provide a reference for the disaster alerts, forecasting, and risk management in Wenzhou and similar typhoon-prone areas.
Data availability statement
The original contributions presented in the study are included in the article/supplementary material, further inquiries can be directed to the corresponding author.
Author contributions
YW: Conceptualization, Methodology, Writing–original draft, Writing–review and editing. DX: Data curation, Investigation, Writing–original draft. YY: Data curation, Writing–original draft. MZ: Data curation, Resources, Writing–original draft. WC: Data curation, Investigation, Writing–original draft. WL: Data curation, Validation, Writing–review and editing.
Funding
The author(s) declare that financial support was received for the research, authorship, and/or publication of this article. This study was supported by the Wenzhou Natural Resources and Planning Bureau (Grant No. ZZGC-ZBCG-2023026).
Acknowledgments
First, we would like to acknowledge Wenzhou Natural Resources and Planning Bureau for funding this study, and this support is gratefully acknowledged. Second, we acknowledge Department of Meteorology and Water Resources of Wenzhou for providing the relevant data; besides, we thank the reviewers and the editors for their comments and suggestions.
Conflict of interest
The authors declare that the research was conducted in the absence of any commercial or financial relationships that could be construed as a potential conflict of interest.
Publisher’s note
All claims expressed in this article are solely those of the authors and do not necessarily represent those of their affiliated organizations, or those of the publisher, the editors and the reviewers. Any product that may be evaluated in this article, or claim that may be made by its manufacturer, is not guaranteed or endorsed by the publisher.
References
Bennett, G. L., Miller, S. R. M., Roering, J. J., and Schmidt, D. A. (2016). Landslides, threshold slopes, and the survival of relict terrain in the wake of the Mendocino triple junction. Geology 44 (5), 363–366. doi:10.1130/G37530.1
Caine, N. (1980). The rainfall intensity - duration control of shallow landslides and debris flows. Geogr. Ann. Ser. A, Phys. Geogr. 62 (1–2), 23–27. doi:10.1080/04353676.1980.11879996
Cao, Y., Guo, W., Wu, Y., Li, L., Zhang, Y., and Lan, H. (2022). An hourly shallow landslide warning model developed by combining automatic landslide spatial susceptibility and temporal rainfall threshold predictions. J. Mt. Sci. 19 (12), 3370–3387. doi:10.1007/s11629-022-7370-1
Chang, M., Liu, Y., Zhou, Z., and Che, H. (2020). Hazard assessment of a catastrophic mine waste debris flow of hou gully, Shimian, China. Eng. Geol. 275, 105733. doi:10.1016/j.enggeo.2020.105733
Chen, Q., Chen, L., Gui, L., Yin, K., Shrestha, D. P., Du, J., et al. (2020). Assessment of the physical vulnerability of buildings affected by slow-moving landslides. Nat. hazards earth Syst. Sci. 20 (9), 2547–2565. doi:10.5194/nhess-2019-318
Chen, Q., Macciotta, R., Chen, L., Yin, K., Gui, L., and Li, Y. (2023). Proposed vulnerability assessment model for masonry buildings on slow-moving landslides based on physical models and field observations. Bull. Eng. Geol. Environ. 82 (10), 371. doi:10.1007/s10064-023-03385-z
Ciccarese, G., Mulas, M., and Corsini, A. (2021). Combining spatial modelling and regionalization of rainfall thresholds for debris flows hazard mapping in the Emilia-Romagna Apennines (Italy). Landslides 18 (11), 3513–3529. doi:10.1007/s10346-021-01739-w
Dikshit, A., Satyam, N., Pradhan, B., and Kushal, S. (2020). Estimating rainfall threshold and temporal probability for landslide occurrences in Darjeeling Himalayas. Geosciences J. 24 (2), 225–233. doi:10.1007/s12303-020-0001-3
Giannecchini, R., Galanti, Y., and D’Amato, A. G. (2012). Critical rainfall thresholds for triggering shallow landslides in the serchio river valley (Tuscany, Italy). Nat. Hazards Earth Syst. Sci. 12 (3), 829–842. doi:10.5194/nhess-12-829-2012
Guzzetti, F., Gariano, S. L., Peruccacci, S., Brunetti, M. T., Marchesini, I., Rossi, M., et al. (2020). Geographical landslide early warning systems. Earth-Science Rev. 200 (1), 102973. doi:10.1016/j.earscirev.2019.102973
Harper, K. L., Lamarche, C., Hartley, A., Peylin, P., Ottlé, C., Bastrikov, V., et al. (2023). A 29-year time series of annual 300 m resolution plant-functional-type maps for climate models. Earth Syst. Sci. Data 15 (3), 1465–1499. doi:10.5194/essd-15-1465-2023
Heckerman, D. (1986). Probabilistic interpretations for mycin's certainty factors**this work was supported in part by the josiah macy, jr. Foundation, the henry J. Kaiser family foundation, and the ford aerospace corporation. Computing facilities were provided by the SUMEX-AIM resource under NIH grant RR-00785. Uncertain. Artif. Intell. 4, 167–196. doi:10.1016/B978-0-444-70058-2.50017-6
Huang, F., Chen, J., Liu, W., Huang, J., Hong, H., and Chen, W. (2022a). Regional rainfall-induced landslide hazard warning based on landslide susceptibility mapping and a critical rainfall threshold. Geomorphology 408 (7), 108236. doi:10.1016/j.geomorph.2022.108236
Huang, F., Xiong, H., Jiang, S.-H., Yao, C., Fan, X., Catani, F., et al. (2024). Modelling landslide susceptibility prediction: a review and construction of semi-supervised imbalanced theory. Earth-Science Rev. 250, 104700. doi:10.1016/j.earscirev.2024.104700
Huang, F., Yan, J., Fan, X., Yao, C., Huang, J., Chen, W., et al. (2022b). Uncertainty pattern in landslide susceptibility prediction modelling: effects of different landslide boundaries and spatial shape expressions. Geosci. Front. 13 (2), 101317. doi:10.1016/j.gsf.2021.101317
Huang, F., Ye, Z., Jiang, S. H., Huang, J., Chang, Z., and Chen, J. (2021). Uncertainty study of landslide susceptibility prediction considering the different attribute interval numbers of environmental factors and different data-based models. Catena 202, 105250. doi:10.1016/j.catena.2021.105250
Jiang, S. H., and Huang, J. (2018). Modeling of non-stationary random field of undrained shear strength of soil for slope reliability analysis. Soils Found. 58 (1), 185–198. doi:10.1016/j.sandf.2017.11.006
Jiang, S. H., Huang, J., Yao, C., and Yang, J. (2017). Quantitative risk assessment of slope failure in 2-D spatially variable soils by limit equilibrium method. Appl. Math. Model. 47, 710–725. doi:10.1016/j.apm.2017.03.048
Jiang, S. H., and Huang, J. S. (2016). Efficient slope reliability analysis at low-probability levels in spatially variable soils. Comput. Geotechnics 75, 18–27. doi:10.1016/j.compgeo.2016.01.016
Lee, W. Y., Park, S. K., and Sung, H. H. (2021). The optimal rainfall thresholds and probabilistic rainfall conditions for a landslide early warning system for Chuncheon, Republic of Korea. Landslides 18 (5), 1721–1739. doi:10.1007/s10346-020-01603-3
Li, C., Ma, T., Zhu, X., and Li, W. (2011). The power–law relationship between landslide occurrence and rainfall level. Geomorphology 130 (3), 221–229. doi:10.1016/j.geomorph.2011.03.018
Li, W., Liu, C., Scaioni, M., Sun, W., Chen, Y., Yao, D., et al. (2017). Spatio-Temporal analysis and simulation on shallow rainfall-induced landslides in China using landslide susceptibility dynamics and rainfall i-d thresholds. Sci. China Earth Sci. 60 (4), 720–732. doi:10.1007/s11430-016-9008-4
Lin, P., and Wang, N. (2024). A data-driven approach for regional-scale fine-resolution disaster impact prediction under tropical cyclones. Nat. Hazards 120, 7461–7479. doi:10.1007/s11069-024-06527-y
Ma, T., Li, C., Lu, Z., and Bao, Q. (2015). Rainfall Intensity–duration thresholds for the initiation of landslides in Zhejiang Province, China. Geomorphology 245 (September), 193–206. doi:10.1016/j.geomorph.2015.05.016
Martelloni, G., Segoni, S., Fanti, R., and Catani, F. (2012). Rainfall thresholds for the forecasting of landslide occurrence at regional scale. Landslides 9 (4), 485–495. doi:10.1007/s10346-011-0308-2
Nolasco-Javier, D., and Kumar, L. (2018). Deriving the rainfall threshold for shallow landslide early warning during tropical cyclones: a case study in Northern Philippines. Nat. Hazards 90 (2), 921–941. doi:10.1007/s11069-017-3081-2
Ozturk, U., Wendi, D., Crisologo, I., Riemer, A., Agarwal, A., Vogel, K., et al. (2018). Rare flash floods and debris flows in Southern Germany. Sci. Total Environ. 626 (6), 941–952. doi:10.1016/j.scitotenv.2018.01.172
Pradhan, A. M., Lee, S. R., and Kim, Y. T. (2019). A shallow slide prediction model combining rainfall threshold warnings and shallow slide susceptibility in Busan, Korea. Landslides 16 (3), 647–659. doi:10.1007/s10346-018-1112-z
Qin, H., He, J., Guo, J., and Cai, L. (2022). Developmental characteristics of rainfall-induced landslides from 1999 to 2016 in Wenzhou City of China. Front. Earth Sci. 10. doi:10.3389/feart.2022.1005199
Salciarini, D., Godt, J. W., Savage, W. Z., Baum, R. L., and Conversini, P. (2008). Modeling landslide recurrence in Seattle, Washington, USA. Eng. Geol. Landslide Susceptibility, Hazard Risk Zoning Land Use Plan. 102 (3), 227–237. doi:10.1016/j.enggeo.2008.03.013
Segoni, S., Lagomarsino, D., Fanti, R., Moretti, S., and Casagli, N. (2015). Integration of rainfall thresholds and susceptibility maps in the emilia romagna (Italy) regional-scale landslide warning system. Landslides 12 (4), 773–785. doi:10.1007/s10346-014-0502-0
Segoni, S., Piciullo, L., and Gariano, S. L. (2018). A review of the recent literature on rainfall thresholds for landslide occurrence. Landslides 15 (8), 1483–1501. doi:10.1007/s10346-018-0966-4
Sengupta, A., Gupta, S., and Anbarasu, K. (2010). Rainfall thresholds for the initiation of landslide at lanta khola in north Sikkim, India. Nat. Hazards 52 (1), 31–42. doi:10.1007/s11069-009-9352-9
Shortliffe, E. H., and Buchanan, B. G. (1975). A model of inexact reasoning in medicine. Math. Biosci. 23 (3), 351–379. doi:10.1016/0025-5564(75)90047-4
Tang, W., and Xu, Z. (2021). Investigation and Analysis of super typhoon Lekima storm flood in Yuhuan. IOP Conf. Ser. Earth Environ. Sci. 826 (1), 012006. doi:10.1088/1755-1315/826/1/012006
Wei, Z., Lü, Q., Sun, H., and Shang, Y. (2019). Estimating the rainfall threshold of a deep-seated landslide by integrating models for predicting the groundwater level and stability analysis of the slope. Eng. Geol. 253 (4), 14–26. doi:10.1016/j.enggeo.2019.02.026
Yang, H., Wei, F., Ma, Z., Guo, H., Su, P., and Zhang, S. (2020). Rainfall threshold for landslide activity in Dazhou, Southwest China. Landslides 17 (1), 61–77. doi:10.1007/s10346-019-01270-z
Zhang, J., Lin, C., Tang, H., Wen, T., Tannant, D. D., and Zhang, B. (2024a). Input-parameter optimization using a SVR based ensemble model to predict landslide displacements in a reservoir area–A comparative study. Appl. Soft Comput. 150, 111107. doi:10.1016/j.asoc.2023.111107
Zhang, J., Tang, H., Li, C., Gong, W., Zhou, B., and Zhang, Y. (2024b). Deformation stage division and early warning of landslides based on the statistical characteristics of landslide kinematic features. Landslides 21 (4), 717–735. doi:10.1007/s10346-023-02192-7
Zhang, J., Tang, H., Tan, Q., Mao, M., Zhou, B., and Zhang, Y. (2024c). A generalized early warning criterion for the landslide risk assessment: deformation probability index (DPI). Acta Geotech. 19 (5), 2607–2627. doi:10.1007/s11440-023-02199-3
Zhang, J., Tang, H., Zhou, B., Wen, T., and Zhang, S. (2024d). A new early warning criterion for landslides movement assessment: deformation Standardized Anomaly Index. Bull. Eng. Geol. Environ. 83 (5), 205. doi:10.1007/s10064-024-03672-3
Zhou, C., Chen, P., Yang, S., Zheng, F., Yu, H., Tang, J., et al. (2022). The impact of typhoon Lekima (2019) on east China: a postevent survey in Wenzhou city and taizhou city. Front. Earth Sci. 16 (1), 109–120. doi:10.1007/s11707-020-0856-7
Zhu, L., Wu, X., Yin, K., and Liu, X. (2004). Risk zonation of landslide in China based on information content model. J. Earth Sci. Environ. 3, 52–56.
Keywords: typhoon rainstorm, debris flow, geological factor, rainfall threshold, warning model
Citation: Wang Y, Xu D, Yang Y, Zhou M, Chen W and Lin W (2024) A typhoon-induced debris flow warning model integrating rainfall thresholds with geological factors. Front. Earth Sci. 12:1443738. doi: 10.3389/feart.2024.1443738
Received: 04 June 2024; Accepted: 01 August 2024;
Published: 14 August 2024.
Edited by:
Wenbo Zheng, University of Northern British Columbia, CanadaReviewed by:
Junrong Zhang, China University of Geosciences Wuhan, ChinaQin Chen, China University of Geosciences Wuhan, China
Copyright © 2024 Wang, Xu, Yang, Zhou, Chen and Lin. This is an open-access article distributed under the terms of the Creative Commons Attribution License (CC BY). The use, distribution or reproduction in other forums is permitted, provided the original author(s) and the copyright owner(s) are credited and that the original publication in this journal is cited, in accordance with accepted academic practice. No use, distribution or reproduction is permitted which does not comply with these terms.
*Correspondence: Yiming Wang, d3p3eW1AMTM5LmNvbQ==