- 1Institute of Mineral Resources, Chinese Academy of Geological Sciences, Beijing, China
- 2Research Center for Strategy of Global Mineral Resources, Chinese Academy of Geological Sciences, Beijing, China
Mineral resources are the basic materials for global economic development. Assessing mineral resource supply chain resilience is an important pillar of mineral resource supply chain stability management. The globality, heterogeneity and complexity of supply chain bring challenges to the resilience assessment of global mineral resource supply chain. To solve this problem, a method based on multi-region input-output model, network percolation model and econometric model is proposed, which is able to measure the resilience of global mineral resource supply chain and its influencing factors from the perspective of the whole system. The percolation phase transition is introduced to measure the critical state of global mineral resource supply chain system collapse facing external disruption. Using the proposed method, this paper conducts an empirical study on the evolution of global mineral resource supply chain resilience from 2005 to 2014. The results show that the resilience of global mineral resource supply chain declined by 39.6% in 2005–2014. Most of the critical links that caused the collapse of the global mineral resource supply chain network are the manufacturing sector and its upstream and downstream sectors. The structure of supply chain network plays a key role in network resilience. Increasing the number of linkages in upstream and downstream could improve network resilience, but the increase of linkage strength would deteriorate network resilience.
1 Introduction
Mineral resources are the basic materials and energy guarantee for world economic development (Jiang et al., 2023), and the security and stability of the supply chain of mineral resources are crucial. The mineral resources industry does not exist independently in the global supply chain, but interacts with other industries. As a general organization form of the global production network, minerals, services and technologies produced by one country or sector flow to other countries or sectors along the supply chain. Therefore, this paper explores the supply chain resilience of mineral resources from the perspective of global cross-region and cross-sector. With the development of globalization and the increase of multinational companies, transnational production activities in the supply chain become more frequent (Wang et al., 2020). Many interwoven cross-border supply chains form a global supply chain Network (GSCN). The spatial pattern of GSCN also changes gradually with world economic growth (Fan and Liu, 2021), which highlights the complexity and systematization of the GSCN.
In recent years, the international political and economic landscape has been complex and volatile. At the same time, COVID-19 (Jomthanachai et al., 2021), trade friction, natural disasters and many other factors have disrupted the stability of the global supply chain to varying degrees (Ivanov and Dolgui, 2019). In this context, the stability management of GSCN is very important. An important pillar of stability management is to measure supply chain network resilience and quantify its determinants. Based on these results, follow-up actions can be taken to improve the resilience of the supply chain network and resist external disturbances. Current studies on supply chain resilience assessment mostly are assessed by quantitative resilience indicators, such as the resilience triangle (Moosavi and Hosseini, 2021). Later, some scholars proposed quantitative comprehensive indicators from multiple aspects such as time, cost and the level of recovery (Behzadi et al., 2020). Most of these studies are static evaluation, while external interruption produced cascade effects in the supply chain network, which is a dynamic process. Besides, ignoring the heterogeneity of the supply chain network may lead to a bias in assessing resilience. Therefore, this paper dynamically evaluates the resilience of GSCN from a system perspective.
As the impact of disruption on networks with different structures varies (Dixit et al., 2020), the structure of supply chain network has an important impact on network resilience (Ojha et al., 2018). Scholars have studied the disruption and resilience of supply networks, but mainly at the node level. For instance, nodes with high degree value and centrality are critical nodes (Craighead et al., 2007). However, the disruption is ignored from the perspective of the whole network. The disruption of some nodes will not lead to the collapse of the whole network (Kim et al., 2015). Therefore, this paper studies how the overall network collapse is generated from network components based on the perspective of percolation. If managers do not understand the structure of the overall network, they may misallocate resources just to increase the resilience of some important nodes and ignore the resilience of the whole network (Kim et al., 2015).
The preceding underlines the systematization and complexity of the resilience of GSCN. This study adds to the literature by proposing a model that combines input-output analysis, network percolation and econometrics to explain the dynamic variation in resilience of GSCN and its influencing factors. Specifically, this method reflects the interdependence between supply chains through the overall linkage effect of upstream and downstream based on multi-regional input-output (MRIO) model. The MRIO model can be used to better capture the complexity and transnational nature of global supply chain (Wang et al., 2020). Then, this paper uses the network percolation to model the fracture process of GSCN in the face of increasing disruption, which helps to capture the dynamic resilience of GSCN. Resilience here can be interpreted as the maximum capacity of the supply chain network to face disruption without the whole network collapse. Finally, econometric model is used to study the determinants of the resilience.
2 Literature review
The research of supply chain resilience has attracted much attention by many scholars. From the perspective of research objects, there are studies on the resilience of a single supply chain, such as retail supply chain (Alikhani et al., 2021), manufacturing supply chain (Rajesh, 2021), blood supply chain in healthcare system (Kazemi Matin et al., 2021), hotel supply chain (Aigbedo, 2021), food supply chain (Coopmans et al., 2021); There are also assessments (Jomthanachai et al., 2021) and optimization design (Hasani, 2021) of global supply chain resilience. From the perspective of research methods, most studies calculate resilience based on probability estimation. Such as by quantification of resilience enablers and considering (Soni et al., 2014), bayesian network approach (Hosseini and Ivanov, 2019). And other studies quantified resilience from the perspective of recovery, such as control theory (Ivanov et al., 2016), a genome method based on a probabilistic perspective (Pavlov et al., 2018), Markov chain (Hosseini and Ivanov, 2019).
With the continuous development of globalization, it becomes relevant to study the structure and resilience of global supply chains. A large number of studies are devoted to studying the structure of supply chain from the perspective of industrial linkage (Lee, 2021; Norbu et al., 2021). Industrial linkage refers to the economic and technological linkages between various sectors through supply and demand, including direct linkages and indirect linkages (Lo Turco et al., 2019). Besides, industrial linkages are usually divided into forward linkages (Cahen-Fourot et al., 2020), backwards linkages (Norbu et al., 2021) and total linkages (Zhang et al., 2019). Total linkages refer to the driving effects generated by supply and demand between two sectors. Therefore, this paper evaluates the interdependence between various sectors of the supply chain by measuring the total linkages. A complex system is formed by the interlacing complex relationships among supply chain sectors, and the complex network is the most commonly used to study the complex system. Complex network studies the structural characteristics of the system from the perspective of the whole system and reveals the relationship between structure and function (Zheng et al., 2021a). In addition, complex network can further identify the role of the agent in the network through various network topology indicators. Therefore, there are many studies on supply chain network structure by using complex network (Fang et al., 2009; Wang et al., 2021), such as identifying key sectors and key countries.
However, in addition to the static analysis of supply chain network structure, there are few studies on the critical percolation state driven by supply chain network dynamics. The percolation model is one of the commonly used network dynamics methods to measure the dynamic changes of network connectivity (Li et al., 2021). The critical value of the percolation phase transition can be used to evaluate the resilience and efficiency of a system (Zeng et al., 2019a). For example, Zeng et al. (2020) observed the existence of a metastable regime in transportation system, providing a better understanding of traffic resilience management through percolation model. Besides, the percolation model is also applied in many fields such as air pollution prevention and control (Du et al., 2020) and air transport system (Liu et al., 2020). Therefore, this paper evaluates the resilience of GSCN by using the change of the giant connected component in the simulated external disturbance, and explores the critical links that cause the collapse of GSCN.
Moreover, investigating network resilience from the perspective of network structure has also attracted the attention of many scholars, including theoretical network (Crucitti et al., 2004) and realistic social ecological network (Holme et al., 2002). Previous studies have found that network connectivity and centrality affect network resilience (Janssen et al., 2006), and the resilience of scale-free network structure is much higher than the centralized structure (Kim et al., 2015). Despite the above achievements, the heterogeneity of real networks has been ignored. Therefore, on the basis of previous studies and in combination with the heterogeneity of GSCN, this study uses econometric methods to explore the relationship between network structure and network resilience of GSCN. The results are helpful to better understand the resilience management of global supply chain network and provide suggestions for improving network resilience.
3 Methodology
3.1 Resilience assessment of GSCN
We first apply the multi-regional input-output (MRIO) analysis to calculate the total linkages among economic sectors. In the input-output model, the direct consumption coefficient
Where
Where
Where
Based on complex network theory, the global supply chain network
Where
The percolation model comes from statistical physics and studies the dynamic evolution process of network connectivity (Grimmett, 2012). When the proportion of interrupted points or edges of a connected network reaches a critical value, the connectivity of the network suddenly breaks down, and the function of the network would collapse accordingly. During this process, the giant connected component (shown by the blue clusters in Figure 1) is constantly decreasing. When the number of nodes covered by the giant connected component is less than the square root of number of network nodes N, the whole network is divided into two parts, that is, the connectivity of the network has undergone a phase transition, which also belongs to the structural phase transition in complex network phase transition. Therefore, the critical value of percolation phase transition can be used to measure the resilience of maintaining network function against external interruptions (Zeng et al., 2020). Besides, the size distribution of clusters follows a power law at criticality, and it can be formulated by Equation 7 as follows: (Zeng et al., 2019a):

Figure 1. Percolation process of GSCN. (A) Network at the beginning of the percolation simulation. (B) The network in the critical state of percolation. (C) Network in the late stage of percolation simulation.
Where s is the size of clusters,
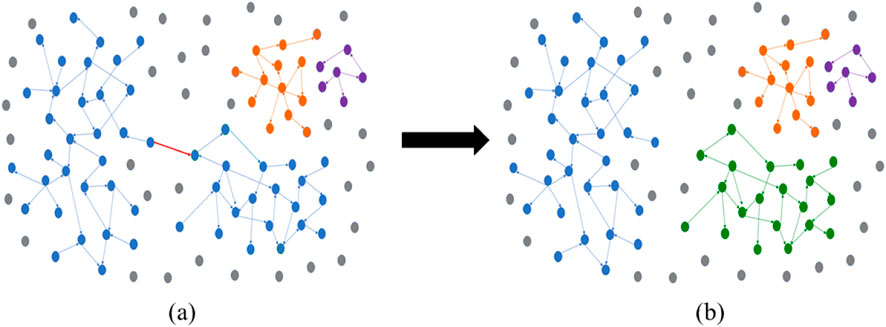
Figure 2. Critical links just above the percolation critical value of GSCN. (A) Network before critical state of percolation. (B) Network after critical state of percolation.
3.2 Impact factor of network resilience
Previous studies found that network resilience depends on network structure (Kim et al., 2015), but only discussed the structure of basic supply network, ignoring the heterogeneity of supply chain network itself. Therefore, this paper analyzes the impact of supply chain network structure on network resilience from four indicators: the maximum gap of linkage effects LD, the total strength of linkage effects TW, the network density NI, and the average weighted-degree AD. Each indicator can be formulated by Equations 8–11 as follows:
Where n is the number of sectors,
4 Data
The global input-output tables used in this paper are collected from the World Input-Output Database (WIOD). The MRIO table covers 43 regions and a rest of the world (ROW) representing the remaining regions, with each region is further subdivided into 56 sectors. This paper combines 56 sectors into 20 industries, and the list and classification of regions and industries are given in Supplementary Appendix A, B respectively. This paper used the GDP deflator (constant 2010 US$) to eliminate the influence of price changes (Wiedmann et al., 2015). With the latest available data up to 2014 (Wang et al., 2020), this paper used the proposed methods to assess the resilience of global supply chain networks and their influencing factors during 2005–2014.
5 Results and discussions
5.1 The resilience and critical links of GSCN
This paper first evaluates network resilience through percolation analysis of GSCN, taking 2005 and 2014 as examples, as shown in Fid.3 (a). As the external attack q increases, the giant cluster G of GSCN decreases, and the G shows a phrase transition and becomes fragmented at critical point
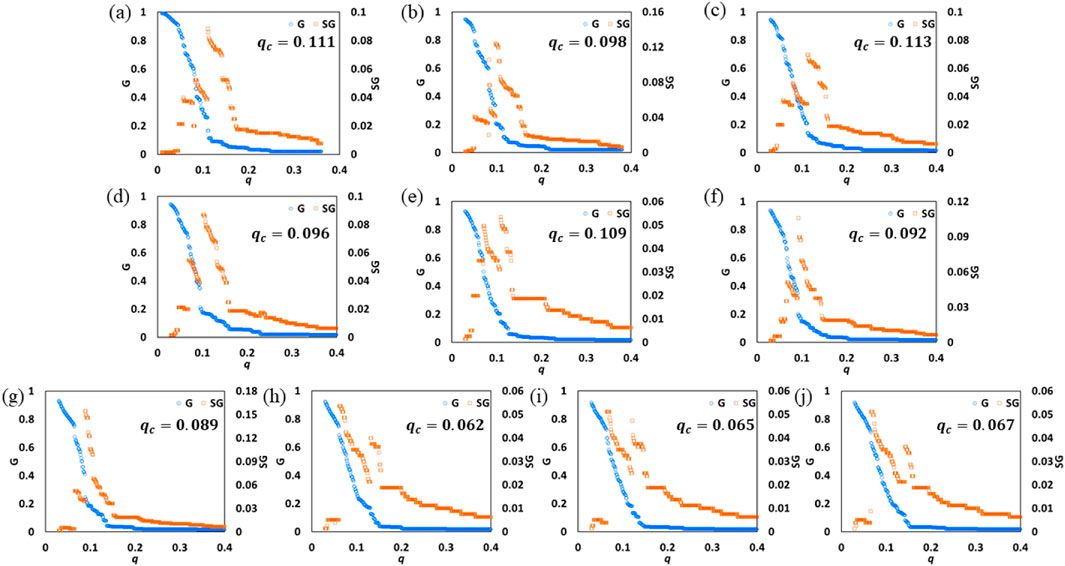
Figure 3. Percolation process of GSCN. (A) percolation process of GSCN in 2005. (B) percolation process of GSCN in 2006. (C) percolation process of GSCN in 2007. (D) percolation process of GSCN in 2008. (E) percolation process of GSCN in 2009. (F) percolation process of GSCN in 2010. (G) percolation process of GSCN in 2011. (H) percolation process of GSCN in 2012. (I) percolation process of GSCN in 2013. (J) percolation process of GSCN in 2014.
Then, the size distributions of clusters near the critical threshold in 2005 and 2014 are calculated, as shown in Figures 4A, B. Results include size distribution at
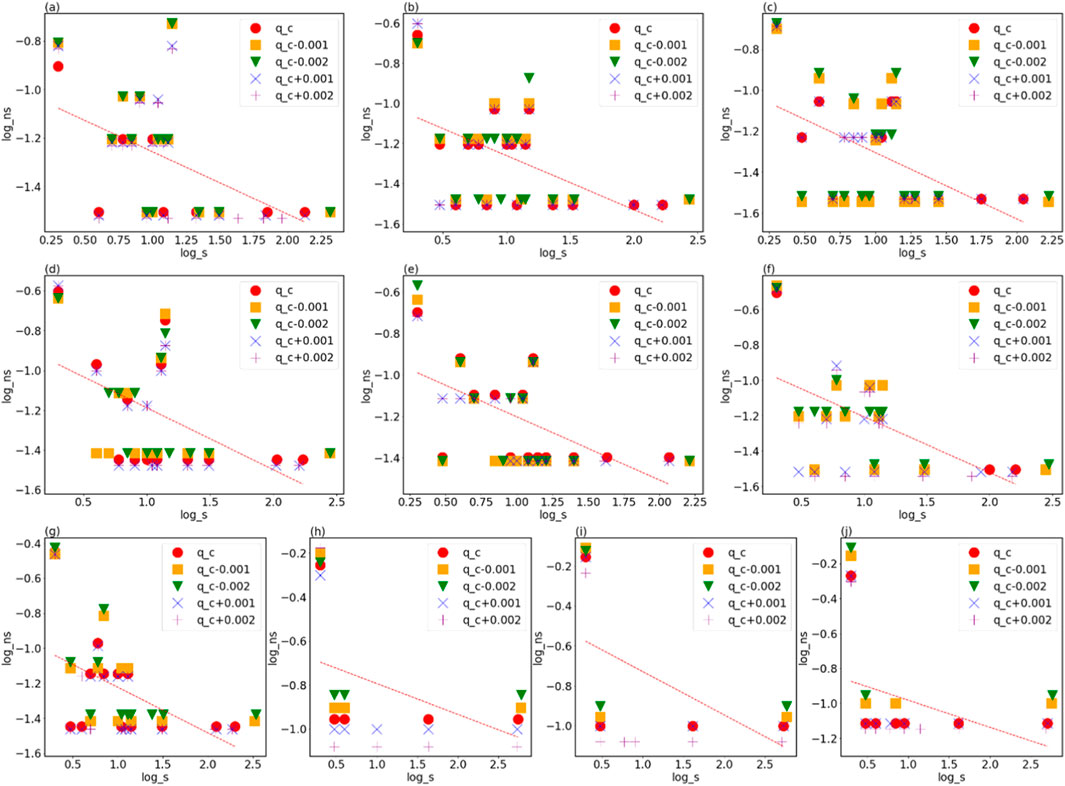
Figure 4. Critical exponent of clusters size distribution. (A) Critical exponent of clusters size distribution in 2005. (B) Critical exponent of clusters size distribution in 2006. (C) Critical exponent of clusters size distribution in 2007. (D) Critical exponent of clusters size distribution in 2008. (E) Critical exponent of clusters size distribution in 2009. (F) Critical exponent of clusters size distribution in 2010. (G) Critical exponent of clusters size distribution in 2011. (H) Critical exponent of clusters size distribution in 2012. (I) Critical exponent of clusters size distribution in 2013. (J) Critical exponent of clusters size distribution in 2014.
Next, we explorer the percolation critical characteristics of the GSCN at different time, as shown in Figure 5. The resilience
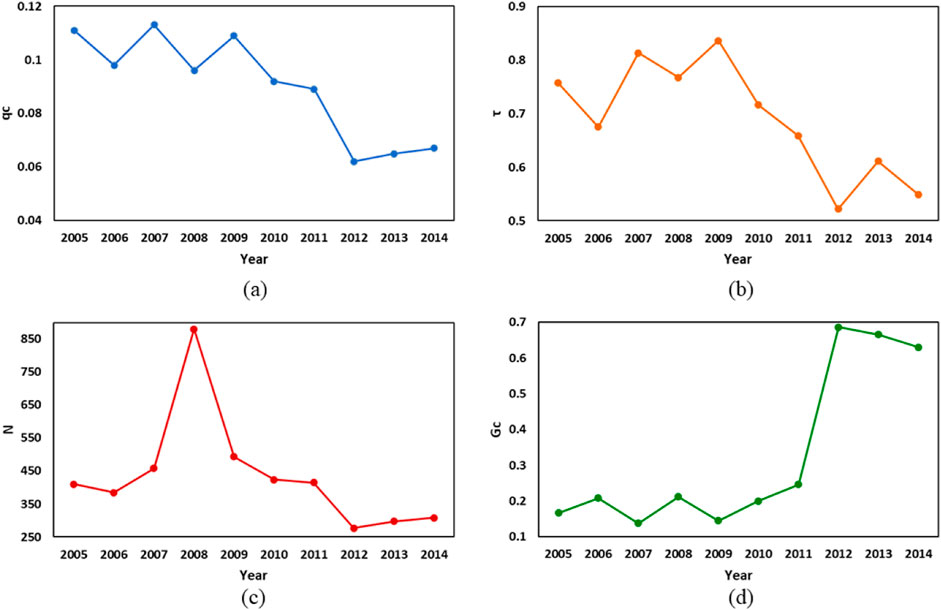
Figure 5. Percolation critical characteristics of GSCN at different time. (A) The resilience of GSCN. (B) the power exponent of GSCN. (C) the number of critical clusters of GSCN. (D) the maximum cluster of GSCN.
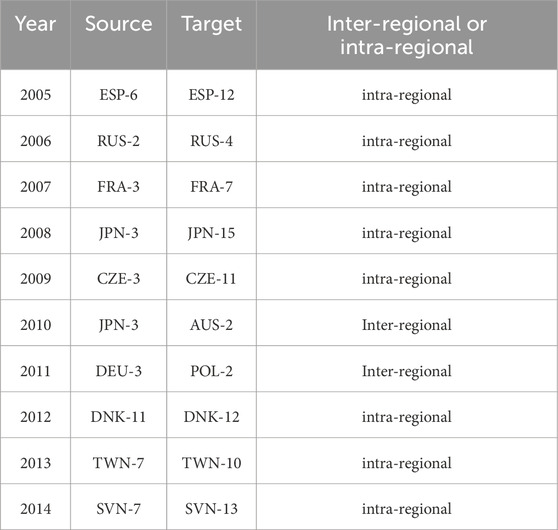
In addition to evaluating the resilience of supply chain network, it is also important to identity the critical links that cause the network collapse. The collapse of the supply chain network is a process of gradual accumulation of external interruptions. Therefore, like the last straw that broke the camel’s back, the last broken link that caused the network crash is the critical link of this paper. Critical links in the study sample period are shown in Table 1. From the regional perspective, 80% of the critical links are industrial sectors within the same region. Only in 2010 and 2011, the critical links involve trans-regional industries, namely, the linkage between Japan’s manufacturing industry (sector 3) and Australia’s mining and quarrying industry (sector 2), and the linkage between Germany’s manufacturing industry (sector 3) and Poland’s mining and quarrying industry (sector 2). From an industry perspective, critical sectors include the manufacturing (sector 3), the construction (sector 7), the mining and quarrying (sector 2), the financial and insurance activities (sector 11) and the real estate activities (sector 12), especially the linkage effects of manufacturing industry (sector 3) on various industries need to be paid attention to. With the change of time, the importance of the tertiary industry is also gradually increasing.
5.2 The relationship between resilience and network structure of GSCN
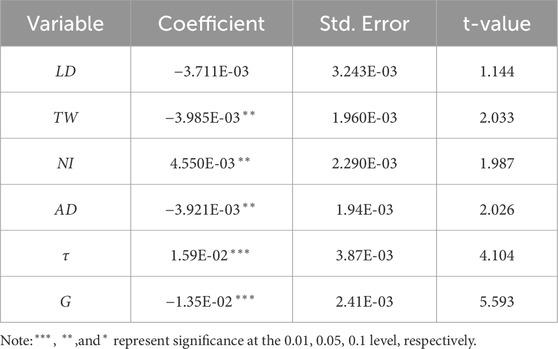
After calculating the resilience of supply chain network, this paper tries to explore the influencing factors of network resilience from the perspective of network structure. OLS regression was first used to explore the relationship between network indicators and network resilience, and the results are shown in Table 2. Eigenvalue of each variable is about 0, and the condition index is greater than 10, indicating the existence of multicollinearity among variables. Ridge regression model is a biased estimation regression for collinear analysis (Panzone et al., 2021), and the results of ridge regression are shown in Table 3. The significance and direction of influence of ridge regression were similar to OLS, which also proved the robustness of the model.
The regression results show that TW, AD and G have significant negative influence on network resilience. Linkage strength reflects the dependence between upstream and downstream. The higher the linkage strength of a sector, the stronger its dependence. Once there is a shortage of material supply, the supply chain would face the risk of fracture, thus affecting the upstream and downstream production, such cascading transmission may even lead to the collapse of the global supply chain. Therefore, to improve the resilience of GSCN, the linkage strength between global supply chains should be reduced, whether it is the global total linkage strength or the average linkage strength of individual sectors. In addition, the giant connected component reflects the core structure of the supply chain network, and the existence of core nodes greatly weakens the robustness of the network. Once the core node is maliciously attacked, it can quickly paralyze the network. Therefore, the size of core node clusters should be reduced as much as possible to improve the network’s resilience against external attacks. In contrast, NI and τ have a significant positive effect on resilience, indicating that a dense network (with more edges) tends to be more resilient. This is also consistent with some traditional views of supply chain resilience, that is, redundancy could increase the resilience of supply chain network (Kamalahmadi et al., 2024).
6 Conclusion
The objective of this paper is to evaluate resilience of global mineral resource supply chain network and its determinants. The two main contributions are as follows. First, this paper develops a method based on MRIO model, network percolation model and econometric model to evaluate the resilience and its determinants. With the increase of external disturbance, the critical value of network percolation phase transition is used to measure the resilience of GSCN. By comparing the network structure at the moment of the network crash, the critical links causing the network crash are identified. In addition, the relationship between network structure and resilience is explored to provide reference for designing a more resilient supply chain network. Compared with other supply chain resilience in the existing literature, the key advantage of the proposed approach is that it dynamically captures the transnational, heterogeneity and complexity of the global supply chain network from a systematic perspective.
Secondly, we apply the proposed method to the empirical research for 2005–2014. The results show that GSCN has serious heterogeneity. The resilience of GSCN declined by 39.6% during the sample period. Our regression results also showed that network structure plays a significant role in resilience. Strengthen the diversification of the supply chain system, and increase the network density by establishing more supply chain cooperative relations, that is, increase the redundancy is conducive to improve the resilience. However, the linkage strength between the upstream and downstream of the supply chain, that is, the interdependence relationship should be reduced. Excessive linkage strength deteriorates network resilience.
There are inevitably some limitations in this study, which is worth further study. First, due to the time-lag of global MRIO tables, the empirical data in this paper are a little old. However, the model proposed in this paper is still applicable when the new input-output table is released. Secondly, the simulation is carried out from the perspective of edges percolation in supply network, and the critical value of network collapse can be studied from the perspective of node percolation in the future. Finally, there may be a nonlinear relationship between network structure indicators and resilience, and future research can be explored from a nonlinear perspective.
Data availability statement
Publicly available datasets were analyzed in this study. This data can be found here: https://www.rug.nl/ggdc/valuechain/wiod/home.
Author contributions
HZ: Conceptualization, Data curation, Formal Analysis, Investigation, Methodology, Software, Visualization, Writing–original draft. WZ: Funding acquisition, Project administration, Supervision, Writing–review and editing. XX: Formal Analysis, Supervision, Writing–review and editing.
Funding
The author(s) declare that financial support was received for the research, authorship, and/or publication of this article. This research is supported by the Integrated Project of the Major Research Plan of the National Natural Science Foundation of China (No. 92162321); the Basic Science Center Project for National Natural Science Foundation of China (No. 72088101, the Theory and Application of Resource and Environment Management in the Digital Economy Era) and the fund from Geological survey project of China Geological Survey (Grant No. DD20243234).
Conflict of interest
The authors declare that the research was conducted in the absence of any commercial or financial relationships that could be construed as a potential conflict of interest.
Publisher’s note
All claims expressed in this article are solely those of the authors and do not necessarily represent those of their affiliated organizations, or those of the publisher, the editors and the reviewers. Any product that may be evaluated in this article, or claim that may be made by its manufacturer, is not guaranteed or endorsed by the publisher.
Supplementary Material
The Supplementary Material for this article can be found online at: https://www.frontiersin.org/articles/10.3389/feart.2024.1443668/full#supplementary-material
References
Aigbedo, H. (2021). Impact of COVID-19 on the hospitality industry: a supply chain resilience perspective. Int. J. Hosp. Manag. 98, 103012. doi:10.1016/j.ijhm.2021.103012
Alikhani, R., Torabi, S. A., and Altay, N. (2021). Retail supply chain network design with concurrent resilience capabilities. Int. J. Prod. Econ. 234, 108042. doi:10.1016/j.ijpe.2021.108042
Behzadi, G., O'Sullivan, M. J., and Olsen, T. L. (2020). On metrics for supply chain resilience. Eur. J. Operational Res. 287, 145–158. doi:10.1016/j.ejor.2020.04.040
Cahen-Fourot, L., Campiglio, E., Dawkins, E., Godin, A., and Kemp-Benedict, E. (2020). Looking for the inverted pyramid: an application using input-output networks. Ecol. Econ. 169, 106554. doi:10.1016/j.ecolecon.2019.106554
Coopmans, I., Bijttebier, J., Marchand, F., Mathijs, E., Messely, L., Rogge, E., et al. (2021). COVID-19 impacts on Flemish food supply chains and lessons for agri-food system resilience. Agric. Syst. 190, 103136. doi:10.1016/j.agsy.2021.103136
Craighead, C. W., Blackhurst, J., Rungtusanatham, M. J., and Handfield, R. B. (2007). The severity of supply chain disruptions: design characteristics and mitigation capabilities. Decis. Sci. 38, 131–156. doi:10.1111/j.1540-5915.2007.00151.x
Crucitti, P., Latora, V., Marchiori, M., and Rapisarda, A. (2004). Error and attack tolerance of complex networks. Phys. a-Statistical Mech. Its Appl. 340, 388–394. doi:10.1016/j.physa.2004.04.031
Dixit, V., Verma, P., and Tiwari, M. K. (2020). Assessment of pre and post-disaster supply chain resilience based on network structural parameters with CVaR as a risk measure. Int. J. Prod. Econ. 227, 107655. doi:10.1016/j.ijpe.2020.107655
Du, R., Li, J., Dong, G., Tian, L., Qing, T., Fang, G., et al. (2020). Percolation analysis of urban air quality: a case in China. Phys. A Stat. Mech. its Appl. 541, 123312. doi:10.1016/j.physa.2019.123312
Fan, X.-m., and Liu, H.-g. (2021). Global supply chain shifting: a macro sense of production relocation based on multi-regional input-output table. Econ. Model. 94, 672–680. doi:10.1016/j.econmod.2020.02.009
Fang, A.-l., Gao, Q.-s., and Zhang, S.-y. (2009). Clustering and correlation analysis of the industry networks. Syst. Eng. - Theory and Pract. 29, 178–183. doi:10.1016/s1874-8651(10)60056-7
Hasani, A. (2021). Resilience cloud-based global supply chain network design under uncertainty: resource-based approach. Comput. and Industrial Eng. 158, 107382. doi:10.1016/j.cie.2021.107382
Holme, P., Kim, B. J., Yoon, C. N., and Han, S. K. (2002). Attack vulnerability of complex networks. Phys. Rev. E 65, 056109. doi:10.1103/physreve.65.056109
Hosseini, S., and Ivanov, D. (2019). A new resilience measure for supply networks with the ripple effect considerations: a Bayesian network approach. Ann. Operations Res. 319, 581–607. doi:10.1007/s10479-019-03350-8
Ivanov, D., and Dolgui, A. (2019). Low-Certainty-Need (LCN) supply chains: a new perspective in managing disruption risks and resilience. Int. J. Prod. Res. 57, 5119–5136. doi:10.1080/00207543.2018.1521025
Ivanov, D., Pavlov, A., Dolgui, A., Pavlov, D., and Sokolov, B. (2016). Disruption-driven supply chain (re)-planning and performance impact assessment with consideration of pro-active and recovery policies. Transp. Res. Pt. E-logist. Transp. Rev. 90, 7–24. doi:10.1016/j.tre.2015.12.007
Janssen, M. A., Bodin, O., Anderies, J. M., Elmqvist, T., Ernstson, H., McAllister, R. R. J., et al. (2006). Toward a network perspective of the study of resilience in social-ecological systems. Ecol. Soc. 11, art15. doi:10.5751/es-01462-110115
Jiang, R., Liu, C. X., Liu, X. W., and Zhang, S. (2023). Supply chain resilience of mineral resources industry in China. Discrete dyn. Nat. Soc. 10. doi:10.1155/2023/1338223
Jomthanachai, S., Wong, W.-P., Soh, K.-L., and Lim, C. P. (2021). A global trade supply chain vulnerability in COVID-19 pandemic: an assessment metric of risk and resilience-based efficiency of CoDEA method. Res. Transp. Econ. 93, 101166. doi:10.1016/j.retrec.2021.101166
Kamalahmadi, M., Shekarian, M., and Parast, M. M. (2024). The impact of flexibility and redundancy on improving supply chain resilience to disruptions. Int. J. Prod. Res. 29. doi:10.1080/00207543.2021.1883759
Kazemi Matin, R., Azadi, M., and Saen, R. F. (2021). Measuring the sustainability and resilience of blood supply chains. Decis. Support Syst. 161, 113629. doi:10.1016/j.dss.2021.113629
Kim, Y., Chen, Y. S., and Linderman, K. (2015). Supply network disruption and resilience: a network structural perspective. J. Oper. Manag. 33-34, 43–59. doi:10.1016/j.jom.2014.10.006
Lee, D. (2021). Propagation of economic shocks through vertical and trade linkages in Korea: an empirical analysis. Jpn. World Econ. 60, 101103. doi:10.1016/j.japwor.2021.101103
Li, M., Liu, R.-R., Lü, L., Hu, M.-B., Xu, S., and Zhang, Y.-C. (2021). “Percolation on complex networks: theory and application,” Physics reports, 907, 1–68.doi:10.1016/j.physrep.2020.12.003
Liu, S., Li, Z., Zhong, J., and Li, D. (2020). “Percolation transition in temporal airport network,” Chinese journal of aeronautics, 12, 219–226.
Lo Turco, A., Maggioni, D., and Zazzaro, A. (2019). Financial dependence and growth: the role of input-output linkages. J. Econ. Behav. and Organ. 162, 308–328. doi:10.1016/j.jebo.2018.11.024
Moosavi, J., and Hosseini, S. (2021). Simulation-based assessment of supply chain resilience with consideration of recovery strategies in the COVID-19 pandemic context. Comput. and Industrial Eng. 160, 107593. doi:10.1016/j.cie.2021.107593
Norbu, N. P., Tateno, Y., and Bolesta, A. (2021). Structural transformation and production linkages in Asia-Pacific least developed countries: an input-output analysis. Struct. Change Econ. Dyn. 59, 510–524. doi:10.1016/j.strueco.2021.09.009
Ojha, R., Ghadge, A., Tiwari, M. K., and Bititci, U. S. (2018). Bayesian network modelling for supply chain risk propagation. Int. J. Prod. Res. 56, 5795–5819. doi:10.1080/00207543.2018.1467059
Panzone, L., Ulph, A., Areal, F., and Grippo, V. (2021). A ridge regression approach to estimate the relationship between landfill taxation and waste collection and disposal in England. Waste Manag. 129, 95–110. doi:10.1016/j.wasman.2021.04.054
Pavlov, A., Ivanov, D., Dolgui, A., and Sokolov, B. (2018). Hybrid fuzzy-probabilistic approach to supply chain resilience assessment. IEEE Trans. Eng. Manage. 65, 303–315. doi:10.1109/tem.2017.2773574
Rajesh, R. (2021). Flexible business strategies to enhance resilience in manufacturing supply chains: an empirical study. J. Manuf. Syst. 60, 903–919. doi:10.1016/j.jmsy.2020.10.010
Soni, U., Jain, V., and Kumar, S. (2014). Measuring supply chain resilience using a deterministic modeling approach. Comput. and Industrial Eng. 74, 11–25. doi:10.1016/j.cie.2014.04.019
Wang, H., Pan, C., Wang, Q., and Zhou, P. (2020). “Assessing sustainability performance of global supply chains: an input-output modeling approach,” European journal of operational research, 1, 393–404.doi:10.1016/j.ejor.2020.01.057
Wang, T., Xiao, S., Yan, J., and Zhang, P. (2021). Regional and sectoral structures of the Chinese economy: a network perspective from multi-regional input–output tables. Phys. A Stat. Mech. its Appl. 581, 126196. doi:10.1016/j.physa.2021.126196
Wiedmann, T. O., Schandl, H., Lenzen, M., Moran, D., Suh, S., West, J., et al. (2015). The material footprint of nations. Proc. Natl. Acad. Sci. U. S. A. 112, 6271–6276. doi:10.1073/pnas.1220362110
Zeng, G., Gao, J., Shekhtman, L., Guo, S., Lv, W., Wu, J., et al. (2020). Multiple metastable network states in urban traffic. Proc. Natl. Acad. Sci. U. S. A. 117, 17528–17534. doi:10.1073/pnas.1907493117
Zeng, G., Li, D., Guo, S., Gao, L., Gao, Z., Stanley, H. E., et al. (2019a). Switch between critical percolation modes in city traffic dynamics. Proc. Natl. Acad. Sci. U. S. A. 116, 23–28. doi:10.1073/pnas.1801545116
Zeng, G., Li, D., Guo, S., Gao, L., Gao, Z., Stanley, H. E., et al. (2019b). “Switch between critical percolation modes in city traffic dynamics,” in Proceedings of the national academy of ences of the United States of America 116.
Zhang, L., Liu, B., Du, J., Liu, C., and Wang, S. (2019). CO2 emission linkage analysis in global construction sectors: alarming trends from 1995 to 2009 and possible repercussions. J. Clean. Prod. 221, 863–877. doi:10.1016/j.jclepro.2019.02.231
Zheng, H., Gao, X., Zhou, J., Liu, D., Xi, X., and Sun, X. (2021a). Characteristics of industrial driving effects network and impacts on carbon emissions. Journal of Environmental Planning and Management, 1, 1–25.doi:10.1080/09640568.2021.1925231
Keywords: mineral resource, global supply chains, disruption, network percolation, resilience assessment
Citation: Zheng H, Zhong W and Xi X (2024) The resilience and determinants of global mineral resource supply chains: a network percolation perspective. Front. Earth Sci. 12:1443668. doi: 10.3389/feart.2024.1443668
Received: 04 June 2024; Accepted: 30 September 2024;
Published: 15 October 2024.
Edited by:
Guochang Wang, Saint Francis University, United StatesReviewed by:
Xin Xu, Nanjing University of Finance and Economics, ChinaTao Wu, Chengdu University of Technology, China
Chen Guo, Tianjin Chengjian University, China
Copyright © 2024 Zheng, Zhong and Xi. This is an open-access article distributed under the terms of the Creative Commons Attribution License (CC BY). The use, distribution or reproduction in other forums is permitted, provided the original author(s) and the copyright owner(s) are credited and that the original publication in this journal is cited, in accordance with accepted academic practice. No use, distribution or reproduction is permitted which does not comply with these terms.
*Correspondence: Weiqiong Zhong, emhvbmd3ZWlxaW9uZzIwMTZAMTI2LmNvbQ==
 Huiling Zheng
 Weiqiong Zhong
 Xian Xi1,2