- 1China Communications Construction Corporation-Guanghang Dredging Co., Ltd., Guangzhou, China
- 2China Communications Construction Corporation Guangzhou Dredging Co., Ltd., Guangzhou, China
- 3State Key Laboratory for Tunnel Engineering, School of Civil Engineering, Sun Yat-sen University, Zhuhai, China
- 4Institut für Geotechnik, TU Bergakademie Freiberg, Freiberg, Germany
- 5Southern Marine Science and Engineering Guangdong Laboratory (Zhuhai), Zhuhai, China
Unloading processes are common in natural systems. Intense unloading activities can alter the frictional equilibrium of faults and induce their instabilities. Understanding the slip behavior of faults under stress unloading conditions is helpful in guiding engineering practices. We conducted a series of direct shear experiments under linear-unloading normal force conditions considering the influences of initial normal forces, initial shear forces, and normal unloading rates on planar and rough granite fractures. The experimental results showed that planar fracture exhibits sudden slip events during normal unloading, while rough fracture mostly displays stable sliding behavior. The planar fracture demonstrates an exponential increase in sliding distance and velocity at the end of each slip event. The rough fracture usually exhibits a quasi-static stage before rapid slip events. In addition, the accumulative sliding distance at the slip activation moment (at the first moment when sliding velocity is greater than 0.05 mm/s) for the planar fracture decreases with lower normal unloading rate, larger shear force and larger normal force, while its variation trend for rough fracture is opposite. These findings provide valuable insights into fault slip behavior under stress unloading, aiding in mitigating associated risks in engineering applications.
1 Introduction
The exploitation of underground resources often involves stress unloading. Particularly in proximity to fault rupture zones, such unloading activities can perturb the stress field surrounding fault planes and promote the development of defects, which may trigger fault activation and secondary disasters such as earthquakes, thus posing a threat to the personal safety of the operator (Foulger et al., 2018; Przyłucka et al., 2022; Luo et al., 2023; Han et al., 2023). In recent years, several cases of fault slip and seismic disasters caused by human-induced unloading activities have drawn attention. For example, during the construction of the Jinping II hydropower station in China, tunnel excavation disrupted the frictional equilibrium of the rock mass, leading to fault activation (Xu et al., 2016). Similarly, in the case of the Gotthard Base Tunnel in Switzerland, excavation operations induced reductions in both normal and shear stresses on the surrounding rock, thereby promoting fault slip (Husen et al., 2013). These occurrences underscore the importance of studying the patterns of fault slip induced by stress unloading, which holds both theoretical and practical significance in mitigating potential risks.
The shear characteristics of fault are influenced by surface morphologies and boundary loading conditions (Singh and Basu, 2018). During the detachment of upper and lower blocks, the adhesive force of contacts can significantly affect the contact properties. The friction force of adhesive contact is related to the contact area. Both the surface morphology and the normal load can alter the contact area, thereby influencing the frictional characteristics (Lyashenko et al., 2023; Lyashenko et al., 2024; Liang et al., 2021). The stability of rock joints is affected by the shape and structure of the joints and the principal stress direction along the joint plane (Zou et al., 2024; Yang et al., 2022; Duan et al., 2019). The rough fault exhibits continuous stable slip, which can be divided into three stages: creep slip, quasi-static slip and dynamic slip (Ji et al., 2023), while the planar fault exhibits stick-slip rather than stable slip (Tao et al., 2023). In rate and state friction constitutive equations (Dieterich, 1979; Ruina, 1983), the friction coefficient of stick-slip is time-dependent, velocity-dependent and state-dependent. The roughness of the surface influences this dependency by altering the shear stress distribution and the critical slip distance, thereby affecting the slip form of the fault (Harbord et al., 2017; Selvadurai and Glaser, 2015; Candela and Brodsky, 2016). Additionally, increasing the normal effective stress can change the effective loading stiffness, leading to a transition from stable slip to stick-slip (Leeman et al., 2016; Zhuo et al., 2020, 2021). Stick-slip occurs only under sufficiently high normal stress, and the duration of the sample’s sticky state can influence the dynamic stress and sliding energy on the cross-section (Lyu et al., 2019; Okubo and Dieterich, 1984).
Over the past few decades, extensive research has been conducted on direct shear of rock fractures (Barton and Choubey, 1977; Wu et al., 2017; Zou and Cvetkovic, 2023). However, the research results have mainly focused on the evolution of peak shear strength during the sliding process or under tangential loading conditions. During the entire shear process of fractures, the boundary conditions of normal stress or normal stiffness generally remain unchanged (Mirzaghorbanali et al., 2014; Indraratna et al., 2015; Thirukumaran et al., 2016), and few studies of unloading-induced fault instability have been reported, particularly normal stress unloading. Previous researches have investigated the effects of normal stress perturbations on fault strength and slip, which are not purely normal unloading (Kilgore et al., 2017; Pignalberi et al., 2024). There are some normal unloading tests to study the effects of morphological characteristics, stress levels, and stress paths on the frictional strength and sliding behavior of fracture surfaces. However, most of them focus on rough fractures without comparison of planar samples (Yin et al., 2023b; Liu et al., 2023). The experimental samples are also artificial saw-tooth ones, which may not accurately reflect the real shear response of rock fractures (Yin et al., 2023a; Yang et al., 2022).
Although many studies have shown that the slip characteristics of the fault surface are closely related to surface roughness and normal stress, research on how stress unloading activities induce fault slip remains limited. Specifically, there is a dearth of research on how rough and planar surfaces transition from static state to stable and unstable slip, respectively, and how different levels of normal and shear stress, as well as unloading paths, affect their slip behavior, which needs to be further explored. Therefore, we obtained two pairs of granite samples with rough and planar fracture surfaces through splitting and sawing, respectively. A series of direct shear tests under normal unloading conditions were conducted to further analyze the instability mechanism of unloading-induced fault slip, thereby enhancing understanding of fault slip characteristics and providing guidance for practical applications.
2 Laboratory set-up
2.1 Laboratory apparatus
We utilized the DJZ-500 rock direct shear testing device (Dang et al., 2022). By inputting instructions to the control system through PC, the oil source provides power to the vertical and horizontal loading systems to make the specimens in the shear box bear loads or slips following the designed path. In addition, high-speed acquisition of displacement, load, deformation, and other parameters can be achieved through the LVDTs (Linear Variable Displacement Transducers) and load cells.
2.2 Sample preparation
The granite used in the experiment was sourced from Sichuan Province, China, and exhibits a medium-fine grain structure. The predominant minerals present in the rock samples include plagioclase, orthoclase, quartz, muscovite, and biotite. Mechanical testing revealed that the rock samples have the Young’s modulus of 101.9 GPa, a tensile strength of 7.51 MPa, and a compressive strength of 151.77 MPa, as shown in Table 1.
The rock samples were cut into cubes to match the dimensions of shear box, which measures 100 mm × 100 mm × 100 mm. Subsequently, one cube was divided into two rectangular cuboids using diamond sawing and the other was split by a tension machine, resulting in two pair of samples with man-made planar and rough fractures as shown in Figure 1.
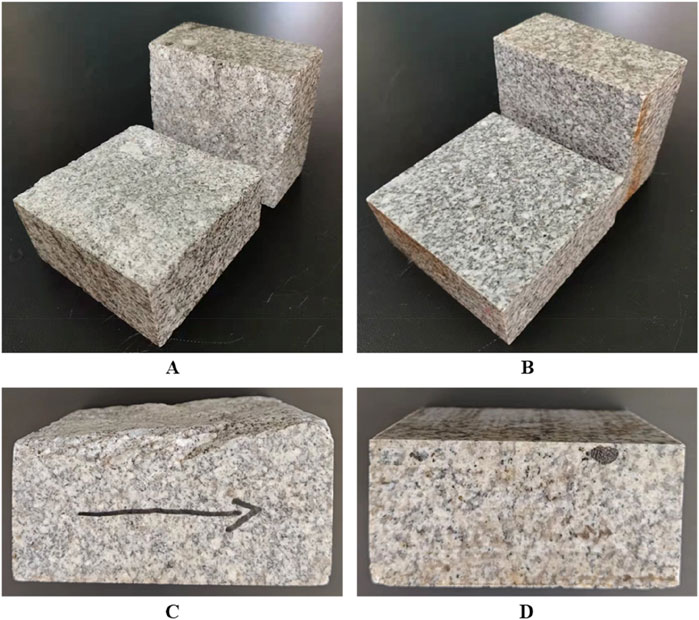
Figure 1. (A) Rough fracture sample obtained by tension splitting, (B) planar fracture sample obtained by sawing, (C) side view of rough fracture, (D) side view of planar fracture.
In order to improve the accuracy of experimental results and ensure the consistency of experimental configuration, small normal load levels were applied to the planar and rough surfaces to avoid the roughness change. What is more, the planar fracture was polished with sandpaper before each experiment to eliminate any wearing produced from the previous experiment. Meanwhile, an optical scanner was used to scan the fracture before and after the experiment, obtaining spatial point cloud data of the upper and lower rough fractures. Based on the coordinate positions of each point after scanning, the topographic contours are shown in Figure 2. Comparing the contours before and after the experiment ensured that the roughness remained relatively unchanged throughout the experimental process.
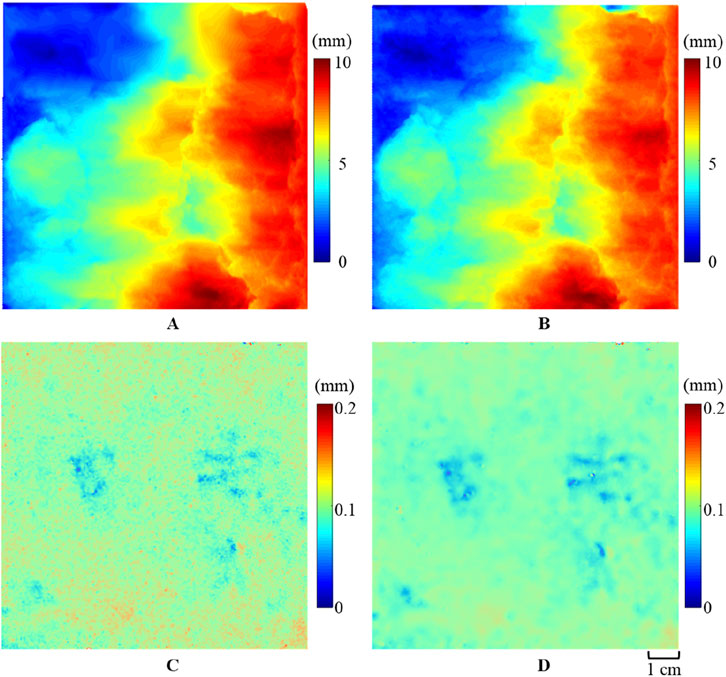
Figure 2. The topographic map of the upper slider: (A) before and (B) after the experiment for the rough fracture; (C) before and (D) after the experiment for the planar fracture.
2.3 Experimental scheme
In the normal unloading-induced shear slip experiment, a uniform vertical load was applied on the top of the upper shear box which is fixed. A stable horizontal force was applied to the lower part of shear box so that the fracture was subjected to both normal and shear forces. When the normal load is large, the horizontal force is less than the frictional strength, preventing the fracture from slipping. As the normal load gradually reduced, the lower rock block which was subjected to a constant shear load began to slide at a certain moment, as shown in Figure 3. In this experiment, the normal force
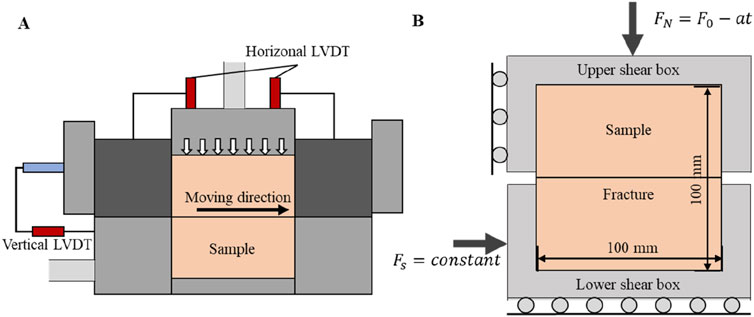
Figure 3. The test loading mode. (A) Sample and sensors placement diagram: the normal and shear forces are applied to the sample by the vertical and horizontal pistons, and the values of the forces and displacements are recorded by vertical and horizontal sensors. (B) Sample loading diagram: the sheared granite fracture was subjected to a constant shear load and a linear-decreasing normal load.
Each test included two stages (Figure 4): in the preloading stage, first the normal force increased to the target in 2 min and later kept at this initial value for 8 min. Then, the shear force was loaded to the initial value (τini) in 2 min, and it was stabilized for 5 min later. The preloading stage took 10 min totally. At this point, all forces in the two directions were ready and the normal force started to unload. In the unloading stage, the shear force was maintained at the initial constant value, while the normal force was unloaded at a specified rate. When the normal force decreased to a certain level, the shear box began to slide as the recorded sliding distance began to rise.
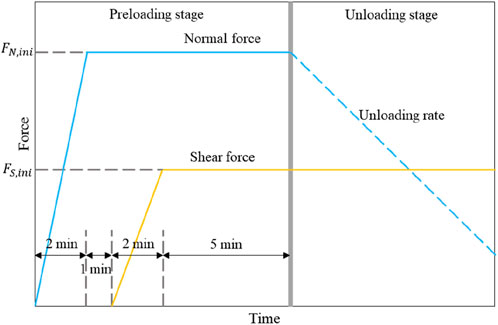
Figure 4. Force application plan. During the preloading stage, the normal force and shear force are loaded to the set values; During the unloading stage, the shear force remains unchanged, while the normal force is unloaded at a constant rate.
To investigate the influences of initial normal force, initial shear force, and normal unloading rate on the slip behavior of two kinds of fractures, three groups of experiments were designed for the planar and rough fracture samples. Group A kept the initial normal force and initial shear force unchanged and set the normal unloading rate ranging from 0.01 to 0.2 kN/s. Group B kept the initial normal force and normal unloading rate unchanged and set the initial shear force ranging from 10 to 20 kN. Group C kept the initial shear force and normal unloading rate unchanged and set the initial normal force ranging from 35 to 55 kN. Other parameters were kept consistent during the experiment, as shown in Table 2.
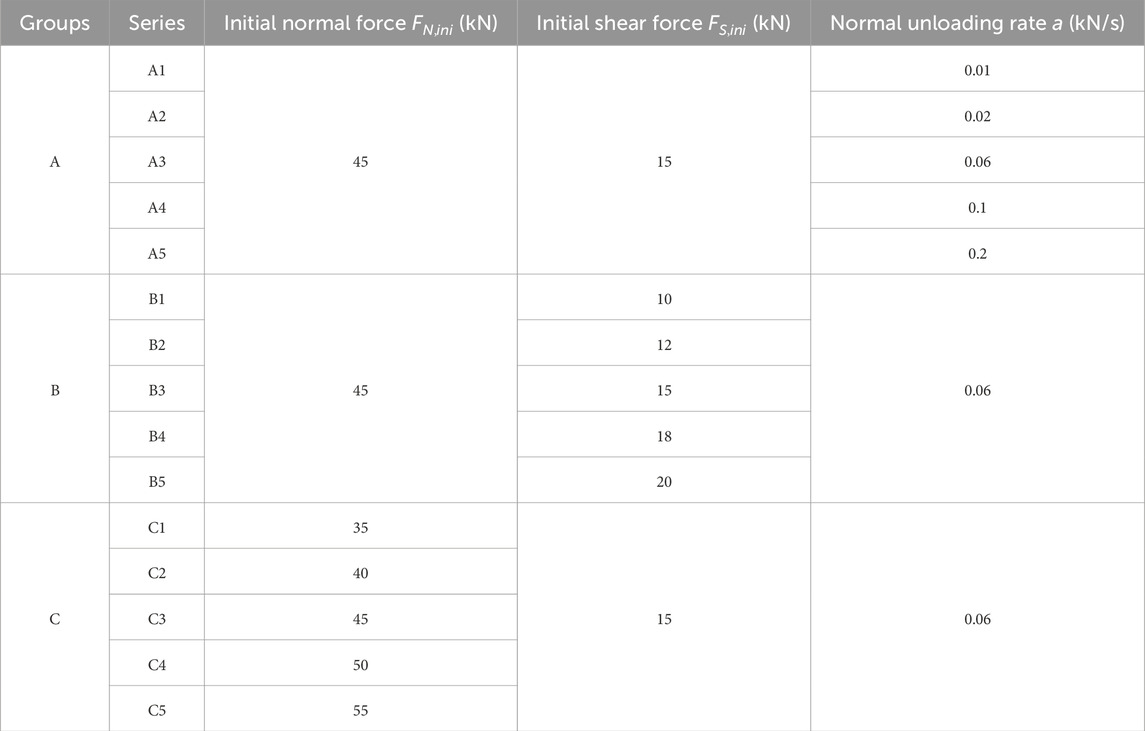
Table 2. Experimental parameters under different normal unloading rates, initial shear forces and initial normal forces.
3 Experimental results
3.1 Slip features of the planar fracture
Before the unloading stage, in the preloading stage of the direct shear test under constant normal force, the displacement of the shear box remains relatively stable. Consequently, this stage is not analyzed, and the time at which the normal force starts to unload (at 600 s) is taken as the starting point as well as the coordinate 0 point for graph plotting.
Taking the case of
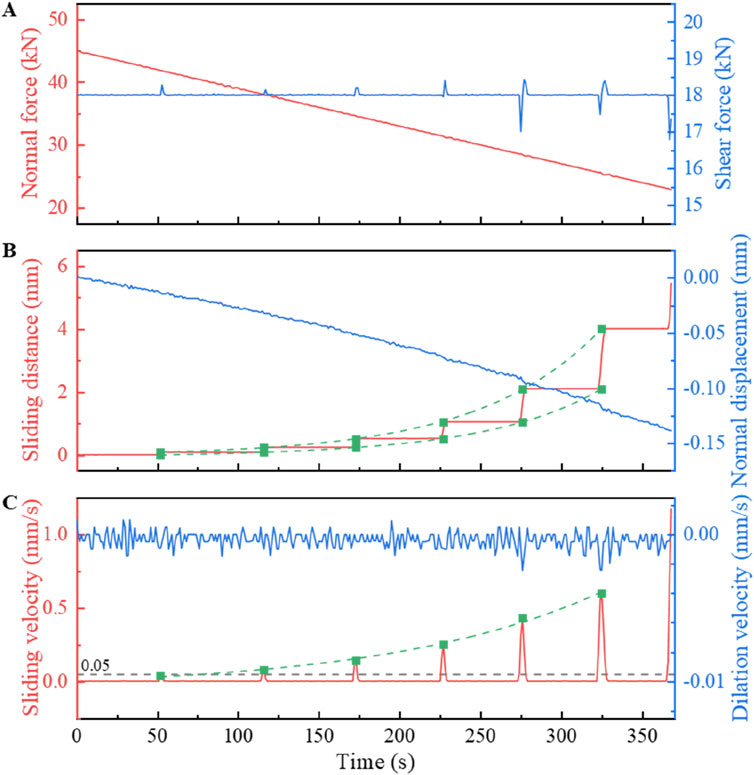
Figure 5. The unloading-induced planar fracture slip results for the case of B4 (shown in Table 2) which show the time history of (A) normal force, shear force, (B) sliding distance, normal displacement and (C) sliding velocity, dilation velocity. The decrease in normal displacement indicates an upward movement of the upper surface. The green dashed line represents the fitted exponential curve. The pentagram marker indicates the first moment when the sliding velocity exceeds 0.05 mm/s.
According to the time history of the normal displacement (Figure 5), the slip of the sample has a small impact on normal displacement, which is mostly influenced by the normal force. As the normal force decreases, the compression weakens, causing the upper and lower surfaces to separate, thereby reducing the normal displacement. At the same time, this also means that the normal displacement will not change significantly, so the sample dilation velocity is close to zero.
Figure 6 shows the variation of sliding distance and sliding velocity under different normal unloading rates, initial shear forces and initial normal forces. Under the same conditions, the larger the unloading rate, or the larger the initial shear force, or the smaller the initial normal force, the earlier the planar fracture slides, and the shorter the time required to slide to 5 mm. The coefficient of friction at the beginning of slip is 0.45–0.55 and the peak sliding velocity is 0.4–1.6 mm/s in the slip process.
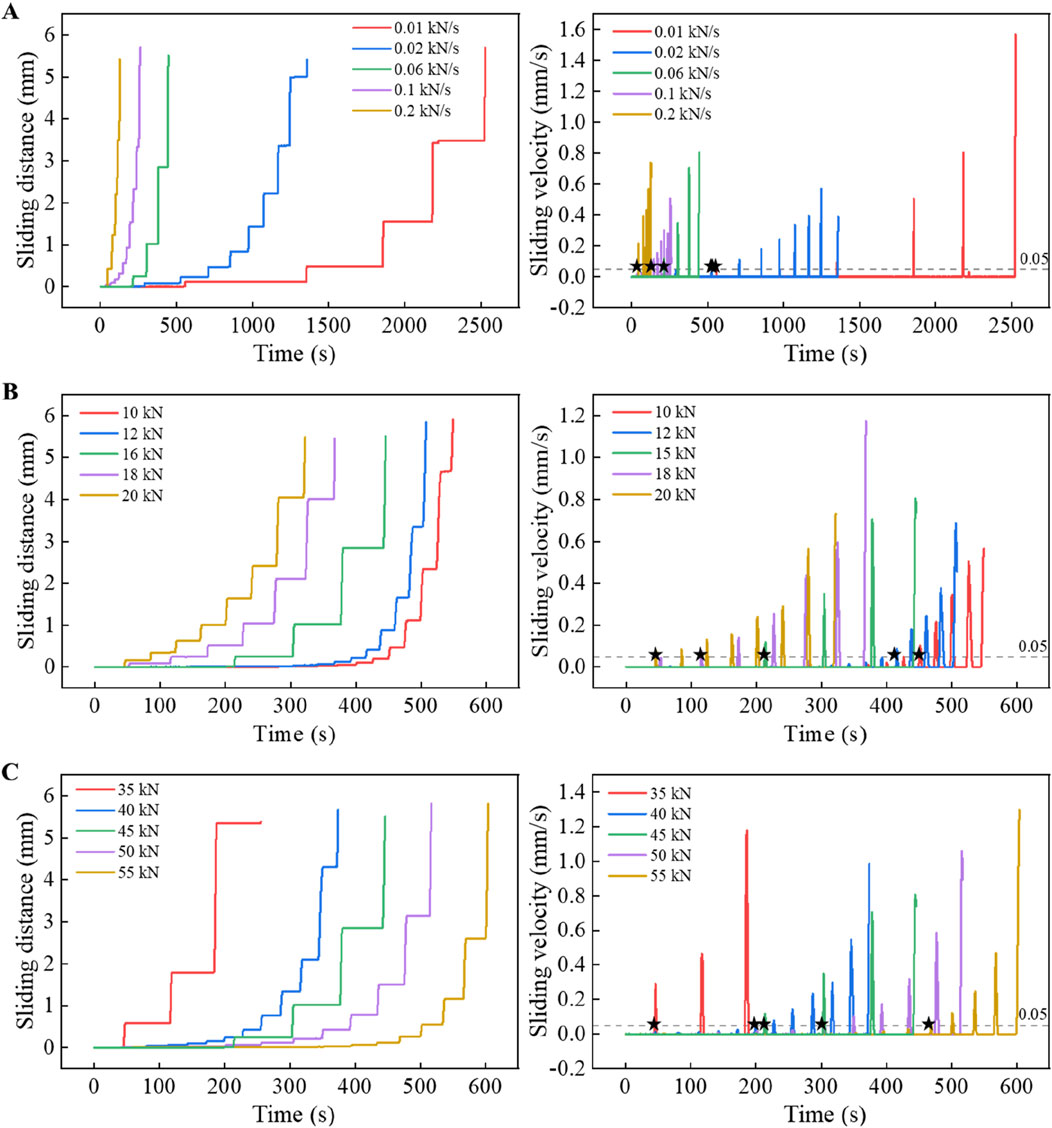
Figure 6. Variation curves of sliding distance and sliding velocity under different (A) normal unloading rates, (B) initial shear forces, (C) initial normal forces for planar fracture. The pentagram markers indicate the first moments when the sliding velocity exceeds 0.05 mm/s. Fixed parameters of experiment are shown in Table 2.
3.2 Slip features of the rough fracture
Consistent with the observations for the planar fracture, the rough fracture exhibits earlier slip when subjected to larger unloading rates, higher initial shear forces, or lower initial normal forces, as shown in Figure 8. However, its slip form is completely different from the planar fracture. Although the rough fracture also experiences fluctuations in shear force when the sliding velocity varies significantly, most slip still exhibits continuous and stable slip rather than sudden slip. Liu et al. conducted unloading-induced slip experiments on rough-walled sandstone, and observed that the sample undergone a quasi-static slip stage before dynamic slip (Liu et al., 2023). Similarly, we also found that some rough fracture groups such as B3, B4, C1, and C2 exhibit significant and drastic fluctuations in sliding velocity before quasi-static slip and rapid slip, which are considered as the symbol of the beginning of quasi-static slip stage (indicated by the triangle symbol in Figures 7, 8). However, under other conditions, such symbols are almost imperceptible, suggesting that when the sample is in a state that is unfavorable to slip (smaller normal unloading rates, lower initial shear forces, and larger initial normal forces), the beginning symbol of quasi-static slip stage is less conspicuous. Therefore, if using this as an indicator to determine whether rapid slip will occur in reality in order to provide early warning for disasters such as landslides and earthquakes, it should be noted that it is difficult to observe that symbol in rough faults when the slip is strongly suppressed.
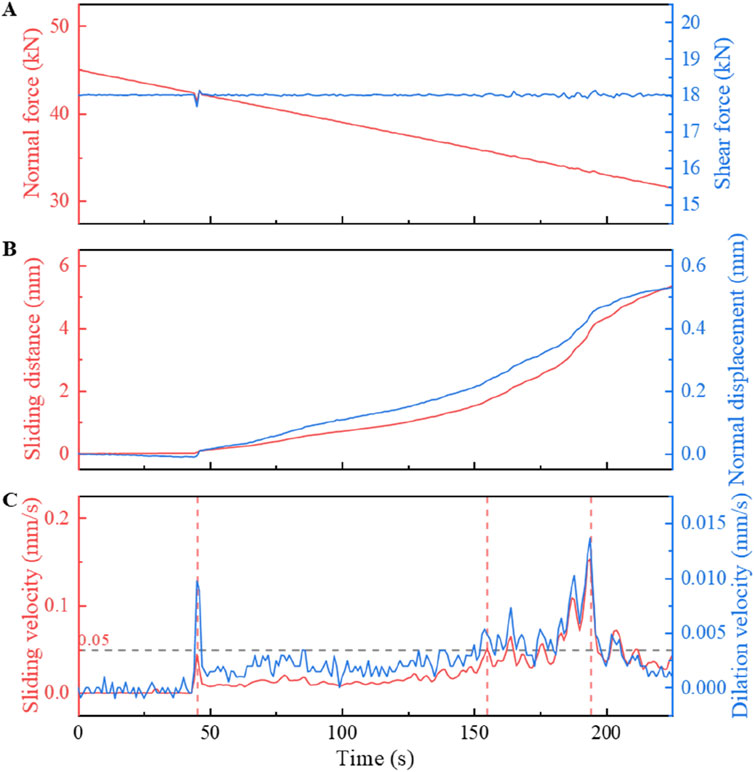
Figure 7. The unloading-induced rough fracture slip results for the case of B4 (shown in Table 2) which show the time history of (A) normal force, shear force, (B) sliding distance, normal displacement and (C) sliding velocity, dilation velocity. The increase in normal displacement indicates a downward movement of the upper surface. The triangle indicates the beginning of quasi-static slip stage. The pentagram marker indicates the first moments when the sliding velocity exceeds 0.05 mm/s after the quasi-static slip stage.
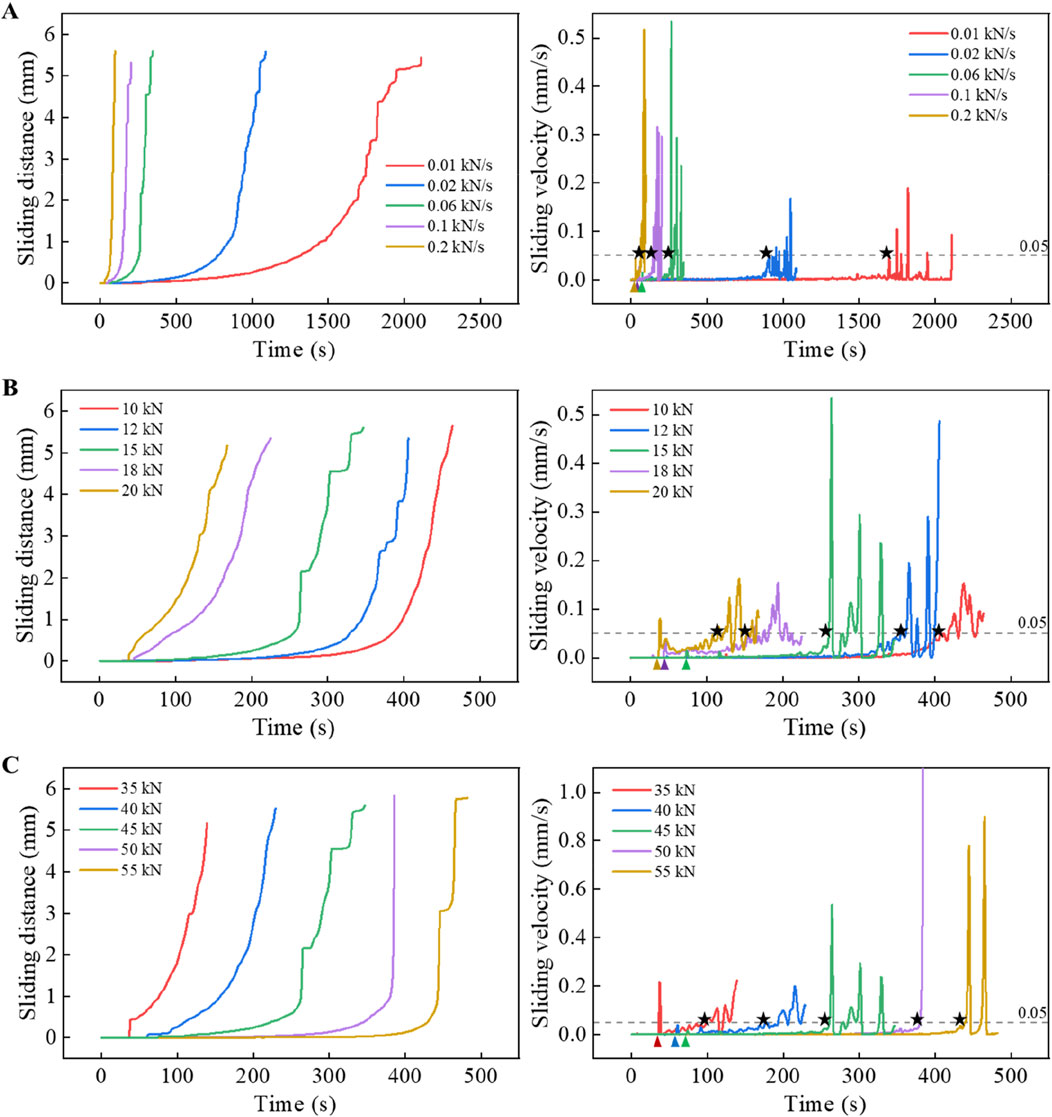
Figure 8. Variation curves of sliding distance and sliding velocity under different (A) normal unloading rates, (B) initial shear forces and (C) initial normal forces for rough fracture. The triangle markers indicate the beginning of quasi-static slip stage. The pentagram markers indicate the first moments when the sliding velocity exceeds 0.05 mm/s after the quasi-static slip stage. Fixed parameters of experiment are shown in Table 2.
In cases where the rough fracture exhibits sudden slip behavior, the quasi-static slip stage does not occur either. Although the rough fracture mostly exhibits stable sliding, this does not mean that they cannot show sudden slip like the planar fracture. When the initial normal force applied to the rough fracture is 5.0 and 5.5 MPa (as shown by the green and purple lines in Figure 8C), the slip form becomes sudden slip and there is no quasi-static slip stage. This indicates that whether sudden slip occurs not only depends on the surface roughness (Dieterich, 1978; Hoskins et al., 1968), but also on the magnitude of the normal stress (Byerlee and Summers, 1976). The occurrence of quasi-static slip stage is also influenced by the slip form of the sample.
It can be observed that the peak velocity of stable sliding on the rough fracture typically ranges between 0.1 and 0.5 mm/s, which is significantly lower than the planar fracture. When sudden slip occurs on the rough fracture, the peak sliding velocity is notably higher than that of stable sliding. For instance, when the initial normal force is 50 kN, the peak sliding velocity reaches 0.8 mm/s, which is similar to the peak sliding velocity on the planar fracture.
The fracture of the split sample is rough with asperities distributed on the surface. Sample slip affects not only horizontal shear displacement but also normal displacement. When the sample does not slip at the beginning, the normal displacement decreases slightly due to the decrease in normal force. During sample slip, the change in normal displacement is very similar to that of shear displacement due to the influence of surface topography, so the trend of the change in sample sliding velocity and dilation velocity curves is consistent, as shown in Figure 7. After the quasi-static slip stage, the sliding velocity of the sample first increases and then decreases, corresponding to the slip acceleration and slip deceleration stages. The acceleration of sample slip is attributed to the decrease in normal force, which leads to a decrease in frictional resistance, causing accelerated slip. The deceleration of sample slip is related to the increase of the slope in the lower surface. When the upper surface encounters this slope after a certain distance, the slip slows down.
4 Discussion
The activation of natural faults is highly affected by the normal stress state. Here we define the first moment when fracture slip velocity is greater than 0.05 mm/s as “slip activation moment”. Before this moment, the fracture remains static or the sliding velocity has fluctuated in a low range, while after that, the sliding velocity increases rapidly. For rough fracture sample, this moment can be regarded as the critical point at which the quasi-static slip transforms into dynamic slip. Figure 9 shows that the slip activation moment is delayed with the decrease of normal unloading rate, the decrease of initial shear force, and the increase of initial normal force. The difference of slip activation moment between rough and planar fractures decreases with larger normal unloading rate, and the initial shear and normal forces have little influence on it. When the unloading rate is small (equal to 0.001–0.002 MPa/s), the normal force decreases slowly. The rough fracture is in a slow quasi-static slip state for a long time before the slip activation, so the strain energy is also released slowly, resulting in a shorter time for the planar fracture to slip over 0.05 mm/s than the rough fracture. When the unloading rate is large (equal to 0.006–0.02 MPa/s), both the planar and rough fractures slip rapidly after a very short time, so their difference in slip activation moment is small, even when the initial normal and shear forces are different.
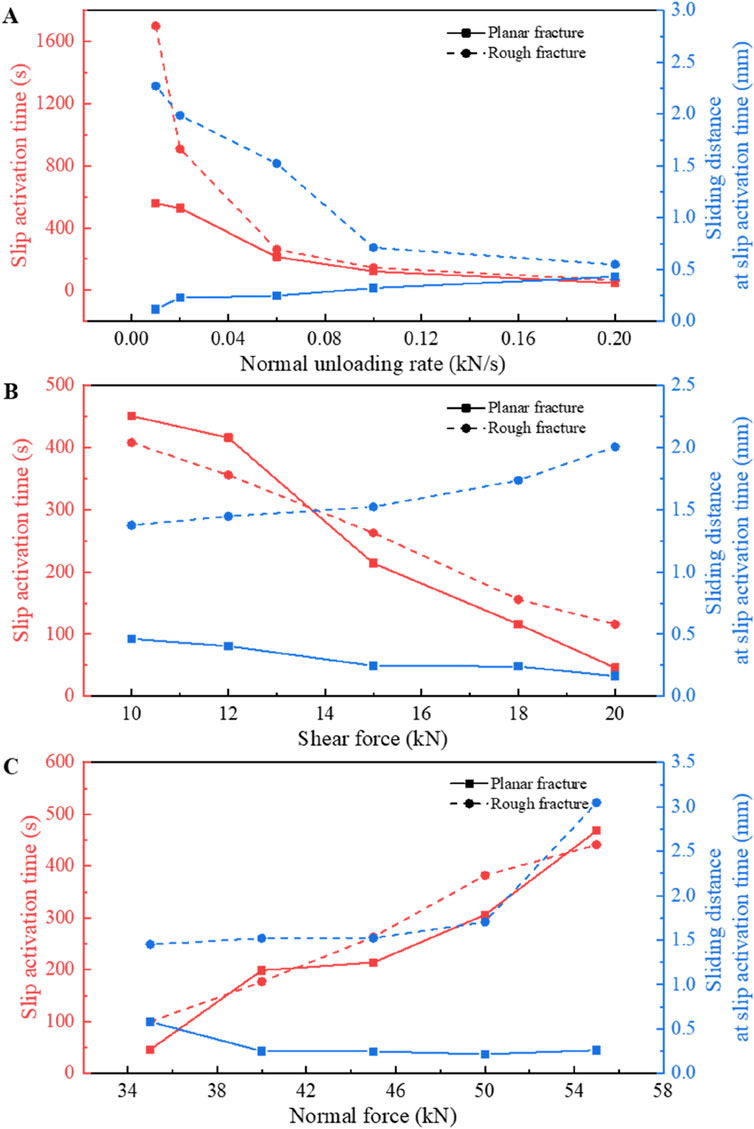
Figure 9. Slip activation moment and sliding velocity of planar and rough fractures under different (A) normal unloading rates, (B) initial shear force, and (C) initial normal force. Fixed parameters of experiment are shown in Table 2.
The sliding distance the rough fracture reached at slip activation moment is larger than the planar fracture under different normal unloading rate, initial shear force and initial normal force. This is because the rough fracture experiences a long period of slow quasi-static slip before activation, while the planar fracture easily slips more than 0.05 mm/s suddenly after a long period of rest. When the normal unloading rate is changed (Figure 9A), the sliding distance at slip activation moment of the planar fracture increases with the increase of the normal unloading rate. If the normal unloading rate is large, the inhibition of slip motion weakens rapidly, so the planar fracture slides a larger distance in a short time and is less restricted. However, the rough fracture experiences a longer timespan of slow quasi-static slip before activation at a smaller normal unloading rate, resulting in a longer accumulated sliding distance at slip activation moment.
When the initial shear force is changed (Figure 9B), the sliding distance at slip activation moment of the planar fracture decreases with the increase of the initial shear force. This is because with larger initial shear force, the occurrence of fast slip events is much earlier, resulting in shorter accumulated sliding distance; while for the sample with small initial shear force, the sliding velocity can only reach 0.05 mm/s after a number of slip events, so the accumulated sliding distance at slip activation moment is larger. However, the sliding velocity of the rough fracture subjected to high initial shear force in the quasi-static slip stage is significantly faster than that under small initial shear force. Therefore, the rough sample with a larger initial shear force has a longer accumulation of sliding distance before activation.
With larger initial normal force, the sliding distance at slip activation moment of the planar fracture decreases but it increases for the rough fracture (Figure 9C). For planar fracture, the inhibition of sample slip is weakened under lower normal force, and the cumulative distance of slow sliding before slip activation is larger. Therefore, the sliding distance at slip activation moment of the planar fracture under small normal force is large. Under larger normal force, the planar fracture experiences several slow slips before the rapid slip whose sliding distances are very small. The strain energy is slowly released in this process, so the cumulative slip distance before slip activation is not high. For the rough fracture, the larger the normal force, the longer the time of the quasi-static slip stage. The cumulative displacement for a long time leads to an increase in the sliding distance of the slip activation moment of the rough fracture, especially when it suddenly slips (when the initial normal force is equal to 5.5 MPa), the rapid increase of sample velocity results in a sharp increase of slid distance.
5 Conclusion
To investigate the unloading-induced slip behavior of rock fracture, two kinds of granite fractures (planar and rough) were sheared in the shear box device subjected to constant shear force and linear-unloading normal force. The temporal variation of shear distance and normal displacement were recorded. The experimental findings were derived as follows:
During the normal unloading process, planar fracture always exhibits sudden slip behavior, while the rough fracture tends to slide steadily. However, when the applied normal force is large enough, sudden slip also occurs on the rough fracture, indicating that the occurrence of sudden slip on the fracture surface is related to both surface roughness and normal force. Additionally, the slip velocity of sudden slip events is significantly higher than that of stable sliding process. As the normal force linearly decreases, the maximum sliding velocity for each slip event increases exponentially with experimental time. The slip motion of the rough fracture undergoes three stages: quasi-static slip stage, slip acceleration stage and slip deceleration stage. However, when the rough fracture is in the unfavorable condition of slip, the beginning of the quasi-static slip stage becomes difficult to observe. The slip activation moment of fracture is influenced by the normal unloading rate, initial shear force, and initial normal force. A higher unloading rate, higher initial shear force, or lower initial normal force leads to earlier slip activation. The sliding distance at slip activation moment of the planar fracture is always smaller than that of the rough fracture.
Data availability statement
The raw data supporting the conclusions of this article will be made available by the authors, without undue reservation.
Author contributions
ZT: Conceptualization, Writing–review and editing, Funding acquisition, Project administration, Resources. WT: Writing–review and editing, Funding acquisition, Project administration. XL: Writing–review and editing, Writing–original draft, Conceptualization, Data curation, Formal Analysis, Investigation, Methodology, Validation, Visualization. KT: Writing–review and editing, Conceptualization, Data curation, Formal Analysis, Investigation, Validation. WD: Writing–review and editing, Funding acquisition, Project administration, Supervision.
Funding
The author(s) declare that financial support was received for the research, authorship, and/or publication of this article. This work was supported by the National Natural Science Foundation of China (No. 52474122), and the Natural Science Foundation of Guangdong Province of China (No. 2022A1515240009).
Conflict of interest
Authors ZT and WT were employed by China Communications Construction Corporation-Guanghang Dredging Co., Ltd. and China Communications Construction Corporation Guangzhou Dredging Co.
The remaining authors declare that the research was conducted in the absence of any commercial or financial relationships that could be construed as a potential conflict of interest.
Publisher’s note
All claims expressed in this article are solely those of the authors and do not necessarily represent those of their affiliated organizations, or those of the publisher, the editors and the reviewers. Any product that may be evaluated in this article, or claim that may be made by its manufacturer, is not guaranteed or endorsed by the publisher.
References
Barton, N., and Choubey, V. (1977). The shear strength of rock joints in theory and practice. Rock Mech. 10, 1–54. doi:10.1007/bf01261801
Byerlee, J., and Summers, R. (1976). A note on the effect of fault gouge thickness on fault stability. Rock Mech. Min, Sci. & Geomech. Abstr. 13, 35–36. doi:10.1016/0148-9062(76)90226-6
Candela, T., and Brodsky, E. E. (2016). The minimum scale of grooving on faults. Geology 44 (8), 603–606. doi:10.1130/G37934.1
Dang, W. G., Tao, K., Huang, L. C., Li, X., Ma, J. J., and Zhao, T. T. G. (2022). A new multi-function servo control dynamic shear apparatus for geomechanics. Measurement 187, 110345. doi:10.1016/j.measurement.2021.110345
Dieterich, J. H. (1978). Preseismic fault slip and earthquake prediction. Geophys. Res. 83, 3940–3948. doi:10.1029/JB083iB08p03940
Dieterich, J. H. (1979). Modeling of rock friction: 1. Experimental results and constitutive equations. J. Geophys. Res. 84 (B5), 2161–2168. doi:10.1029/JB084iB05p02161
Duan, K., Ji, Y., Xu, N., Wan, Z., and Wu, W. (2019). Excavation-induced fault instability: possible causes and implications for seismicity. Tunn. Undergr. Space Technol. 92, 103041. doi:10.1016/j.tust.2019.103041
Foulger, G. R., Wilson, M. P., Gluyas, J. G., Julian, B. R., and Davies, R. J. (2018). Global review of human-induced earthquakes. Earth Sci. Rev. 178, 438–514. doi:10.1016/j.earscirev.2017.07.008
Han, Z. Y., Li, J. C., Wang, H. J., and Zhao, J. (2023). Initiation and propagation of a single internal 3D crack in brittle material under dynamic loads. Eng. Fract. Mech. 285, 109299. doi:10.1016/j.engfracmech.2023.109299
Harbord, C. W. A., Nielsen, S. B., Paola, N. D., and Holdsworth, R. E. (2017). Earthquake nucleation on rough faults. Geology 45 (10), 931–934. doi:10.1130/G39181.1
Hoskins, E. R., Jaeger, J. C., and Rosengren, K. J. (1968). A medium-scale direct shear experiment. Rock Mech. Min. Sci. 4, 143–154. doi:10.1016/0148-9062(68)90030-2
Husen, S., Kissling, E., and von Deschwanden, A. (2013). Induced seismicity during the construction of the Gotthard Base Tunnel, Switzerland: hypocenter locations and source dimensions. Seismol 17 (1), 195–213. doi:10.1007/s10950-011-9261-8
Indraratna, B., Thirukumaran, S., Brown, E. T., and Zhu, S. P. (2015). Modelling the shear behaviour of rock joints with asperity damage under constant normal stiffness. Rock Mech. Rock Eng. 48, 179–195. doi:10.1007/s00603-014-0556-2
Ji, H., Liu, R., Yu, L., and Zhu, X. (2023). Influence of joint inclination on mechanical behaviors of shales during unloading-induced slip processes. Int. J. Rock Mech. Min. Sci. 170, 105487–111609. doi:10.1016/j.ijrmms.2023.105487
Kilgore, B., Beeler, N. M., Lozos, J., and Oglesby, D. (2017). Rock friction under variable normal stress. J. Geophys. Res. Solid Earth. 122, 7042–7075. doi:10.1002/2017JB014049
Leeman, J. R., Saffer, D. M., Scuderi, M. M. C., and Marone, C. (2016). Laboratory observations of slow earthquakes and the spectrum of tectonic fault slip modes. Nat. Commun. 7, 11104. doi:10.1038/ncomms11104
Liang, X. M., Xing, Y. Z., Li, L. T., Yuan, W. K., and Wang, G. F. (2021). An experimental study on the relation between friction force and real contact area. Sci. Rep. 2, 20366. doi:10.1038/s41598-021-99909-2
Liu, R., Zhu, X., Zhang, Y., Jiang, Y., and Li, S. (2023). Simultaneous unloading of shear and normal stresses induces activation of naturally rough-walled sandstone fractures. Int. J. Rock Mech. & Min. Sci. 170, 105488. doi:10.1016/j.ijrmms.2023.105488
Luo, J., Li, Y., Meng, X., Guo, Q., and Zhao, G. (2023). Influence of coupling mechanism of loose layer and fault on multi-physical fields in mining areas. Int. J. Coal Sci. Technol. 10 (1), 86. doi:10.1007/s40789-023-00640-2
Lyashenko, I. A., Pham, T. H., and Popov, V. L. (2024). Effect of indentation depth on friction coefficient in adhesive contacts: experiment and simulation. Biomimetics 9, 52. doi:10.3390/biomimetics9010052
Lyashenko, I. A., Popov, V. L., and Borysiuk, V. (2023). Indentation and detachment in adhesive contacts between soft elastomer and rigid indenter at simultaneous motion in normal and tangential direction: experiments and simulations. Biomimetics 8, 477. doi:10.3390/biomimetics8060477
Lyu, Z., Rivi`ere, J., Yang, Q., and Marone, C. (2019). On the mechanics of granular shear: the effect of normal stress and layer thickness on stick-slip properties. Tectonophysics 763, 86–99. doi:10.1016/J.TECTO.2019.04.010
Mirzaghorbanali, A., Nemcik, J., and Aziz, N. (2014). Effects of cyclic loading on the shear behaviour of infilled rock joints under constant normal stiffness conditions. Rock Mech. Rock Eng. 47, 1373–1391. doi:10.1007/s00603-013-0452-1
Okubo, P. G., and Dieterich, J. H. (1984). Effects of physical fault properties on frictional instabilities produced on simulated faults. Geophys. Res. 89, 5817–5827. doi:10.1029/JB089iB07p05817
Pignalberi, F., Giorgetti, C., Noël, C., Marone, C., Collettini, C., and Scuderi, M. M. (2024). The effect of normal stress oscillations on fault slip behavior near the stability transition from stable to unstable motion. J. Geophys. Res. Solid Earth 129, e2023JB027470. doi:10.1029/2023JB027470
Przyłucka, M., Kowalski, Z., and Perski, Z. (2022). Twenty years of coal mining-induced subsidence in the Upper Silesia in Poland identified using InSAR. Int. J. Coal Sci. Technol. 9 (1), 86. doi:10.1007/s40789-022-00541-w
Ruina, A. (1983). Slip instability and state variable friction laws. J. Geophys. Res. 88 (B12), 10,359–10,370. doi:10.1029/JB088iB12p10359
Selvadurai, P. A., and Glaser, S. D. (2015). Laboratory-developed contact models controlling instability on frictional faults. Geophys. Res. Solid Earth 120, 4208–4236. doi:10.1002/2014JB011690
Singh, H. K., and Basu, A. (2018). Evaluation of existing criteria in estimating shear strength of natural rock discontinuities. Eng. Geol. 232, 171–181. doi:10.1016/j.enggeo.2017.11.023
Tao, K., Dang, W., Liao, X., and Li, X. (2023). Experimental study on the slip evolution of planar fractures subjected to cyclic normal stress. Int. J. Coal Sci. Technol. 10, 67. doi:10.1007/s40789-023-00654-w
Thirukumaran, S., Indraratna, B., Brown, E. T., and Kaiser, P. K. (2016). Stability of a rock block in a tunnel roof under constant normal stiffness conditions. Rock Mech. Rock Eng. 49, 1587–1593. doi:10.1007/s00603-015-0770-6
Wu, W., Zhao, Z., and Duan, K. (2017). Unloading-induced instability of a simulated granular fault and implications for excavation-induced seismicity. Tunn. Undergr. Space Technol. 63, 154–161. doi:10.1016/j.tust.2017.01.002
Xu, N. W., Li, T. B., Dai, F., Zhang, R., Tang, C. A., and Tang, L. X. (2016). Microseismic monitoring of Strainburst activities in deep tunnels at the Jinping II hydropower station, China. Rock Mech. Rock Eng. 49 (3), 981–1000. doi:10.1007/s00603-015-0784-0
Yang, Y. A., Wang, S., Wang, Q. T., Xing, W., and Fan, P. (2022). Unloading effect of the shear resistance of rock joints. Environ. Earth Sci. 81, 292. doi:10.1007/s12665-022-10415-8
Yin, Q., Nie, X., Wu, J., Wang, Q., Bian, K., and Jing, H. (2023a). Experimental study on unloading induced shear performances of 3D saw-tooth rock fractures. Int. J. Min. Sci. Technol. 33 (4), 463–479. doi:10.1016/j.ijmst.2023.02.002
Yin, Q., Zhu, C., Wu, J., Pu, H., Wang, Q., Zhang, Y., et al. (2023b). Shear sliding of rough-walled fracture surfaces under unloading normal stress. J. Rock Mech. Geotechnical Eng. 15 (10), 2658–2675. doi:10.1016/j.jrmge.2023.02.005
Zhou, X. P., He, Y., and Shou, Y. D. (2021). Experimental investigation of the effects of loading rate, contact roughness, and normal stress on the stick-slip behavior of faults. Tectonophysics 816, 229027. doi:10.1016/j.tecto.2021.229027
Zhuo, Y. Q., Guo, Y., Chen, S., and Ji, Y. (2020). Laboratory study on the effects of fault waviness on granodiorite stick-slip instabilities. Geophys 221, 1281–1291. doi:10.1093/gji/ggaa088
Zou, L. C., and Cvetkovic, V. (2023). A new approach for predicting direct shear tests on rock fractures. Int. J. Rock Mech. Min. Sci. 168, 105408. doi:10.1016/j.ijrmms.2023.105408
Keywords: rock fracture, normal unloading, shear force, slip behavior, frictional stability
Citation: Tao Z, Tang W, Li X, Tao K and Dang W (2024) Slip characteristics of planar and rough granite fractures under unloading normal force. Front. Earth Sci. 12:1443192. doi: 10.3389/feart.2024.1443192
Received: 03 June 2024; Accepted: 06 November 2024;
Published: 19 November 2024.
Edited by:
Sergio Carmelo Vinciguerra, University of Turin, ItalyReviewed by:
Iakov A. Lyashenko, Technical University of Berlin, GermanyZhenyu Han, Central South University, China
Copyright © 2024 Tao, Tang, Li, Tao and Dang. This is an open-access article distributed under the terms of the Creative Commons Attribution License (CC BY). The use, distribution or reproduction in other forums is permitted, provided the original author(s) and the copyright owner(s) are credited and that the original publication in this journal is cited, in accordance with accepted academic practice. No use, distribution or reproduction is permitted which does not comply with these terms.
*Correspondence: Wengang Dang, ZGFuZ3dnQG1haWwuc3lzdS5lZHUuY24=
 Zongheng Tao1,2
 Kang Tao
 Wengang Dang