 Ohara E. Eze1Anthony A. Okiwelu1
 Stephen E. Ekwok1
 Kamal Abdelrahman2Hassan Alzahrani2
 Ubong C. Ben1
 Amin Ibrahim3Chibuike Akpa4Peter Andráš5Samuel I. Ugar6
 Ahmed M. Eldosouky7*†
- 1Applied Geophysics Programme, Department of Physics, University of Calabar, Calabar, Nigeria
- 2Department of Geology and Geophysics, College of Science, King Saud University, Riyadh, Saudi Arabia
- 3Geology Department, Faculty of Science, Zagazig University, Zagazig, Egypt
- 4Department of Geology, Ebonyi State University, Abakaliki, Nigeria
- 5Faculty of Natural Sciences, Matej Bel University, Banska Bystrica, Slovakia
- 6Department of Geology, University of Calabar, Calabar, Nigeria
- 7Department of Geology, Faculty of Science, Suez University, Suez, Egypt
Regional magnetic data in the southeastern segment of the Nigerian Niger Delta were evaluated with the aim of mapping deep-seated tectonic elements. Enhanced filtering operations and 3D forward modelling were applied on the magnetic data. These geologic features triggered the formation of rollover anticlines and faults that serve as structural traps in the study area. The filtered residual magnetic data revealed geologic structures characterized with NE - SW, N - S, and E - W orientations. The 3-D models detected the faulted crustal blocks, gradient zones, and intra-basement compositional magnetic variations. Furthermore, some prominent horst and graben structures as well as related normal faults characterized with distinct magnetic signatures were observed. Faults of base magnetic (of various compositions) were observed to be the fabricating mechanisms of the magnetic anomalies. Collectively, these structures influenced the patterns of magnetic anomalies with direct effects on the hydrocarbon trapping systems, as well as the pathways and accumulation zones for hydrothermal minerals. On the whole, the interpreted results revealed that the basement surface is rippling. Additionally, the depth result showed sedimentary thicknesses that ranged from 4–10 km. Again, the estimated crustal thickness varied from 14 to 19 km. This study has displayed the capabilities of the magnetic method in mapping the depth and configuration of basement rocks, which are crucial in controlling the formation of structural traps. Identifying these basement structures early helps in understanding the overall geological framework and potential hydrocarbon systems.
1 Introduction
The Niger Delta has been extensively probed applying various geophysical methods most especially seismic survey and exploratory drillings on the Tertiary deltaic sequence (Ekwok et al., 2021a; Oladele and Ojo, 2013; Li and Morozov, 2006). Nevertheless, the majority of these geophysical explorations are focused on the Tertiary sediments for hydrocarbon exploitation with minimal attention paid to the underlying basement structures (Oladele and Ojo, 2013). Generally, several researchers have reported that tectonic events have control over the basement framework, structural traps, petroleum system of the overlaying sediments, and hydrothermal related mineralization (Ekwok et al., 2024a; Ekwok et al., 2024b; Corredor et al., 2005; Briggs et al., 2009; Connors et al., 2009; Kharbish et al., 2022; Bencharef et al., 2022; Abdelrahman et al., 2023a). Furthermore, investigating the various intra-basement rocks and supra-basement structures is essential in understanding the development of features within the sequenced sediments (Zhao et al., 2024; Sun et al., 2024; Abdelrahman et al., 2023b; Alfaifi et al., 2023; Brimich et al., 2011). Evaluation of the buried basement structures is a requirement in basin analysis, and such study is a common component of exploration success (Liu et al., 2024; Li et al., 2024; Lyatsky et al., 2005; Saada et al., 2022).
The identification of deep crustal elements like faults and the effect of deformation is critical to hydrocarbon (Jiao et al., 2021; Liang et al., 2024; Quirk and Kimbell, 1999; Readman et al., 2005) and mineral explorations (Ekwok et al., 2022a; Ekwok et al., 2022b; Ekwok et al., 2022c; Ekwok et al., 2022d; Ekwok et al., 2022e), as well as addressing some environmental challenges (Anand and Rajaram, 2004; Kilaru et al., 2013; Briggs et al., 2009). In general, potential field and geological datasets are often used to map tectonic settings and basement faults (Ekwok et al., 2021a; Ekwok et al., 2021b). Many faults affecting the sedimentary rocks are known to be basement-controlled (Connors et al., 2009; Corredor et al., 2005). Magnetic data can offer very important information on the position of faults in the basement (Eldosouky et al., 2022a; Eldosouky et al., 2022b; Eldosouky et al., 2022c). The faults have extended into the overlaying sediments and triggered fluid flow and formation of structural traps, mineralization accumulation zones as well as salt dissolution and carbonate alteration (He et al., 2021; Dong et al., 2024; Lyatsky et al., 2005). Interpretation involving the basement structures, and the influence on the overlaying sedimentary series have been previously described (Brown and Brown, 1987). In addition, hydrocarbon trapping structures existing within the sediments are controlled by the topography and structural elements of the basement which can be adequately imaged by aeromagnetic data (Corredor et al., 2005; Connors et al., 2009; Ekwok et al., 2021a; Ekwok et al., 2021b; Saada et al., 2022). Lineaments from magnetic data showed that the boundaries of the basement blocks affect the deposition of sediments (Brown and Brown, 1987; Babalola and Gipson, 1991). The response of basement rocks to magnetic effects has been applied to establish the relationship between underlying basement structures and magnetic signatures (Babalola, 1981; Guun, 1997). Such correlation can be used to establish the influence of the basement structures on the overlying sediments provided the tectonic history of the area is known (Okiwelu et al., 2013).
However, airborne magnetic data do not provide direct identification of lithology, rather the data can be applied in the evaluation of the nature of the crust underneath the sedimentary basins (Guun, 1997), the range and depth of sediments, and the offshore extent of basement terrains and fault zones (Guun, 1997; Skilbrei et al., 2002; Glen et al., 2007; Connors et al., 2009; Saleh, 2012). Airborne potential field data are very significant in geologic structural applications (Paoletti and Pinto, 2004; Bhashara and Annapuma, 2015; Ekwok et al., 2019; Pham et al., 2021a; Pham et al., 2021b; Eldosouky et al., 2022b; Eldosouky et al., 2022d), and are even more important when applied to inaccessible regions. The magnetic method can delineate major lineaments, and their interconnections with recent geologic structures (Glen et al., 2007; Ekwok et al., 2022a; Ekwok et al., 2022b; Eldosouky et al., 2022d; Eldosouky et al., 2024) plus the tectonic configuration of the upper crust (Babalola and Gipson, 1991; Meyer, 1998; Okiwelu et al., 2013; Okiwelu et al., 2014; Bhashara and Annapuma, 2015).
This research used regional magnetic data to visualize and map changes in basement topography, composition, and fault systems that could affect field production and location (Ben et al., 2022; Ben et al., 2023; Li and Morozov, 2006). By imaging the basement, geoscientists can better understand factors affecting deposition, structural traps, inter-block tension, storage centers, and make faster decisions about further exploration operations (Jiao et al., 2024; Zhou et al., 2023a; Zhou et al., 2023b; Wang et al., 2015). Studies involving the assessment of critical factors like the 3-D structural framework of the basement, the connection between hydrocarbon and deep basement structures, and related mineral targets which can be detected from magnetic studies (Zhou et al., 2022; Hiroyuki et al., 2007; Peng et al., 2009; Wang et al., 2015; Saada et al., 2021; Saada et al., 2022; Elkhateeb et al., 2021; Mahdi et al., 2022; Eldosouky et al., 2024), have been lacking in the Niger Delta, and these observed setbacks motivated this investigation.
2 Physiographic and geology setting of the study area
The area is positioned in the southeastern segment of the Nigerian Niger Delta and is bounded by latitude 4.000 N to 4.300N and Longitude 7.000E to 8.300E covering 9,075 km2 (Figure 1). The geology of the region has been comprehensively described by many researchers (Haack et al., 2000; Weber, 1987; Doust and Omatsola, 1990; Whiteman, 1982; Weber and Daukoru, 1975; Short and Stauble, 1965; Evamy et al., 1978; Babalola, 1981; Hospers, 1965; Reijers, 2011; Reijers, 1996, etc.). The study area is an extensional rift basin placed within the Niger Delta and the Gulf of Guinea on the passive continental margin on the western coast of Africa with an approximate sub-aerial area of 75,000 km2, a total area of 300,000 km2, and sediment volume of 5,00,000 km3. The sediment fill has a depth range of 9–12 km. The Niger Delta is among the world’s foremost hydrocarbon regions in the world. Oil and gas in the area are mostly produced from sandstones and loose sands of the Eocene-Pliocene Agbada Formation (Haack et al., 2000; Ekweozor and Okoye, 1980). The 9–12 km thick Niger Delta clastic wedge ranges 75,000 km2 in area in southern Nigeria and the Gulf of Guinea offshore Nigeria. This clastic wedge comprises the 12th largest known accumulation of recoverable hydrocarbons, with reserves surpassing 34 billion barrels of oil and 93 trillion cubic feet of gas (Ekweozor and Okoye, 1980; Tuttle et al., 1999).
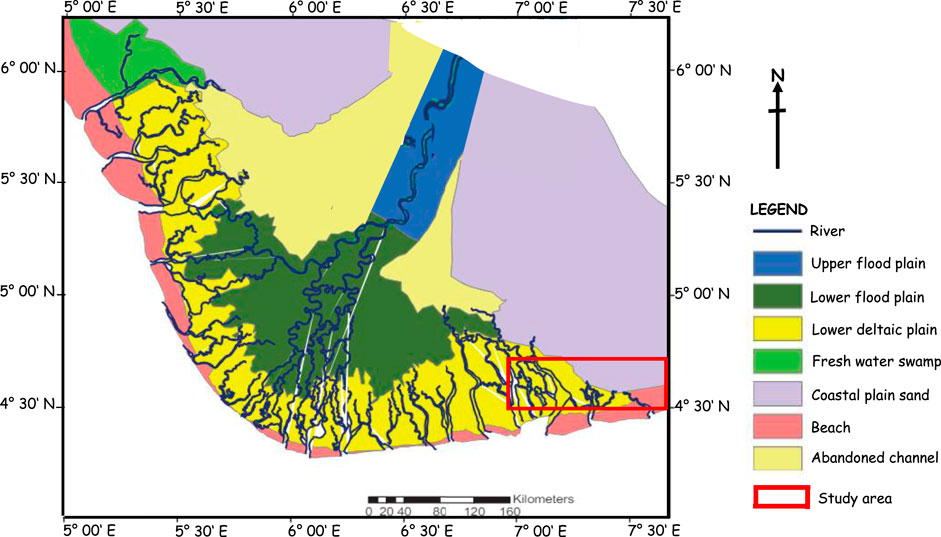
Figure 1. Regional geologic map of the Niger Delta showing Tertiary-Recent deltaic plain sands that sit on the underlying basement and related structures.
Apart from petroleum, the region exemplifies the classical delta in geologic literature (Haack et al., 2000). The nature of the Niger Delta sediments is separated into three distinct units of Eocene to Recent ages that form major transgressive and regressive cycles (Reijers, 1996; Reijers, 2011). The Miocene-Pleistocene Benin Formation comprises the continental fluviate and back swamp deposits with an average thickness of 2,500 m at the upper part. This unit is underlaid by the Eocene-Pliocene Agbada Formation (the main petroleum reservoir), which is of paralic, brackish to marine, coastal marine deposits, with an average thickness of 3,400 m. The underlying Paleocene Akata Formation is of marine prodelta clays with an average thickness of 6,500 m. The shale of the formation (Akaka) forms the source rock for hydrocarbon (Reijers, 2011).
The structure and tectonic history of a region have a significant impact on its evolution (Crafford and Grauch, 2002). The region was formed by the buildup of sediments above a crustal tract triggered by rift faulting in the Precambrian with outlines controlled by deep-seated faults associated with rifting (Connors et al., 2009; Corredor et al., 2005).
The Niger Delta denotes the failed branch of the triple rift junction linked with the evolution of the South Atlantic (Tuttle et al., 1999). Rifting diminished in the Delta during the late Cretaceous, and gravitational tectonics became the principal deformational process after the rifting phase (Kulke, 1995). Induced internal deformation happened in reaction to two mechanisms caused by shale mobility. Shale diapirs were created by the loading of poorly consolidated, over-pressured Akata Formation by the higher-density Agbada Formation. The gravitational tectonism was accomplished before the deposition of Miocene-Pleistocene Benin Formation (Evamy et al., 1978). Deposition of the three formations occurred in each of the five off-lapping Siliciclastic Sedimentation cycles (depobelt) that make up the Niger Delta. Each depobelt with its sedimentation, deformation, and petroleum history (Okiwelu and Ude, 2012).
3 Data used
3.1 Data acquisition
The airborne magnetic data used for this study were sourced from the Nigerian Geological Survey Agency. The data were acquired by Earth Sciences Limited in 1975. The magnetic data were acquired with flight line spacing of 2,000 m, tie lines of 20,000 m, an elevation above the sea level of 762 m, and recorded on contour maps with scale of 1:100000. These data can be effectively used to map regional geologic structures and prominent depo-centres such as the Niger Delta (Okiwelu et al., 2014). On the whole, the aeromagnetic maps were digitized at 1 km intervals along the flight lines using the method described by Kangkolo (1996). The digitized data were then transformed to an equally spaced 1 km by 1 km grid spacing applying the minimum curvature technique by Webring (1981). The data were gridded at 1 km intervals alongside the flight lines. Potent software was used to grid and present the maps in color raster format with the sanctity of the original maps being preserved (Figure 2).
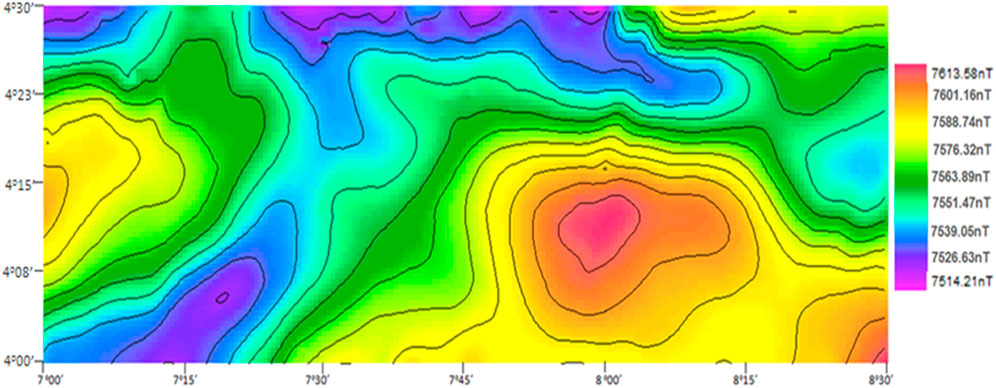
Figure 2. Total magnetic field intensity data showing magnetic highs and lows represented by red-yellow and green-purple, respectively.
4 Methodology
Magnetic theory has been traced back to Pierre Laplace’s 1770 study on differential equations. Mathematically, magnetic theory describes functions that satisfy the basic differential equation called the Laplace’s equation. The magnetic method is a very popular and inexpensive approach for near-surface detection of geologic structures. Most rocks are not magnetic; however, certain types of rocks contain enough minerals to originate significant magnetic anomalies. The data interpretation that reflects differences in local abundance of magnetization is particularly useful for locating faults and geologic contacts (Blakely, 1996).
The fundamental principle of the magnetic method (Equation 1) is based on Coulomb’s Law. Coulomb’s explanations were stretched by Gauss, and the force is attributed to fictitious magnetic poles. Coulomb’s investigations of 1785 established that the force F between two magnetic poles of strengths m1 and m2 separated by a distance r is given by:
where μ is the magnetic permeability of the medium separating the poles.
Usually, magnetic data enhancement techniques and interpretation require different approaches. To achieve the goal of this research, 3-D forward modeling and other enhancement techniques were employed. However, to highlight local anomalies, the regional portion of the total magnetic field was expunged from the data, generating a residual map. The regional magnetic field as opposed to the local anomalous field is unavoidably subjective (Okiwelu et al., 2014; Li and Oldenburg, 1998). In this study, the regional-local anomaly separation was accomplished by the use of the least square method (Agocs, 2005). Accordingly, the data were calculated using the least squares involving mathematically describable surfaces giving the closest fit to the magnetic field that can be obtained in a specific degree of detail (Agocs, 2005). We exploited the fact that the regional field is a first-order surface of the form in Equation 2:
where T (x, y) are regional field in the space domain, a, b, and c are the coefficients and are calculated to minimize the disparity of the residual anomalies. This method of calculating the regional is appropriate since higher-order polynomials might be amenable to a large area over which the regional has several convolutions.
The degree polynomial was computed from the total intensity magnetic field data to accentuate the residual magnetic anomalies from all possible underground bodies needed for the qualitative and quantitative interpretation (Oldham and Sutherland, 1955).
Geophysical data contains wide-band information. That is each reading includes the influence of all physical sources, geological and cultural which produce a response at the point of measurement. With the application of filters, we were able to remove or minimize undesirable signals in the data and enhance the components that are of interest (Li and Oldenburg, 1998).
For this research, we adopted wavelength filtering centred on Fourier integral transform (Equation 3) T (u, v) of a function t1 (x, y) is:
where u and v are wavenumbers related to x and y-axes, correspondingly, and t1 (x, y) is total magnetic field value at known discrete points. Therefore, the discrete Fourier transform (Equation 4):
where T (k, l) is the input signal in the space domain, m and n are integers signifying grid point positions in the space domain, k, l are integers signifying grid point positions in the frequency domain, t1 (x, y) is total magnetic field value at known discrete points, N and M are the number of columns and rows, respectively. To get the enhanced result, t2 which is the spatial domain of the inverse Fourier transform was applied, and for the discrete data set (T2) (Equation 5):
In an attempt to map the basement configuration, a 3-D forward model was adopted since the geology of the Niger Delta is properly understood. The 3-D forward model is made up of a network that models the sub-surface based on the susceptibility contrast (Ali et al., 2012). A number of analytical solutions exist for discrete objects with simple 3D geometries, for example, ellipsoids and prisms, and these allow rapid calculation of magnetic field for bodies with uniform geophysical rock properties (Jessell, 2001). These bodies are then parameterized in terms of the spatial location of the object, its scale, its orientation and its susceptibility (Jessell, 2001). 3D forward modelling is a useful parameter in magnetic data modelling. The magnetic intensity, total magnetic field, shuttle radar topographic mission, inclination, and declination at the position and date of survey were recalculated prior to modelling using the IGRF. This was done because the Earth’s field varies with position and time. The SPI profile was loaded through backdrop for use in controlling the modelling process. The split block tool was used in dividing the block into segments, separating sedimentary layer from the basement and also, drawing fault lines along fault planes. The examine tool was used to change the properties (colour, susceptibility) of various blocks. Iterations were performed using tools like move point, add point and delete point. While trying to match observed and calculated values, the RMS error value displayed on the panel was used as a guide in rating the extent of matching. Profiles were obtained to model the sub-surface using the rectangular prism model which enabled the definition of depth, geometry, and contrast in the associated physical properties (Okiwelu et al., 2014; Ali et al., 2012).
5 Results
5.1 Qualitative interpretation
To enhance the residual magnetic anomalies needed for interpretations, the first-degree polynomial filter was applied to the magnetic data. The first-degree polynomial result effectively revealed the underlying basement that is characterized by yellow-red color (Figure 3). Also, weak zones within the basement defined by green-purple color were mapped. All the magnetic anomalies in the investigated area characterized by linear, circular, and sub-circular shapes were delineated.
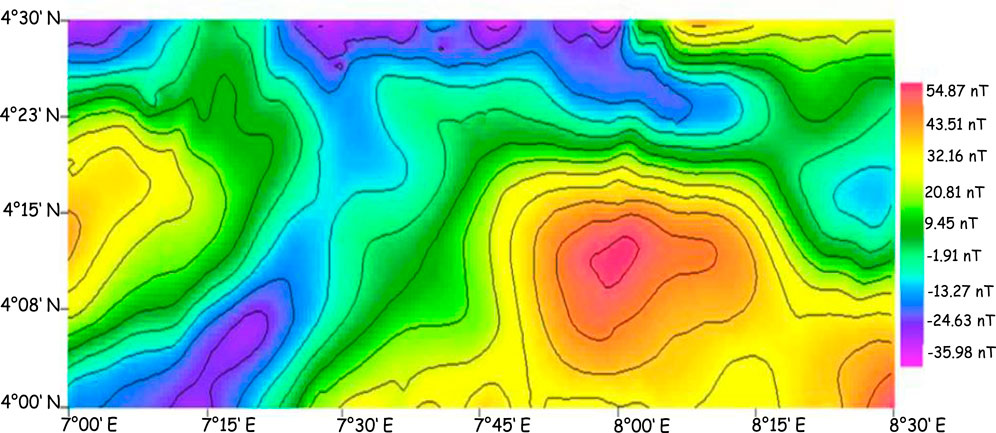
Figure 3. Residual magnetic data processed using a first-degree polynomial correction method in order to indicate the presence of important geological structures.
Furthermore, high and low pass filters were applied to the observed magnetic data. These operations reveal both magnetic textures and relief (Bird, 1997). Figure 4 revealed short wavelength and fairly high amplitude anomalies while Figure 5 mapped zones dominated by short and longer wavelength sources. Separation of the magnetic data was consequently carried out applying qualitative interpretation which comprises evaluation of linear structures and trends. These operations highlighted fairly the short wavelength components in the southeast and northwest regions (Figure 4) and produced residual anomalies that are more appropriate for high-resolution delineation of magnetic borders. Figure 5 elucidated both short and long wavelength anomalies that highlighted the local and regional magnetic structures originating from deep sources oriented in the NE-NW direction. Thus, variations in depth to magnetic basement in the area under investigation also divulge wide-ranging magnetic patterns. The black lines in Figures 4, 5 are lineaments that marked deep breaks in the magnetic basement and signify continental-scale geologic structures. The remarkable steeper-than-normal horizontal gradient with a linear trend of the anomalies indicates strike-slip displacement while the circular and lenticular discrete anomalous sources indicate intrusions and faulted basement blocks (Okiwelu et al., 2014). Such intrusions are suspected to be mafic plutons since they are dominated by high magnetic susceptibilities (Okiwelu et al., 2014).
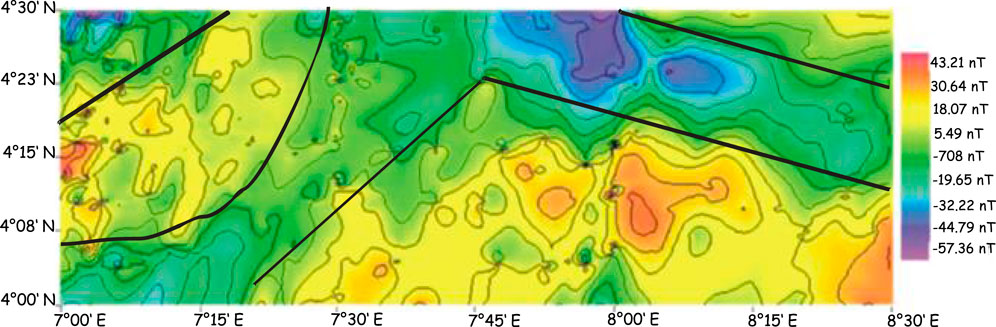
Figure 4. Band pass filtered data showing areas of different geophysical characteristics isolated by structural boundaries indicated with black lines.
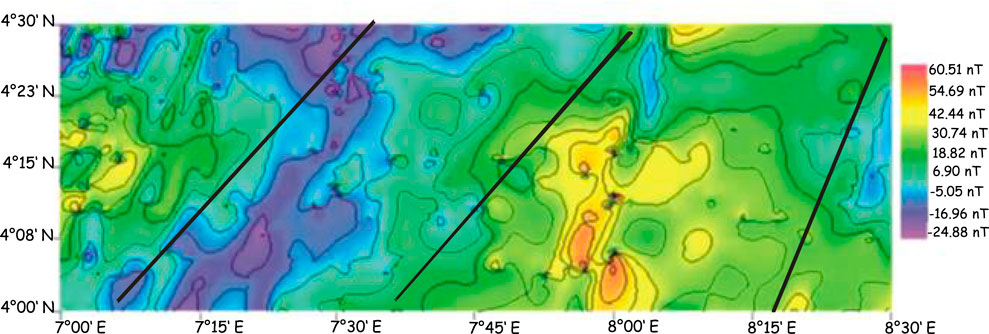
Figure 5. Low pass filtered data characterized partially by short and longer wavelength anomalies (the black lines were used to partition the accommodation zones that correspond with the edges of structures).
The black lines on the maps indicate sediment accommodation regions and match the borders of geologic structures. Careful evaluation of the maps showed structures like troughs, anticlines, and arches close to the lineaments. The general evaluation of the enhanced magnetic data divulges the bulk structure of the upper crust, where the brittle faults are obtainable. The brittle fault exerts considerable syn-depositional and post-depositional influence on the overlaying sediments. The brittle faults typically propagate into the sediments where their impacts are indicated as structural lineaments and are often targeted in hydrocarbon investigation.
5.2 Quantitative interpretation of 3-D forward models
To map and estimate the depth of the crustal structures by magnetic method and offer a more comprehensive understanding of the first-order basin assessment parameters, eight profiles (Figure 6) oriented in the NE-SW direction were modeled. From the profile lines 1,200 (Figure 7), 4,500 (Figure 8), and 4,600 (Figure 9), the models were observed to be dominated by geologic sources having anisotropic susceptibilities and characterized by both strike-slip and dip-slip motions between the crustal blocks (Okiwelu et al., 2014). These physical properties and motions are indicators of weak zones perhaps caused by the reduction of the magnetite. The observed accommodation zones trended perpendicular, parallel, or oblique to the orientation of the extension. The structural grains from the models related to the faulted blocks were noticed. These are areas where sealing faults terminate because of enormous displacement, and they lose their sealing properties. Petroleum resources can easily leak from the Graben system.
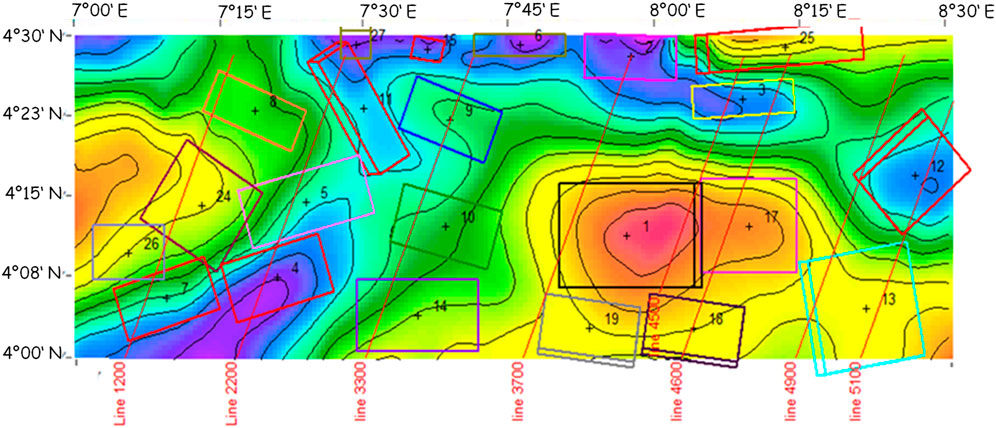
Figure 6. The location of profile lines 1,200, 2,200, 3,300, 3,700, 4,500, 4,600, 4,900 and 5,100 in the residual magnetic field data (The rectangular wire frames symbolize the sources of magnetic anomalies).
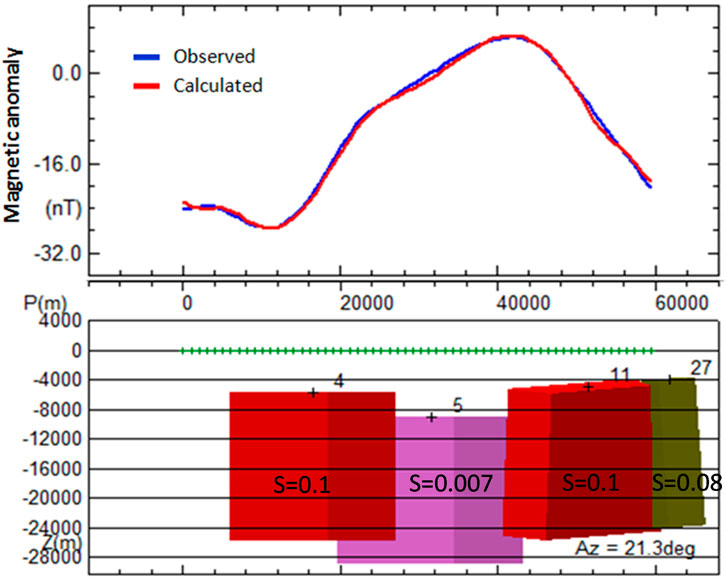
Figure 7. Three-dimensional magnetic model derived from data collected along profile 2,200, showing a detailed visualization of the subsurface magnetic properties.
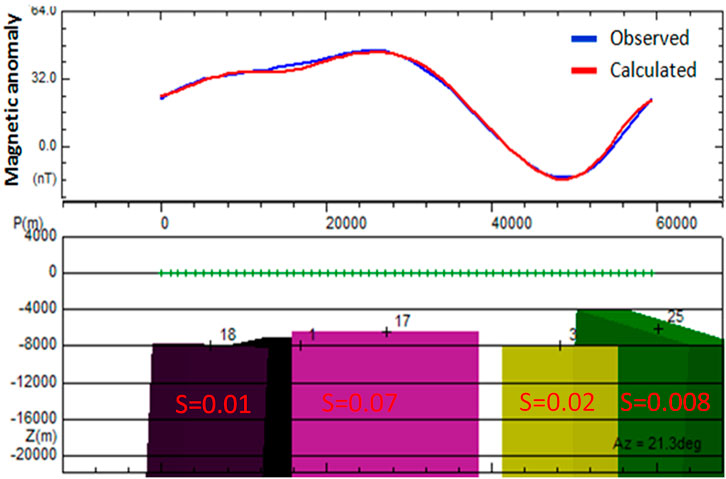
Figure 8. Three-dimensional magnetic model derived from data collected along profile 4,500, showing a detailed visualization of the subsurface magnetic properties.
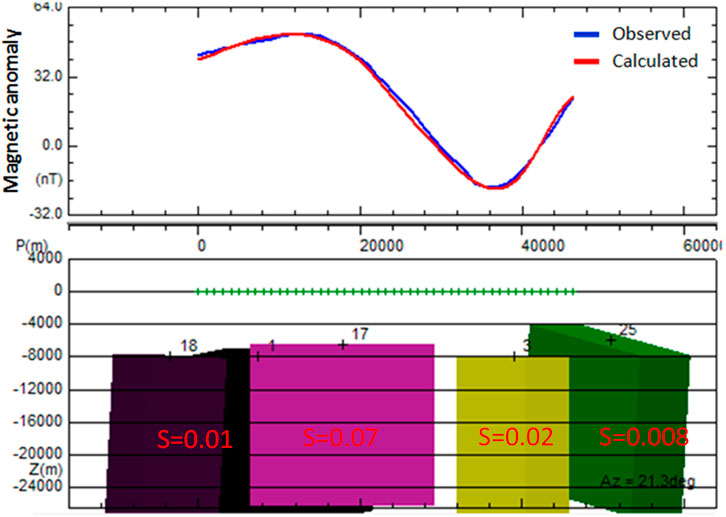
Figure 9. Three-dimensional magnetic model derived from data collected along profile 4,600, presenting a detailed visualization of the subsurface magnetic properties.
Figure 7 model (obtained from the profile of line 2,200) revealed that the magnetic high is caused by both lithological and structural variations. The anomaly response is dominated by magnetic high caused by the negative magnetic anomaly. The hanging wall block (body 4) (Figure 6) has a depth of 5,800 m beneath the sedimentary cover. The footwall crustal block (body 5) (Figure 6) is 9,000 m deep. Therefore, above this crustal block is a 9,000 m sedimentary fill, signifying about a 20 km lengthy graben structure that comprises core depocentres separated by intra-rift horsts. The subsidence block displays anisotropic susceptibilities, perhaps due to the prevalence of normal faults and widespread local fractures. Generally, it was observed that the geologic bodies of the models are characterized by remanent magnetization and anisotropic susceptibilities.
However, models of profile lines 3,300 (Figure 11) and 3,700 (Figure 12) clearly show intra-basement anomalous bodies affecting the overlaying sediments in a step-like pattern. The section of the trough with maximum thickness (∼9,000 m) is situated directly over the crustal block (body 9) (Figure 6), and the region is characterized by magnetic height due to its higher magnetic susceptibility. Interpretation of profile line 3,700 shows variations in composition between intra-basement blocks (1 and 19) (Figure 6). The neighboring basement block (body 2) (Figure 6) is about 10,000 m deep. The observed depocenter matches relatively well with the placement of the magnetic low at the northeast part of the study location. It is suggested to be an effective and perhaps the most progressive thermal hydrocarbon-producing site. From Figures 8, 9, the models show a block fault graben of about 12 km wide. This graben is the result of the subsidence of crustal block (body 3) and edged by two inter-connected horsts (body 17 and 25). The establishment of the horst and graben structure was activated by the faults in the area due to rifting. The slight horizontal offset between the crustal blocks (body 3 and 5) (Figure 6) shows that it is a strike-slip movement along the fault in most cases and that certain normal faults undergo strike-slip movement during the development of the basin. The interchanging pulsates of subsidence, uplift, tilting, or strike-slip motion may perhaps be accommodated by the steep faults obliged blocks. Therefore, the two models obtained from lines 2,200 and 4,500 (Figure 6) reveal the structural design of the basin and the displacement geometry caused by normal fault systems on the sedimentary series. The extensional tectonics have a direct influence on the sedimentation and structural relief of the basin. The noticed lithological contacts on Figures 10, 14 show midpoints of structural breaks and represent magnetic anomalies with the highest amplitude originating from mafic, and/or failed rift material. However, some magnetic signatures divulged low amplitude due to the thick sedimentary cover. The sediments on the intra-basement bodies are presumed to be magnetically neutral with insignificant alteration in the magnetic field reflecting a granitic or meta-sedimentary character (Saltus et al., 2006) and 5,100 in the residual magnetic field data.
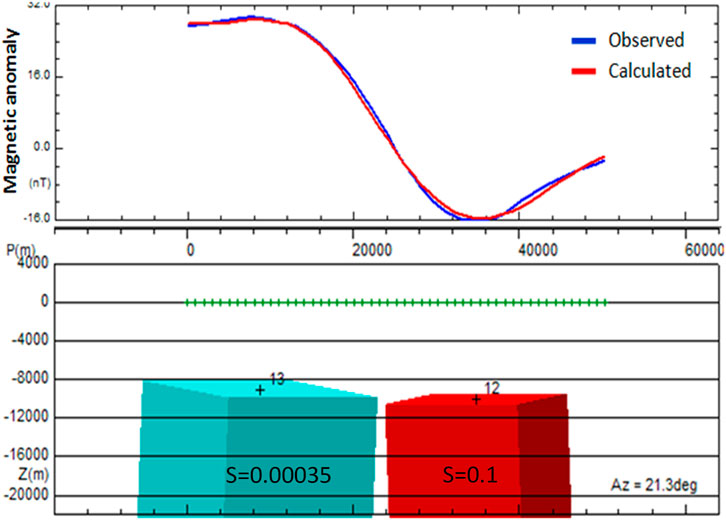
Figure 10. Three-dimensional magnetic model derived from data collected along profile 5,100, presenting a detailed visualization of the subsurface magnetic properties.
Figures 7, 8 obtained from profiles of lines 2,200 and 4,500 respectively, displayed the graben and horst structural elements of the study area. Furthermore, Figure 7 revealed magnetic high while Figures 9, 11 showed normal and strike-slip faults associated with the development of the basin with the sunk block (Figure 9) and overlaid with sediments of about 8,000 m.
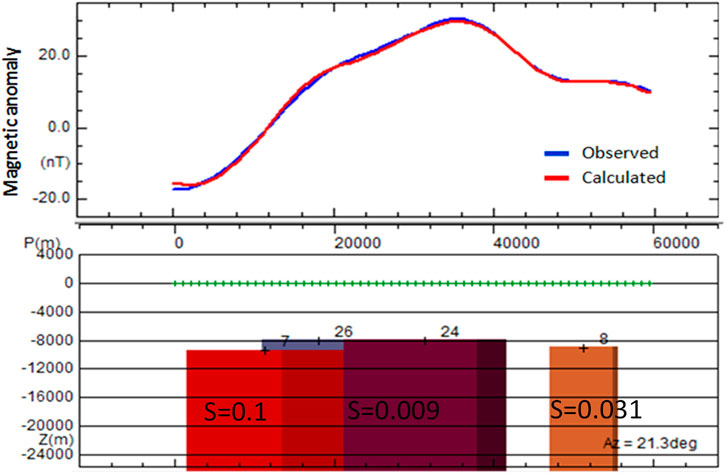
Figure 11. Three-dimensional magnetic model derived from data collected along profile 1,200, showing a detailed visualization of the subsurface magnetic properties.
Models of line 3,300 (Figure 12) and line 3,700 (Figure 13) detected step-like structures indicating abrupt disparities in magnetization and lithologic variations within the basement. Also, the models of Figure 14 (line 4,900) and 14 (line 5,100) identified intra-basement bodies with regions of lithologic breaks. The observed breaks/contacts within the basement are suspected to be the center of structural disturbances.
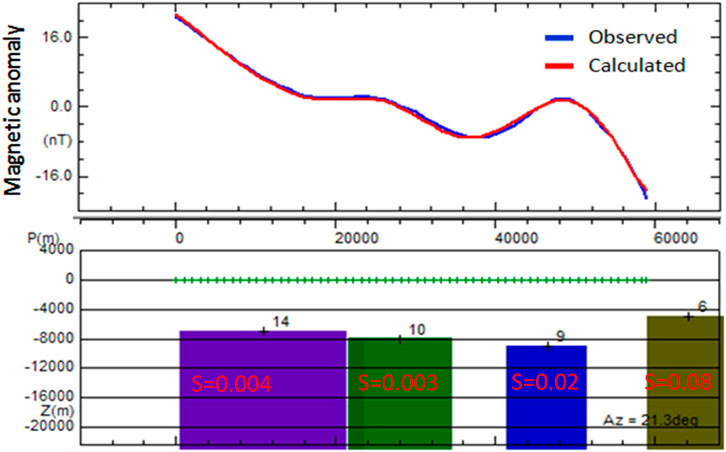
Figure 12. Three-dimensional magnetic model derived from data collected along profile 3,300, illustrating a detailed visualization of the subsurface magnetic properties.
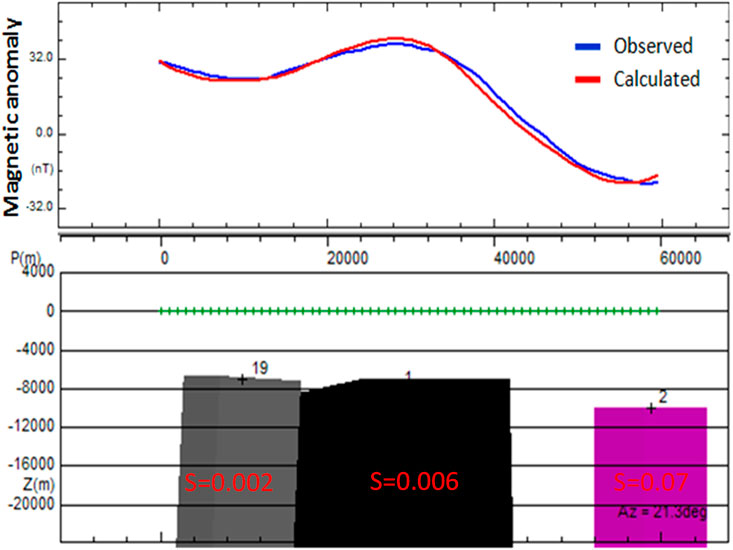
Figure 13. Three-dimensional magnetic model derived from data collected along profile 3,700, showing a detailed visualization of the subsurface magnetic properties.
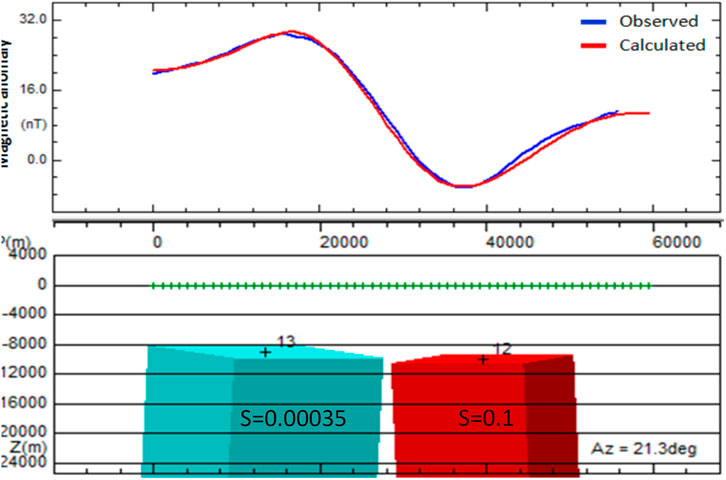
Figure 14. Three-dimensional magnetic model derived from data collected along profile 4,900, showing a detailed visualization of the subsurface magnetic properties.
5.3 Depth to basement map
To determine the spatial variations of depth to basement within the investigated area, the depth values from the 3D models were extracted and used to generate 2D map (Figure 15). Generally, it was noticed that depth values varied from about 4,000 to 10000 m indicating relatively thick depositional centers and the undulant pattern of the basement. Such results have been reported by some reconnaissance geoscience explorations in the southeastern parts of Nigeria (Ekwok et al., 2021a; Ekwok et al., 2021b). An essential part of the regional geologic or hydrocarbon assessment process is a realistic comprehensive basement structural map. This map recognizes important structural trends, the location of noticeable structural prospects, and the site and shape of the depocentres (Alexander et al., 1998). Figure 15 shows the division of the investigated area (along strike) into distinct sub-basins separated by horst structures. Each mini-basin corresponds to separate rift sections, and the horsts match closely with the accommodation zones.
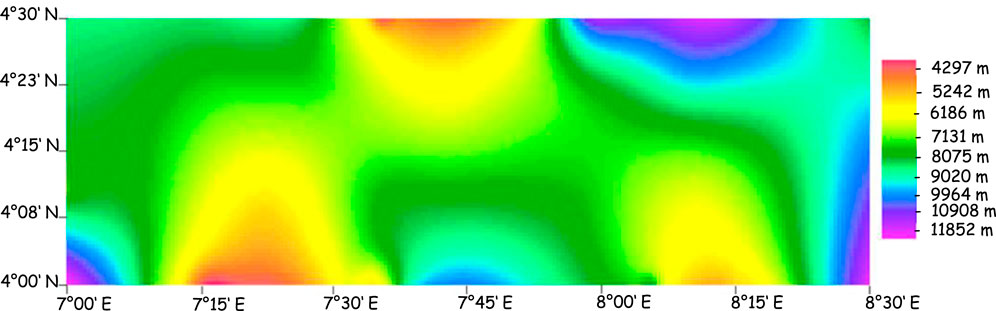
Figure 15. Depth to basement map obtained from the 3D models of the study area.
6 Discussion
Regional magnetic data analyses from the study location indicate that the crustal configuration can be divulged carefully with ease (Okiwelu et al., 2014). The wavelength filtering of the residual magnetic data revealed lineaments that trend in NE - SW, N - S, and E - W directions which coincide with the regional geologic trend (Ekwok et al., 2022a, Ekwok et al., 2022b; Saleh, 2012). The lineaments represent borders of the crustal blocks, gradient zones/faults, and lithological contacts (Alexander et al., 1998; Saleh, 2012). The geometries of the gradients along the edges of the magnetic sources indicate plutons that developed alongside geologic structures that are related to the South-Atlantic faults (Ekwok et al., 2022a). Furthermore, these lineaments boundaries of crustal blocks are affected by the deposition of sediments in the area. The configuration of deformations and structural patterns of the crust with influence on the sedimentary sequence (Ross and Eaton, 1999; Crafford and Grauch, 2002; Evarmy et al., 1978), were mapped. Direct information on the structural texture of the crust underneath the area and some previously undetected magnetic lineaments were divulged from the enhanced results. For instance, the first-degree polynomial filtered map shows the repeated horst and graben structures that trend N-S direction. The 3-D models revealed the faulted crustal blocks, gradient zones, and intra-basement compositional changes. The high magnetic anomalies inferred from this 3-D magnetic modeling are mostly initiated by the upper crustal structures. Specifically, the high magnetic anomalies are associated with disparities in basement relief near the surface resulting from block faulting (Bird, 1997; Crafford and Grauch, 2002; Evarmy et al., 1978). Overall, the spatial depth variations in the area are in the range of 4,000–10,000 m. Similar results have been reported in the southeastern flank of Nigeria’s Cretaceous sediments (Ekwok et al., 2021a; Ekwok et al., 2021b; Ekwok et al., 2019). Other studies estimated the crustal thicknesses in the range of 14 km–19 km (Bird, 1997; Ali et al., 2012; Evarmy et al., 1978). Again, this study indicates a favorable match in both location and trend between the major basement troughs and the main depo-centers dominated by Tertiary sediments. The positive correlation reveals that the overlying sediments have been influenced by the basement configuration and the tectonics.
In general, the results of this investigation revealed that the sub-basins are well delineated, and the overall deltaic wedge and related down faulting in the crust, especially at the initial phases of development of the delta are noticeable. This shows that exploration programs have moved from seismic methods to the use of non-seismic exploration methods for regional and prospect-level quantification before drilling (Ross and Eaton, 1999; Ali et al., 2012; Okiwelu et al., 2014). The structure of the depocentres seems to reveal the tectonic orientations (N-S, E-W, and NE-SW) in the area (Ross and Eaton, 1999; Crafford and Grauch, 2002; Okiwelu and Ude, 2012; Okiwelu et al., 2013). The NE - SW basement orientation appears to show probable extensions of the Chain and Charcot fracture zones (Ekwok et al., 2023; Ekwok et al., 2023; Ekwok et al., 2019). Thus, the knowledge of the regional structures of the concealed basement is essential to basin exploration methodology, and this can be applied to other basins all over the world (Okiwelu et al., 2014; Crafford and Grauch, 2002). The principles and techniques developed for investigating the concealed basement across various geological basins, as outlined by Leonov et al. (2020), are fundamental in understanding the complex subsurface structures. These methods are specifically tailored to uncover the hidden geological features that lie beneath the surface, providing critical insights into the formation and evolution of these basins. Although geological basins may differ in their specific characteristics, many of them share common tectonic settings and evolutionary histories. This commonality allows for the transfer and adaptation of knowledge, methodologies, and techniques across different basins, as noted by Leonov et al. (2020). By applying these universally relevant approaches, geoscientists can effectively analyze and interpret the concealed basement in diverse geological contexts, facilitating a more comprehensive understanding of basin evolution and resource potential. Hence, proper basin analyses involving the 3D models give valuable information on the tectonic history, structural traps, and potential hydrocarbon corridors (Ali et al., 2012; Okiwelu et al., 2014; Okiwelu and Ude, 2012; Okiwelu et al., 2013).
7 Conclusion
Regional magnetic data were applied to study the crustal blocks, map sediment thickness, and delineate geologic structural configuration and orientation in the southeastern flank of the study location. Firsthand information on the structural texture of the crust underneath the region and some previously undetected lineaments were also divulged from the first-degree polynomial filtered map. The major geologic structures and the related horsts and grabens are oriented in the North-South direction. These horst and graben structures were triggered by the fault in the region due to rifting. The brittle faults typically extend into the overlying sediments where their impacts are shown as surface lineation which can serve as targets in hydrocarbon investigation. The 3-D magnetic models divulged the faulted crustal blocks, gradient zones, and intra-basement compositional changes. Generally, it was observed that the high magnetic anomalies are linked to disparities in basement relief. The crustal thickness is estimated to be approximately between 14 km and 19 km and the depth to basement results revealed that the sedimentary thicknesses of the area vary from ∼4,000 to ∼10,000 m. The depth results show a favorable connection in both position and trend between the major basement troughs and the main Tertiary depocentres. The positive correlation indicates that the sedimentary sequence has been influenced by the underlying structural pattern and the tectonics of the crust. The structure of the depocentres seems to reveal an interaction of the tectonic orientations in the delta. The results of this work show that the sub-basins are characterized by sufficient sediments favorable for further exploration interest.
Data availability statement
The raw data supporting the conclusions of this article will be made available by the authors, without undue reservation.
Author contributions
OE: Conceptualization, Data curation, Supervision, Visualization, Writing–original draft. Anthony AO: Data curation, Software, Writing–original draft. SE: Formal Analysis, Investigation, Methodology, Writing–review and editing. KA: Resources, Validation, Writing–original draft. HA: Funding acquisition, Investigation, Writing–original draft. UB: Formal Analysis, Writing–original draft. AI: Formal Analysis, Investigation, Writing–original draft. CA: Investigation, Methodology, Writing–original draft. PA: Validation, Writing–review and editing. SU: Data curation, Investigation, Validation, Writing–original draft. AE: Conceptualization, Formal Analysis, Methodology, Supervision, Writing–review and editing.
Funding
The author(s) declare financial support was received for the research, authorship, and/or publication of this article. This research was supported by Researchers Supporting Project number (RSP-2024R425), King Saud University, Riyadh, Saudi Arabia.
Conflict of interest
The authors declare that the research was conducted in the absence of any commercial or financial relationships that could be construed as a potential conflict of interest.
Publisher’s note
All claims expressed in this article are solely those of the authors and do not necessarily represent those of their affiliated organizations, or those of the publisher, the editors and the reviewers. Any product that may be evaluated in this article, or claim that may be made by its manufacturer, is not guaranteed or endorsed by the publisher.
References
Abdelrahman, K., El-Qassas, R. A. Y., Fnais, M. S., Andráš, P., and Eldosouky, A. M. (2023a). Geological structures controlling Au/Ba mineralization from aeromagnetic data: harrat ad danun area, Saudi Arabia. Minerals 13, 866. doi:10.3390/min13070866
Abdelrahman, K., Ekwok, S. E., Ulem, C. A., Eldosouky, A. M., Al-Otaibi, N., Hazaea, B. Y., et al. (2023b). Exploratory mapping of the geothermal anomalies in the neoproterozoic arabian shield, Saudi Arabia, using magnetic data. Minerals 13 (5), 694. doi:10.3390/min13050694
Agocs, W. B. (2005). Least-squares residual anomaly determination. Geophysics 16, 686–696. doi:10.1190/1.1437720
Alexander, M., Pratsch, J. C., and Prieto, C., 1998. Under the northern Gulf basin: basement depths and trends. Abstract of paper presented at the 1998 SEG 68 annual meeting, New Oleans, LA.
Alfaifi, H. J., Ekwok, S. E., Ulem, C. A., Eldosouky, A. M., Qaysi, S., Andráš, P., et al. (2023). Exploratory assessment of geothermal resources in some parts of the Middle Benue Trough of Nigeria using airborne potential field data. J. King Saud University. Science 35 (2), 102521. doi:10.1016/j.jksus.2022.102521
Ali, I., Olatunji, S., Nwankwo, L. I., Akoshile, C. O., Johnson, L. M., and Edino, F. (2012). Geomagnetic modeling of potential hydrocarbon traps in the Lower Niger Delta offshore West Africa. Archives Appl. Sci. Res. 4 (2), 863–874.
Anand, S. P., and Rajaram, M. (2004). Crustal structure of narmada-son lineament; an aeromagnetic perspective. Indian institute of geomagnetism, Navi Mumbai, India.
Babalola, O. O. (1981) Structure of the continental and marginal basement complex of southwestern Nigeria from geophysical interpretation and a pre-drift structural fit of southern Nigeria and northeastern Brazil: geol. Survey of Nigeria geophysics paper, national symp. IGCP Project 108/144.
Babalola, O. O., and Gipson, M. (1991). Aeromagnetic anomalies and discordant lineations beneath the Niger Delta: implication for new fracture zones and multiple sea-floor spreading directions in the “meso-Atlantic” Gulf of Guinea cul-de-sac. Gulf Cul-De-SAC 18 (6), 1107–1110. doi:10.1029/91GL01236
Ben, U. C., Ekwok, S. E., Akpan, A. E., Mbonu, C. C., Eldosouky, A. M., Abdelrahman, K., et al. (2022). Interpretation of magnetic anomalies by simple geometrical structures using the manta-ray foraging optimization. Front. Earth Sci. 10, 849079. doi:10.3389/feart.2022.849079
Ben, U. C., Mbonu, C. C., Thompson, C. E., Ekwok, S. E., Akpan, A. E., Akpabio, I., et al. (2023). Investigating the applicability of the social spider optimization for the inversion of magnetic anomalies caused by dykes. J. King Saud University-Science 35 (3), 102569. doi:10.1016/j.jksus.2023.102569
Bencharef, M. H., Eldosouky, A. M., Zamzam, S., and Boubaya, D. (2022). Polymetallic Mineralization prospectivity modelling using multi-geospatial data in Logistic regression: the Diapiric Zone, Northeastern Algeria. Geocarto Int. 37, 15392–15427. doi:10.1080/10106049.2022.2097481
Bhashara, D. R., and Annapurna, T. (2015). Crustal structure from gravity and magnetic anomalies in the southern part of the cauvery basin, India. J. Sci. Eng. Appl. 4, 238–243. ISSN-2319-7560. doi:10.7753/ijsea0405.1001
Bird, D. E. (1997). Primer: interpreting magnetic data. Am. Assoc. Petroleum Geol. Explor. 8 (5), 18–21.
Blakely, R. I. (1996). Potential theory in gravity and magnetic applications. 2nd ed. (Cambidge: Cambridge University press). doi:10.10.1017/CBO9780511549816
Briggs, S. E., Cartwright, J., and Davies, R. J. (2009). Crustal structure of the deep water west Niger Delta passive margin from the interpretation of seismic reflection data. Mar. Petroleum Geol. 26, 936–950. doi:10.1016/j.marpetgeo.2008.07.003
Brimich, L., Khalil, A., Kordik, P., Mekkewi, M., EL-Bohoty, M., Refai, M. K., et al. (2011). Active subsurface structures at Fayoum- Cairo district, Northern Western Desert Egypt, as deduced from magnetic data. Contributions Geophys. Geodesy 41 (4), 329–351.
Brown, D. L., and Brown, D. L. (1987). Wrench-style deformation and paleostructural influence on sedimentation in and around a cratonic basin. Rocky Mountain Association of Geologists Symposium, 58–70.
Connors, C. D., Radovich, B., Danforth, A., and Venkatraman, S. (2009). Structure of the offshore Niger delta. Universidad de Oviedo, 29, 182–188.
Corredor, F., Shaw, J. H., and Bilotti, F. (2005). Structural Styles in the deep-water fold and thrust belts of the Niger Delta. AAPG Bull. 89, 753–780. doi:10.1306/02170504074
Crafford, A. E. J., and Grauch, V. J. S. (2002). Geologic and geophysical evidence for the influence of deep crustal structures on Paleozoic tectonics and the alignment of world-class gold deposits, north-central Nevada, USA. Nevada, USA, Ore geologic reviews 21, 157–184. doi:10.1016/s0169-1368(02)00088-4
Dong, Z., Li, X., Yamaguchi, H., and Yu, P. (2024). Magnetic field effect on the sedimentation process of two non-magnetic particles inside a ferrofluid. J. Magnetism. Magnetic. Mater. 589, 171501. doi:10.1016/j.jmmm.2023.171501
Doust, H., and Omatsola, E. (1990). Niger Delta in divergent/passive margin basins. Editor J. D. Edwards, and P. A. Santogrossied (Tulsa, Oklahoma: American Association Petroleum Geologist) 48, 201–238.
Ekweozor, C. M., and Okoye, N. V. (1980). Petroleum source bed evaluation of Tertiary Niger Delta. Bull. Am. Assoc. Petroleum. Geol. 64, 1251–1258.
Ekwok, S. E., Achadu, O.-I. M., Akpan, A. E., Eldosouky, A. M., Ufuafuonye, C. H., Abdelrahman, K., et al. (2022c). Depth estimation of sedimentary sections and basement rocks in the Bornu basin, Northeast Nigeria using high-resolution airborne magnetic data. Minerals 12, 285. doi:10.3390/min12030285
Ekwok, S. E., Akpan, A. E., Achadu, O.-I. M., Thompson, C. E., Eldosouky, A. M., Abdelrahman, K., et al. (2022d). Towards understanding the source of brine mineralization in Southeast Nigeria: evidence from high-resolution airborne magnetic and gravity data. Minerals 12, 146. doi:10.3390/min12020146
Ekwok, S. E., Akpan, A. E., Achadu, O. I. M., and Ulem, C. A. (2022e). Implications of tectonic anomalies from potential field data in some parts of Southeast Nigeria. Environ. Earth Sci. 81, 6. doi:10.1007/s12665-021-10060-7
Ekwok, S. E., Akpan, A. E., and Ebong, D. E. (2019). Enhancement and modelling of aeromagnetic data of some inland basins, southeastern Nigeria. J. Afr. Earth Sci. 155, 43–53. doi:10.1016/j.jafrearsci.2019.02.030
Ekwok, S. E., Akpan, A. E., and Ebong, E. D. (2021a). Assessment of crustal structures by gravity and magnetic methods in the Calabar Flank and adjoining areas of Southeastern Nigeria a case study. Arabian J. Geosciences 14 (4), 308–310. doi:10.1007/s12517-021-06696-1
Ekwok, S. E., Akpan, A. E., Ebong, E. D., and Eze, O. E. (2021b). Assessment of depth to magnetic sources using high resolution aeromagnetic data of some parts of the Lower Benue Trough and adjoining areas, Southeast Nigeria. Adv. Space Res. 67 (7), 2104–2119. doi:10.1016/j.asr.2021.01.007
Ekwok, S. E., Eldosouky, A. M., Achadu, O. I. M., Akpan, A. E., Pham, L. T., Abdelrahman, K., et al. (2022a). Application of the enhanced horizontal gradient amplitude (EHGA) filter in mapping of geological structures involving magnetic data in Southeast Nigeria. J. King Saud University-Science 34 (8), 102288. doi:10.1016/j.jksus.2022.102288
Ekwok, S. E., Eldosouky, A. M., Ben, U. C., Achadu, O. I. M., Akpan, A. E., Othman, A., et al. (2023a). An integrated approach of advanced methods for mapping geologic structures and sedimentary thickness in Ukelle and adjoining region (Southeast Nigeria). Earth Sci. Res. J. 27 (3), v251–v258. doi:10.15446/esrj.v27n3.105868
Ekwok, S. E., Eldosouky, A. M., Ben, U. C., Alzahrani, H., Abdelrahman, K., Achadu, O. I. M., et al. (2022b). Application of high-precision filters on airborne magnetic data: a case study of the ogoja region, southeast Nigeria. Minerals 12 (10), 1227. doi:10.3390/min12101227
Ekwok, S. E., Eldosouky, A. M., Essa, K. S., George, A. M., Abdelrahman, K., Fnais, M. S., et al. (2023b). Particle swarm optimization (PSO) of high-quality magnetic data of the obudu basement complex, Nigeria. Minerals 13 (9), 1209. doi:10.3390/min13091209
Ekwok, S. E., Eldosuoky, A. M., Thompson, E. A., Ojong, R. A., George, A. M., Alarifi, S. S., et al. (2024b). Mapping of geological structures and sediment thickness from analysis of aeromagnetic data over the Obudu Basement Complex of Nigeria. J. Geophys. Eng. 21 (2), 413–425. doi:10.1093/jge/gxae012
Ekwok, S. E., George, A. M., Omori, A. A., Abdelrahman, K., Ugar, S. I., Andráš, P., et al. (2024a). Unveiling the mineral resources and structural patterns in the Middle Benue Trough: a comprehensive exploration using airborne magnetic and radiometric data. Geocarto Int. 39 (1), 1–23. doi:10.1080/10106049.2024.2339290
Eldosouky, A. M., Ekwok, S. E., Akpan, A. E., Achadu, O. I. M., Pham, L. T., Abdelrahman, K., et al. (2022a). Delineation of structural lineaments of Southeast Nigeria using high resolution aeromagnetic data. Open Geosci. 14 (1), 331–340. doi:10.1515/geo-2022-0360
Eldosouky, A. M., Elkhateeb, S. O., Mahdy, A. M., Saad, A. A., Fnais, M. S., Abdelrahman, K., et al. (2022c). Structural analysis and basement topography of Gabal Shilman area, South Eastern Desert of Egypt, using aeromagnetic data. J. King Saud Univ. -Science 34 (2), 1018–3647. doi:10.1016/j.jksus.2021.101764
Eldosouky, A. M., Othman, A., Saada, S. A., and Zamzam, S. (2024). A new vector for mapping gold mineralization potential and proposed pathways in highly weathered basement rocks using multispectral, radar, and magnetic data in random forest algorithm. Nat. Resour. Res. 33, 23–50. doi:10.1007/s11053-023-10292-3
Eldosouky, A. M., Pham, L. T., Abdelrahman, K., Fnais, M. S., and Gomez-Ortiz, D. (2022d). Mapping structural features of the Wadi Umm Dulfah area using aeromagnetic data. J. King Saud University-Science 34 (2), 1018–3647. doi:10.1016/j.jksus.2021.101803
Eldosouky, A. M., Pham, L. T., Duong, V.-H., Ghomsi, F. E. K., and Henaish, A. (2022b). Structural interpretation of potential field data using the enhancement techniques: a case study. Geocarto Int. 37, 16900–16925. doi:10.1080/10106049.2022.2120548
Elkhateeb, S. O., Eldosouky, A. M., Khalifa, M. O., and Aboalhassan, M. (2021). Probability of mineral occurrence in the Southeast of Aswan area, Egypt, from the analysis of aeromagnetic data. Arab. J. Geosci. 14, 1514. doi:10.1007/s12517-021-07997-1
Evarmy, D. D., Harrembroure, J., Kammerling, P., Knoap, W. A., Molloy, F. A., and Rowlands, P. H. (1978). Hydrocarbon habitat of tertiary Niger delta. Bull Am. Assoc. Petroleum Geol. 62 (1), 1–39. doi:10.1306/c1ea47ed-16c9-11d7-8645000102c1865d
Glen, J. M. G., Schmidt, J., Pellerin, L., McPhee, D. K., and O’Neill, J. M. (2007). Crustal structure of Wrangellia and adjacent terranes inferred from geophysical studies along a transect through the northern Talkeetna. Geol. Soc. Am. Special Pap. 431, 21–41.
Guun, P. J. (1997). Application of aeromagnetic survey to sedimentary basin studies. AGSO J. Aust. Geol. Geophys. 17, 133–144.
Haack, R. C., Sundararaman, P., Diedjomahor, J. O., Xiao, H., Grant, N. J., May, E. D., et al. (2000). Niger delta petroleum systems, Nigeria. Petroleum systems of South Atlantic margins. Editors M. R. Mello, and B. J. Katz (AAPG Memoir), 73, 213–231. doi:10.1306/m73705c16
He, M. Y., Dong, J. B., Jin, Z., Liu, C. Y., Xiao, J., Zhang, F., et al. (2021). Pedogenic processes in loess-paleosol sediments: clues from Li isotopes of leachate in Luochuan loess. Geochimica Cosmochimica Acta 299, 151–162. doi:10.1016/j.gca.2021.02.021
Hiroyuki, K., Nobuhiro, I., Chan, H. P., Chang, H. K., and Masao, N. (2007). Characteristics of crustal structures in the Tsushima (Ulleung) and Japan Basin from vector magnetic anomalies. Earth Planets Space 59, 887–895.
Hospers, J. (1965). Gravity field and structure of the Niger delta, Nigeria, west Africa. Am. Assoc. Petroleum Geol. Bull. 76, 407–422. doi:10.1130/0016-7606(1965)76[407:gfasot]2.0.co;2
Jessell, M. (2001). Three-dimensional geological modelling of potential-field Data. Comput. and Geosciences 27, 455–465. doi:10.1016/s0098-3004(00)00142-4
Jiao, K., Han, D., Li, J., Bai, B., Gong, L., and Yu, B. (2021). A novel LBM-DEM based pore-scale thermal-hydro-mechanical model for the fracture propagation process. Comput. Geotechnics 139, 104418. doi:10.1016/j.compgeo.2021.104418
Jiao, S., Li, W., Li, Z., Gai, J., Zou, L., and Su, Y. (2024). Hybrid physics-machine learning models for predicting rate of penetration in the Halahatang oil field, Tarim Basin. Sci. Rep. 14 (1), 5957. doi:10.1038/s41598-024-56640-y
Kangkolo, R. (1996). A detailed interpretation of the aeromagnetic field over the mamfe basin of the Nigeria and Cameroon. (Zaria, Nigeria: Ahmadu Bello University), 64–66.
Kharbish, S., Eldosouky, A. M., and Amer, O. (2022). Integrating mineralogy, geochemistry and aeromagnetic data for detecting Fe–Ti ore deposits bearing layered mafic intrusion, Akab El-Negum, Eastern Desert, Egypt. Sci. Rep. 12, 15474. doi:10.1038/s41598-022-19760-x
Kilaru, S., Goud, B. K., and Rao, V. K. (2013). Crustal structure of the Western Indian Shield: model based on regional gravity and magnetic data. Geosci. Front. 4, 717–728. doi:10.1016/j.gsf.2013.02.006
Kulke, H. (1995). in Regional petroleum geology of the world Part II: Africa, America, Australia, and Antarctica, Berlin, gebruder. Editor H. Kulke (Nigeria: Borntraeger), 143–172.
Leonov, M. G., Morozov, Y. A., Przhiyalgovskii, E. S., Rybin, A. K., Bakeev, R. A., Lavrushina, E. V., et al. (2020). Tectonic evolution of the basement–sedimentary cover system and morhpostructural differentiation of sedimentary basins. Geotectonics 54, 147–172. doi:10.1134/s0016852120020089
Li, J., and Morozov, I. (2006) Aeromagnetic mapping of the Williston basin basement, CSPG-CSEG-CWLS Convention. 65–68.
Li, Y., and Oldenburg, D. W. (1998) Separation of regional and residual magnetic field data: geophysics, 63, 431–439.
Li, Z., Nie, L., Xue, Y., Li, Y., and Tao, Y. (2024). Experimental investigation of progressive failure characteristics and permeability evolution of limestone: implications for water inrush. Rock Mech. Rock Eng. 57, 4635–4652. doi:10.1007/s00603-024-03774-0
Liang, S., Zhao, Z., Li, C., Yin, Y., Li, H., and Zhou, J. (2024). Age and petrogenesis of ore–forming volcanic–subvolcanic rocks in the Yidonglinchang Au deposit, Lesser Xing’an Range: implications for late Mesozoic Au mineralization in NE China. Ore Geol. Rev. 165, 105875. doi:10.1016/j.oregeorev.2024.105875
Liu, Y., Yang, D., Li, Y., Cai, J., and Jiang, X. (2024). Nanoindentation study on microscopic mineral mechanics and bedding characteristics of continental shales. Energy. doi:10.2139/ssrn.4712842
Lyatsky, H. V., P, D. I., and Grobe, M. (2005). Basement structure in central and southern alberta: insights from gravity and magnetic maps. Alberta Energy and Utility Board/Alberta Gelogical Survey. (EUB/AGS) special report 72.
Mahdi, A. M., Eldosouky, A. M., El Khateeb, S. O., Youssef, A. M., and Saad, A. A. (2022). Integration of remote sensing and geophysical data for the extraction of hydrothermal alteration zones and lineaments; Gabal Shilman basement area, Southeastern Desert, Egypt. J. Afr. Earth Sci. 194, 1464–343X. doi:10.1016/j.jafrearsci.2022.104640
Meyer, Jr. J. F. (1998). The compilation and application of aeromagnetic data for hydrocarbon exploration in interior Alaska. Geologic applications of Gravity and Magnetic: case Histories. SEG geophysical reference No.8 and AAPG studies in geology. Editors I. Gibson, and P. S. Millegan, 43, 37–39.
Okiwelu, A. A., Obianwu, V. I., Eze, O. E., and Ude, I. (2014). Magnetic anomaly patterns, fault-block tectonism and hydrocarbon related structural features in the Niger Delta basin. IOSR Journal of Applied Geology and Geophysics 2 (1), 31–46. doi:10.9790/0990-02113146
Okiwelu, A. A., Ofrey-kulo, O., and Ude, I. A. (2013). Interpretation of regional magnetic field data offshore Niger delta reveals relationship between deep basement architecture and hydrocarbon target. Earth Sci. Res. 2 (1), 13. doi:10.5539/esr.v2n1p13
Okiwelu, A. A., and Ude, I. A. (2012). 3-D Modelling and basement tectonics of the Niger Delta basin from aeromagnetic data. Intech Open. Science. Open. Minds. doi:10.5772/48158
Oladele, S., and Ojo, S. B. (2013). Basement architecture in part of the Niger delta from aeromagnetic data and its implication for hydrocarbon prospectivity. Pac. J. Sci. Technol. 14 (2), 512–521.
Oldham, C. H. G., and Sutherland, D. B. (1955) Orthogonal polynomials and their use in estimating the regional effect: geophysics, 20, 295–306.
Paoletti, V., and Pinto, A. (2004). Aeromagnetic and radiometric data filtering at the vesuvian volcanic area. Boll. Geofis. Teor. Appl. 46, 245–259.
Peng, Y., Shichao, L. I., Laijun, L. U., Guangsheng, L. U., and Jun, W. U. (2009). Study on deep structure in Ailaoshan region based on aeromagnetic interpretations. Glob. Geol. 12 (4), 189–193.
Pham, L. T., Eldosouky, A. M., Melouah, O., Abdelrahman, K., Alzahrani, H., Oliveira, S. P., et al. (2021a). Mapping subsurface structural lineaments using the edge filters of gravity data. J. King Saud Univ. Sci. 33 (8), 1018–3647. doi:10.1016/j.jksus.2021.101594
Pham, L. T., Kafadar, O., Oksum, E., and Eldosouky, A. M. (2021b). An improved approach for detecting the locations of the maxima in interpreting potential field data. Arabian J. Geosciences 14, 43. doi:10.1007/s12517-020-06399-z
Quirk, D. G., and Kimbell, G. S. (1999) Crustal magnetic structure of the Irish sea region: evidence for a major basement boundary beneath the Isle of Man, 160. Geological Society, London, Special Publications, 227–238.
Readman, P. W., O’Reilly, B. M., Shannon, P. M., and Naylor, D. (2005). The deep structure of the porcupine basin, offshore Ireland from gravity and magnetic studies. Pet. Geol. Conf. Ser. 6, 1047–1056. doi:10.1144/0061047
Reijers, T. R. A. (1996). Selected chapters on geology, A case study of the Niger delta. Shell Pet. Dev. Co., 113–114.
Reijers, T. R. A. (2011). Stratigraphy and sedimentology of the Niger delta. Geologos 17 (3), 133–162. doi:10.2478/v10118-011-0008-3
Ross, G. M., and Eaton, D. W. (1999). Basement reactivation in the Alberta basin. Bull. Can. Petroleum Geol. 47 (4), 391–411.
Saada, A. S., Eldosouky, A. M., Abdelrahm, K., Al-Otaibi, N., Ibrahim, E., and Ibrahim, A. (2021). New insights into the contribution of gravity data for mapping the lithospheric architecture. J. King Saud University-Science 101400, 1018–3647. doi:10.1016/j.jksus.2021.101400
Saada, S. A., Eldosouky, A. M., Kamel, M., El Khadragy, A., Abdelrahman, K., Fnais, M. S., et al. (2022). Understanding the structural framework controlling the sedimentary basins from the integration of gravity and magnetic data: a case study from the east of the Qattara Depression area, Egypt. J. King Saud Univ. Sci. 34 (2), 1018–3647. doi:10.1016/j.jksus.2021.101808
Saleh, S. (2012). 3D crustal structure and its tectonic implication for Nile Delta and greater Cairo regions, Egypt, from Geophysical data. Acta Geod. Geophys. Hungrica 47 (4), 402–429. doi:10.1556/ageod.47.2012.4.3
Saltus, R. W., Potter, C. J., and Philips, J. D. (2006). Crustal insights from gravity and aeromagnetic analysis, central north slope, Alaska. AAPG Bull. 90 (10), 1495–1517. doi:10.1306/05090605066
Short, K. C., and Stäuble, A. J. (1965). Outline of geology of Niger delta. Am. Assoc. Petroleum Geol. Bull. 51, 761–779.
Skilbrei, J. R., Olesen, O., Osmundsen, P. T., Kihle, O., Aaro, S., and Fjellanger, E. (2002). A study of basement structures and onshore-offshore correlations in Central Norway. Nor. J. Geol. 82, 263–279.
Sun, X., Li, R., Si, X., Xiao, K., and Deng, J. (2024). Timing and mechanism of ore precipitation in porphyry Cu systems: insight from LA-ICP-MS analysis of fluid inclusions and in situ oxygen isotope analysis of hydrothermal quartz at zhunuo porphyry Cu deposit, China. Econ. Geol. 119 (3), 593–616. doi:10.5382/econgeo.5064
Tuttle, M. L. W., Charpentier, R. R., and Brownfield, M. E. (1999). The Niger Delta petroleum system: Niger Delta province, Nigeria, Cameroun and Equatorial Guinea. U. S. Geological Survey, Open-file Report-99-50-H, p 31.
Wang, Z., Zhou, H., Wang, X., and Jing, X. (2015). Characteristics of the crystalline basement beneath the Ordos Basin: constraint from aeromagnetic data. Geosci. Front. 6, 465–475. doi:10.1016/j.gsf.2014.02.004
Weber, K. J. (1987). Hydrocarbon distribution patterns in Nigerian growth fault Structures controlled by structural style and stratigraphy. J. Petroleum Sci. Eng. 1, 91–104. doi:10.1016/0920-4105(87)90001-5
Weber, K. J., and Daukoru, E. (1975). Petroleum geology of the Niger delta, (Tokyo: 9th World Petroleum Congress Proceedings) 2, 209–211.
Webring, M. W. (1981) MNIC: a gridding program based on minimum curvature. U. S. Geological Survey open file report, 81–1224.
Whiteman, A. (1982) Nigeria: its Petroleum geology, Resources and potential, 394. London: Graham and Trotman.
Zhao, Z., Zhao, X., Yin, Y., Li, C., Yang, Y., and Wang, Y. (2024). Identification of geochemical anomalies based on rpca and multifractal theory: a case study of the sidaowanzi area, chifeng, inner Mongolia. ACS omega 9, 24998–25013. doi:10.1021/acsomega.4c02078
Zhou, G., Xu, J., Hu, H., Liu, Z., Zhang, H., Xu, C., et al. (2023b). Off-axis four-reflection optical structure for lightweight single-band bathymetric LiDAR. IEEE Trans. Geoscience Remote Sens. 61, 1–17. doi:10.1109/tgrs.2023.3298531
Zhou, G., Zhang, H., Xu, C., Zhou, X., Liu, Z., Zhao, D., et al. (2023a). A real-time data acquisition system for single-band bathymetric LiDAR. IEEE Trans. Geoscience Remote Sens. 61, 1–21. doi:10.1109/tgrs.2023.3282624
Keywords: lineaments, crustal structure, intrusion, magnetic basement, magnetic anomalies, basin, faults
Citation: Eze OE, Okiwelu AA, Ekwok SE, Abdelrahman K, Alzahrani H, Ben UC, Ibrahim A, Akpa C, Andráš P, Ugar SI and Eldosouky AM (2024) Delineation of deep-seated crustal structures from magnetic data in the southeastern part of the Niger Delta basin, Nigeria. Front. Earth Sci. 12:1439199. doi: 10.3389/feart.2024.1439199
Received: 27 May 2024; Accepted: 19 August 2024;
Published: 28 August 2024.
Edited by:
Kade Keranen, Cornell University, United StatesReviewed by:
Luan Thanh Pham, VNU University of Science, VietnamÖzkan Kafadar, Kocaeli University, Türkiye
Copyright © 2024 Eze, Okiwelu, Ekwok, Abdelrahman, Alzahrani, Ben, Ibrahim, Akpa, Andráš, Ugar and Eldosouky. This is an open-access article distributed under the terms of the Creative Commons Attribution License (CC BY). The use, distribution or reproduction in other forums is permitted, provided the original author(s) and the copyright owner(s) are credited and that the original publication in this journal is cited, in accordance with accepted academic practice. No use, distribution or reproduction is permitted which does not comply with these terms.
*Correspondence: Ahmed M. Eldosouky, ZHJfYS5lbGRvc29reUB5YWhvby5jb20=, YWhtZWQuZWxkb3NvdWt5QHNjaS5zdWV6dW5pLmVkdS5lZw==
†ORCID: Ahmed M. Eldosouky, orcid.org/0000-0003-1928-9775