- 1The Faculty of Geosciences and Engineering, Southwest Jiaotong University, Chengdu, China
- 2Sichuan Province Engineering Technology Research Center of Ecological Mitigation of Geohazards in Tibet Plateau Transportation Corridors, Chengdu, China
- 3National Key Laboratory of Petroleum Resources and Engineering, China University of Petroleum, Beijing, China
- 4Sichuan Water Development Investigation, Design & Research Co., Ltd., Chengdu, China
As research in oil and gas exploration progresses, unconventional resources, such as shale gas, are increasingly becoming the focal point in the global pursuit of oil and gas resource. Shale gas reservoirs significantly differ from conventional sandstone reservoirs in aspects such as rock composition, pore type, occurrence mode, fluid, etc., thereby amplifying the challenges associated with geophysical modeling and the prediction of sweet spots. Since the formation and storage of shale gas are positively correlated with shale fracturing, a modeling approach based on Chapman theory is introduced to complete frequency-dependent petrophysical modeling. Additionally, the Frequency-dependent Amplitude Variation with Offset (FAVO) technique can estimate velocity dispersion by using the reflection coefficient information related to incidence angle and frequency. This method can more effectively identify fluids within shale reservoir. However, current FAVO forward modeling only considers the velocity dispersion and attenuation at the interface, neglecting the attenuation dispersion effects during interlayer propagation. To this end, we utilize Chapman-based petrophysical modeling as a foundation and conduct seismic forward modeling studies employing the compound matrix method. Through experimental analysis, we meticulously examine the attenuation dispersion effects at interfaces and within layers. Finally, we conduct FAVO simulations that vividly delineate the interplay between reservoir parameters and seismic responses.
1 Introduction
Currently, the shortage of oil and gas resources has become a universal challenge faced by countries worldwide, leading to an increased focus on the development of unconventional oil and gas resources. Shale gas, as a typical unconventional oil and gas resource, is an important natural gas resource, accounting for about 50% of unconventional natural gas resources. It possesses immense exploration potential and utilization value (Zhen et al., 2013; Hou et al., 2023). Accurate petrophysical modeling of shale gas reservoir is an important step for seismic exploration of shale gas. The equivalent theoretical model is an important tool for petrophysical research, which idealizes shale gas reservoir through certain assumptions, so as to establish the relationship between seismic response and the properties of shale gas reservoir. In shale gas reservoirs, the pore and crack system is the main storage and transportation channel for gas. Almost all oil and gas reservoirs are affected by natural cracks, which constitute one of the most significant factors affecting the capacity of unconventional shale gas reservoirs. Meanwhile, the presence of cracks complicates the physical properties of shale gas reservoirs, which are highly variable and show strong anisotropy in both vertical and horizontal directions. The traditional anisotropic equivalent medium theory for crack does not consider the effect of frequency on the elastic parameters of the model, leading to insensitivity of crack scale in such models (Hudson, 1980; Schoenberg, 1980; Hudson, 1981). For example, a few large horizontally arranged cracks developed in a homogeneous isotropic media can be equivalently represented by a larger number of small horizontally arranged cracks in the same medium. Subsequently, some scholars proposed an equivalent model based on the mechanism of attenuation and velocity dispersion produced by extrusion injection from small pores to large pores - the squirt-flow mechanism (i.e., fluid flow induced by seismic waves) (Dvorkin et al., 1995; Thomsen, 1995; Hudson et al., 1996; Pointer et al., 2000; Van Der Kolk et al., 2001; Ba et al., 2017; Zhang et al., 2021). However, these models cannot explain the frequency-dependent characteristics of seismic anisotropy across the full frequency range. Chapman, 2003; Chapman et al., 2006; Chapman et al., 2002) subsequently propose a dynamic equivalent petrophysical model, which incorporates the pore elasticity theory of particle squirt flows and combines a set of oriented mesoscopic cracks. The results show that the model can accurately predict attenuation and seismic dispersion effects within seismic frequency bands (Maultzsch et al., 2003; Liu et al., 2014). Therefore, the petrophysical model of shale gas reservoirs established based on Chapman theory effectively establishes the relationship between physical and seismic characteristics, providing a crucial foundation for the description and identification of shale gas reservoirs.
Reliable petrophysical models can serve frequency-dependent Amplitude Variation with Offset (FAVO) studies. FAVO technology is an organic combination of conventional AVO and frequency-dependent fluid identification techniques. It can make full use of the reflection coefficient’s variation with incidence angle and frequency to estimate the amplitude attenuation and velocity dispersion characteristics of the reservoir within the seismic frequency band. Subsequently, combining these features with the physical mechanisms of attenuation dispersion can yield accurate petrophysical properties of the reservoir. Therefore, FAVO technology has become an important means to identify reservoir fluids (Wu, 2010; Cheng et al., 2012). In particular, the realization of accurate forward simulation of FAVO can more accurately establish the relationship between shale gas reservoir parameters and seismic response, which is essential for the identification of shale gas. In the study of FAVO, Zoeppritz (1919) gives a formula for calculating the reflection coefficient and transmission coefficients at an interface when a P-wave is incident, known as the “Zoeppritz equation”. Many scholars have performed linear approximations of the Zoeppritz equation to reduce the computational complexity at the cost of accuracy (Bortfeld, 1961; Shuey, 1985; Smith and Gidlow, 1987; Hilterman, 1990). To ensure the accuracy of the results, many scholars have refined the Zoeppritz equation. Although these theories have succeeded in reducing computational complexity and improving the accuracy of the results, they typically only consider the influence of single interface conditions. It is shown that when the reservoir possesses a certain thickness, the interlayer effect can affect AVO characteristics, and its influence on the AVO response cannot be ignored. Therefore, building on this foundation, a large number of scholars have carried out studies based on full-wavefield forward modeling. Carcione et al., 2003 simulate the wave field in a patchy-saturated medium base on the finite-difference algorithm, wherein the elastic parameters were replaced with their corresponding complex elastic parameters. Moreover, they calculated and analyzed the seismic response corresponding to attenuation and velocity dispersion (Carcione et al., 2003; Wang et al., 2006). This wavefield numerical simulation method, while highly accurate, incurs extremely high computational costs. Utilizing a viscoelastic medium model to characterize the viscoelastic properties of fractured porous media can effectively reduce these computational costs, thereby enabling the simulation of seismic responses through wavefield modeling. Sidler et al. (2013) compare the seismic records formed by equivalent viscoelastic theory and pore theory, demonstrating that both have the same dispersion and attenuation characteristics. This method weakens the understanding of the physical mechanism involved in wavefield simulation. In contrast, obtaining the complex elastic parameters of a porous fractured medium through its physical attenuation mechanism is considered the most appropriate approach. Then, the viscoelastic wave equation is solved analytically to accurately obtain the corresponding seismic response while reducing the complexity of numerical simulation. Ren et al. (2009a, b) derive a formula for the frequently-dependent reflection coefficient at the interface between an elastic medium and a viscoelastic medium under conditions of vertical incidence. Liu et al. derive the frequency-varying reflection coefficient at the interface between non-dispersive and dispersive media under conditions of non-vertical incidence, based on the “Zoeppritz” equation (Liu et al., 2011). Zhao et al. (2014) provide a formula for the frequency-dependent reflection coefficient of scattered viscoelastic media. Guo et al. (2015) combine the rock physical model with seismic modeling and obtain the expression for the reflection coefficient based on propagation matrix theory. All the above studies are based on the assumption that the overlying layer is elastic, that is, only the attenuation and velocity dispersion effects of seismic waves at the interface are considered, while these effects between layers are not considered. Besides, there are some limitations to the propagation matrix theory in wavefield forward simulation. The method requires solving for the eigenvalues of the characteristic polynomials corresponding to the system matrix R when calculating the reflection coefficients for the comprehensive response of layered medium using the conventional matrix algorithm. In order to stabilize the final solution process, matrix product operations are required. It has been proved that as frequency increases, the matrix components gradually increase, leading to the loss of the effective value of the characteristic function. This leads to difficulties in obtaining accurate eigenvalues. And at greater depths, the eigenfunctions similarly lose important values under conditions of suitable frequency values. Due to the serious numerical ill-posed of analytic solutions of the propagation matrix algorithm, three suitable solution methods have been derived (Sen and Roy, 2003), including recursive matrix algorithm (Kennett, 2009), compound matrix algorithm (Schmidt and Tango, 1986) and global large matrix algorithm (Phinney et al., 1987). The compound matrix algorithm is based on the compound rearrangement of the original propagation matrix solution system. The 4×4 matrices involved in the calculation are analytically rearranged into 6×6 matrices, and the analytical solution of the reflection coefficient is quickly obtained through a simple vectorization loop. The compound matrix algorithm is a generalized reflectivity method that is widely used in seismic exploration. Compared with the other two methods, it consumes less memory, runs faster, and has a simpler program implementation when the medium is isotropic. Therefore, it is a reasonable attempt to extend the compound matrix method to viscoelastic medium for wavefield forward modeling.
The principal contribution of this paper lies in constructing a model that precisely encapsulates the relationship between shale reservoir parameters and seismic response by integrating Chapman theory with the compound matrix method. The Chapman model is employed as an equivalent petrophysical model to investigate FAVO effects within shale gas reservoirs. Subsequently, the complex elasticity parameter (i.e., complex velocity) is utilized as input for wavefield forward modeling, thereby facilitating the simulation of seismic responses. The method takes into account the comprehensive propagation response, including attenuation dispersion effects, transmission losses, and converted waves at interfaces and between layers, thus more accurately simulating the seismic response of shale gas reservoirs. Considering the influence of propagation process, we re-establish the relationship between reservoir parameters, such as crack density, porosity, gas saturation, and crack aspect ratio and seismic response. Based the established model, we conduct a thorough analysis of the sensitivity of seismic response to the petrophysical parameters of shale gas reservoirs, thereby providing a foundation for the characterization and assessment of these reservoirs.
2 Methods
To accurately perform FAVO forward modeling of shale reservoir, we derive the relationship between a series of shale reservoir parameters and seismic response. We construct a petrophysical model of shale reservoir based on Chapman theory and use it as a bridge to establish the relationship between elastic parameters and FAVO response using the viscoelastic compound matrix algorithm.
2.1 Petrophysical modeling of shale reservoir based on chapman theory
Cracks are important for shale gas resource development and storage. Incorporating the physical properties of crack into the petrophysical modeling of shale gas reservoirs remains a key focus and challenge in current research. Chapman et al. 2002; Chapman et al. 2003 propose a micro-structure squirt flow theoretical model, which is consistent with Gassmann theory at low frequencies and squirt flow-related dispersion at high frequencies. Based on the squirt flow fluid model, an equivalent petrophysical model that considers mesoscale cracks, microscale pores and cracks is proposed. By inserting directional elliptic cracks and spherical pores into the isotropic medium, it is proved that the influence of micro-cracks is negligible. Therefore, only mesoscale and micro-scale cracks are considered, where the pores are interconnected, but the cracks are not, meaning one crack can be connected to multiple pores. Petrophysical modeling of shale reservoir using this model can take into account both mesoscale and microscopic scale fluid flows, providing a reasonable explanation of attenuation and velocity dispersion effects within seismic frequency bands. In order to accurately describe the equivalent model of shale reservoir, a series of parameters such as crack density, porosity, crack aspect ratio, fluid saturation, and time scale of shale reservoirs are needed. A schematic diagram of a multiscale model of a fracture-bearing porous medium for petrophysical modeling is shown in Figure 1.
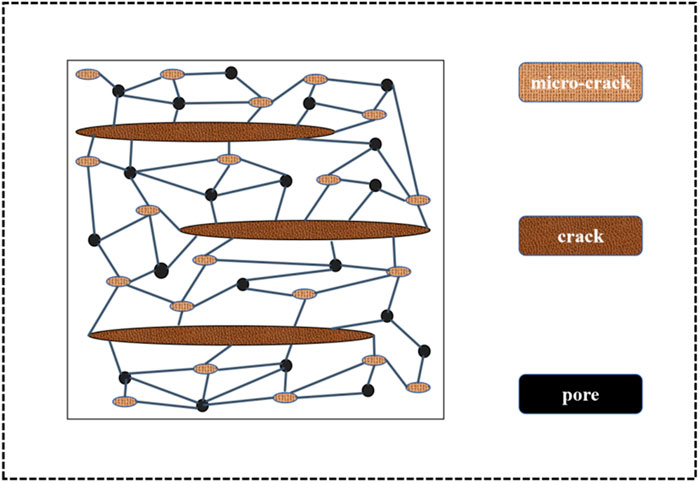
Figure 1. Schematic diagram of a multiscale model of a crack-bearing porous medium for petrophysical modeling, where the pores are interconnected, but the cracks are not.
For an equivalent dispersion model at different scales, the effective bulk modulus and effective shear modulus (Equations 1, 2) can be expressed as:
where
where
The expressions (Equations 5, 6) for the frequency-dependent parameters A and B are:
The expressions (Equations 7, 8) of non-dimensional parameters
As a result, we can derive the effective bulk modulus and effective shear modulus of the shale reservoir, and thereby obtain the complex velocity of the vertical and horizontal waves. And the expressions are
2.2 Forward simulation of viscoelastic compound matrix algorithm
In order to obtain seismic response based on rock physical modeling, we need to carry out forward seismic modeling researches. In this paper, in order to realize full wavefield simulation, the method of wave equation analytic solution (i.e., compound matrix algorithm) is proposed for seismic forward modeling. The compound matrix algorithm utilizes the second and third-order subdeterminant of the system matrix to transform the original system matrix into a new compound matrix. This approach ensures that the final computed analytical solution is free from numerical ill-posed. Moreover, vectorization operations not only reduce computational cost but also can quickly obtain high-precision seismic records. The specific steps for generalizing the compound matrix algorithm to viscoelastic media are as follows:
For a viscoelastic medium composed of N horizontally layers, the total reflection coefficient response can be obtained using the propagation vector (Equation 11):
The physical meaning of this formula refers to the propagation response from the lowest layer to the ith layer. Where
In order to calculate the total reflection coefficient of a layered viscoelastic medium, it is necessary to calculate the total propagation vector
where
Since the Nth layer is the lowest layer, it can be regarded as an infinite half-space viscoelastic medium with only reflections, and the propagation vector (Equation 13) of the Nth layer is:
Finally, the total propagation vector
According to the conventional generalized reflectance method, the time-domain seismogram can be obtained by integrating the frequency-slowness domain reflectance coefficient
where
3 Application
In order to establish the relationship between physical parameters of shale gas reservoir and seismic response, the Chapman model is selected as the petrophysical model to analyze the dispersion effects in shale gas reservoirs. FAVO forward analysis is carried out using the compound matrix algorithm, while considering the influence of attenuation and dispersion effects between layers and interfaces. Finally, the relationship between the petrophysical parameters of shale gas reservoir (e.g., crack density, porosity, crack aspect ratio, and gas saturation) and seismic response characteristics is experimentally analyzed.
3.1 Attenuation and velocity dispersion effect
Based on the actual physical properties of shale reservoirs from Eastern Sichuan Basin, a two-layer shale gas reservoir model is constructed for experiments. The corresponding crack pore medium parameters and the corresponding reservoir elastic and physical property parameters are shown in Tables 1–3. The set parameters are derived from actual data, while some of them refer to existing literature (Chapman et al., 2006; Pang and Stovas, 2020). The P-wave velocity versus frequency variation for the upper and lower layers is shown in Figure 2.

Table 2. Numerical values used in the computations. Fluid parameters of shale gas reservoirs, where fluid types include brine and gas.

Table 3. Numerical values used in the computations. Reservoir parameters of the constructed two-layer shale gas reservoir. Here, the thickness of the upper layer here is 1000 m.
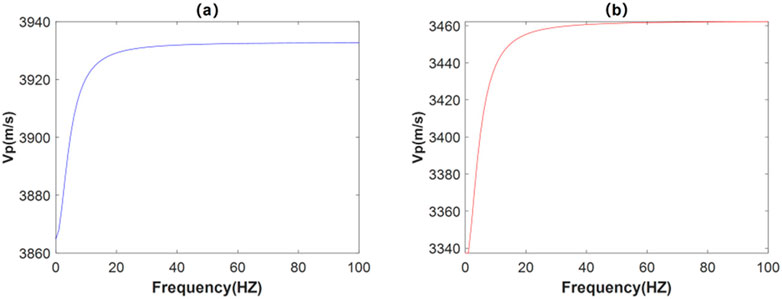
Figure 2. Variation of P-wave velocity with frequency for a two-layer shale gas reservoir model. (A) Upper layer. (B) Lower layer.
According to the slope of the curve, it can be seen that the dispersion of seismic waves initially increases with the rise in frequency, and then it progressively diminishes beyond a certain frequency threshold. Concurrently, as the frequency continues to increase, the P-wave velocity exhibits a gradual upward trend.
3.2 FAVO analysis of interlayer decay and interface decay
Subsequently, the complex P-wave velocity calculated by the Chapman model, along with shear wave velocity and density given according to the actual situation, are incorporated into the forward calculation framework of the viscoelastic compound matrix algorithm. This integration facilitates the realization of the corresponding orthotropic analysis. The angle gathers of the two-layer cracked porous media and the two-layer elastic media are calculated, respectively, as shown in Figure 3. Figure 3A shows the seismic angle gathers for the two-layer cracked porous media. Figure 3B shows the seismic angle gathers for the two-layer elastic media. The comparison reveals that the seismic records obtained from the elastic media remain unchanged, while the waveforms of the seismic records obtained from the cracked porous media vary significantly with angle and exhibit obvious amplitude attenuation.
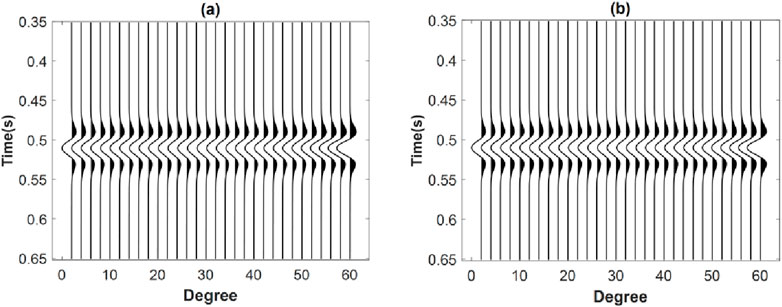
Figure 3. Comparison of angle gathers obtained from forward simulations for different media. (A) Two-layer cracked porous media. (B) Two-layer elastic medium.
According to the linear time-invariant hypothesis, seismic waves in the convolution do not change over time. Based on this hypothesis, the attenuation and velocity dispersion of seismic waves in the reservoir are usually attributed to the reflection coefficient. When seismic waves propagate in cracked porous media, the corresponding reflection coefficient is closely related to frequency. Complex velocity is the key factor affecting the frequency dependence of the reflection coefficient. That is, the loss associated with seismic wave propagation, related to complex velocity, and the energy distribution involved in reflection and transmission at the medium interface, will lead to the frequency-dependent variation of the reflection coefficient.
We carry out experiments using the two-layer shale gas reservoir model shown in Tables 1–3 to analyze the influence of interlayer and interface attenuation on the FAVO response of shale reservoirs, and the results are shown in Figure 4. When both the upper and lower media are cracked porous media, the variation of the reflection coefficient with incident angle in the frequency range of 2–30 Hz is shown in Figure 4A. Since the upper layer is a cracked porous medium, the variation of the reflection coefficient response is affected by both the interlayer and the interface. As the frequency increases, the value of reflection coefficient decreases, but it keeps the same trend with the incidence angle across different frequencies. When the upper layer is an elastic medium and the lower layer is a cracked porous medium with constant parameters, the variation of the reflection coefficient with the incident angle in the frequency range of 2–30 Hz is shown in Figure 4B. Since the upper medium is elastic medium, that is, there is no interlayer influence on the change of reflection coefficient, thus, the change of reflection coefficient is only affected by the interface at this time. The value of the reflection coefficient decreases with increasing frequency, but these variations are significantly smaller compared to those observed in a two-layer cracked porous medium. The reflection coefficient at each frequency maintains the same trend with the variation of the incident angle. The variation of the reflection coefficient with the angle of incidence at 2–30Hz, when both the upper and lower media are elastic media, is shown in Figure 4C. Since both the upper and lower media are elastic layers, neither attenuation nor velocity dispersion occurs between the layers or at the interface, so the reflection coefficient does not change with frequency. In summary, it can be seen from Figures 4A–C that the interlayer attenuation dispersion effect has a great impact on the FAVO response of shale gas reservoirs compared to the attenuation dispersion effect at the interface.
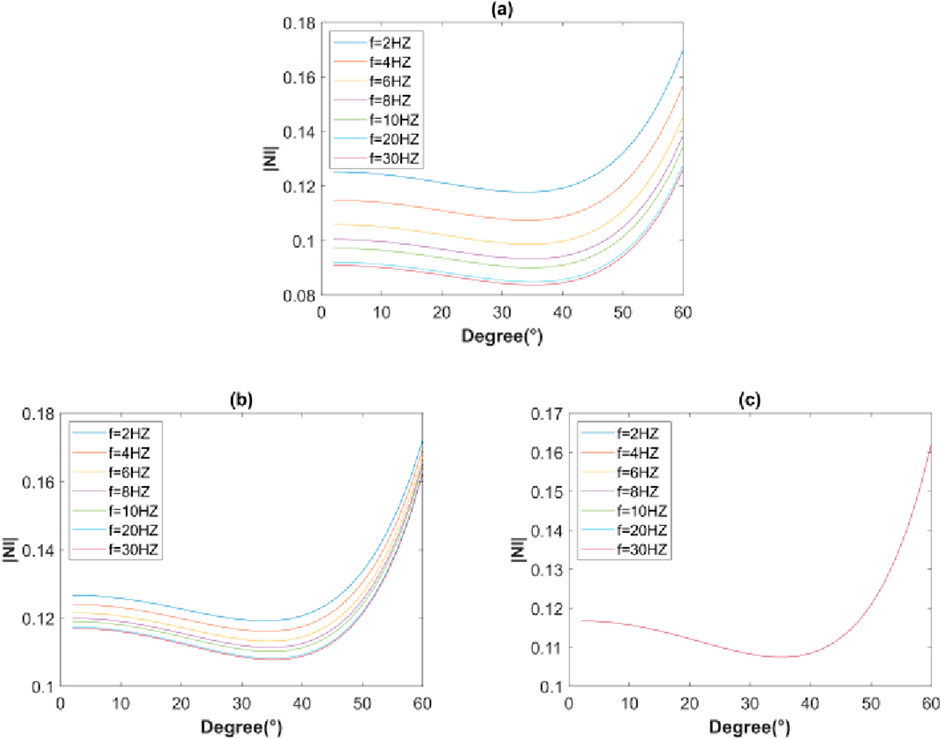
Figure 4. Variation of reflection coefficient with angle of incidence in the frequency range of 2–30 Hz for different medium models. (A) Two-layer cracked porous media. (B) The upper elastic medium and the lower cracked porous medium. (C) Two-layer elastic medium.
Figures 5A–C show the complete frequency-domain reflection coefficients for the above three cases, respectively. When the seismic wave propagation process is affected by both interlayer and interface, the reflection coefficient varies greatly with frequency. The reflection coefficient varies little with frequency when only interface effects are present. The reflection coefficient of an elastic medium does not change with frequency, which is characterized by a white spectrum. That is, the effects of interlayer should not be ignored.
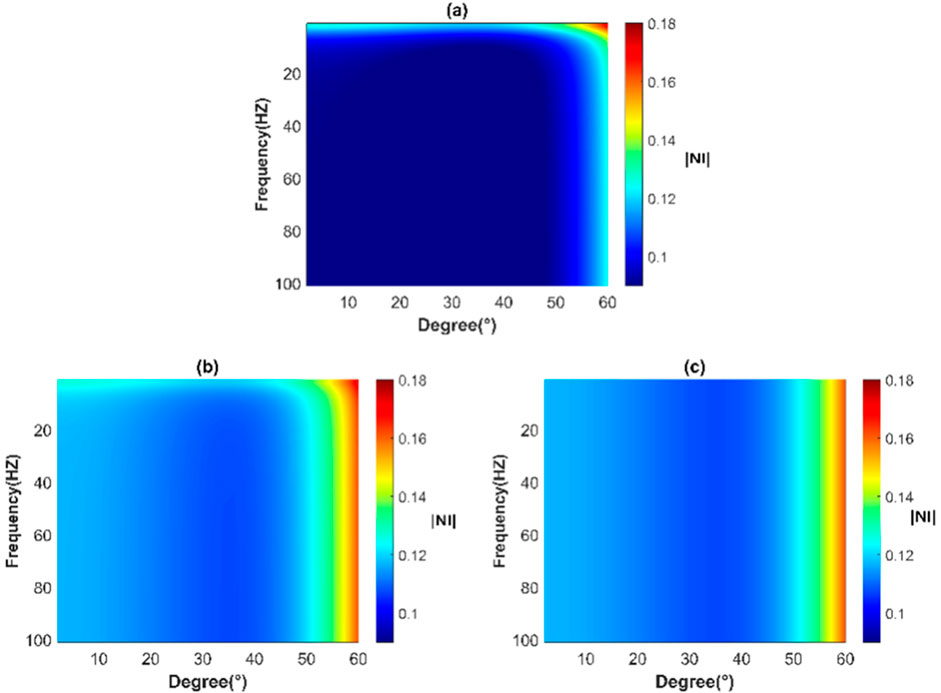
Figure 5. Frequency domain reflection coefficient versus frequency and incident angle for different medium models. (A) Two-layer cracked porous media. (B) The upper elastic medium and the lower cracked porous medium. (C) Two-layer elastic medium.
In order to further investigate the effect of interlayer attenuation and dispersion on seismic response, we designed the model shown in Figure 6. The geological model is equally divided into three parts: the left part is a two-layer model with cracked porous medium under an upper elastic medium, the middle part is a two-layer model with cracked porous medium both upper and lower, and the right part is a two-layer model with elastic medium both upper and lower. The corresponding parameters of the cracked porous medium are consistent with those listed in Tables 1–3.
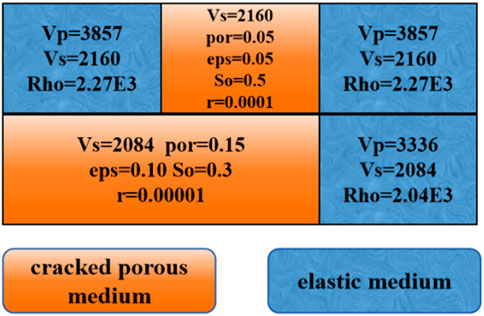
Figure 6. Schematic of a two-layer geological model used to test the effects of interlayer attenuation and dispersion on seismic response. The left part is a two-layer model considering only interface effects, the middle part is a two-layer model incorporating both interlayer and interface effects, and the right part is a two-layer elastic model.
The seismic records of the model are synthesized using compound matrix algorithm. Figure 7A shows the self-transmitting and self-receiving profile (vertical incidence) of the model. From the figure, it can be seen that the seismic records in the middle part are obviously different from those on the left and right sides, while those on the left and right sides are very similar. This indicates that the influence of the interface on the reflection coefficient in the seismic response is small. Given the simplicity of the model, we directly decompose its seismic records using the short-time Fourier transform. The corresponding frequency division profiles are shown in Figures 7B–E for frequencies of 18Hz, 32Hz, 48 Hz and 64Hz, respectively. The comparison reveals a low-frequency shadow phenomenon in the middle of the profile, and low-frequency shadow is an important means to identify fluid anomalies (Li et al., 2023). It is generally believed that the low-frequency shadow indicates the existence of an oil-bearing gas layer at its top. However, according to the above experimental settings, both the upper and lower layers are shale-bearing gas layers, indicating that the bottom of the low-frequency shadow can also indicate the presence of an oil-bearing gas layer.
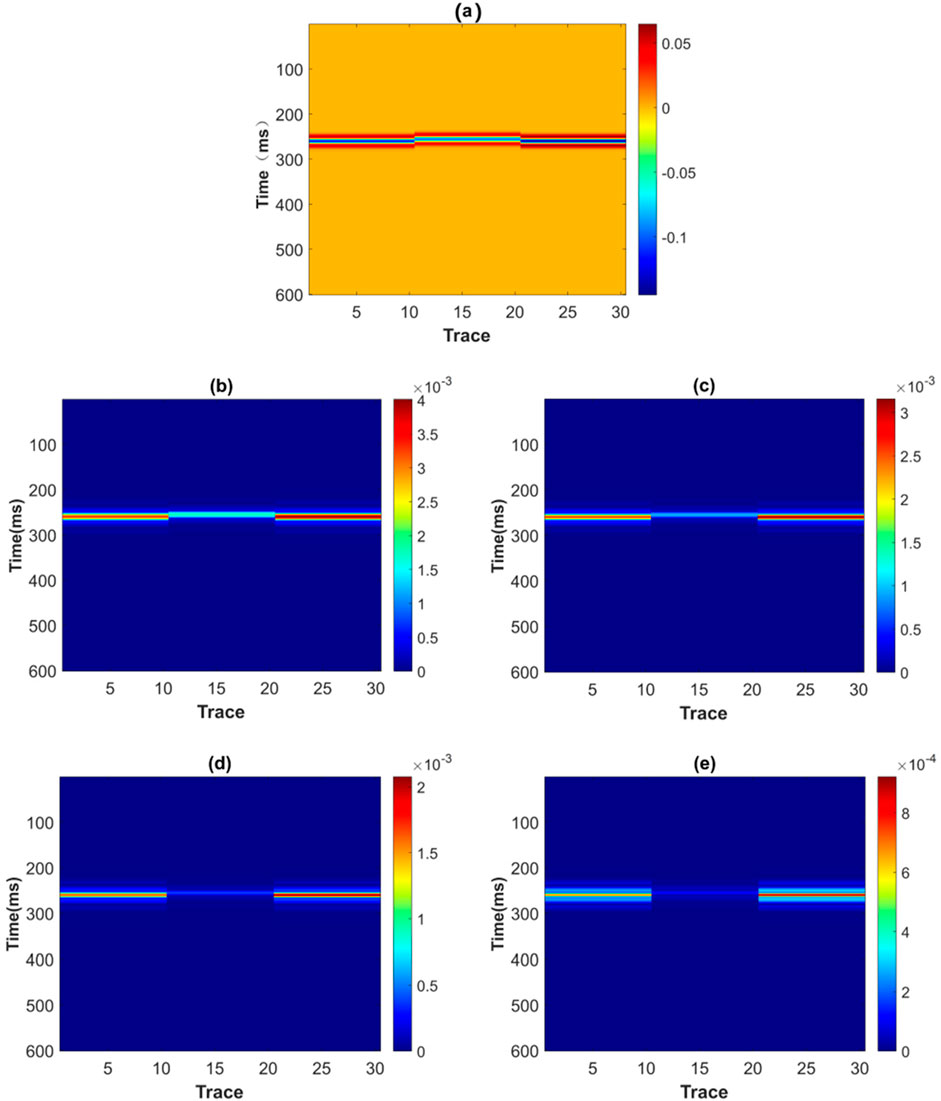
Figure 7. Seismic records computed using the compound matrix algorithm, along with their corresponding single-frequency profiles at different frequencies. (A) Self-transmitting and self-receiving profile. (B) 18 Hz frequency division profile. (C) 32 Hz frequency division profile. (D) 42 Hz frequency division profile. (E) 64 Hz frequency division profile.
3.3 Relationship between petrophysical parameters of shale reservoir and seismic response
The above study proves that the effect of interlayer attenuation dispersion on the FAVO response of shale gas reservoir cannot be ignored. Therefore, we consider the dispersion effect of interlayer attenuation and use the Chapman model as a bridge to re-establish the relationship between petrophysical parameters of shale gas reservoirs and their seismic responses. As mentioned above, the Chapman model can be described using a series of parameters to establish the relationship between petrophysical and elastic parameters. Therefore, the influence of crack density, porosity, gas saturation, and crack aspect ratio on seismic response can be analyzed by numerical experiments, providing valuable guidance for the characterization of shale gas reservoirs.
We continue to use the two-layer cracked porous media model provided in Tables 1–3 for numerical experiments. The effects of crack density, porosity, gas saturation, and crack aspect ratio on seismic response are analyzed by changing one of these parameters in the upper medium while keeping the physical properties of the lower medium unchanged. Figure 8 shows the variation of the 15 Hz reflection coefficient with the incident angle for different porosity, crack density, gas saturation, and crack aspect ratio. It can be seen from the figure that the amplitude corresponding to the same incident angle changes with changes in porosity, and the corresponding AVO response also changes. During the process of increasing porosity, the corresponding AVO type changes when the porosity exceeds 0.20. Similar to the results observed with porosity variations, the amplitude corresponding to the same incidence angle also changes with variations in crack density, and the corresponding AVO response changes accordingly. During the process of increasing crack density, the corresponding AVO type changes when the crack density exceeds 0.12. The effect of changes in gas saturation on reflection amplitude is that the higher the gas saturation, the smaller the amplitude corresponding to the same angle of incidence. However, different from crack density and porosity, the corresponding AVO response is less affected by changes in gas saturation, and the AVO type remains consistent across different gas saturations. For the same incidence angle, the corresponding amplitude increases with an increasing crack aspect ratio, but the corresponding AVO response changes little, and the corresponding AVO types remain consistent across different crack aspect ratios.
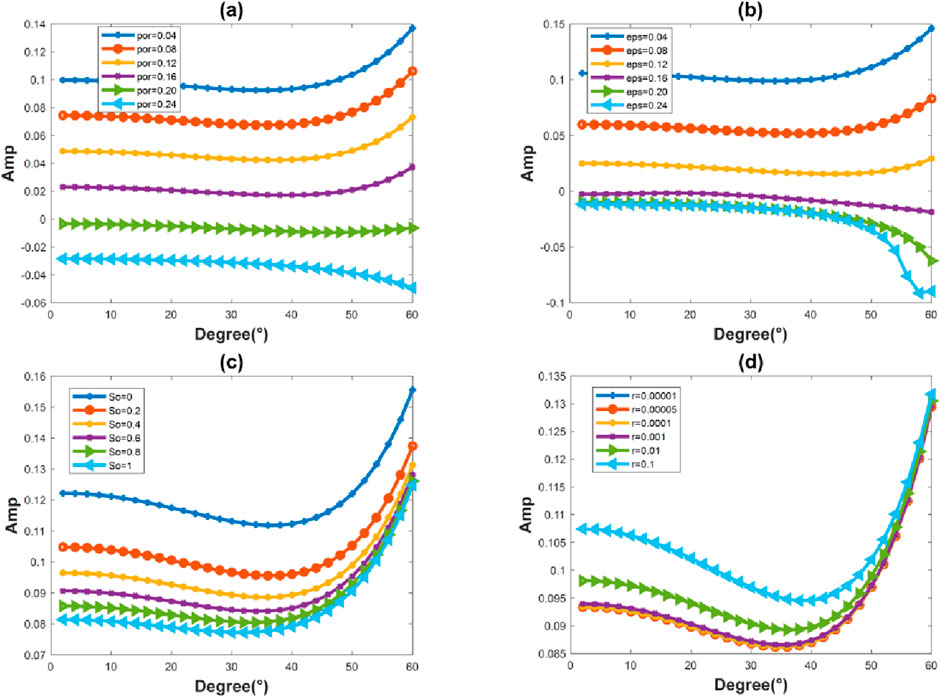
Figure 8. Variation of reflection coefficient with angle of incidence at 15 Hz for different (A) porosity, (B) crack density, (C) gas saturation, and (D) crack aspect ratio.
Figure 9 shows the changes of zero-angle reflection coefficients at different frequencies for varying porosity, crack density, gas saturation and crack aspect ratio. It can be seen from the figure that the attenuation of the reflection coefficients at each frequency remains consistent with changes in porosity, and dispersion is more pronounced in the low-frequency (10 HZ) region where porosity ranges from 0.04 to 0.16. The attenuation of the reflection coefficients at all frequencies is largely similar when affected by variations in crack density, and the frequency dispersion for both high and low crack densities is more pronounced in the low-frequency region. For the effect of changes in gas saturation, the attenuation of the reflection coefficient is essentially the same at all frequencies, and the dispersion in the low-frequency region is almost independent of the saturation. For the effect of crack aspect ratio variation, the attenuation of reflection coefficient at each frequency is basically the same. Similar to the effect of gas saturation, the dispersion in the low frequency region is almost not affected by the size of the crack aspect ratio.
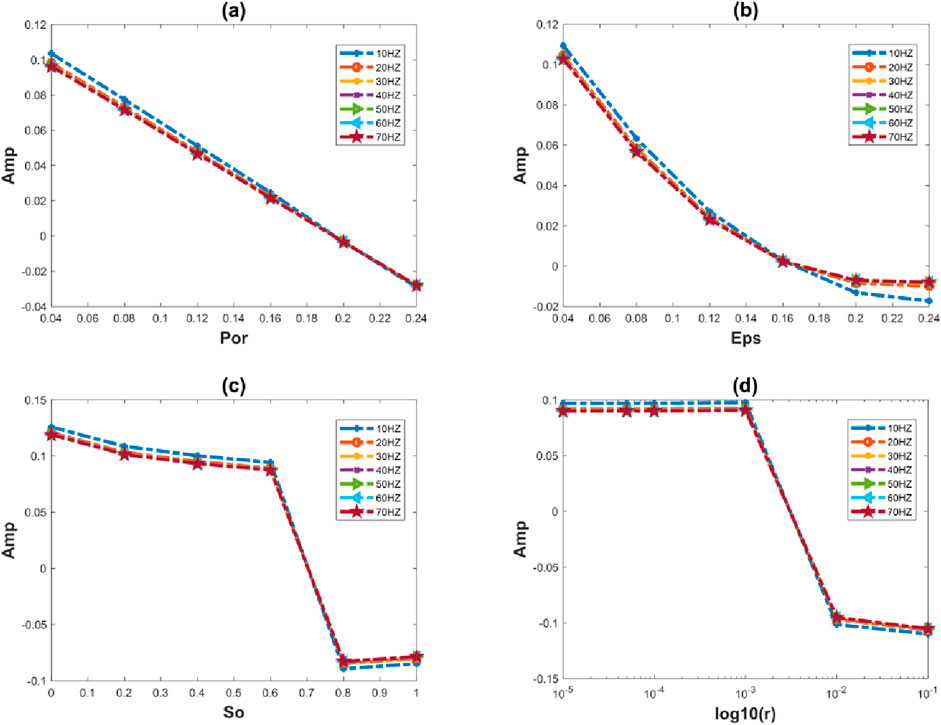
Figure 9. Variation of zero-angle reflection coefficients versus (A) porosity, (B) crack density, (C) gas saturation, and (D) crack aspect ratio at different frequencies.
Figure 10 shows the variation of the zero-angle reflection coefficient with frequency for different porosity, crack density, gas saturation, and crack aspect ratio. It can be seen from the figure that the amplitude corresponding to each frequency changes with porosity, and the dispersion is more pronounced in the low-frequency region. The amplitude corresponding to each frequency changes with crack density, and the dispersion effect is obvious at low frequencies (0-15HZ), with this effect being notably stronger than that observed with changes in porosity. The difference in the dispersion effect at low frequencies under different saturation is small. In the case of different aspect ratios of cracks, the dispersion effect in low-frequency bands is obvious, and it can be seen that the smaller the crack aspect ratio, the more obvious the dispersion effect. As the crack aspect ratio increases, the change curves basically overlap.
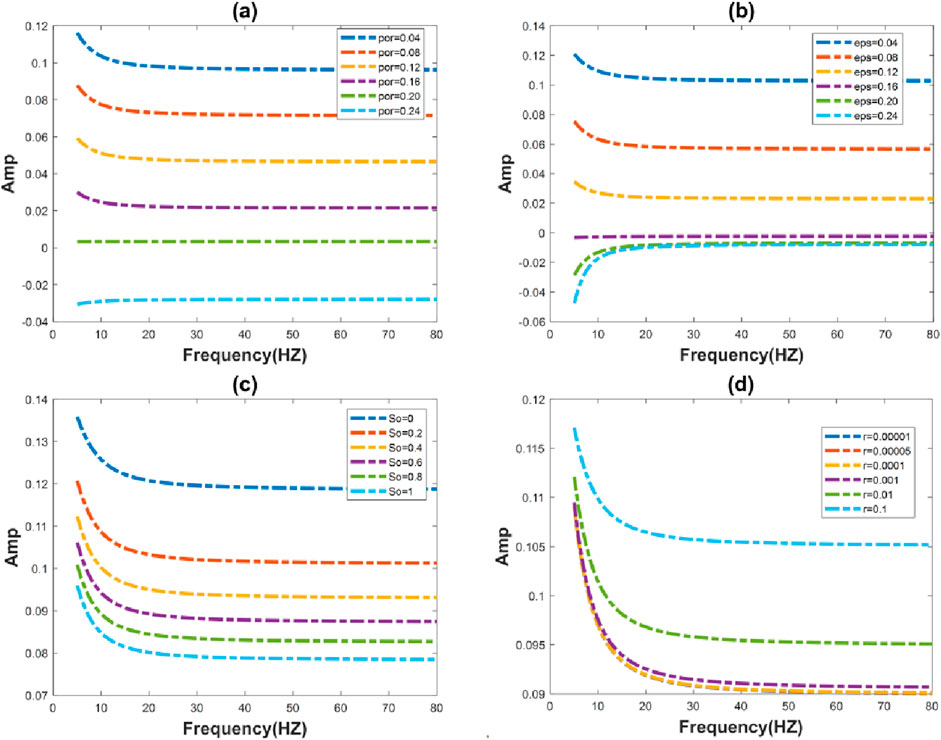
Figure 10. Variation of zero-angle reflection coefficient versus frequency for different (A) porosity, (B) crack density, (C) gas saturation, and (D) crack aspect ratio.
Figure 11 shows the self-transmitting and self-receiving seismic records for different porosity, crack density, gas saturation, and crack aspect ratio. It can be seen from the figure that changes in porosity significantly alter the elastic modulus of the crack pore medium, which leads to changes in travel time and reflection coefficients with frequency. When the porosity is small, the P-wave velocity of the upper medium is greater than that of the lower medium, resulting in a negative reflection coefficient. Conversely, when the porosity is large, the P-wave velocity of the upper medium is lower than that of the lower medium, leading to a positive reflection coefficient and a phase reversal in the wavelet. The effect of changes in crack density on the elastic modulus of the reservoir is largely consistent with that of changes in porosity, and the phenomenon of wavelet phase reversal is obvious. Different from the effects of porosity and crack density, the upper P-wave velocity is always greater than the lower P-wave velocity, i.e., the reflection coefficient remains negative, regardless of the gas saturation and crack aspect ratio.
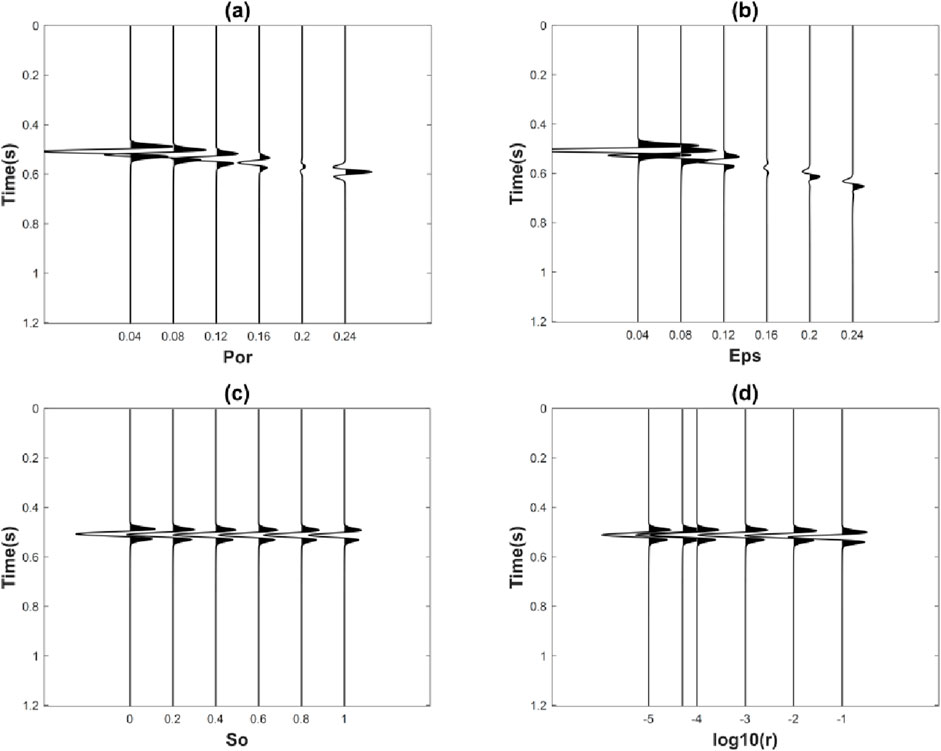
Figure 11. Self-transmitting and self-receiving seismogram corresponding to different (A) porosity, (B) crack density, (C) gas saturation, and (D) crack aspect ratio.
According to the above analysis, it is known that the seismic response is most sensitive to changes in crack density, which is reflected in travel time, AVO characteristics, and phase information. The seismic response is moderately sensitive to changes in porosity, exhibiting similar travel-time, AVO characteristics, and phase information as those observed with changes in crack density. The seismic response is the least sensitive to changes in gas saturation and crack aspect ratio, i.e., exhibiting small changes in AVO characteristics and insignificant phase changes. In summary, the sensitivity of the seismic response to changes in fracture density in shale gas reservoir media is the highest, followed by porosity, with gas saturation and crack aspect ratio showing the least sensitivity. Therefore, it is easier to obtain crack density and porosity from seismic records when characterizing shale gas reservoir parameters, compared to gas saturation and crack aspect ratio.
4 Discussion
The equivalent theoretical model is an important tool in petrophysical studies, which idealizes shale gas reservoir through certain assumptions to establish the relationship between seismic response and the properties of shale gas reservoir. In this paper, the Chapman model, a dynamic equivalent theoretical model, is selected as the petrophysical model and is combined with the compound matrix algorithm to adapt it to more complex reservoir scenarios. Meanwhile, we conduct a thorough analysis of the sensitivity of seismic response to the petrophysical parameters of shale gas reservoirs, thereby providing a foundation for the characterization and assessment of these reservoirs. Conventional FAVO forward modeling only considers the effect of the interface and ignores the more important effect of the interlayer, making it less applicable in practice. In contrast, we consider the effects of both the interface and interlayer simultaneously, which is crucial and has significant guiding importance for the identification of shale gas reservoirs and the characterization of shale gas fluids.
However, the petrophysical models used in this paper are still based on relatively ideal and simplified simple assumptions, such as fracture levels and no coupling between fractures. Considering multi-factor coupling can help us better characterize velocity dispersion and attenuation in rocks. In this paper, we have conducted a forward analysis to elucidate the relationship between reservoir parameters and seismic responses. A more critical task in reservoir characterization is to derive reservoir parameters from known seismic records. The next step is to realize the inversion of shale reservoir parameters based on the model developed in this paper.
5 Conclusion
In this paper, we select the Chapman model as the petrophysical model and combine it with the compound matrix algorithm to analyze the FAVO effect in shale reservoirs in detail. The relationship between shale gas reservoir parameters (e.g., crack density, porosity, gas saturation, and crack aspect ratio) and seismic response is accurately established by FAVO forward simulation based on the compound matrix algorithm. The attenuation dispersion effects between interfaces and layers are considered and compared. The results show that the attenuation and velocity dispersion effects between layers of shale gas reservoir cannot be ignored, and their impact on seismic response is significantly larger than that of the attenuation and dispersion effects at the interface. The low-frequency shadow observed in the experiment proves the feasibility of indicating shale gas reservoir, and also proves that the low-frequency shadow can indicate the presence of shale gas reservoir not only at the top but also at the bottom. The experiments prove that the change of shale gas reservoir parameters (i.e., crack density, porosity, gas saturation and crack aspect ratio) affect the FAVO response, but to varying degrees. Specifically, the effect of crack density is greater than that of porosity, and greater than that of gas saturation and crack aspect ratio. This verifies the effectiveness of dispersion attributes for identifying gas in shale gas reservoir, and on this basis, the corresponding dispersion attributes extracted from seismic data will be considered for shale gas reservoir fluid identification.
Data availability statement
The raw data supporting the conclusions of this article will be made available by the authors, without undue reservation.
Author contributions
HD: Conceptualization, Writing–original draft. JZ: Conceptualization, Writing–original draft. DZ: Writing–review and editing. SW: Writing–review and editing. JX: Writing–review and editing.
Funding
The author(s) declare that financial support was received for the research, authorship, and/or publication of this article. This work was supported in part by the National Natural Science Foundation of China under Grant 42204108, in part by the Natural Science Foundation of Sichuan under Grant 2023NSFSC0768, in part by National Key Laboratory of Petroleum Resources and Engineering, China University of Petroleum, Beijing under Grant PRE/open-2305, in part by Research on Fine Exploration and Surrounding Rock Classification Technology for Deep Buried Long Tunnels Driven by Horizontal Directional Drilling and Magnetotelluric Methods Based on Deep Learning under Grant E202408010.
Conflict of interest
Author DZ was employed by Sichuan Water Development Investigation, Design & Research Co., Ltd.
The remaining authors declare that the research was conducted in the absence of any commercial or financial relationships that could be construed as a potential conflict of interest.
Publisher’s note
All claims expressed in this article are solely those of the authors and do not necessarily represent those of their affiliated organizations, or those of the publisher, the editors and the reviewers. Any product that may be evaluated in this article, or claim that may be made by its manufacturer, is not guaranteed or endorsed by the publisher.
References
Ba, J., Xu, W., Fu, L. Y., Carcione, J. M., and Zhang, L. (2017). Rock anelasticity due to patchy saturation and fabric heterogeneity: a double double-porosity model of wave propagation. J. Geophys. Res. Solid Earth 122 (3), 1949–1976. doi:10.1002/2016jb013882
Bortfeld, R. (1961). Approximations to the reflection and transmission coefficients of plane longitudinal and transverse waves. Geophys. Prospect. 9 (4), 485–502. doi:10.1111/j.1365-2478.1961.tb01670.x
Carcione, J. M., Helle, H. B., and Pham, N. H. (2003). White's model for wave propagation in partially saturated rocks: comparison with poroelastic numerical experiments. Geophysics 68 (4), 1389–1398. doi:10.1190/1.1598132
Chapman, M. (2003). Frequency-dependent anisotropy due to meso-scale fractures in the presence of equant porosity. Geophys. Prospect. 51 (5), 369–379. doi:10.1046/j.1365-2478.2003.00384.x
Chapman, M., Liu, E., and Li, X.-Y. (2006). The influence of fluid sensitive dispersion and attenuation on AVO analysis. Geophys. J. Int. 167 (1), 89–105. doi:10.1111/j.1365-246x.2006.02919.x
Chapman, M., Zatsepin, S. V., and Crampin, S. (2002). Derivation of a microstructural poroelastic model. Geophys. J. Int. 151 (2), 427–451. doi:10.1046/j.1365-246x.2002.01769.x
Cheng, B.-J., Xu, T.-J., and Li, S.-G. (2012). Research and application of frequency dependent AVO analysis for gas recognition. Chin. J. Geophys. 55 (2), 608–613. doi:10.6038/j.issn.0001-5733.2012.02.023
Dvorkin, J., Mavko, G., and Nur, A. (1995). Squirt flow in fully saturated rocks. Geophysics 60 (1), 97–107. doi:10.1190/1.1443767
Guo, Z.-Q., Liu, C., and Li, X.-Y. (2015). Seismic signatures of reservoir permeability based on the patchy-saturation model. Appl. Geophys. 12, 187–198. doi:10.1007/s11770-015-0480-6
Hilterman, F. (1990). Is AVO the seismic signature of lithology? A case history of Ship Shoal-South Addition. Lead. Edge 9 (6), 15–22. doi:10.1190/1.1439744
Hou, Z., Luo, J., Cao, C., and Ding, G. (2023). Development and contribution of natural gas industry under the goal of carbon neutrality in China. Adv. Eng. Sci. 55 (01), 243–252. doi:10.15961/j.jsuese.202200226
Hudson, J, Liu, E, and Crampin, S (1996). The mechanical properties of materials with interconnected cracks and pores. Geophysical Journal International, 124(1): 105-112.
Hudson, J A (1981). Wave speeds and attenuation of elastic waves in material containing cracks. Geophysical Journal International, 64(1): 133-150.
Li, Z., Chen, X., Pun, C.-M., and Cun, X. (2023). High-resolution document shadow removal via A large-scale real-world dataset and A frequency-aware shadow erasing net. IEEE, 12415–12424.
Liu, C., Li, B.-N., Zhao, X., Liu, Y., and Lu, Q. (2014). Fluid identification based on frequency-dependent AVO attribute inversion in multi-scale fracture media. Appl. Geophys. 11 (4), 384–394. doi:10.1007/s11770-014-0454-0
Liu, L., Cao, S., and Wang, L. (2011). Poroelastic analysis of frequency-dependent amplitude-versus-offset variations. Geophysics 76 (3), C31–C40. doi:10.1190/1.3552702
Maultzsch, S., Chapman, M., Liu, E., and Li, X. Y. (2003). Modelling frequency-dependent seismic anisotropy in fluid-saturated rock with aligned fractures: implication of fracture size estimation from anisotropic measurements. Geophys. Prospect. 51 (5), 381–392. doi:10.1046/j.1365-2478.2003.00386.x
Pang, S., and Stovas, A. (2020). Low-frequency anisotropy in fractured and layered media. Geophys. Prospect. 68 (2), 353–370. doi:10.1111/1365-2478.12833
Phinney, R. A., Odom, R. I., and Fryer, G. J. (1987). Rapid generation of synthetic seismograms in layered media by vectorization of the algorithm. Bull. Seismol. Soc. Am. 77 (6), 2218–2226. doi:10.1785/BSSA0770062218
Pointer, T., Liu, E., and Hudson, J. A. (2000). Seismic wave propagation in cracked porous media. Geophys. J. Int. 142 (1), 199–231. doi:10.1046/j.1365-246x.2000.00157.x
Ren, H., Goloshubin, G., and Hilterman, F. J. (2009a). Poroelastic analysis of amplitude-versus-frequency variations. Geophysics 74 (6), N41–N48. doi:10.1190/1.3207863
Ren, H., Goloshubin, G., and Hilterman, F. J. (2009b). Poroelastic analysis of permeability effects in thinly layered porous media. Geophysics 74 (6), N49–N54. doi:10.1190/1.3223185
Schmidt, H., and Tango, G. (1986). Efficient global matrix approach to the computation of synthetic seismograms. Geophys. J. Int. 84 (2), 331–359. doi:10.1111/j.1365-246x.1986.tb04359.x
Schoenberg, M. (1980). Elastic wave behavior across linear slip interfaces. J. Acoust. Soc. Am. 68 (5), 1516–1521. doi:10.1121/1.385077
Sen, M. K., and Roy, I. G. (2003). Computation of differential seismograms and iteration adaptive regularization in prestack waveform inversion. Geophysics 68 (6), 2026–2039. doi:10.1190/1.1635056
Shuey, R. (1985). A simplification of the Zoeppritz equations. Geophysics 50 (4), 609–614. doi:10.1190/1.1441936
Sidler, R., Rubino, J. G., and Holliger, K. (2013). Quantitative comparison between simulations of seismic wave propagation in heterogeneous poro-elastic media and equivalent visco-elastic solids for marine-type environments. Geophys. J. Int. 193 (1), 463–474. doi:10.1093/gji/ggs125
Smith, G., and Gidlow, P. (1987). Weighted stacking for rock property estimation and detection of gas. Geophys. Prospect. 35 (9), 993–1014. doi:10.1111/j.1365-2478.1987.tb00856.x
Thomsen, L. (1995). Elastic anisotropy due to aligned cracks in porous rock1. Geophys. Prospect. 43 (6), 805–829. doi:10.1111/j.1365-2478.1995.tb00282.x
Van Der Kolk, C., Guest, W., and Potters, J. (2001). The 3D shear experiment over the Natih field in Oman: the effect of fracture-filling fluids on shear propagation. Geophys. Prospect. 49 (2), 179–197. doi:10.1046/j.1365-2478.2001.00250.x
Wang, D., Zhang, H. L., and Wang, X. M. (2006). A numerical study of acoustic wave propagation in partially saturated poroelastic rock. Chin. J. Geophys. 49 (2), 465–473.
Wu, X. (2010). Frequency dependent AVO inversion using spectral decomposition techniques. Wuhan: China University of Geosciences.
Zhang, L., Ba, J., and Carcione, J. M. (2021). Wave propagation in infinituple-porosity media. J. Geophys. Res. Solid Earth 126 (4), e2020JB021266. doi:10.1029/2020jb021266
Zhao, H., Gao, J., and Liu, F. (2014). Frequency-dependent reflection coefficients in diffusive-viscous media. Geophysics 79 (3), T143–T155. doi:10.1190/geo2013-0038.1
Zhen, Q., Caineng, Z., Jianzhong, L., Qiulin, G., Xiaozhi, W., and Lianhua, H. (2013). Unconventional petroleum resources assessment: progress and future prospects. Nat. Gas. Geosci. 24 (2), 238–246.
Zoeppritz, K. (1919). On the reflection and propagation of seismic waves. Gottinger Nachrichten 1 (5), 66–84.
Appendix A
The expression (Equation 16) of layer propagation matrix
where
The up-going wave energy matrix
where
where
Keywords: frequency-dependent AVO, shale gas reservoirs, petrophysical modeling, attenuation dispersion effect, compound matrix algorithm
Citation: Du H, Zhang J, Zhao D, Wang S and Xu J (2024) Modeling the effect of dispersion and attenuation for frequency-dependent amplitude variation with offset. Front. Earth Sci. 12:1438930. doi: 10.3389/feart.2024.1438930
Received: 27 May 2024; Accepted: 30 September 2024;
Published: 21 October 2024.
Edited by:
Huaimin Dong, Chang’an University, ChinaCopyright © 2024 Du, Zhang, Zhao, Wang and Xu. This is an open-access article distributed under the terms of the Creative Commons Attribution License (CC BY). The use, distribution or reproduction in other forums is permitted, provided the original author(s) and the copyright owner(s) are credited and that the original publication in this journal is cited, in accordance with accepted academic practice. No use, distribution or reproduction is permitted which does not comply with these terms.
*Correspondence: Jian Zhang, emo0NTE3NTU1NjJAZ21haWwuY29t
 Haoqi Du
 Jian Zhang
 Dongchang Zhao4