 Bingshun He1,2,3
 Meihong Ma
94% of researchers rate our articles as excellent or good
Learn more about the work of our research integrity team to safeguard the quality of each article we publish.
Find out more
ORIGINAL RESEARCH article
Front. Earth Sci., 19 July 2024
Sec. Geohazards and Georisks
Volume 12 - 2024 | https://doi.org/10.3389/feart.2024.1438421
This article is part of the Research TopicMonitoring, Early Warning and Mitigation of Natural and Engineered Slopes – Volume IVView all 30 articles
Global warming has accelerated the frequency and intensity of extreme rainfall events in mountainous areas. Coupled with their vulnerable environment and the impact of intensive human activities, along with the complex and variable causes of flash floods, this exacerbates casualties and property losses. Therefore, this article investigates the triggering mechanisms and potential disaster-causing factors of the extreme “720”flood in the WZD-HGZ basin of Henan. The research results indicate that the flash floods in the WZD-HGZ basin were primarily caused by prolonged heavy rainfall, combined with the complex terrain, obstructive backwater, and human activities. The amplification of the flood mainly occurred in three stages: concentrated runoff from multiple channels, water obstruction caused by the successive collapse of roadbeds and bridges, and the generation of backwater. Besides, due to the lack of basic flood prevention awareness, unclear warnings, and inadequate guidance, the transition chain from issuing warnings to taking action was disrupted. The aforementioned research findings provide references for current flash flood disaster prevention efforts.
Flash flood is usually defined as a rapid rise of water level along a stream gully or in a small catchment associated with short-duration but high-intensity rainstorms (Burrell and Eve, 2002; Martin et al., 2013). As such, it is characterized by sudden occurrence, short response time, high flow velocity and sometimes carrying debris and rocks, which has become one of the most devastating disasters all over the world (Mehdi et al., 2018). World Meteorological Organization (WMO) reported more than 5,000 deaths worldwide annually due to flash floods, which exceeds any other flood-related events. Paprotny et al. (2018) studied flood losses from 1,564 flood events in Europe during the last 150 years, of which more than half are flash floods. There are 1,075 fatalities due to flash flood recorded from 1996 to 2014 across the United States, with approximately 100 casualties each year (Ashley and Ashley, 2008; Terti et al., 2017). In China, the total number of casualties caused by flood-related events is around 0.28 million since 1950, and nearly 80% of losses during 2010–2016 were due to flash floods (He et al., 2018; Liu et al., 2022a).
To achieve a better understanding of flash floods, many researches have focused on studying its mechanism (Meral, 2016; Mónica et al., 2017; Yang et al., 2023; Qiu et al., 2024) and identifying meteorological and hydrological factors that have the potential to trigger the disasters, e.g., complex topography with terrain gradients, land use and soil type, land cover, antecedent heavy rainfall, human activities, etc. These factors can determine the hydrological response of watersheds to the rainfall which most flash floods are associated with (Liu et al., 2024). For example, Zhang et al. (2021) and Zhang et al. (2019) investigated the changes in future flash floods due to climate change. They found that extreme rainfall would lead to an increase in inundation depth, thereby increasing the risk of flash floods. However, in the decades, climate change has dramatically altered the extreme weather patterns by which flash floods are generated more likely, the formation mechanisms of flash floods induced by frequent extreme rainfall under climate change have not been thoroughly studied. Meantime, with the rapid social and economic development, the frequent and unpredictable impacts of human activities have increased the risk of flash floods (Billi et al., 2015; Gan et al., 2018; Papagiannaki et al., 2017; Liu et al., 2020; Ye et al., 2024). Especially in China, although the data monitoring network has been developed and implemented at the national level, monitoring facilities in mountain areas need further improvement. Direct measurement equipment is particularly prone to damage under extreme conditions. Therefore, it is essential to develop a decent post-disaster review strategy based on limited data, which can provide a reasonable detection to the hidden factors that induce disasters. One of the greatest challenges is that regions prone to flash floods often lack the limited historical records during such extreme events.
This article focuses on the record-breaking rainfall that occurred in Henan Province, China, on 20 July 2021 (so-called “720 rainstorm”), which reached up to 624 mm/day (Wang and Xuan, 2022; Xu et al., 2022); the motivation is to propose a post-disaster assessment strategy, that leverages limited data to uncover the factors inducing flash floods. This strategy involves comprehensive data collection, including victim accounts and post-disaster surveys, field investigations, and the use of drones for disaster identification. Scenario assumptions and modeling are then employed to rapidly simulate and explore contributing factors to the disaster.”720 rainstorm” triggered devastating flash floods in many cities in Henan Province, particularly in the provincial capital, Zhengzhou, causing casualties and significant economic losses. The severe flooding disaster occurred in two villages in the southwestern mountainous area of Zhengzhou, named Wangzongdian (WZD) and Haigouzai (HGZ). The watershed controlled by the two villages experienced the highest number of deaths due to flash floods in 2021. However, due to limited data and the complexity of the situation, it has been challenging to quickly determine the causes that triggered the disaster. Additionally, given the small scale of the WZD-HGZ watershed, it is difficult to explain why the number of casualties in this area was significantly higher than in other flood-affected regions, and what the main factors triggering the flash floods in this watershed?Furthermore, despite issuing a public warning 14 h in advance, why the evacuation process did not proceed effectively remains a question?
To address the aforementioned issues, the study proposes a post-disaster review strategy. Firstly, data collection is emphasized. Given the susceptibility of actual measurement instruments to damage and the difficulty in collecting data, information from various sources such as victim descriptions and post-disaster survey data is considered. Disaster identification primarily relies on field investigations and the use of drones to assist. Subsequently, through scenario assumptions and modeling, the aim is to rapidly simulate and explore the potential factors contributing to the losses. Building upon this foundation, the strategy is applied and validated through practical case studies, specifically considering the characteristics of the flash floods in the WZD-HGZ watershed. The aim is to provide valuable insights for mountain flood disaster defense strategies. The article is organized as follows: Section 2 describes the details of the study area, data collection and process, geographic analysis to extract topographic features and the simulation model; Section 3 shows the simulation results including the rainfall characteristics, flood simulation in the upstream and downstream watersheds and the mechanism and factors driven the disaster; the impact of human behavior is then discussed in Section 4 and the conclusion is given in Section 5.
The study area, i.e., WZD-HGZ watershed, presented in Figure 1, with the size of 42 km2 is a sub-catchment controlled by the Suohe River which is a tributary of the Jialu River in the Huai river basin situated in northern China between the Yellow river and the Yangtze river (the two longest rivers in China). According to the on-site survey, the land of the WZD-HGZ watershed is mainly covered by woodland and agricultural crops together with several quarries where the soil mainly composes of sandy clay. According to the historical record, the annual average rainfall of the WZD-HGZ watershed is 608.8 mm with an uneven temporal distribution throughout the year. The rainfall recorded in the period of June-September accounts for 66% of the annual amount. Village WZD controlling the upstream watershed is surrounded by mountains with a total mountain area of 5.3 km2 on all sides. The watershed can be subdivided into two small watersheds that are bounded by WZD Group, the most north part of village WZD, where the boundary is presented as a yellow dash line and marked as “Upstream (WZD)” in Figure 1B. The upstream watershed is located in the south of WZD Community (marked as red circle), partly under the jurisdiction of Xinmi City, with the size of around 22 km2 and the length of the main ditch in the area is about 13.9 km which three ditches (west, middle, east) concentrate into. The downstream watershed is located in the north between Village WZD and HGZ (marked as “Downstream (HGZ)” in Figure 1B) where another three tributaries converge to the main ditch and a Railway “Mami Line” (marked as red dash line) passes through. The outlet of the WZD-HGZ watershed is a reservoir called “Zhidingdian” that is designed for preventing a one-in-100-year return level with the check flood level of a one-in-2000-year return period. The reservoir has a total storage capacity of 60.65 million m3. As the reservoir had just been reinforced and kept empty storage, it undertook the main flood during the occurrence of the “7.20” rainstorm event. There are 12 local communities including WZD Group, Nantou Group, etc., 442 households and 1,472 residents living in Village WZD while 24 communities including Village Cuimiao, Haixi Group, Hainan Group, Haidong Group and Chenhe Group, 1938 households and 7,047 people in HGZ.
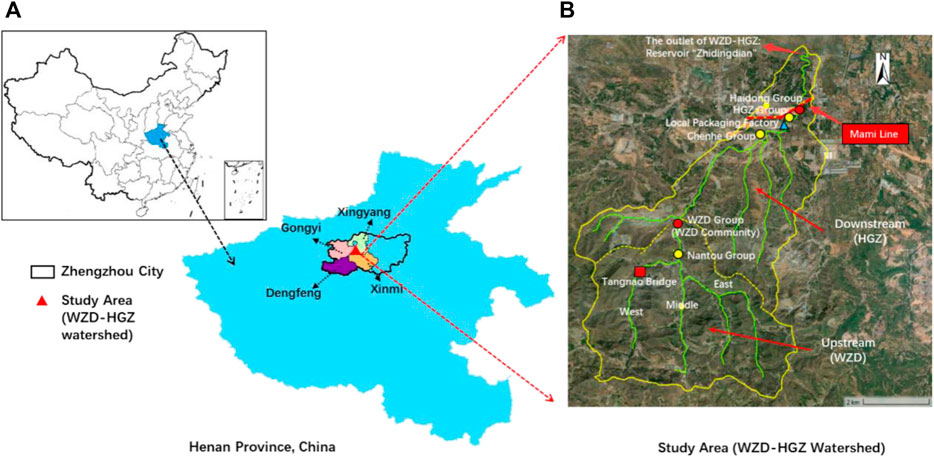
Figure 1. Geographical location (A), ditches and important landmarks (B) of WZD-HGZ watershed.
The rainstorm occurring on 20 July 2021 in Zhengzhou City, Henan Province, China, has been recognized as one of the rarest and most extraordinary events since 1951, which causes hundreds of casualties and serious financial losses, especially in the watershed located in two mountainous villages named “Wangzongdian” (WZD) and “Haigouzhai” (HGZ). During the event, many direct measurement facilities were destroyed, which leads to great difficulties in supporting flood simulation and disaster analysis (Chen et al., 2022; Liu et al., 2022b). The flash flood accompanied by various topographical disasters such as landslides and debris flow destroyed more than 40,000 houses and caused 251 deaths in total in the four most-affected cities. The worst hit identified according to the casualties and property losses is located in a watershed controlled by the villages of Wang Zong Dian (WZD, upstream) and Hai Gou Zhai (HGZ, downstream) with 49 casualties which are the maximum fatalities due to flash flood disasters and landslides in 2021 (China, 2021). Figure 2 demonstrates one of the most damaged places. Thus, this area is selected to demonstrate the strategy and analyze the flood risk and the underlying reasons leading to the huge lost.
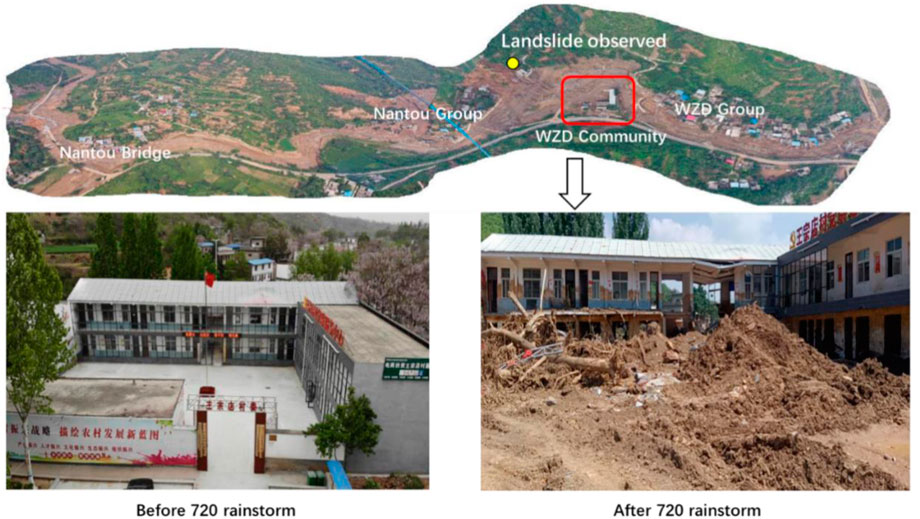
Figure 2. The comparison of the situation before and after 720 rainstorm in one of the most damaged areas, i.e., WZD community.
The onsite investigation was carried out after the “720” rainstorm event. The unmanned aerial vehicle (UAV) was employed to depict the topographic features and identify the post-disaster situation and finally selected two representative cross-sections at both upstream and downstream watersheds. The spatial distribution of nine gauges is presented in Figure 3 and marked as red circles. The basic attribute information of the watersheds and Extracted features used in this study is shown in Table 1.
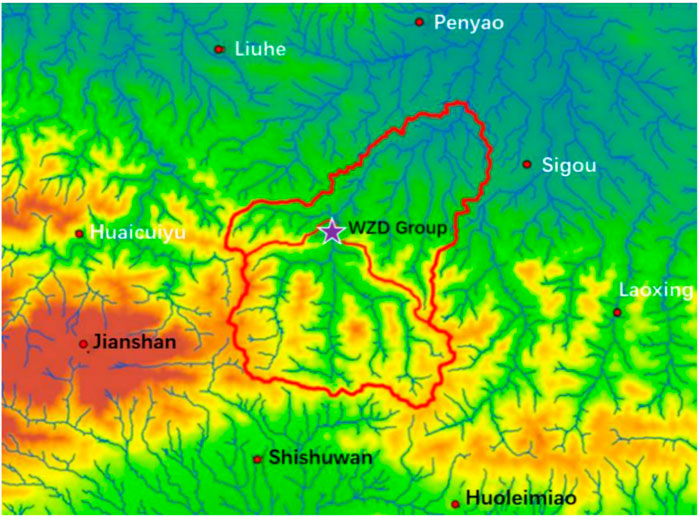
Figure 3. The surrounding rain gauges for calculating areal rainfall.
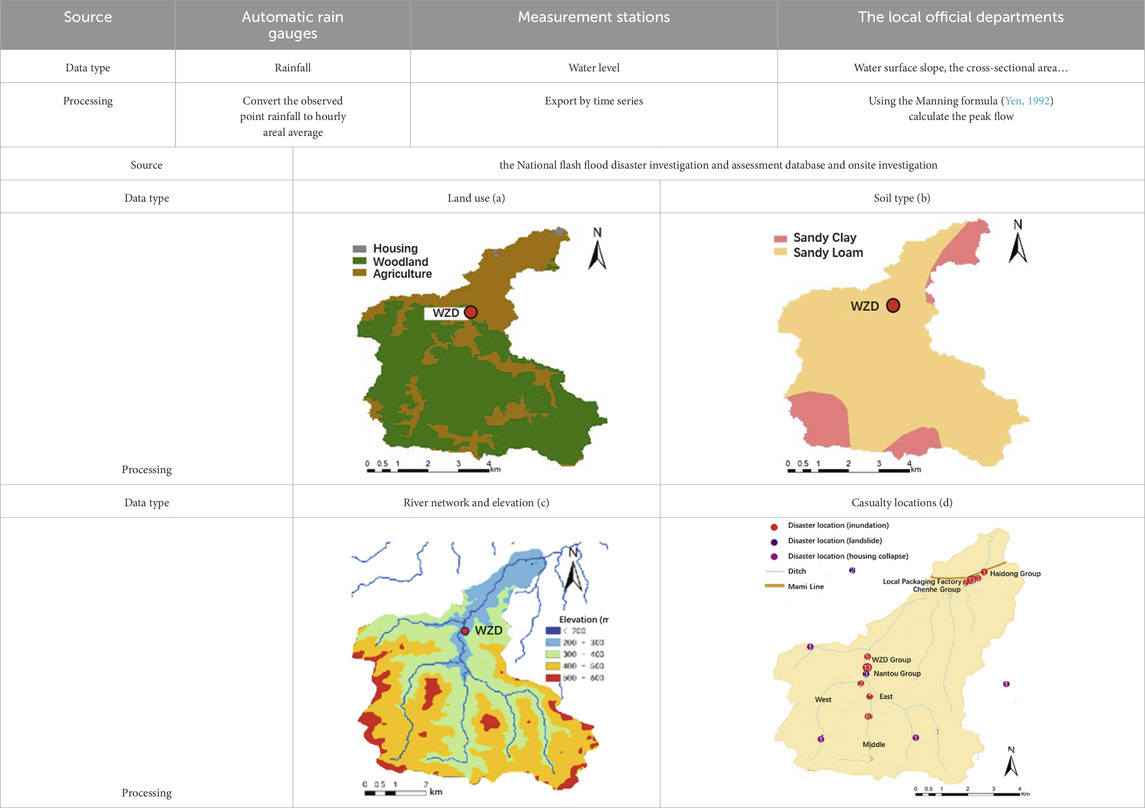
Table 1. Description and characterization of basic watershed attribute data.
The rainfall data were collected from automatic rain gauges where some were uploaded directly to the local flash flood early warning and response platforms, Then the inverse distance weighting method (Han and Bray, 2006) was employed to convert the observed point rainfall to hourly areal average. Based on the National flash flood disaster investigation and assessment database and onsite investigation, the basic attribute information of the watersheds was extracted, i.e., land use (Table 1 a), soil type (Table 1 b), river network and elevation (Table 1 c), casualty locations (Table 1 d), and generated the precious digital elevation model (DEM) with the resolution of 30 m and a series of orthophoto maps. These maps were processed in ArcGIS to convert into GIS-compatible format and the details of upstream and downstream watersheds and river networks including nodes were then extracted for generating the model environment.
In addition, the local official departments also provided some investigation data. One is located at the WZD community shown in Figure 2, which is based on the flood trace survey and onsite measurements carried out by Henan Provincial Bureau of hydrology and water resources. They found the values of water surface slope (0.006), the cross-sectional area (200 m2), the hydraulic radius (3.9 m) and riverbed roughness (0.05). Then the peak flow can be roughly calculated by using the Manning formula (Yen, 1992) as 768 m3/s. However, it should be noted that during such event, the flow conditions are highly turbulent and supercritical and the application of the calculation can only be a reference value with on-site investigation because many gauges for measuring water levels were destroyed. Henan Provincial Bureau of hydrology and water resources also carried out a survey in HGZ where the cross-section is located at the entrance of Chenhe Group about 1 km far away from Haidong Group. The ditch cross is almost straight where the riverbed is covered by a hard clay layer while both sides are very steep and made of soil, and the investigated discharge is 905 m3/s.
In this article, the model simulation was implemented by following a two-phase model strategy proposed by Hao et al. (2023). The first stage of the model strategy involves utilizing a distributed mountainous flood hydrological model to analyze the flood characteristics that triggered the disaster and to identify their sources. The second stage entails establishing a refined hydraulic model to simulate the flood process. The specific methodology is described in Figure 4.
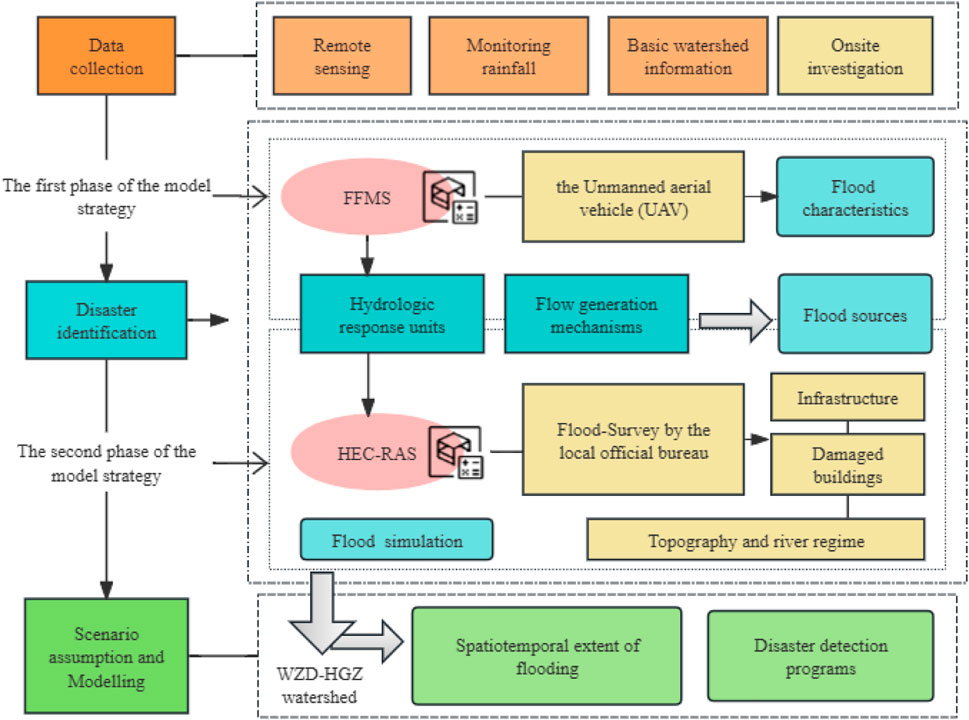
Figure 4. Research framework of post-disaster review strategy.
The hydrological model in first stage is the spatiotemporal variable-source hybrid flow model, which is a distributed model Flash Flood Modelling System (FFMS). The FFMS model’s flow generation model employs a spatiotemporal variable-source hybrid flow model, with the calculation process divided into four parts: super-permeable flow, full-storage flow, preferential flow, and base flow, where the slope-channel flow concentration model uses the kinematic wave method. The model calculations are conducted in both daily and hourly modes, with individual flood events calculated in hourly mode. Initially, hydrological response units are delineated based on the topographical and geomorphological characteristics of small and medium-sized basins, and the corresponding flow generation mechanisms are determined according to these units; through two major modules of spatiotemporal variable source and hybrid flow production, a planar, vertical, and temporal mixed flow production model is constructed, achieving the spatiotemporal transformation of super-permeable/full-storage flow in each geomorphological hydrological response unit. More details about the parameters of hydrological model and setup can be found in Hao et al. (2023).
The main parameters involved in this paper include flow production, variables in millimeters (precipitation, evaporation, upper soil moisture content, lower soil moisture content), calculation time step in seconds, evaporation coefficient (interception capacity in millimeters, average water storage in depressions in millimeters), infiltration coefficient, and soil water dynamic equilibrium parameters (such as soil leakage to the groundwater system m/d, linear coefficient of preferential outflow, etc.). This paper applies the FFMS model to the analysis of the spatiotemporal characteristics of floods. The spatiotemporal variable-source hybrid flow model judges the area changes of super-permeable and full-storage flow within the target unit based on the calculated values of water content and cumulative infiltration of different hydrological response units. It also discerns the relationship between the intensity of rainfall in the basin and the infiltration and storage capacity of the underlying surface, achieving the spatiotemporal transformation of super-permeable/full-storage flow in each geomorphological hydrological response unit.
In second stage, an open-source HEC-RAS model (Rangari et al., 2019; Kumar et al., 2020; Ongdas et al., 2020) was then largely built using the parameters proposed by the first stage hydrological model (Hao et al., 2023) and the flood survey of the local official bureau, i.e., Henan Provincial Bureau of Hydrology and Water Resources. The general process is as follows: According to the characteristics of the small watershed area, the flow production adopts the initial loss stable infiltration rate method, with required parameters being calibrated or calculated based on empirical values or reference values. The flow concentration method uses the Snyder unit hydrograph method in the parametric unit line method, determining the suitable unit line for the basin by calculating the characteristic values of the unit line through the Bernoulli equation. The base flow impact is not considered during the calculation process, and the river flow concentration calculation uses the kinematic wave method. Combined the disaster locations based on onsite investigation, several scenarios were proposed and setup for detecting the possible factors that can lead to the deaths. More details are described in Section 3.2 and 3.3 with the discussion of the results.
The results of transforming the rainfall at observation points in the WZD watershed (upper) during the “720 storm” event to hourly averages are shown in Figure 5A. It can be observed that the rainfall system during the period of 19 July 08:00 to 21 July 08:00 contributed the majority amount of rainfall where several peaks can be easily recognized. The maximum peak is observed to occur at 14:00 on 20 July, which exceeds 60 mm. And the 24-h accumulated maximum rainfall breaks local historical records and is around 500 mm. Figure 5B presents the hourly areal rainfall in HGZ (downstream). The rainfall system is similar to that in the upstream while the 24-h maximum is around 30 mm higher but the maxima of 6-h, 3-h and 1-h are slightly less than the upstream watershed.
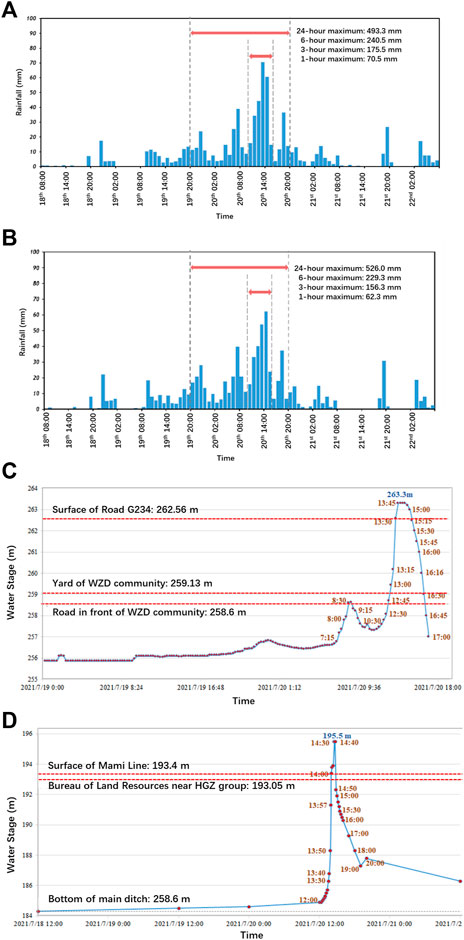
Figure 5. The rainfall during the event in WZD watershed (A) and HGZ watershed (B) and Temporal change of water level recorded at WZD community (C) and Haidong group (D).
Beside the rainfall, two measurement stations survived and are able to provide the record of water level during the event. One is located at the WZD community and it can be observed that the first peak occurred at 8:30, 20 July and just inundated the road surface in front of the building of the community (see Figure 5C), and the second peak reached a very high level of 263.3 m rapidly (only took about 1 h) and maintained the high for around 1 h. The other locates near the Haidong group in the HGZ watershed (see Figure 5D). Different from the situation in the upstream, the downstream flood only has one peak but with the same rapidly increasing rate as the second peak presented upstream. The flood began to increase at noon of 20 July with a very steep gradient and it took only two and half hours for the water level to rise from the bottom of the main ditch (184.3 m) to the peak (195.5 m) inundating Mami Line and the local bureau of land resources near Haidong group but locate relatively high in the area. The flood receded also fast in the first one and half hours and then gradually decreased to 186 m when the second rainfall event ceased.
The “720” rainstorm in Henan Province, China is observed to start from 8:00 on July 17 to 8:00 on 23 August 2021. The average rainfall in Zhengzhou city, the capital of Henan Province, is 534 mm with a total volume of around four billion m3, which is the highest observation since the local historical precipitation record was available. The average rainfall from 8 a.m. on July 17 to 8 a.m. on July 22 in Xingyang city is 574 mm, where the WZD-HGZ watershed suffered the most intensive rainfall. In order to reveal the rainfall characteristics, we extracted the 6-h accumulated rainfall before the first disaster event has been observed and presents in Figure 6. It can be seen that the highest accumulation is in the upstream watershed with the average of 190 mm while the downstream is relatively low, which is 165 mm in average.
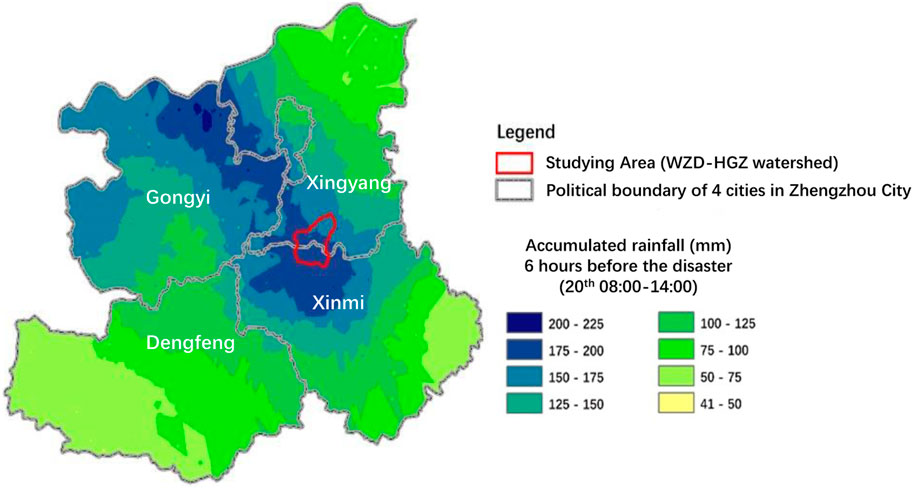
Figure 6. 6-h accumulative rainfall observed in the western mountainous area of Zhengzhou City (8:00–14:00 on July 20) where the studying area, i.e., the WZD-HGZ watershed, is marked within the red boundary.
Table 2 presents the comparison results of rainfall in the WZD watershed with historical records. In the upstream watershed controlled by WZD, the maximum rainfall intensities for 1 h, 6 h, and 24 h are 70.5 m, 240.5 m, and 493.3 m, respectively. In the downstream watershed controlled by HGZ, the maximum average rainfall intensities for 1 h, 6 h, and 24 h are 62.3 m, 229.3 m, and 526 m, respectively. Meanwhile, the measured maximum rainfall intensity for 1 h corresponds to a return period of approximately 20 years, while the 6-h maximum rainfall intensity corresponds to a return period of approximately 1,000 years. In the downstream area, the maximum 1-h rainfall intensity approaches a return period of approximately 10 years, while the 6-h rainfall intensity corresponds to a return period of approximately 500 years (Bureau, 2021).
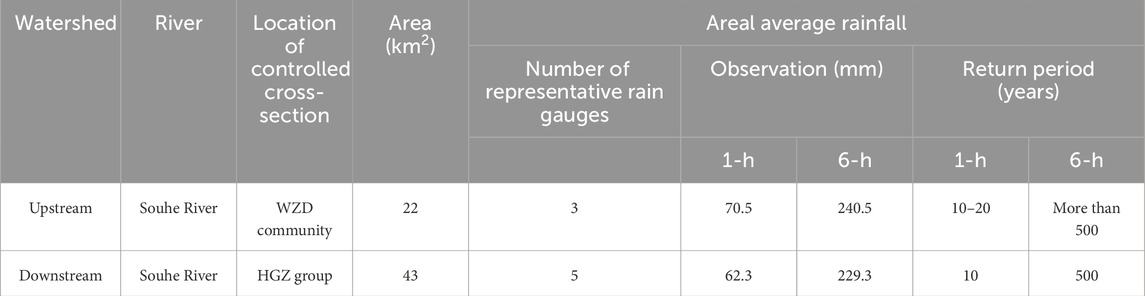
Table 2. Areal average rainfall analysis of the WZD-HGZ watershed.
Therefore, Combined the results with the onsite investigation (see Table 1; Figure 4), the rainfall characteristics in the WZD-HGZ watershed are as follows: Firstly, there is a large cumulative amount throughout the event, with a total rainfall of 764.5 mm, which is 4.9 times the annual average rainfall (156.5 mm). Secondly, the rainfall duration was long, spanning four to 5 days. Additionally, the rainfall intensity was high, with the maximum rainfall in a 6-h period on July 20 exceeding a 500-year return period event.
Based on the records from the water level station located near the WZD community (which was destroyed at 13:00 on July 20), and combined with relevant information from victim interviews, a hydrograph of the upstream WZD watershed was generated. This hydrograph is depicted in Figure 3C.The water levels before 13:00 are measured by the station while after 13:00 are estimated by the on-site survey. From 13:15 to 13:30, the flood depth at the cross-section increased by 7.15 m, with a maximum flow velocity of 2.4 m/15 m. At around 13:00, the flood inundated Road G234 with a maximum depth of 263.3 m. To identify the factors leading to the sudden increase in flood depth, combined with on-site investigations, it was found that in the WZD watershed, there are three concentrated drainage channels, with two casualty locations. One is located near Tangnao Bridge, where the embankment of the bridge suffered severe damage during the event. The other is near Nantou Cluster, where a landslide damaged the drainage channel (see Figure 7A). Therefore, to identify triggering factors, three different flood simulation scenarios were generated using the HEC-RAS model, as shown in Figure 7B:
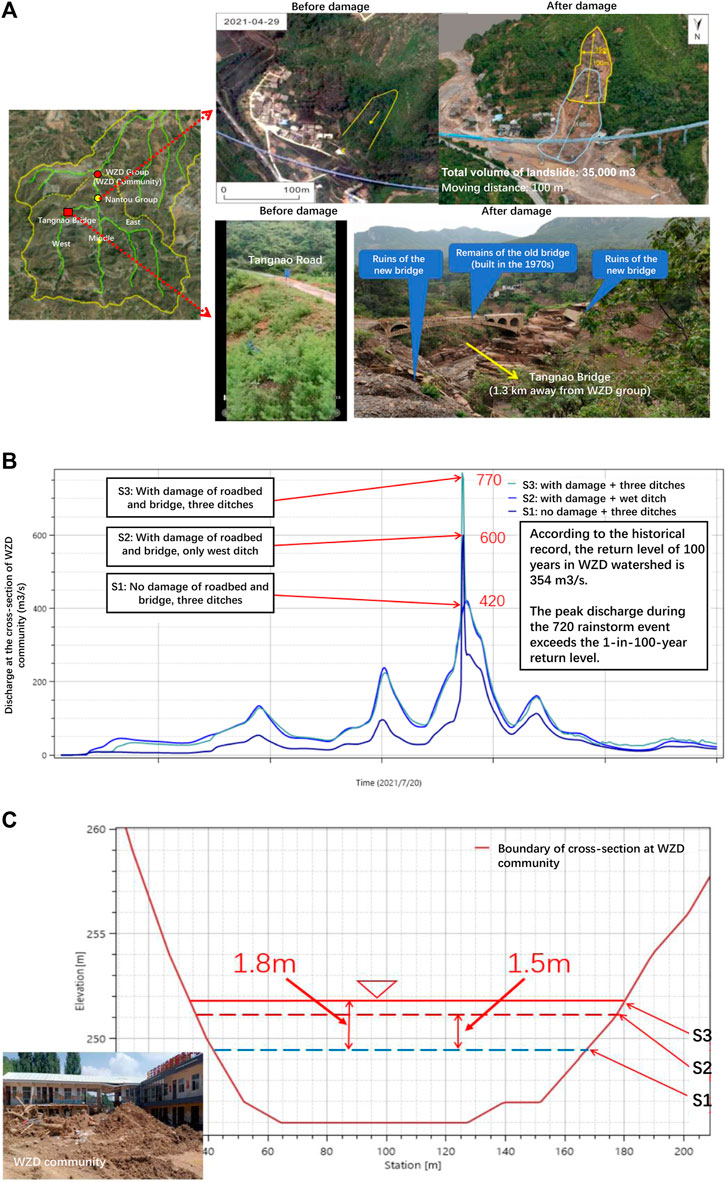
Figure 7. Onsite investigation: water block due to landslide, roadbed and bridge damage (A); discharge simulated at the cross-section of WZD community (upstream watershed) under three scenarios (B); water level corresponding to the peak discharge of three scenarios at the cross-section of WZD community (C).
The first scenario only considers the natural flow process of the three drainage channels, with a peak flow of 420 m3/s (as shown by the blue curve in Figure 7B), which matches well with the measured flow at the same cross-section. The second scenario accounts for water resistance caused by embankments, bridges, and landslides, assuming that only the West Channel triggers floods while the other two channels remain dry; with a peak flow of 600 m3/s (marked as the dark blue curve in Figure 7B). The third scenario considers both water resistance and concentration in the three drainage channels, with a peak flow of 770 m3/s (marked as the green curve in Figure 7B).
Comparing the simulation results of the three scenarios with the measured peak flow, it was found that the third scenario exhibited excellent consistency. Approximately 60% of the flow can be attributed to the higher peak flow caused by the convergence of the three drainage channels, while the remaining 40% can be attributed to the accumulation of debris blockages resulting from multiple damaged embankments, bridges, and landslides. Clearly, there is a noticeable spike in the peak flow rate once these drainage areas are cleared, as illustrated in Figure 7C. In contrast to the flood events typically triggered by intense precipitation, the water level at the WZD section saw an elevation of 1.8 m. Considering historical records and isohyet maps of heavy rainfall in Henan Province, the simulated peak flow corresponds to a return period of 200–300 years.
The results for the downstream watershed are as shown in Table 1c, Figure 8. The water level at Haidong Group rose by 11.2 m, with a maximum rising velocity of 2.1 m/3 m (from 13:57 to 14:00 on July 20). The highest water level reached 195.5 m, which is 2.1 m above the road surface of the Mami Line. The investigation revealed that, in addition to the substantial rainfall, the collapse of a nearby packaging plant also obstructed the river’s drainage. This blockage notably reduced the flow capacity of the two culverts located beneath the Mami Line, leading to a worsening of the disaster through the creation of a backflow effect. In the HGZ watershed, two scenarios are considered: one where the obstruction of the Mami Line causes backflow and one where it does not. Using the hydrological model, water levels were simulated for both scenarios with and without backflow at Haidong Group and the local packaging factory. It can be observed that the water levels at the two cross-sections increased by 4.2 m and 3.9 m, respectively. However, based on the measured value of 908 m3/s, the impact of backflow is limited. Meanwhile, at Chenhe Group, approximately 1 km away from Haidong Group, flooding is minimally or not affected by backflow due to the damage to the Mami Line. Furthermore, the first scenario captured the measured values: at Chenhe Group, a flow similar to that of a broad-crested weir was obtained, with a headwater level of 2.83 m, an average river width of 113.83 m, and a weir width of 70 m.
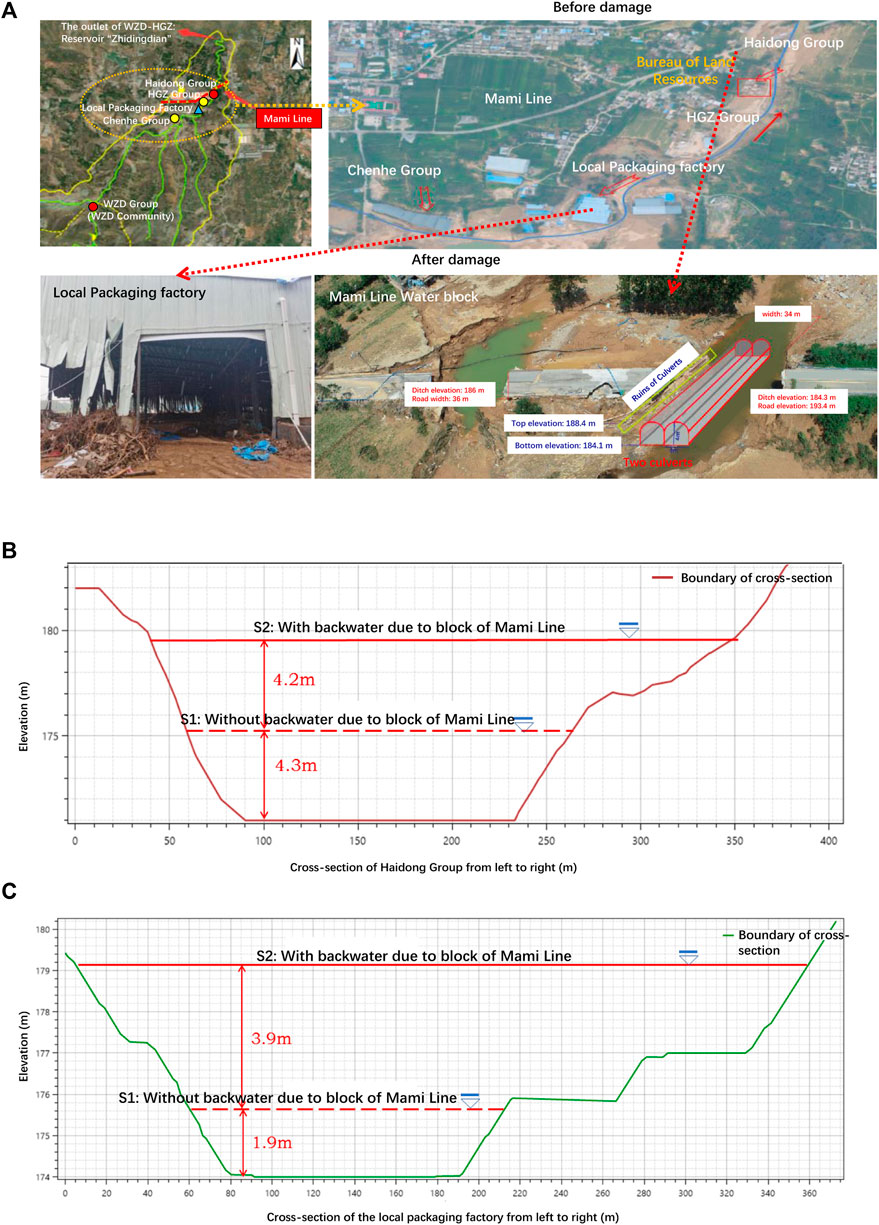
Figure 8. Onsite investigation: water block due to damage of factory and Mami Line (A); water level corresponding to the peak discharge at the cross-section of Haidong group (downstream watershed, (B) and local packaging factory (C) under two scenarios.
Based on on-site investigations, interviews with victims, and model simulations, the following explores the factors leading to the massive casualties in the WZD-HGZ watershed, summarized primarily into four aspects, as shown in Figure 9.

Figure 9. Underlying reasons identified in WZD watershed (A) and HGZ watershed (B).
Village WZD is located close to the confluence of the three ditches (East, Middle and West presented in Figure 1), with a short distance to the headwaters of these ditches. The special topography results in the simultaneous flooding in the single ditch and the soil slopes on both sides of the ditches. Besides, The flood flow velocity at the confluence is extremely high, reaching 6 m/s. Such landforms and fluvial dynamics complicate the precise functioning of flood surveillance, alert systems, and emergency responses, presenting considerable difficulties for evacuation initiatives in the area. In particular, the Nantou Group community in WZD village, located on the convex bank of the channel, was severely affected by the high-flow, high-speed flood, resulting in the destruction of many houses, with casualties accounting for over half of the villagers.
In WZD village, there are 31 embankments and silt dams of various sizes, among which only two have flood discharge capabilities, while eight silt dams and small reservoirs with a capacity of less than 100,000 m3 are unable to control floods. These infrastructures were damaged, severely blocking the upstream water sources. Due to heavy rainfall, 27 embankments, small reservoirs, and silt dams were continuously washed away, especially the embankment of the Tangnao Road, which is only 1.3 km away from the WZD group. Although the embankment height is 16 m, which is 50 m lower in elevation than the WZD group, the blocked water volume is 103,200 m3, resulting in a nearly 2-m increase in downstream flood depth and maintaining a high-water level on the road surface for about 3 h, greatly exacerbating the disaster in WZD village. To quantify the impact of damaged infrastructure, based on the on-site investigation on 5 September 2021, the simulation of the flood process in WZD, as shown in Figure 7, was conducted. It confirmed that the collapse of the Tangnao Road caused blockage, which is the main factor exacerbating the flood disaster in WZD village.
In the WZD community, the water level increase due to the damage to these infrastructures is 1.8 m compared to the normal rainfall runoff process, reaching a maximum of 7.5 m. Taking into account the natural convergence time of the three channels, the flood is expected to overflow the embankment of the Tangnao Road around 11 a.m., with the road collapsing completely by 1 p.m. The flood level begins to rise between 12:30 and 1 p.m., while the maximum rainfall intensity (58.5 mm/h) occurs between 2 p.m. and 3 p.m. In other words, the flood peak caused by the embankment damage occurs earlier than the flood peak caused by the rainfall-runoff response. Therefore, the sustained high-water level is not caused by intense rainfall.
Another factor is that buildings, roads, and bridges constructed along the channel were destroyed, leading to debris accumulation, which exacerbated the disaster by causing backflow. The buildings located in WZD Group were damaged seriously, which narrows the ditch by 21%. Several local factories are situated in the alluvial area of the ditch, which narrows the cross-section of the overflow by 71%. Besides, WZD village has three bridges, with small openings that severely limit the flow. These bridge openings are blocked by a large amount of sediment and floating debris carried by the water flow, such as branches, vehicles, and debris from buildings. Therefore, When a large amount of water is retained, if a blocked bridge collapses, the speed and depth of the released floodwaters rapidly increase, leading to downstream disasters.
According to the investigation, the railway line, Mami Line, crosses the Su River, standing 9.1 m above the downstream watershed channel. Below the railway surface, there are two culverts with the size of 4 × 4 m, which are designed for releasing water. However, during the rainstorm event, one culvert was blocked, which totally reduces the cross-section for passing flow by more than 90% and the discharge capacity is only 80 m3/s. Therefore, the peak flow rate (i.e., 908 m3/s) is trapped at the Mami Line, causing the water level to rise by approximately 4 m upstream, resulting in 4 deaths in the Haidong Group and 13 deaths in the factory. To quantify the impact of backflow, the cross-section with the highest number of casualties was chosen, and water levels were simulated considering both the blocked and unblocked scenarios of the Mami Line. Compared to the response of runoff to rainfall and flow rates, the flooding levels in the Haidong Group increased by 4.2 m due to backflow, while the flooding levels in the local materials factory increased by 3.9 m.
This disaster causing such serious consequences can be also attributed to the lack of public awareness of flash flood risk prevention. The local government did not realize that during heavy rainfall, infrastructure damage could block floodwaters, causing a sharp increase in flow and raising potential flood risk. Besides, the local management of flash flood risks was improperly implemented. During the revision of the management plan in 2021, several areas that could be affected by river flooding were even removed, increasing the number of residents facing risk. The flood risk management officials did not take timely action upon receiving the “immediate evacuation” warning, mainly evidenced by: (1) no warning was issued to the public near ditches and rivers in WZD Village; (2) residents in low-lying areas of Cuimiao Village were not forcibly evacuated, and local factories were only instructed to temporarily shut down without evacuating their employees. Therefore, the lack of disaster awareness, coupled with the slow response to warning information, should a congested bridge succumb to the pressure of the retained water volume, the consequent release results in a swift upsurge in both the velocity and depth of the floodwaters, exacerbated the scale of the disaster.
One automatic rain gauge recorded a 24-h rainfall of over 120 m in Xingyang City, reaching the “immediate evacuation” warning level, while the rainfall recorded by two other rain gauges did not reach the warning level. Thus, the Xingyang City Water Resources Bureau issued a warning to the public at 22:28 on 19 July 2021.
Although the Bureau issued a peer-to-peer warning of “immediate evacuation” 14 h in advance, the information did not convert into effective action, which leads to great casualties and economic loss. It is important not only to identify triggering factors as outlined in Section 3.3 but also to analyze the public’s attitude upon receiving the warning. In recent decades, many studies have explored the underlying reasons why the flood early warning system runs less effectively. For example, the World Meteorological Organization (WMO) released the “Flood Forecasting and Warning Manual” in 2014, which found that the local perspective and attitudes of people have a greater influence on outcomes than the technical aspects of flood forecasting and response systems. Ling and He (2020) applied social psychology theories, particularly persuasion psychology, to find that flood defense knowledge dissemination typically follows persuasive theories in conveying information to the public.
Flash flood warnings are an “end-to-end” operation, demanding high timeliness, which means a successful warning relies on the public’s awareness of defense measures. In the progress from issuing a warning to taking action, there are five psychological barriers needing to be removed, i.e., noticing the warning, understanding the warning, believing in the warning, remembering the warning and taking precautions or evacuation (see Figure 10). During on-site investigations, it was found that after the warning was issued, local officials and residents generally harbored doubts, primarily attributing this to the absence of severe floods in recent years. People lack basic knowledge about flash floods and how to prevent them, including preventative measures, with a particular shortfall in recognizing imminent local hazards and their specific locales. Besides, although many departments issued warnings, local personnel found it difficult to understand professional terms such as “implementing level three response” and “issuing level two warning,” increasing the difficulty of filtering the most valuable warning information. The aforementioned issues could potentially interrupt the chain illustrated in Figure 10, resulting in evacuation failure.

Figure 10. The chain of the transition from issuing a warning to taking precautionary or evacuation actions.
In addition, since the WZD-HGZ watershed locates in part of regions of Xingyang City and Xinmi City, where three locations (i.e., Village Wenzhuang of Xinmi City, Village WZD and Cuimiao of Xingyang City) along ditches observed serious casualties, it reveals that defending flood should be implemented in the unit of watershed rather than administrative region. To be detailed, firstly, the actual rainfall measurements in Xinmi City serve as real-time indicators for issuing alerts to neighboring cities, but the Xingyang City flood warning system struggles to capture this data. Additionally, the system can provide effective rainfall monitoring information from rain gauges in Xinmi City, which could enhance the rainfall data in the WZD-HGZ watershed. Secondly, there is no communication between administrative districts along the same river. In such a case, the flood propagation time in the WZD-HGZ watershed is approximately 40 min; evidently, information needs to be effectively transmitted between upstream and downstream areas.
The article focuses on the extraordinary heavy rainfall that occurred in Henan Province in 2021. Through on-site investigations, interviews with victims, remote sensing image analysis, hydrological model simulations, etc., it analyzes the characteristics of extreme rainfall and corresponding floods in the severely affected WZD-HGZ watershed. The study aims to explore the fundamental reasons for the severe casualties, and the specific conclusions are as follows.
1) The “720″heavy rainfall and flash flood in Henan were primarily caused by prolonged intense rainfall, which was exacerbated by the complex terrain, steep slopes, and human activities. The flood magnified in three main stages: runoff generation and concentration-induced flooding, continuous damage to the roadbed, and backwater effects caused by blockages of roads and bridges.
2) The reasons for the severe casualties and the difficulty in effective evacuation can be attributed to the confluence of floodwaters from three ditches, the rupture of the Tangnao Road roadbed in the west ditch, and water blockage caused by the Mami Line downstream in HGZ. The water blockage occurred before the peak rainfall arrived, causing the water level to remain high for an extended period. The rupture of Tangnao Road elevated the water level to around 2 m, and the rupture of the Mami Line raised the water level at local factories and the Haidong Group to about 4 m.
3) Considering both social psychology and watershed flood control, the article analyzes the evacuation and warning issuance mechanisms. It finds that the main reasons for the disruption in the chain from issuing a warning to taking preventive or evacuation actions are a lack of basic knowledge about flash flood risk prevention, unclear warnings, and insufficient guidance.
In conclusion, for ungauged basins, establishing an appropriate data monitoring network and developing a data quality assessment plan are crucial for enhancing flash flood risk management. Moreover, warnings must be conveyed in a manner that is both explicit and directive, enabling the public to respond effectively. Different departments should strengthen communication to ensure the continuity of the chain from issuing warnings to taking preventive measures or evacuation actions. Additionally, data quality should be further examined to improve simulation accuracy.
The original contributions presented in the study are included in the article/Supplementary Material, further inquiries can be directed to the corresponding authors.
BH: Data curation, Funding acquisition, Methodology, Writing–original draft, Writing–review and editing. CL: Methodology, Validation, Writing–original draft, Writing–review and editing. QY: Formal Analysis, Software, Writing–original draft, Writing–review and editing. HW: Project administration, Visualization, Writing–original draft, Writing–review and editing. LL: Writing–review and editing. MM: Funding acquisition, Methodology, Project administration, Supervision, Writing–review and editing.
The author(s) declare that financial support was received for the research, authorship, and/or publication of this article. This work was supported by the “Five talents” Plan of the China Institute of Water Resource and Hydropower Research (WH0145B062022), Jiangxi Province Technology Innovation Guidance Plan Project - National Science and Technology Award Reserve Project Cultivation Plan (20223AEI91008), and the National Natural Science Foundation of China (42371086, 42101086). This research was funded by National Key Research and Development Project “Key Technology Study and Demonstration on Warning for Rainstorm Triggered Flash Flood-Sediment Disaster” (No. 2019YFC1510700).
The authors also would like to thank Henan provincial bureau of hydrology and water resources for providing the data via the flood survey which authors participated in as well.
The authors declare that the research was conducted in the absence of any commercial or financial relationships that could be construed as a potential conflict of interest.
All claims expressed in this article are solely those of the authors and do not necessarily represent those of their affiliated organizations, or those of the publisher, the editors and the reviewers. Any product that may be evaluated in this article, or claim that may be made by its manufacturer, is not guaranteed or endorsed by the publisher.
Ashley, S. T., and Ashley, W. S. (2008). Flood fatalities in the United States. J. Appl. Meteorol. 47, 805–818. doi:10.1175/2007jamc1611.1
Billi, P., Alemu, Y. T., and Ciampalini, R. (2015). Increased frequency of flash floods in Dire Dawa, Ethiopia: change in rainfall intensity or human impact? Nat. Hazards 76, 1373–1394. doi:10.1007/s11069-014-1554-0
Burrell, E. M., and Eve, G. (2002). Flash flood mitigation: recommendations for research and applications. Glob. Environ. Change B Environ. Hazards 4, 15–22. doi:10.1016/s1464-2867(02)00011-6
Chen, G., Zhao, K., Lu, Y., Zheng, Y., Xue, M., Tan, Z. M., et al. (2022). Variability of microphysical characteristics in the “21·7” Henan extremely heavy rainfall event. Sci. China Earth Sci. 65, 1861–1878. doi:10.1007/s11430-022-9972-9
China, T. S. C. I. O. o. t. P. s. R. o. (2021). Press conference on flooding control and disaster mitigation in henan Province. Retrieved People’s Gov. Henan Prov. Available at: https://english.henan.gov.cn/2021/08-05/2196760.html.
Gan, B., Liu, X., Yang, X., Wang, X., and Zhou, J. (2018). The impact of human activities on the occurrence of mountain flood hazards: lessons from the 17 August 2015 flash flood/debris flow event in Xuyong County, south-western China. Geomatics, Nat. Hazards Risk 9, 816–840. doi:10.1080/19475705.2018.1480539
Han, D., and Bray, M. (2006). Automated Thiessen polygon generation. Water Resour. Res. 42. doi:10.1029/2005wr004365
Hao, S., Wang, W., Ma, Q., Li, C., Wen, L., Tian, J., et al. (2023). Model-based mechanism analysis of “7.20” flash flood disaster in wangzongdian river basin. Water 15, 304. doi:10.3390/w15020304
He, B., Huang, X., Ma, M., Chang, Q., Tu, Y., Li, Q., et al. (2018). Analysis of flash flood disaster characteristics in China from 2011 to 2015. Nat. Hazards 90, 407–420. doi:10.1007/s11069-017-3052-7
Kumar, N., Kumar, M., Sherring, A., Suryavanshi, S., Ahmad, A., and Lal, D. (2020). Applicability of HEC-RAS 2D and GFMS for flood extent mapping: a case study of Sangam area, Prayagraj, India. Environ. Earth Sci. 6, 397–405. doi:10.1007/s40808-019-00687-8
Ling, Y., and He, B. (2020). Psychological principle of flood control publicity education and early warning information dissemination (in Chinese). China Flood Control Drought Relief 30, 30–35. doi:10.16867/j.issn.1673-9264.2019212
Liu, S., Wang, J., and Wang, H. (2022a). Assessing 10 satellite precipitation products in capturing the july 2021 extreme heavy rain in henan, China. J. Meteorol. Res. 36, 798–808. doi:10.1007/s13351-022-2053-y
Liu, T., Wang, Y., Yu, H., and Chen, Y. (2022b). Using statistical functions and hydro-hydraulic models to develop human vulnerability curves for flash floods: the flash flood of the Taitou catchment (China) in 2016. Int. J. Disaster Risk Reduct. 73 (2022), 102876. doi:10.1016/j.ijdrr.2022.102876
Liu, Y., Huang, Y., Wan, J., Yang, Z., and Zhang, X. (2020). Analysis of human activity impact on flash floods in China from 1950 to 2015. Sustainability 13, 217. doi:10.3390/su13010217
Liu, Y., Qiu, H., Kamp, U., Wang, N., Wang, J., Huang, C., et al. (2024). Higher temperature sensitivity of retrogressive thaw slump activity in the Arctic compared to the Third Pole. Sci. Total Environ. 914, 170007. doi:10.1016/j.scitotenv.2024.170007
Martin, C., Isabelle, R., and Jonathan, J. G. (2013). Supplementing flash flood reports with impact classifications. J. Hydrol. 477, 1–16. doi:10.1016/j.jhydrol.2012.09.036
Mehdi, K., Alireza, S., and Bahram, S. (2018). Loss of life estimation due to flash floods in residential areas using a regional model. Water Resour. Manage 32, 4575–4589. doi:10.1007/s11269-018-2071-9
Meral, D. (2016). The October 2011 devastating flash flood event of Antalya: triggering mechanisms and quantitative precipitation forecasting. Q. J. R. Meteorol. Soc. 142, 2336–2346. doi:10.1002/qj.2827
Mónica, S., João, A. S., and Marcelo, F. (2017). Atmospheric driving mechanisms of flash floods in Portugal. Int. J. Climatol. 37, 671–680. doi:10.1002/joc.5030
Ongdas, N., Akiyanova, F., Karakulov, Y., Muratbayeva, A., and Zinabdin, N. (2020). Application of HEC-RAS (2D) for flood hazard maps generation for Yesil (Ishim) river in Kazakhstan. Water 12, 2672. doi:10.3390/W12102672
Papagiannaki, K., Kotroni, V., Lagouvardos, K., Ruin, I., and Bezes, A. (2017). Urban area response to flash flood–triggering rainfall, featuring human behavioral factors: the case of 22 october 2015 in attica, Greece. Weather Clim. Soc. 9, 621–638. doi:10.1175/wcas-d-16-0068.1
Paprotny, D., Sebastian, A., Morales-Nápoles, O., and Jonkman, S. (2018). Trends in flood losses in Europe over the past 150 years. Nat. Commun. 9, 1985. doi:10.1038/s41467-018-04253-1
Qiu, H., Su, L., Tang, B., Yang, D., Ullah, M., Yaru, Z., et al. (2024). The effect of location and geometric properties of landslides caused by rainstorms and earthquakes. Earth Surf. Process. Landforms 49, 2067–2079. doi:10.1002/esp.5816
Rangari, V. A., Umamahesh, N. V., and Bhatt, C. M. (2019). Assessment of inundation risk in urban floods using HEC RAS 2D. Model Earth Syst. Env. 5, 1839–1851. doi:10.1007/s40808-019-00641-8
Terti, G., Ruin, I., Anquetin, S., and Gourley, J. (2017). A situation-based analysis of flash flood fatalities in the United States. Bull. Am. Meteorol. Soc. 98, 333–345. doi:10.1175/bams-d-15-00276.1
Wang, H., and Xuan, Y. (2022). An area-orientated analysis of the temporal variation of extreme daily rainfall in great britain and Australia. Water 15, 128. doi:10.3390/w15010128
Xu, J., Li, R., Zhang, Q., Chen, Y., Liang, X., and Gu, X. (2022). Extreme large-scale atmospheric circulation associated with the “21·7” Henan flood. Sci. China Earth Sci. 65, 1847–1860. doi:10.1007/s11430-022-9975-0
Yang, D., Qiu, H., Ye, B., Liu, Y., Zhang, J., and Zhu, Y. (2023). Distribution and recurrence of warming-induced retrogressive thaw slumps on the central qinghai-tibet plateau. J. Geophys. Res. Earth Surf. 128, e2022JF007047. doi:10.1029/2022jf007047
Ye, B., Qiu, H., Tang, B., Liu, Y., Liu, Z., Jiang, X., et al. (2024). Creep deformation monitoring of landslides in a reservoir area. J. Hydrology 632, 130905. doi:10.1016/j.jhydrol.2024.130905
Zhang, Y., Wang, Y., Chen, Y., Liang, F., and Liu, H. (2019). Assessment of future flash flood inundations in coastal regions under climate change scenarios-A case study of Hadahe River basin in northeastern China. Sci. Total Environ. 693, 133550. doi:10.1016/j.scitotenv.2019.07.356
Keywords: flash flood, disaster-causing factors, mechanism, Henan, extreme rainstormFlash flood
Citation: He B, Li C, Yao Q, Wang H, Luo L and Ma M (2024) The disaster-causing factors of the flash floods for the July 20th extreme rainstorm in Henan, China. Front. Earth Sci. 12:1438421. doi: 10.3389/feart.2024.1438421
Received: 26 May 2024; Accepted: 20 June 2024;
Published: 19 July 2024.
Edited by:
Haijun Qiu, Northwest University, ChinaCopyright © 2024 He, Li, Yao, Wang, Luo and Ma. This is an open-access article distributed under the terms of the Creative Commons Attribution License (CC BY). The use, distribution or reproduction in other forums is permitted, provided the original author(s) and the copyright owner(s) are credited and that the original publication in this journal is cited, in accordance with accepted academic practice. No use, distribution or reproduction is permitted which does not comply with these terms.
*Correspondence: Han Wang, d2FuZ2hhbkBpd2hyLmNvbQ==; Meihong Ma, bWFtaEB0am51LmVkdS5jbg==
Disclaimer: All claims expressed in this article are solely those of the authors and do not necessarily represent those of their affiliated organizations, or those of the publisher, the editors and the reviewers. Any product that may be evaluated in this article or claim that may be made by its manufacturer is not guaranteed or endorsed by the publisher.
Research integrity at Frontiers
Learn more about the work of our research integrity team to safeguard the quality of each article we publish.