 Sherif M. Ali
 kamal Abdelrahman
- 1National Research Institute of Astronomy and Geophysics (NRIAG), Cairo, Egypt
- 2Preparatory Commission for the Comprehensive Nuclear-Test-Ban Treaty Organization (CTBTO), International Data Centre (IDC), Vienna, Austria
- 3Department of Geology and Geophysics, College of Science, King Saud University, Riyadh, Saudi Arabia
Seismic activity in Aswan is influenced by the complex interactions of tectonic plates, the accumulation of stress, and the presence of geological fault systems. It revealed that epicenters are well distributed along four fault segments in a conjugate pattern, indicating a prominent E-W compressional stress. This research aims to explore the characteristics of seismicity and seismotectonics, with a focus on assessing their implications for risk reduction and disaster management in this densely populated region. A data review from the Egyptian National Seismological Network (ENSN) identified 464 earthquakes occurred between 2000 and 2021, with local magnitudes ranging from 0.3 to 4.4, and depths up to 25 km. The calculated Gutenberg-Richter b-value is approximately 0.87 ± 0.05, indicating a gradual stress accumulation. The current analysis shows a more consistent level of moderate seismic activity, unlike previous studies in Aswan region that reported a wide range of b-values from 0.554 to 1.07. This suggests that while earlier research captured a wider range of seismic behaviors, recent data indicates a stabilization in earthquake frequency and intensity. Additionally, the fractal dimension (Dc) calculated at 1.57 ± 0.04 shows an intermediate level of complexity and reflecting a clustering pattern of earthquakes. The variations in the b-value with different magnitudes and depths signify the involvement of active smaller faults, responsible for earthquakes up to magnitude 2.2, which then transition to fractured zones inducing earthquakes up to magnitude 2.5. This transition is followed by a decline in seismic activity, indicating regions that are potentially more likely to experience larger earthquakes. Moreover, stress disparities at various depths contribute to smaller earthquakes within the 5–10 km depth range. Return period analysis suggests that the earthquakes of magnitude 3.7 or higher are expected to occur approximately once every decade in Aswan. These findings are of utmost importance for earthquake risk reduction, hazard assessment, and the sustainable development of Aswan area.
1 Introduction
To monitor the earthquakes in southern Egypt, the National Research Institute of Astronomy and Geophysics (NRIAG) setup two seismographs in Aswan and Abu Simbel in 1975. These installations were meant to detect smaller earthquakes that might go unnoticed (Egyptian National Seismic Network Lab, 2024). The seismic landscape in southern Egypt changed in 1981 after the 14th of November earthquake with a magnitude of MW = 5.3, which occurred to the southwest of Aswan city along the E–W Kalabsha fault. In response, NRIAG installed 13 telemetric short-period seismic stations in 1982 to create a local network around the Kalabsha fault and Northern Nasser Lake with a purpose to monitor the induced or triggered earthquake activities along the Kalabsha fault (Figure 1A), which is still happening in the region affected by the 14 November 1981, earthquake (Kebeasy et al., 1987; Telesca et al., 2017). Later on, many of these stations were upgraded to broadband sensors to improve monitoring capabilities. NRIAG has been in charge of setting up and running the Egyptian National Seismological Network (ENSN) since 1997. The earthquake information has been gathered from approximately 70 seismic stations located throughout Egypt via the ENSN (Ali and Badreldin, 2019).
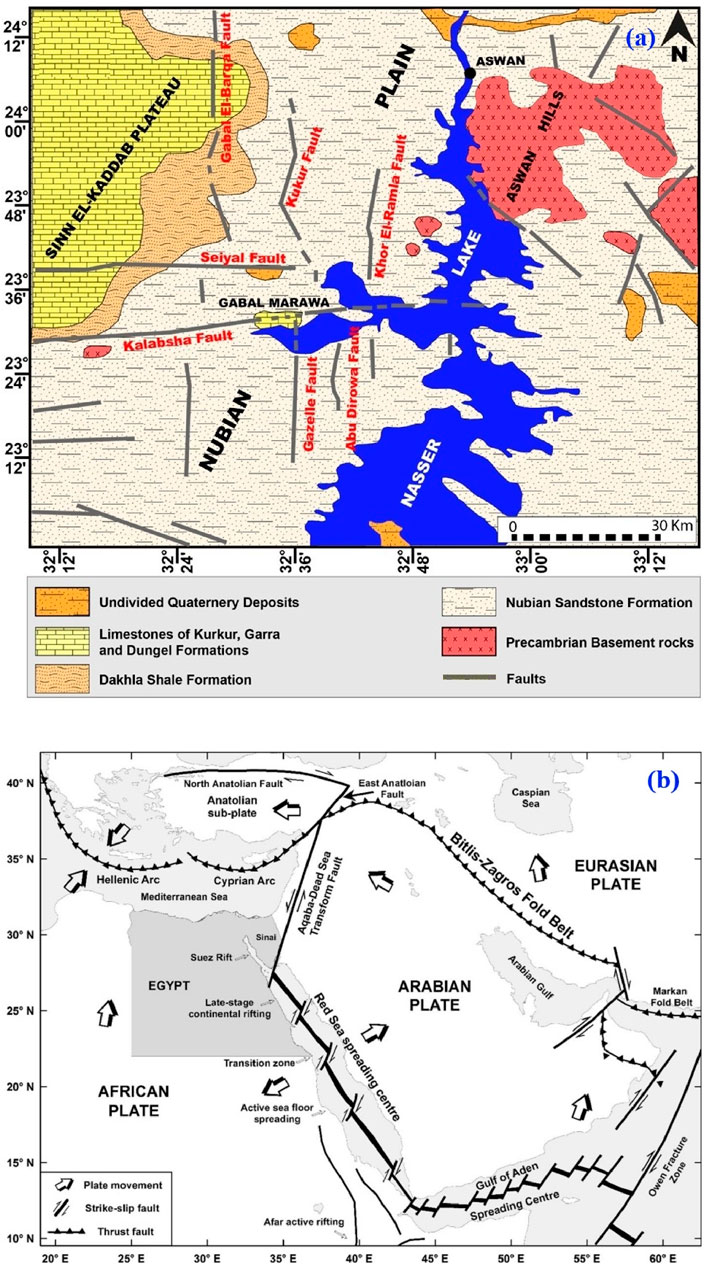
Figure 1. (A) Geology, geomorphology, and tectonic setting of Aswan region, modified after Egyptian Geological Survey and Mining Authority (1981). (B) Global tectonic sketch for Egypt and its vicinity (Sawires et al., 2015) [redrawn after Ghebreab (1998), Ziegler (2001) and Pollastro (2003)].
Aswan region lies within the broader African tectonic plate and is affected by the interactions of several major tectonic plates, including the African, Arabian, and Eurasian plates (Figure 1B). The Red Sea Rift, which is an extensional boundary formed by the divergence of the African and Arabian plates, passes near the Aswan Region. This geologically dynamic environment is conducive to earthquake activities, making the area a challenging subject of study for seismologists. Furthermore, this region is witnessing an increasing focus on economic development, including the construction of vital infrastructure such as dams, bridges, highways, and new urban communities. Understanding the region’s seismic activity is crucial for ensuring the resilience of these structures against potential earthquakes. Overlooking seismic risks could lead to significant destruction and delays in projects, endangering both investments and lives (Selim et al., 2002; Abou-Aly et al., 2014).
Abou Elenean (2003) conducted an analysis of the seismicity and stress regime in Aswan, with findings later expanded by Mohamed et al. (2012). The main conclusions are: (1) Seismic activity in Aswan is primarily concentrated in specific zones along distinct trends, with only a few shocks occurring far from known faults, potentially due to location inaccuracies; (2) The Kalabsha fault, trending E-W, and its eastern extension exhibit notable activity that aligns with the surface trace of the fault (Figure 1); (3) Seismic clusters are evident along N-S trending faults at the southern terminations of the Khur El Ramla and Kurkur faults, with lesser activity along the N-S Abu-Dirwa fault and the intersection of the Gabal El-Baraq and Syial faults; and (4) Small earthquakes cluster in the central region of Nasser Lake following an E-W direction and at the northern end of the Dabud fault, which is significant due to its extension towards the High Dam (Figure 1).
According to Woodward-Clyde Consultants, 1985, the Kalabsha fault is suggested to have a maximum recorded magnitude of Ms 7.0 based on its scarp features. Similarly, due to its resemblance to the Seiyal fault, it was also assigned a maximum magnitude of Ms 7.0. The Gabal El-Barqa fault, which is the most prominent among the north-south trending faults, is estimated to have a maximum magnitude of Ms 6.5 inferred from its scarp characteristics. The Kurkur fault was assessed to have a maximum magnitude of Ms 6.25, taking into account the faulted Quaternary deposits. On the other hand, the Khur El-Ramla fault, showing fewer signs of recent activity, is estimated to have a maximum magnitude of Ms 6.0. Consequently, the Aswan area may potentially face significant seismic events in the future (Deif et al., 2011).
This study aims to offer detailed and accurate statistical insights into local earthquakes in Aswan, utilizing data from the Egyptian National Seismological Network (ENSN). The dataset from ENSN catalogue was analyzed using the ZMAP software package (Wiemer, 2001). With the ZMAP application, the seismicity rate changes can be visualized and plotting areas of seismic quiescence. By examining the statistical progression of ENSN data, including parameters such as the b-value and fractal dimension (Dc-value), the seismotectonic characteristics of the area can be clarified (Ali and Abdelrahman, 2023; 2024). The b-value is an important parameter for assessing the probability of seismic risk and is closely linked to faulting mechanisms. For normal faults, the b-value is approximately 1.1, for strike-slip faults it is around 0.9, and for reverse faults, it is approximately 0.7 (Schorlemmer et al., 2005).
Additionally, this study investigates the geographical distribution of local earthquakes in Aswan region, focusing on identifying and characterizing the fault systems linked to earthquake occurrences. Understanding the geometry of fault zones is crucial for comprehending fault evolution and earthquake rupture mechanisms. By enhancing our knowledge of local tectonics through seismic analysis, the valuable insights for geological and tectonic research in the region can be increased. Moreover, the outcomes of this study are expected to significantly contribute to the development of a comprehensive earthquake hazard model tailored specifically for the Aswan region.
2 Geology and tectonic settings of Aswan region
Aswan region is underlain by a crystalline basement complex, which is primarily composed of igneous and metamorphic rocks such as granite, schist, and gneiss. These rocks are remnants of ancient geological processes and form the foundation of the region’s geology. Overlying the basement complex are sedimentary rock formations, including sandstones, siltstones, and mudstones, which were deposited by ancient rivers and lakes and provide important clues about the region’s geological history (Figure 1). The Nile River has played a significant role in shaping Aswan Region’s geological landscape by depositing fertile alluvial sediments over thousands of years, contributing to the region’s agricultural and industrial productivity. However, the construction of the Aswan High Dam has altered the flow of the Nile and the deposition of sediments in the region. These geological structures are critical in understanding the region’s seismic activity and the potential for earthquakes. Volcanic rocks are present in some areas of Aswan Region, providing insights into the region’s geological history and influencing local geological and geomorphological characteristics. Additionally, the region contains various mineral resources, including granite, which has economic significance and is widely used in construction and monument production. These mineral resources play a role in the region’s development.
The tectonic settings of Aswan in Southern Egypt are influenced by its location at the north-eastern edge of the African Plate, where it interacts with neighbouring plates. The presence of local and regional fault systems, including the East Aswan Fault and the influence of the East African Rift system, makes the region susceptible to earthquake activities.
Aswan region exhibits a distinct geological structural pattern characterized by a regional uplift of basement rocks and regional faulting (Issawi, 1969; Issawi, 1982; Issawi, 1987; El-younsy et al., 2010; Sawires et al., 2015). These faults can be classified into three categories based on their behaviour (Woodward-Clyde Consultants, 1985). The first group is the E-W trending faults such as the Kalabsha and Seiyal Faults, located to the west of Nasser Lake that was initiated by the construction of the High Dam in 1964 and spans over 500 km across Southern Egypt and northern Sudan). The Kalabsha Fault is a right-lateral strike-slip fault with a length of approximately 185 km. Its slip rate has been estimated to be 0.028 mm/yr. Similarly, the Seiyal Fault is similar in nature to the Kalabsha Fault (El-Shazly, 1977; Woodward-Clyde Consultants, 1985; Sawires et al., 2015; Saadalla et al., 2020). The second group is the N-S trending faults, which can be further divided into two main sets. The first set is situated to the northwest of Nasser’s Lake and comprises three faults: the Gebel El-Barqa Fault, the Kurkur Fault, and the Khur El-Ramla Fault. The Gebel El-Barqa Fault is a left-lateral strike-slip fault spanning a total length of 110 km. The Kurkur Fault, also a left-lateral strike-slip fault, exhibits relatively low seismic activity compared to its neighbouring faults. The Khur El-Ramla Fault, with a length of approximately 36 km, does not provide direct indications of its sense of movement. The second set of faults lies to the southwest of Nasser’s Lake and is primarily composed of two faults: the Abu Dirwa and the Ghazala Faults. The Abu Dirwa Fault is a left-lateral strike-slip fault measuring 20 km in length. It displays a very low degree of seismic activity. The third group is the fault system trending NNE-SSW, situated to the east of Nasser’s Lake. The Dabud Fault is the main fault within this group, which spans approximately 36 km in length. Geological evidence indicates a reverse-slip movement, contrary to the tectonic setting of the area (Sawires et al., 2015). Most of the local activity occur at the intersection points of the E-W and N-S fault systems. Notably, the 1981 Aswan earthquake occurred specifically along the E-W Kalabsha fault (Kebeasy et al., 1981; Hosny et al., 2014; Ali and Badreldin, 2019). Therefore, comprehending the behaviour and characteristics of these fault systems is crucial for assessing seismic hazards and ensuring preparedness in the region (Figure 1).
3 Seismicity in Aswan region
Earthquake activities in the northern part of Nasser Lake is notably concentrated in specific areas, including Gabal Marawa, East of Gabal Marawa, Kalabsha fault, Khor El-Ramla, Khur Kurkur, and the intersection area between the Saiyal fault and Kurkur fault. Additionally, the occurrence of earthquakes emphasizes the significance of the seismic activity in the Abu-Derwa fault, situated south of the Kalabsha fault. These areas represent key zones of seismic activity, as evidenced by the recurrent incidence of earthquakes in the northern part of Lake Nasser (Abou-Aly et al., 2014). Furthermore, in Aswan region, micro-earthquake activity is concentrated at the intersection of north-south and east-west faults within the lake. Telesca et al. (2017) identified two types of seismicity: deep (>12 km) seismicity clustered at the intersection of the east-west Kalabsha fault with north-south faults, and shallow (<12 km) seismicity. Some researchers have noted seismic activity migrating around the lake in the northeast direction. The relationship between seismic activity in the area and the water level of the Aswan reservoir has been the subject of numerous studies (Kebeasy et al., 1981; Simpson et al., 1990; Selim et al., 2002; Mekkawi et al., 2004; Haggag et al., 2008; Telesca et al., 2012; Gahalaut et al., 2016). Although there were times when there was no or only a weaker reservoir influence (Selim et al., 2002; Mekkawi et al., 2004; Telesca et al., 2012), it is generally accepted that reservoir-triggered seismicity (RTS) is one of the causes of the seismic activity in Aswan region. As a result, Aswan region is included in the group of reservoir sites that consistently exhibit annual or yearly triggered seismicity.
While seismic events in Aswan have historically occurred with predominantly lower magnitudes, some earthquakes displaying diverse intensities have been recorded. These include 17 January 1911: A seismic event, registering an estimated magnitude of approximately 5.5. This earthquake resulted in perceptible damage to both structures and infrastructure, and 15 April 1970, with magnitude of approximately 5.6. While not inducing widespread destruction, its garnered attention due to its noticeable impact on the region. On 20 May 1955, one of the region’s most significant earthquake events occurred with a registered magnitude of roughly 6.8, this earthquake was felt in several areas of Egypt, including Aswan. It caused damages to structures, leading to the collapse of certain buildings, and resulted in casualties and injuries. On 14 November 1981, the Aswan earthquake with the highest magnitude, Ms 5.3, struck. According to Kebeasy et al. (1987), the event appears to have occurred beneath Gebel Marawa on the Kalabsha fault. According to the special study of teleseismic records of the mainshock (Woodward-Clyde Consultants, 1985), the depth of the mainshock ranged from 18 to 20 km.
4 Data and analysis
In this study, the selected seismic event data in Aswan region, focusing on the most accurate recordings provided by the Egyptian National Seismological Network (ENSN). ENSN comprises a network of strategically positioned seismic monitoring stations across Egypt, including the Aswan region (Figure 2). The ENSN network includes a diverse range of recording stations, such as broadband seismometers, accelerometers, and strong-motion sensors, each designed to capture different aspects of seismic waves. These stations are distributed strategically throughout Egypt, with a focus on high-risk areas prone to seismic activity. The ENSN stations in the Aswan region were initially installed to investigate seismicity in the Naser Lake region and the triggered activities along the Kalabsha fault. Since this research aimed at providing a comprehensive analysis with full azimuth distribution then all the available records of the ENSN local network were used. Earthquakes with high uncertainty in locations and depths, very low magnitudes, or those detected by a very few stations with a poor azimuthal coverage have been excluded to ensure the reliability and precision necessary for the analysis. This rigorous selection process which retained only earthquakes recorded by at least five stations that comprised both P and/or S wave detections, ensures that the study relies on the most reliable and informative data available. Thus, by using this extensive dataset, the results are expected to maintain a high level of credibility and validity.
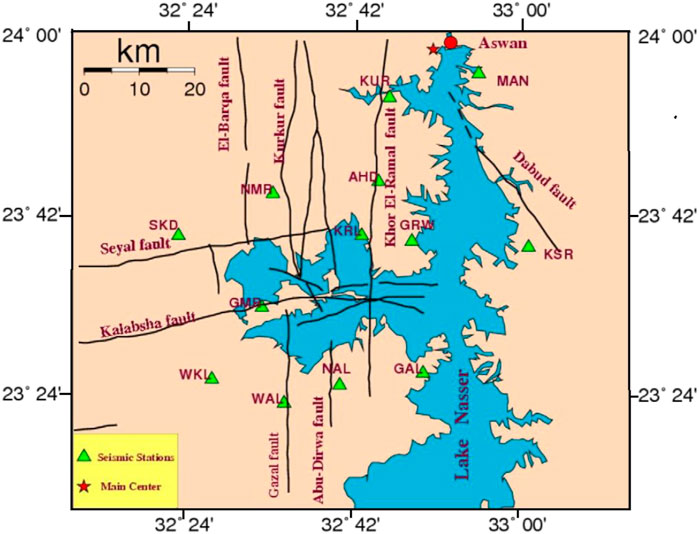
Figure 2. The Aswan seismic Network and the main faults in the region. The city of Aswan is indicated by the red circle.
The study area, which includes the Aswan region, spans the geographical coordinates between latitudes 23.2° N and 24.2° N, and longitudes 32.2° E and 33.2° E. Comprehensive data recorded using the Egyptian National Seismological Network (ENSN) incorporating information on 464 earthquakes, has been gathered for this specific area. The analysis focuses on seismic events that occurred between 2000 and 2021, with local magnitudes (mL) ranging from 0.3 to 4.4 and depths spanning from surface level to 25 km (Figure 3).
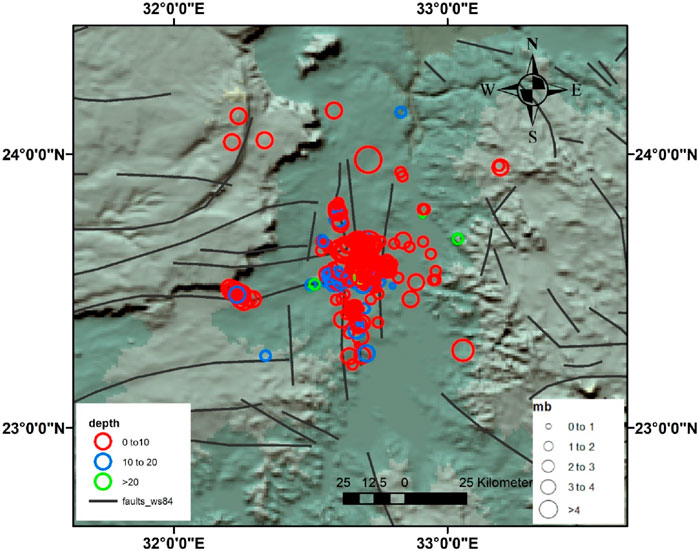
Figure 3. Topographic map showing the seismicity of Aswan region using ENSN data from 2000 until 2021. The size of the circles is proportional to magnitude.
4.1 Gutenberg-Richter b-value
The seismic b-value, first described by Gutenberg and Richter, 1944, represents the relationship between the size of earthquakes and how often they happen. It provides insights into stress in the Earth’s crust and is crucial for understanding seismic activity stages. Accurate b-value estimates are essential for reliable seismic hazard assessments. (Scholz, 1968; Wyss, 1973; Ali and Abdelrahman, 2022). The frequency of earthquakes of various sizes in a region can be represented by a specific formula (Equation 1):
Here,
Abdel-Monem (2005) conducted an analysis of seismic data recorded by the Aswan Seismic Network, estimating the b-value for Aswan region as b-value =
4.2 Fractal dimension
The fractal nature of the spatial distribution of earthquake epicenters has been demonstrated by various researchers, including Kagan and Knopoff, 1980; Ali and Abdelrahman, 2023; 2024). The characterization of earthquake epicenter distribution involves the application of the correlation dimension (Kagan and Knopoff, 1980; Hirata, 1989), a metric assessing the spacing or clustering features within a set of sites. Examining the spatial clustering and irregularity of earthquake distribution within specific regions is accomplished through the assessment of the spatial fractal dimension (DC). Different locations and fault systems may exhibit distinct fractal dimensions, reflective of their unique tectonic and geological properties. Additionally, factors such as data accuracy and completeness can influence the computed fractal dimension. Consequently, a smaller fractal dimension corresponds to reduced spatial clustering, and vice versa. In this study, the correlation integral method was employed for fractal analysis (Grassberger et al., 1983). According to Grassberger et al., 1983, the correlation integral (C(R)) for a set of N earthquakes is defined as follows (Equation 2):
where,
Here,
The correlation integral, theoretically expressed as
where,
5 Results and discussion
According to the catalogue issued by the Egyptian National Seismological Network (ENSN), the earthquake events in Aswan region reveals 464 earthquakes spanning the period from 2000 to 2021. The local magnitudes (mL) of these earthquakes ranged from 0.3 to 4.4, and their depths varied from surface level to 25 km (Figure 4). A cumulative moment release analysis, applied to the compiled seismic data, highlights earthquakes with the most significant impact on the study area (Figure 5). The evolution of seismic activity levels from 2000 to 2016 remains consistent, with only minor deviations noted in 2000, 2004, and 2010 (Figure 5). Sequences of moderate earthquakes affected the area in 2000, 2002, 2004, 2010, 2013, and 2016, contributing to an increase in the cumulative moment number over time. The time series graph (Figure 5) reveals an increase in seismic activity after 2016, potentially attributed to expanded seismic network coverage, advancements in data analysis software, and the observation of moderate seismic events with magnitudes of 4.0 and higher. The graph illustrates earthquakes associated with abrupt shifts in the cumulative moment curve, particularly those with magnitudes above ml=3.3. The most significant earthquakes, each with a magnitude of 4.0 or higher, have occurred on 16 October 2000 (ml=4.2), 18 October 2000 (ml=4.4), 07 November 2010 (ml=4.6), and 19 September 2016 (ml=4.0).
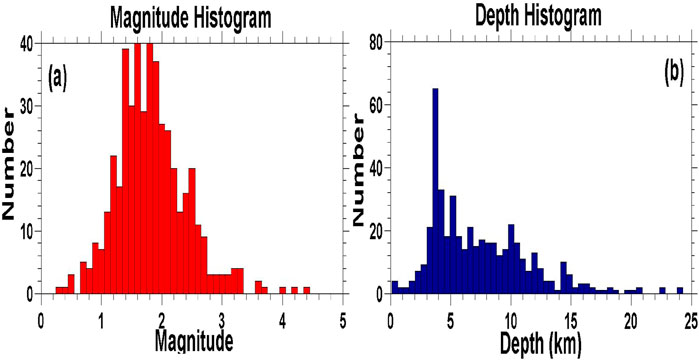
Figure 4. (A) The seismic events’ Magnitude Histogram ranging from 0.3 to 4.4 in Aswan region. (B) The Depth Histogram represents earthquakes with depths ranging from 0 to 24 km in Aswan region.
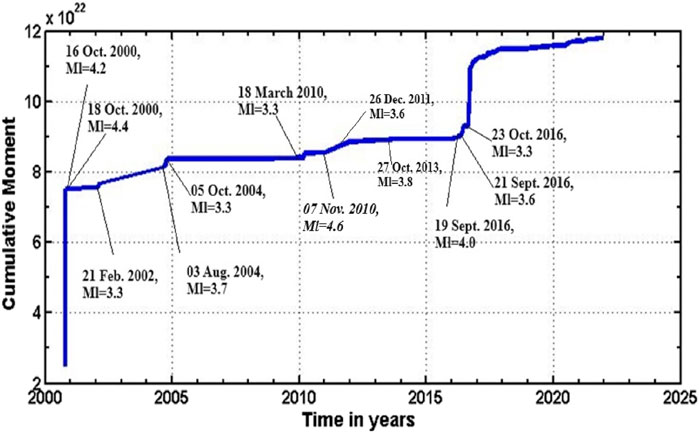
Figure 5. Cumulative moment release analysis of earthquakes in the Aswan region from 2000 to 2021, using ENSN data. The figure highlights earthquakes with the most significant impact on the study area.
The estimation of the earthquake distribution of the b-value and fractal dimension (Dc) has been carried out using the magnitude–frequency relation of Gutenberg and Richter (Equations 1, 2). The analysis conducted using the ZMAP software package accessible at http://www.earthquake.ethz.ch/software/zmap (Wiemer, 2001), indicates that predominant activity is concentrated within magnitudes ranging from 1.3 to 1.9. Previously, the evaluation of a seismic network’s performance was primarily based on the threshold magnitude or what is called the magnitude of completeness (Mc) (Wiemer and Wyss, 2000). This was determined by finding the point of maximum curvature on the frequency-magnitude curve. In practical, this aligns with the magnitude bin with the highest frequency of events in the cumulative frequency-magnitude distribution (illustrated by triangle symbols in Figure 6). In this study, we utilized parameters derived from the deviation of the earthquake frequency-magnitude distribution from the Gutenberg-Richter law to assess the ENSN Network’s performance. The established threshold magnitude is 1.5, and dominant depths are 5 km or shallower, as inferred from frequency-magnitude statistics.
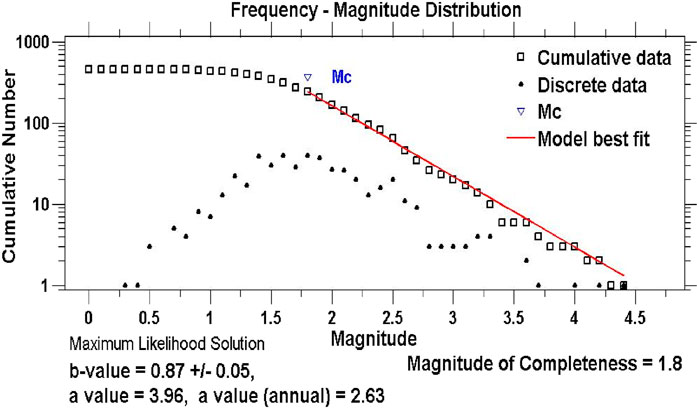
Figure 6. Frequency-Magnitude distribution determined using the maximum curvature technique. Mc represents the cut-off magnitude. Squares and triangles illustrate the cumulative earthquakes corresponding to each magnitude value and the respective earthquake numbers.
Through seismicity analysis of Aswan, the estimated b-value using the selected events with a magnitude greater than Mc is determined to be b = 0.87 ± 0.05 (Figure 6). This aligns more closely with the findings of recent studies, showing temporal fluctuations between 0.55 (Ali, 2016) and 0.629–0.9 (Mostafa and Mohamed, 2021), 0.95 (Mostafa et al., 2018), 1.065 (Abdel-Monem, 2005), 1.07 (Telesca et al., 2017) to 0.97–1.09 (Deif et al., 2011), indicating a moderate accumulation of stress. The indication of a low b-value suggests an elevated likelihood of more substantial magnitude earthquakes, aligning with the findings of Ali (2016). According to Scholz (1968) and Wyss (1973), low b-values are associated with periods of heightened shear or effective stress. The examination of this global value and its distribution map unveils a seismic activity that is moderate, frequent, and uniformly spread across Aswan region. To comprehend the spatial arrangement of cluster epicentres exhibiting a fractal structure, the study introduces the concept of fractal along with associated notions of self-similarity and scale invariance.
The Frequency Magnitude Distribution (FMD) chart (Figure 6) visually displays data analysis aspects, typically using a straight line to represent the Gutenberg-Richter frequency-magnitude relationship’s best fit. Squares on the chart mark actual data points for specific magnitude ranges, while triangles indicate estimated cumulative frequencies or derived data points. The slope of this line, known as the b-value, is essential for interpreting regional seismic characteristics, with a steeper slope suggesting more frequent smaller earthquakes. Each square corresponds to a magnitude interval, showing earthquake counts within that range during the study period. Triangles help researchers evaluate the Gutenberg-Richter model’s accuracy across all magnitudes, especially with limited data. This aids in spotting any discrepancies between observed data (squares) and model predictions (line). Anomalies in the linear trend, like a curve flattening at lower levels, as shown by the arrangement of triangles and squares, could indicate potential problems with the magnitude of completeness (Mc) or a shift in seismic activity, such as seismic quiet periods or swarm behavior.
The ZMAP provides the capability to map the b-value with magnitude and depth by choosing a portion of the earthquake catalog that exhibits reasonable homogeneity in terms of space, time, and magnitude range. To ensure accuracy, any unsuitable sections of the catalog and aftershocks are eliminated by substituting each earthquake cluster with an equivalent event through the application of the declustering method introduced by Reasenberg (1985). The b-value variations across different magnitude ranges (Figure 7) highlight the dynamic nature of crustal stress and faulting processes, providing insights into earthquake generation and seismic risk. These fluctuations reflect the crust’s heterogeneity, stress variations, faulting mechanisms, and depth-dependent rock properties. Initially, a smooth increase in b-value up to magnitude 2.2 suggests smaller earthquakes become relatively more frequent, likely due to small-scale fractures or stress release through numerous small quakes, indicating active smaller faults. An abrupt b-value rise from 2.2 to 2.5 signals a shift to more fractured crust zones, leading to smaller to medium earthquakes, possibly marking a critical stress threshold or changes in rock mechanics. Conversely, a sharp b-value fall above magnitude 2.5 to 2.8 denotes more large earthquakes, hinting at areas capable of larger ruptures due to larger fault structures or stress zones. This phase might represent a brittle regime with significant seismic events. Finally, b-value increases above 2.8 suggesting a return to dominance by smaller fracturing processes or an adjusted crust, highlighting the importance of local geological conditions in seismic hazard analysis and data interpretation. Figure 8 illustrates the changes in b-values concerning earthquake depth, influenced by factors such as alterations in network operations, seismic station distribution, and earthquake occurrence across different magnitude intervals. The specific increase in b-value between 5–10 km can indicate a zone of relatively lower stress or higher fracture heterogeneity, facilitating the occurrence of smaller earthquakes, while decreases below and above this range suggest regions of higher stress capable of generating larger earthquakes. High b-values suggest a highly heterogeneous or weak upper crust prone to brittle failure under lower stress (Lowrie, 1997; Wason et al., 2002). Consistent with previous studies (Gerstenberger et al., 2001; Wiemer and Wyss, 1997), shallower regions generally have higher b-values, indicating low stress, while the area below 5 km, showing lower b-values, suggests a high-stress environment conducive to large earthquakes and capable of sustaining larger ruptures.
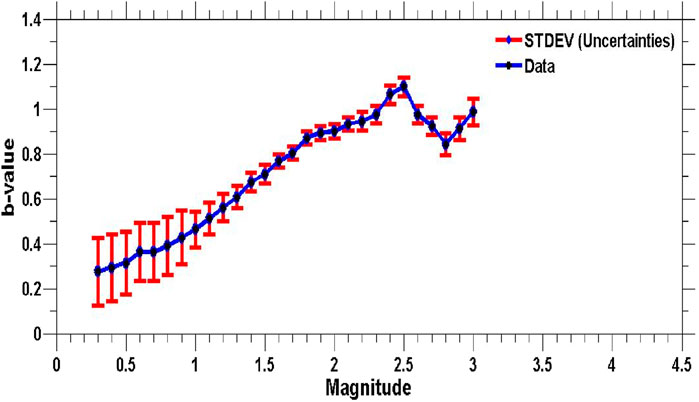
Figure 7. The variations of b-values with magnitude.
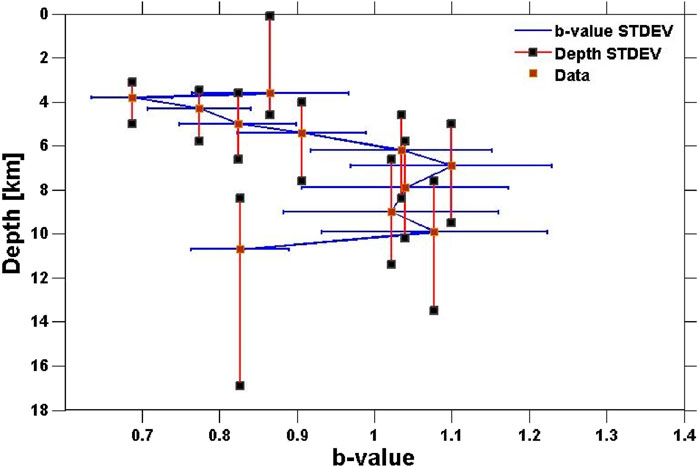
Figure 8. The average b-values versus the earthquake depths.
Figures 9, 10 display the calculated annual probabilities and return periods for earthquakes of varying magnitudes. The data shows that annual probabilities for earthquakes with magnitudes over 3.0 are generally below 1 (Figure 9). Earthquakes with magnitudes between 3.0 and 4.1 have associated return periods between 2 and 20 years. For earthquakes with magnitudes from 4.1 to 4.5, the recurrence periods extend from 20 to 40 years. Additionally, for magnitudes between 4.5 and 4.9, the recurrence periods are determined to be between 40 and 100 years, and for earthquakes of magnitudes 4.9 or higher, the recurrence periods exceed 100 years (Figure 10). This analysis suggests that an earthquake with a magnitude of at least 3.7 is expected to occur roughly once every decade.
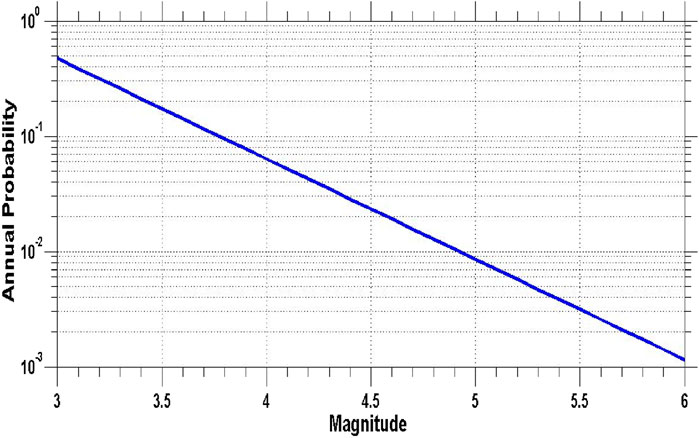
Figure 9. Annual probabilities of all earthquakes in various levels of magnitudes.
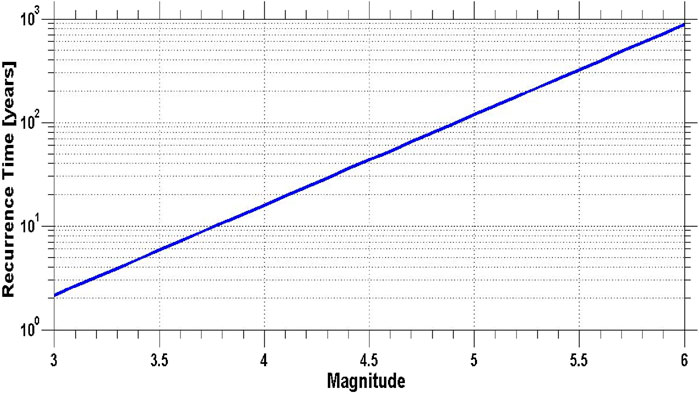
Figure 10. The recurrence interval for all earthquake with different magnitudes.
The fractal dimension (DF) is considered as an indicator of complexity in a magnitude data time series. The moderate seismic activity in Aswan region has prompted the application of the relationship DF = 2b, resulting in DF = 1.6. This implies a level of complexity that falls between the topological dimensions of 1 and 2, indicating an intermediate degree of complexity. This aligns with the average data complexity and non-uniform distribution of epicenters. However, it is noted that the fractal dimension (DF) does not fully account for the clustering mode in the spatial distribution of epicenters. To address this limitation, an alternative fractal dimension, the correlation dimension (DC), is proposed. Graphically estimated, the value of DC is found to be 1.57 ± 0.04 (Figure 11), and it is observed that DF and DC are substantially equivalent. This equivalence indicates that the clustering mode of earthquakes in Aswan exhibits a distribution that is not highly complex.
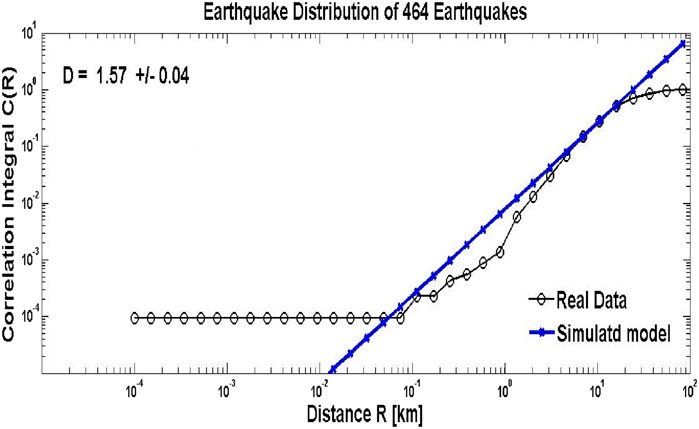
Figure 11. Estimation of the fractal correlation dimension in Aswan region, revealing a dimension value of 1.57.
For Aswan earthquakes, the spatial fractal dimension was estimated as 1.57 ± 0.04 from the double-logarithmic plot of the correlation integral and hypocentre distance (Figure 11). The
6 Conclusion
Analyzing seismic events in the Aswan region from 2000 to 2021, covering 464 earthquakes, provides valuable insights into the moderate seismic activity in the region. The earthquakes ranged in local magnitude from 0.3 to 4.4, with depths up to 25 km. Most seismic activity falls within the magnitude range of 1.3–1.9, particularly concentrated at depths of 5 km or less. Cumulative moment release analysis shows a consistent evolution in seismic activity levels, with occasional minor fluctuations in specific years. Furthermore, there is a noticeable increase in seismic activity post-2016, possibly attributable to improved network coverage, advanced data analysis tools, or the detection of moderate seismic events with magnitudes of 4.0 and above.
Examining the b-value and fractal dimension provides additional depth to our understanding, indicating a moderate accumulation of stress and a low b-value, suggesting a higher probability of more significant seismic events. Seismic activity dynamics can be observed through variations in b-values across different magnitude ranges. A gradual increase in b-values up to local magnitude 2.2 indicates the presence of active smaller faults, while a sudden rise to ml=2.5 suggests fractured crust zones. Above 2.5 magnitudes, there is a sharp decline in b-values, indicating areas that are prone to larger ruptures. Additionally, changes in b-values with depth highlight zones where stress variation occurs, suggesting smaller earthquakes to occur at depths of 5–10 km. Additionally, return period analysis reveals that earthquakes of magnitude 3.7 or higher tend to occur approximately once every decade. The spatial fractal dimension, estimated at 1.57 ± 0.04, suggests an intermediate degree of complexity in the clustering mode of earthquakes. The correlation between fractal dimension (DC), and b-value aligns well with established statements, validating the association between regional stress conditions, energy release patterns, and spatial complexity in Aswan seismicity. These findings contribute significantly to the comprehension of the seismic dynamics in Aswan region, emphasizing the need for continued monitoring and research efforts.
Data availability statement
The original contributions presented in the study are included in the article/supplementary material, further inquiries can be directed to the corresponding authors.
Author contributions
SA: Conceptualization, Data curation, Formal Analysis, Investigation, Methodology, Writing–original draft, Writing–review and editing. KA: Conceptualization, Formal Analysis, Funding acquisition, Investigation, Supervision, Visualization, Writing–original draft, Writing–review and editing.
Funding
The author(s) declare that financial support was received for the research, authorship, and/or publication of this article. The Researchers Supporting Project number (RSP 2024R351), King Saud University, Riyadh, Saudi Arabia.
Acknowledgments
The authors are grateful to the Editor in Chief and the reviewers for their critical reviews. The authors would like to express their gratitude and appreciation to the Egyptian National Seismological Network (ENSN) for providing the earthquake catalog used in this study. The Generic Mapping Tools developed by Wessel and Smith (1998) were used for the data mapping. Deep thanks and gratitude to the Researchers Supporting Project number (RSP 2024R351), King Saud University, Riyadh, Saudi Arabia for funding this research article.
Conflict of interest
The authors declare that the research was conducted in the absence of any commercial or financial relationships that could be construed as a potential conflict of interest.
Publisher’s note
All claims expressed in this article are solely those of the authors and do not necessarily represent those of their affiliated organizations, or those of the publisher, the editors and the reviewers. Any product that may be evaluated in this article, or claim that may be made by its manufacturer, is not guaranteed or endorsed by the publisher.
Author Disclaimer
The views expressed herein are those of the authors and do not necessarily reflect the views of the CTBTO Preparatory Commission.
References
Abdel-Monem, M. S., Mohamed, H. H., Saleh, M., and Abou-Aly, N. (2012). Seismicity and 10-years recent crustal deformation studies at aswan region, Egypt. Acta Geodyn. Geomater. 9 (2), 221–236.
Abdel-Monem, S. M. (2005). Using compiled seismic and GPS data for hazard estimation in Egypt. NRIAG, J. Geophys. 4 (1), 51–79.
Abou-Aly, N., Abdel-Monem, S., and Saleh, M. (2014). Pre- and post-seismic displacements Associated with the Aswan 2011 earthquake (M=4.2) derived from recent geodetic GPS data. Arab. J. Geosci. 7, 2547–2557. doi:10.1007/s12517-013-0894-5
Abou Elenean, K. M. (2003). Focal mechanism and stress tensor inversion of earthquakes at and around Nasser Lake, Egypt. Bull. Fac.Sci.,Zagazig Univ. 25 (1), 77–107.
Aki, K. (1981). “A probabilistic synthesis of precursory phenomena,” in Earthquake prediction: an international review. Editors D. W. Symposium, and P. G. Richards (Washington, DC: AGU), 566–574.
Ali, S. M. (2016). Statistical analysis of seismicity in Egypt and its surroundings. Arab. J. Geosci. 9, 52. doi:10.1007/s12517-015-2079-x
Ali, S. M., and Abdelrahman, K. (2022). Earthquake occurrences of the major tectonic terranes for the arabian shield and their seismic hazard implications. Front. Earth Sci. 10, 851737. doi:10.3389/feart.2022.851737
Ali, S. M., and Abdelrahman, K. (2023). The impact of fractal dimension, stress tensors, and earthquake probabilities on seismotectonic characterisation in the Red Sea. Fractal Fract. 7, 658. doi:10.3390/fractalfract7090658
Ali, S. M., and Abdelrahman, K. (2024). Analysis of the fractal dimension, b-value, slip ratio, and decay rate of aftershock seismicity following the 6 february 2023 (mw 7.8 and 7.5) türkiye earthquakes. Fractal Fract. 8, 252. doi:10.3390/fractalfract8050252
Ali, S. M., and Akkoyunlu, M. F. (2022). Statistical analysis of earthquake catalogs for seismic hazard studies around the Karliova Triple Junction (eastern Turkey). J. Afric. Earth Sci. 186, 104436. doi:10.1016/j.jafrearsci.2021.104436
Ali, S. M., and Badreldin, H. (2019). Present-day stress field in Egypt based on a comprehensive and updated earthquake focal mechanisms catalog. Pure Appl. Geophys. 176, 4729–4760. doi:10.1007/s00024-019-02262-9
Deif, A., Hamed, H., Ibrahim, H. A., Abou Elenean, K., and El-Amin, E. (2011). Seismic hazard assessment in Aswan, Egypt. Egypt J. Geophys Eng. 8, 531–548. doi:10.1088/1742-2132/8/4/006
De Rubeis, V., Dimitriu, P., Papadimitriou, E., and Tosi, P. (1993). Recurrent patterns in the spatial behaviour of Italian seismicity revealed by the fractal approach. Geophys. Res. Lett. 20 (18), 1911–1914. doi:10.1029/93gl01889
Dimitriu, P. P., Papadimitriou, E. E., Papazachos, B. C., and Tsapanos, T. M. (1993). Global study of the distribution of earthquakes in space and in time by the fractal method. Proc. 2nd Congr. Hellenic Geophys. Union 1 (5–8), 164–174.
Egyptian Geological Survey and Mining Authority (1981). Geologic map of Egypt 1:2000000. Cairo: EGSMA.
Egyptian National Seismic Network (ENSN) Lab (2024). NRIAG. Available at: https://www.nriag.sci.eg/seismic/seismological-network-2/(Accessed April, 2024).
El-Shazly, E. M. (1977). “The geology of the Egyptian Region,” in The Ocean Basin and margins. New York: Plenum, 397–444.
El-Younsy, A. R. M., Ibrahim, H. A., Senosy, M. M., and Galal, W. F. (2010). “Structural characteristics and tectonic evolution of the area around the qena bend, Middle Egypt,” in 6th international conference on the Geology of africa. Assiut, Egypt.
Gahalaut, K., Hassoup, A., Hamed, H., Kundu, B., and Gahalaut, V. (2016). Long-term and annual influence of aswan reservoir (Egypt) on the local seismicity: a spatio-temporal statistical analysis. Pure Appl. Geophys. 174 (1), 133–150. doi:10.1007/s00024-016-1397-6
Gerstenberger, M., Wiemer, S., and Giardini, D. (2001). A systematic test of the hypothesis the b-value varies with depth in California. Geophys. Res. Lett. 28 (1), 57–60. doi:10.1029/2000gl012026
Ghebreab, W. (1998). Tectonics of the Red Sea region: reassessed. Earth Sci. Rev. 45, 1–44. doi:10.1016/s0012-8252(98)00036-1
Grassberger, P., and Procaccia, I. (1983). Measuring the strangeness of strange attractors. Physica D 9, 189–208. doi:10.1016/0167-2789(83)90298-1
Gutenberg, R., and Richter, C. F. (1944). Frequency of earthquakes in California. Bull. Seismol. Soc. Am. 34, 185–188. doi:10.1785/bssa0340040185
Haggag, H. M., Gaber, H. H., Sayed, A. D., and Ezzat, M. E. (2008). A review of the recent seismic activity in the southern part of Egypt (upper Egypt). Acta Geodyn. Geomater. 5, 19–29.
Hirata, T. (1989). Fractal dimension of fault systems in Japan: fractal structure in rock fracture geometry at various scales. Pure Appl. Geophys. 131, 157–170. doi:10.1007/bf00874485
Hosny, A., Omar, K., and Ali, S. A. (2014). Study of the 26 December 2011 Aswan earthquake, Aswan area, South of Egypt. Arab. J. Geosci. 7, 4553–4562. doi:10.1007/s12517-013-1098-8
Issawi, B. (1969). The Geology of kurkur-dungul area. General Egypt. Organ. Geol. Res. Min. 46, 101.
Kagan, Y. Y., and Knopoff, L. (1980). Spatial distribution of earthquakes: the two-point correlation function. Geophys. J. R. Astronomical Soc. 62, 303–320. doi:10.1111/j.1365-246x.1980.tb04857.x
Kanamori, H., and Anderson, D. L. (1975). Theoretical basis of some empirical relations in seismology. Bull. Seismol. Soc. Am. 65, 1073–1095.
Kebeasy, R. M., Maamoun, M., and Ibrahim, E. (1981). Aswan lake induced earthquakes. Bull. Int. Inst. Seismol. Earthq. Eng. 19, 155–160.
Kebeasy, R. M., Maamoun, M., Ibrahim, E., Megahed, A., Simpson, D. W., and Leith, W. S. (1987). Earthquake studies at Aswan reservoir. J. Geodyn. 7, 173–193. doi:10.1016/0264-3707(87)90003-2
Khattri, K. N. (1995). Fractal description of seismicity of India and inferences regarding earthquake hazard. Curr. Sci. 69, 361–366.
Mekkawi, M., Grasso, J. R., and Schneggm, P. A. (2004). A long-lasting relaxation of seismicity at Aswan reservoir, Egypt, 1982–2001. Bull. Seismol. Soc. Am. 94, 479–492. doi:10.1785/0120030067
Mogi, K. (1962). Magnitude-frequency relation for elastic shocks accompanying fractures of various materials and some related problems in earthquakes. Bull. Earthq. Res. Inst. 40, 831–853.
Mohamed, A. A., El-Hadidy, M., Deif, A., and Abou Elenean, K. M. (2012). Seismic hazard studies in Egypt. NRIAG J. Astronomy Geophys. 1 (2), 119–140. doi:10.1016/j.nrjag.2012.12.008
Molchan, G., and Kronrod, T. (2009). The fractal description of seismicity. Geophys. J. Int. 179 (3), 1787–1799. doi:10.1111/j.1365-246X.2009.04380.x
Mostafa, S. A., and Mohamed, A. A. (2021). Seismotectonic studies in Aswan area, Egypt. Arabian J. Geosciences 14, 2210. doi:10.1007/s12517-021-08608-9
Mostafa, S. I., Abd El-aal, A. K., and El-Eraki, M. A. (2018). Multi scenario seismic hazard assessment for Egypt. J. Seismol. 22, 669–696. doi:10.1007/s10950-018-9728-y
Pollastro, R. M. (2003). Total petroleum systems of the paleozoic and jurassic, greater ghawar uplift and adjoining provinces of Central Saudi Arabia and northern arabian–Persian gulf. US Geological Survey Bulletin no. 2202-H. doi:10.3133/b2202H
Reasenberg, P. A. (1985). Second-order moment of central California seismicity, 1969–1982. J. Geophy. Res. 90, 5479–5495. doi:10.1029/jb090ib07p05479
Runddle, J. B. (1989). Derivation of complete Richter magnitude frequency relation using the principle of scale in variance. J. Geodyn. Res. 94 (12), 337–342.
Saadalla, H., Abdel–Aal, A. K., Mohamed, A., and El-Faragawy, K. (2020). Characteristics of earthquakes recorded around the high dam Lake with comparison to natural earthquakes using waveform inversion and source spectra. Pure Appl. Geophys. 177 (2020), 3667–3695. doi:10.1007/s00024-020-02490-4
Sawires, R., Peláez, J. A., Fat-Helbary, R. E., Ibrahim, H. A., and García Hernández, M. T. (2015). “An updated seismic source model for Egypt,” in Earthquake engineering - from engineering seismology to optimal seismic design of engineering structures. InTech. Available at: https://www.intechopen.com/books/earthquake-engineering-fromengineering-seismology-to-optimal-seismic-design-of-engineeringstructures/an-updated-seismic-source-model-for-egypt.
Scholz, C. H. (1968). The frequency-magnitude relation of microfracturing in rock and its relation to earthquakes. Bull. Seismol. Soc. Am. 58, 399–415. doi:10.1785/bssa0580010399
Schorlemmer, D., Wiemer, S., and Wyss, M. (2005). Variations in earthquake-size distribution across different stress regimes. Nature 437 (7058), 539–542. doi:10.1038/nature04094
Selim, M. M., Imoto, M., and Hurukawa, N. (2002). Statistical investigation of reservoir-induced seismicity in Aswan area, Egypt. Earth Planets Space 54, 349–356. doi:10.1186/bf03352424
Simpson, D. W., Gharib, A. A., and Kebeasy, R. M. (1990). Induced seismicity and changes in water level at Aswan reservoir, Egypt. Gerl. Beitr. Geophys. Leipz. 99, 191–204.
Telesca, L., Fat-Elbary, R., Stabile, T. A., Haggag, M., and Elgabry, M. (2017). Dynamical characterization of the 1982–2015 seismicity of Aswan region Egypt. Tectonophysics 712–713, 132–144. doi:10.1016/j.tecto.2017.05.009
Telesca, L., Mohamed, A.E.-E. A., ElGabry, M., El-hady, S., and Abou Elenean, K. M. (2012). Time dynamics in the point process modeling of seismicity of Aswan area (Egypt). Solit. Fractals 45, 47–55. doi:10.1016/j.chaos.2011.09.003
Wason, H. R., Sharma, M. L., Khan, P. K., Kapoor, K., Nandini, D., and Kara, V. (2002). Analysis of aftershocks of the Chamoli Earthquake of March 29, 1999, using broadband seismic data. J. Himal. Geol. 23, 7–18.
Wessel, P., and Smith, W. H. F. (1998). New, improved version of generic mapping tools released. Eos Trans. AGU 79, 579. doi:10.1029/98eo00426
Wiemer, S. (2001). A Software Package to Analyze Seismicity: ZMAP. Seismol. Res. Lett. 72, 373–382. doi:10.1785/gssrl.72.3.373
Wiemer, S., and Wyss, M. (1997). Mapping the frequency-magnitude distribution in asperities: an improved technique to calculate recurrence times. J. Geophys. Res. Solid Earth 102 (B7), 15115–15128. doi:10.1029/97JB00726
Wiemer, S., and Wyss, M. (2000). Minimum magnitude of completeness in earthquake catalogs: examples from Alaska, the Western United States, and Japan. Bull. Seismol. Soc. Am. 90, 859–869. doi:10.1785/0119990114
Woodward-Clyde Consultants (WCC) (1985). Identification of earthquake sources and estimation of magnitudes and recurrence intervals internal report high and aswan dams authority, 135. Egypt.
Wyss, M. (1973). Towards a physical understanding of the earthquake frequency distribution. Geophys. J. R. Astron. Soc. 31, 341–359. doi:10.1111/j.1365-246x.1973.tb06506.x
Wyss, M., Sammis, C., Nadeau, R. M., and Wiemer, S. (2004). Fractal dimension and b-value on creeping and locked patches of the San Andreas fault near Parkfield, California. Bull. Seismol. Soc. Am. 94 (2), 410–421. doi:10.1785/0120030054
Keywords: seismic activity, ENSN, b-value, fractal dimension (DC), Aswan, Egypt
Citation: Ali SM and Abdelrahman k (2024) Seismicity and fractal analysis in Aswan region, southern Egypt. Front. Earth Sci. 12:1438366. doi: 10.3389/feart.2024.1438366
Received: 25 May 2024; Accepted: 25 September 2024;
Published: 09 October 2024.
Edited by:
Tao Wen, Yangtze University, ChinaReviewed by:
Francisco Javier Nuñez-Cornu, University of Guadalajara, MexicoKhaled Omar, National Research Institute of Astronomy and Geophysics, Egypt
Taorui Zeng, China University of Geosciences Wuhan, China
Copyright © 2024 Ali and Abdelrahman. This is an open-access article distributed under the terms of the Creative Commons Attribution License (CC BY). The use, distribution or reproduction in other forums is permitted, provided the original author(s) and the copyright owner(s) are credited and that the original publication in this journal is cited, in accordance with accepted academic practice. No use, distribution or reproduction is permitted which does not comply with these terms.
*Correspondence: Sherif M. Ali, c2hlcmlmLmFsaUBjdGJ0by5vcmc=; kamal Abdelrahman, a2hhc3NhbmVpbkBrc3UuZWR1LnNh