 Shadman H. Khan1,2
 Sourav Kumar Sahoo1*
 Ismael Himar Falcon-Suarez1
 Hector Marin-Moreno3Hanif Sutiyoso1B. N. Madhusudhan4C. B. Majumder2Amit Arora5,6
 Angus I. Best1
- 1National Oceanography Centre, Southampton, United Kingdom
- 2Department of Chemical Engineering, Indian Institute of Technology Roorkee, Roorkee, India
- 3School of Ocean and Earth Science, University of Southampton, Southampton, United Kingdom
- 4Faculty of Engineering and the Environment, University of Southampton, Southampton, United Kingdom
- 5Department of Chemical Engineering, National Institute of Technology, Hamirpur, Himachal Pradesh, India
- 6Department of Chemical Engineering, SBS State University Ferozepur, Punjab, India
We present a time-lapse 4-D high-resolution synchrotron imaging study of the morphological evolution of methane gas bubbles and hydrate film growth on these bubbles. Methane gas and partially water-saturated sand were used to form hydrate with a maximum hydrate saturation of 60%. We investigated the transient evolution of gas bubble size distribution during hydrate formation and observed three distinct stages: a) nucleation and hydrate film formation, b) rapid bubble break-up, c) gas bubble coalescence and hydrate framework formation. Our results show that the average gas bubble size distribution decreases from 34.17 µm (during hydrate nucleation) to 8.87 µm (during secondary bubble formation). The small-size methane bubble population (mean diameter below 10 µm) initially increases at the expense of the larger methane bubble population (mean diameter above 50 µm) due to breakage of the larger bubbles and coalescence of the smaller bubbles. We quantified that the average hydrate film thickness increases from 3.51 to 14.7 µm by tracking the evolution of a particular gas bubble. This thickness increase agrees with an analytical model with an average deviation error of 3.3%. This study provides insights into gas bubble distribution and hydrate film growth during hydrate formation, both of which impact the geophysical and mechanical properties of hydrate-bearing sediments.
1 Introduction
Gas hydrates are ice-like polycrystalline compounds that host light guest molecules within the interlinked hydrogen-bonded cages (Sloan, 2003; You et al., 2023). Over the last few decades, hydrates have received worldwide attention due to their high development prospects. The scope of hydrate-based technology includes gas storage (e.g., Inkong et al., 2022), refrigeration (e.g., Wang et al., 2015), mixed gases separation (e.g., Babaee et al., 2021), carbon dioxide sequestration (e.g., Urych et al., 2022), desalination (e.g., Xu et al., 2018) and transportation of natural gas (e.g., Rajnauth et al., 2010). In recent years, offshore oil and gas exploration and exploitation have shifted towards deeper waters (e.g., Cordes et al., 2016) with lower seafloor temperatures and higher pressures. These conditions favor the hydrate formation both within the pipelines and the vicinity of the wellbore, posing a significant risk to pressure control and flow assurance (e.g., Cordes et al., 2016).
The kinetics of hydrate film growth conditions affect hydrate formation in oil-gas-water pipelines (Guimin et al., 2022), hydrate growth in the pore space and its effects on submarine slopes, and release of methane gas from hydrate deposits and water column seepage (Zhan et al., 2022). During methane seepage in the water column, hydrate films act as a protective layer, limiting gas dissolution (McGinnis et al., 2006). Recent experimental work has looked into co-existing methane gas and hydrate within the gas hydrate stability zone (Sahoo et al., 2018a; Sahoo et al., 2018b; Sahoo and Best, 2021; Madhusudhan et al., 2022). Hydrate films on gas bubbles may also have some effect on the geophysical properties and lead to uncertainties in remote geophysical quantification of hydrates (e.g., Marín-Moreno et al., 2017; Sahoo et al., 2019). So, there is a need to develop robust models for integrating the effect of a) gas distribution and b) hydrate film thickness on different geophysical and mechanical properties of hydrate-bearing sediments. Such modelling needs quantitative constraints obtained from image analysis of how the gas bubble distribution and size change and how the hydrate film evolves.
Conventional X-ray computed tomography (XRCT) and synchrotron CT (SXRCT) have recently contributed to improving our understanding of phase evolution and spatial redistribution during hydrate formation in porous media (Jin et al., 2006; Seol et al., 2006; Konno et al., 2013; Jin et al., 2014; Yang et al., 2015b; Ai et al., 2017; Li et al., 2024). In particular, SXRCT can provide nanometric resolution (e.g., 370 nm in Murshed et al. (2008)) and reveal information such as the morphology of voids, volume of discrete inclusions, surface area, topology of grain networks and crystallite information (Lei et al., 2019a; Lei et al., 2019b; Nikitin et al., 2020; Nikitin et al., 2021; Zhao et al., 2022). XRCT has been extensively used in various studies to investigate the microstructure of gas hydrate-bearing sediments, primarily under excess-gas conditions (Yang et al., 2015a; Zhao et al., 2015; Lei et al., 2019b). Le et al. (2020) explored methane hydrate (MH) morphologies and pore habits, as well as water migration, at both the pore and sample scales. Chen and Espinoza (2018) observed Ostwald ripening-type changes in the spatial distribution of xenon hydrate within the pore space of sediments, formed using the excess-gas method, via XRCT. Similarly, Lei et al. (2019a) reported water migration during the formation of carbon dioxide hydrate in sediments.
Recent studies by Lei et al. (2019a) have investigated methane hydrate morphologies and pore habits in sandy sediments under high-resolution imaging (approximately 2 μm). These studies initially used excess-gas conditions, followed by saline water injection, or directly used excess-water conditions. Kerkar et al. (2014) formed methane hydrate in saline water-saturated media (5 wt% BaCl2) using the excess-water method and observed patchy methane hydrate distributions and heterogeneous hydrate accumulations via synchrotron radiation X-ray computed tomography (SXRCT). However, distinguishing between water and methane hydrate in XRCT images is indeed a challenge due to the poor contrast. The gray levels in XRCT images reflect the material’s X-ray attenuation difference, primarily depending on the material’s density and atomic number. To enhance XRCT/SXRCT image contrast, various methods have been employed, including the use of saline water solutions with heavy elements. For instance, Kerkar et al. (2014) used barium chloride (BaCl2), Nikitin et al. (2020) used sodium bromide (NaBr), and Le et al. (2020) used potassium iodide (KI). These approaches significantly improve the ability to distinguish between different phases in the images.
Here, we use data from a 4D high-resolution synchrotron imaging experiment to visualize methane hydrate formation in partially water-saturated sand. The novelty of this work lies in our ability to track the dynamic behavior of methane gas bubbles and hydrate film growth across distinct hydrate formation stages.
2 Experimental procedure
We build on the experimental data from a high-resolution synchrotron imaging experiment presented in Sahoo et al. (2018a) to capture gas bubble dynamics during methane hydrate formation. Sahoo et al. (2018a) used time data for 805, 1,005, 1,410 and 2,710 min and investigated the overall distribution of the gas and hydrate. Here we use additional data for 1,045, 1,150, 1,270, and 1,605 min and reanalyzed the data to characterize gas bubble shape and size at each of these times and also measured thickness of the hydrate film. The present study incorporated all available and suitable time instants, in addition to those time instants analyzed in the previous study (Sahoo et al., 2018a). For example, in this paper we looked at all possible data where we could track a particular gas bubble and discuss its evolution. We also looked at tracking bubble size distribution at different time intervals.
The rig used in Sahoo et al. (2018a) consisted of a 0.8 mm wall thickness, 2 mm internal diameter, 10 mm height cylindrical holder made of polyether ether ketone (PEEK) to enhance the quality of the scanning, coupled to internal and external thermocouples for temperature control (Figure 1). The Leighton Buzzard sand (mean grain size d50 = 100 µm with an initial porosity of 35%) is a commonly available reservoir sand chosen as a non-reactive and clay free sediment based on commonly used gas hydrate modelling and experimental study of Priest et al. (2009), Best et al. (2013), Marín-Moreno et al. (2017), Sahoo et al. (2018a) The sample was initially dried, placed in the PEEK-holder, and subjected to vacuum. Then, the sample was partially (90%) saturated with a 35 gram/L NaCl solution (commonly accepted salinity of sea water) (Constable, 2013; Aladwani et al., 2024) and left for 3 days to ensure an effective pore fluid distribution by capillarity, which allows the excess water condition (Ellis, 2008; Priest et al., 2009). We have chosen an experimental condition to imitate those found in gas hydrate bearing sediments and also to compare with geophysical measurements done in another study by Sahoo et al. (2018a), Sahoo and Best (2021). The initial water saturation is chosen, so that we have enough volume occupied by gas based on the experiments. Thereafter, methane gas was injected into the holder at 10 MPa, and hydrates were formed by reducing the temperature to 2°C using a cryo jet stream connected to the rig. This setup simulates gas hydrate systems with localized gas flow such as those that may be found at the base of the gas hydrate stability zone (GHSZ) near gas chimneys (Ye et al., 2019).
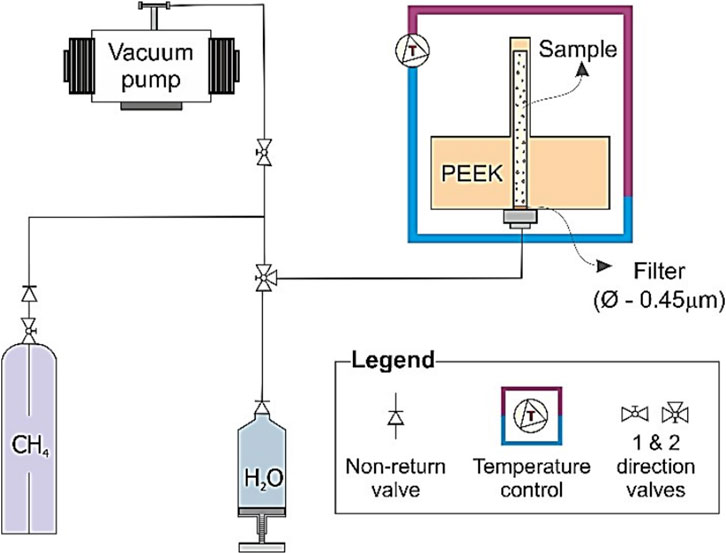
Figure 1. Schematic of the experimental setup for high resolution synchrotron imaging of methane hydrate formation from gas in water saturated sand after Sahoo et al. (2018a).
A synchrotron source’s monochromatic X-rays was used to image the formation of gas hydrate in the sand. The experiment was performed using a beam energy of 21 keV, 81-mm propagation distance and 200-ms exposure time (1,501 projections over 180° sample rotation), with 1.25×, 4×, and 10× objectives to obtain images at 1.625-, 0.625-, and 0.325-μm voxel size, respectively. The images were recorded using sensitive charged coupled device (CCD) cameras (2,560 × 2,160 pixels). The general scan frequency was around 30 min, with increased frequency to 15 min during rapid hydrate formation and reduced scan frequency during other times (1–3 h). We refer to Sahoo et al. (2018a) for further details.
3 Methodology
We obtained 2D slices using XRCT scans conducted at different times. These scans produce raw images that show the distribution of the different phases: sand grains, hydrate, water, and methane gas. The open-source software ImageJ was used to process the image stacks. Figures 2A, B depict the original 2D slices obtained from synchrotron imaging for time instants, 1,002 min and 2,710 min. The yellow line in Figures 2A, B indicates approximately the same site at different times, and distance on the x axis in Figure 2C is the distance along this yellow line from left to right. Reconstruction of the distribution of the individual phases was done by measuring the grayscale count variation over the entire image area. The grayscale values of the CT images were calibrated to represent physical densities based on scans of the system without hydrate presence. This calibration follows the approach used in previous studies (Kneafsey et al., 2007; Iassonov et al., 2009) by correlating grayscale intensities to known density values for sand (2,650 kg/m3), brine (1,025 kg/m3), and methane gas (18 kg/m3). The blue horizontal lines are boundary lines of grey scale count for each phase. After calibration, the grayscale values proportionally reflect the corresponding densities of these three components in regions without hydrate (Figure 2C). This establishes a relationship between grayscale intensity and density, allowing quantification of the hydrate formation and distribution from the CT data. A 5% confidence interval was used for the density-greyscale values (Sahoo et al., 2018a). For hydrate, we interpolated the grayscale value using a density of 925 kg/m3. Methane hydrate and methane gas phases are distinctly identifiable in the 20–70 µm range. We obtained separate stacks of binary image files for sand, brine, hydrate, and methane gas by using the relationship between grayscale intensity and density.
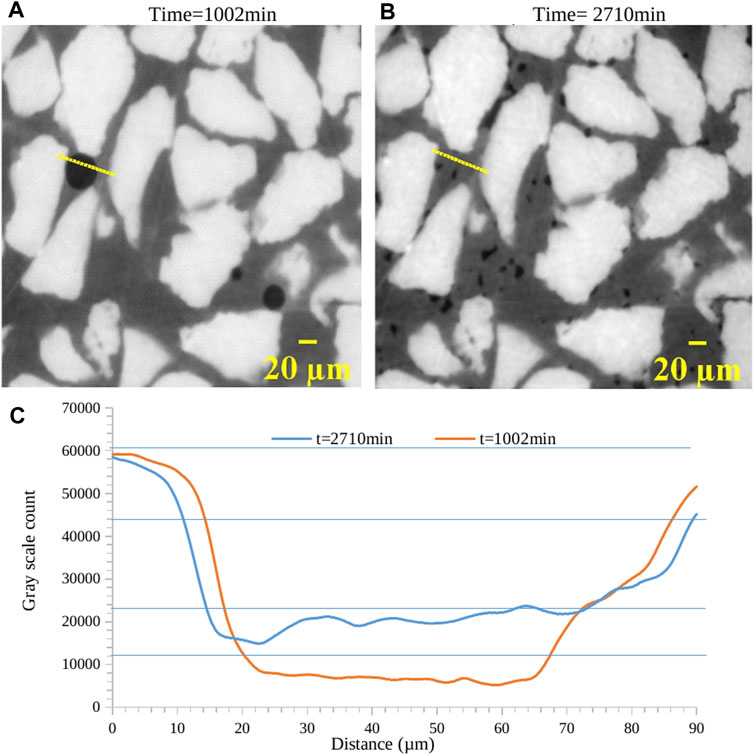
Figure 2. 2D reconstructed tomography slices of the hydrate sample at different times (A) t = 1,002 min and (B) t = 2,710 min (C) Plot of gray levels of different phases, i.e., methane gas, methane hydrate, water and sand obtained during density normalization (details in section 3).
In the initial stage of our investigation we measured the hydrate layer thickness surrounding a single gas bubble. We parsed through the 2D slices of methane gas (obtained from phase reconstruction) at different time instants. Figure 3 shows the distribution of methane gas and methane hydrate for the time of 1,002 min. In Figure 3A, grey area denotes brine, darker regions methane gas, and white regions are sand grains. Due to the similar density of brine and methane hydrate the former also appears grey. The methane gas bubble at the top-right corner is used to track hydrate film thickness variations over time. We chose one particular methane bubble for tracking the hydrate film thickness over time which could be seen at the next time instants without undergoing rupture or coalescence. It is evident that hydrate formation starts as a shell around a few methane gas bubbles (Figure 3C).
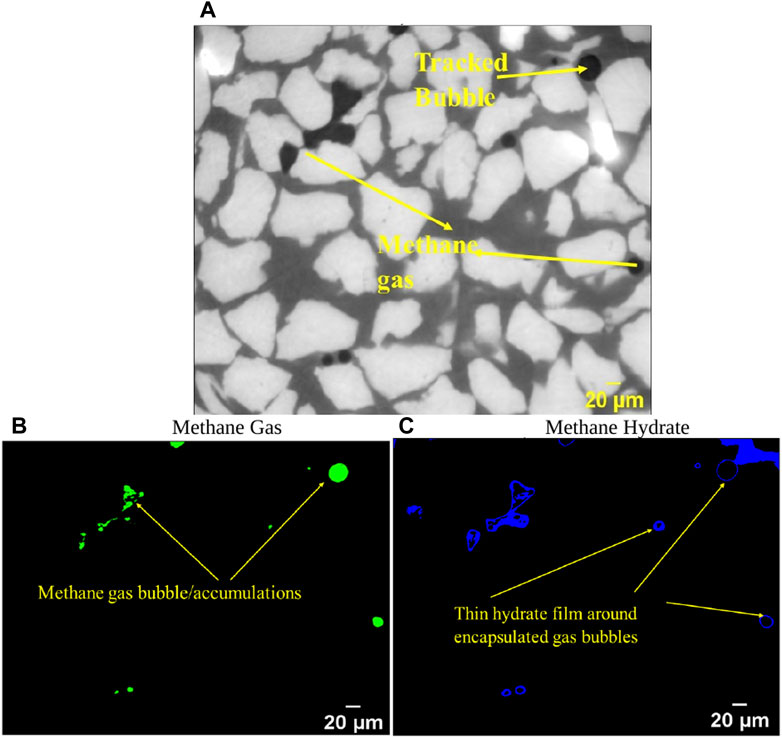
Figure 3. (A) Raw 2D image at time = 1,002 min. Methane gas distribution (B) and hydrate distribution (C) are depicted by green and blue color obtained using normalized density calibration (details in section 3).
The hydrate film thickness around the gas bubble was meticulously measured by analyzing large datasets (file size around 6 GB for each time instant) using ImageJ software. To account for potential variations and eliminate localized errors, measurements were taken at multiple circumferential points along the bubble’s periphery, as depicted in Figure 4. The straight-line tool was employed, carefully positioning lines perpendicular to the film’s edge at regular intervals around the bubble. Multiple measurements were taken at each location to calculate an average representative thickness. This comprehensive approach was repeated for each of the six distinct time instants (1,002, 1,045, 1,150, 1,270, 1,410, and 1,605 min) to monitor the evolution of film thickness during hydrate growth. The time frame selection was kept short due to the rapid hydrate formation during the initial stages. We used longer duration on the latter time instants to capture the slowing down phase of the hydrate formation when approaching full saturation. Henceforth, we adopt the widely used multiphase methodology of describing gas distribution as “bubbles” and “slugs” depending upon the classic spherical shape or distorted shape (Waltrich et al., 2013; Morgado et al., 2016).
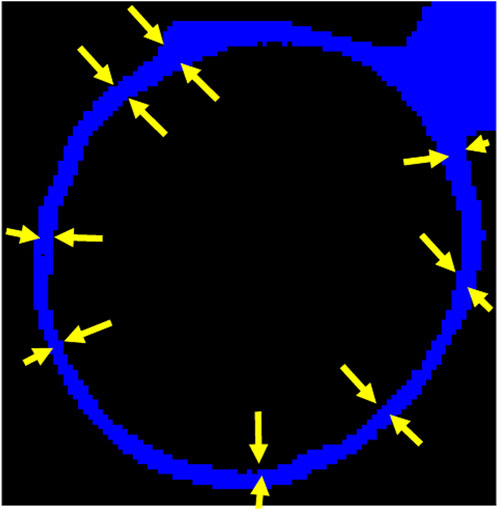
Figure 4. Representative hydrate film thickness measurement along the circumference at different points to determine average film thickness.
4 Results and discussion
4.1 Experimental observations
Average hydrate film thickness of the tracked bubble increased by 320% during the experiment (Figure 5) in a span of 1605 min. Figure 6 shows a transition in gas bubble size distribution during hydrate formation, which suggests a general increase in bubble population of smaller bubbles with time. Furthermore, by grouping the gas distribution into three larger intervals with similar growing trends, i.e., t1 (1005 min)-t2 (1045 min), t3 (1150 min)-t4 (1270 min) and t5 (1410 min)-t6 (1605 min), we observe two major changes at ∼1,170 min and ∼1,410 min (Figure 6). We see distinct changes in gradient at these two times, indicating a decrease in the population of larger bubbles and an increase in the population of smaller bubbles.
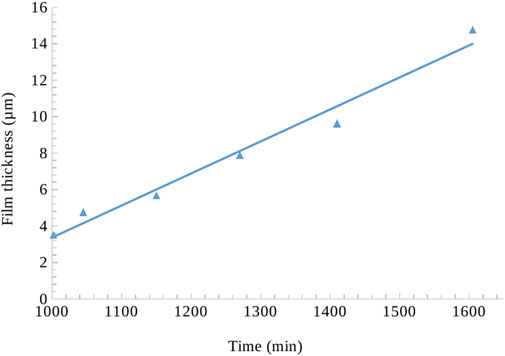
Figure 5. Evolution of hydrate film thickness over the course of the experiment.
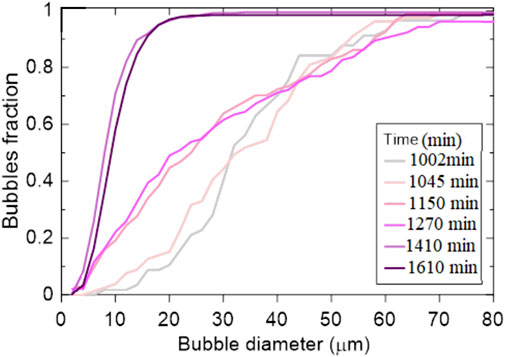
Figure 6. Cumulative size distribution plot of methane gas bubbles in the system at the different time instants.
Here we look at the distribution of gas and hydrate in the whole imaged area and how it varies with hydrate formation (Figure 7). Figure 7A shows bubbles or slugs of methane gas sparsely distributed and hydrate films around multiple gas bubbles following the first CT scan (t1 = 1002 min). These 2D slices only show the methane hydrate and the rest of the phases are set to black. Initially, hydrate forms as film around gas bubbles. Gas bubbles or slugs were preferentially distributed along the periphery, while fewer bubbles or slugs could be identified near the inner core, i.e., along the axis of the cylinder. Figures 7B–E shows the bubbles/slugs’ size decreases with time while the hydrate film thickness increases. Hydrate formation appears uniformly distributed throughout the imaged area (Figure 7B). Figure 7C shows redistribution of hydrate formation the pore space, particularly around the cylinder’s peripheral zone, and a significant increase of hydrate film thickness around the gas bubbles/slugs at t3 (1,150 min). At t4 (1,270 min), new hydrates appear around the sample’s peripheral regions, which can originate by the partial rupture of the hydrate shells and methane release (Chen et al., 2014; Sahoo et al., 2018a; Sun et al., 2019) releasing multiple smaller gas bubbles. These gas bubbles/slugs then achieve thermodynamic equilibrium, forming smaller (secondary) hydrates. This explanation is supported by the observation of multiple smaller hydrates alongside a larger agglomerate of hydrates at t5 (1,410 min), with a more uniform distribution than at t3 (1,150 min).
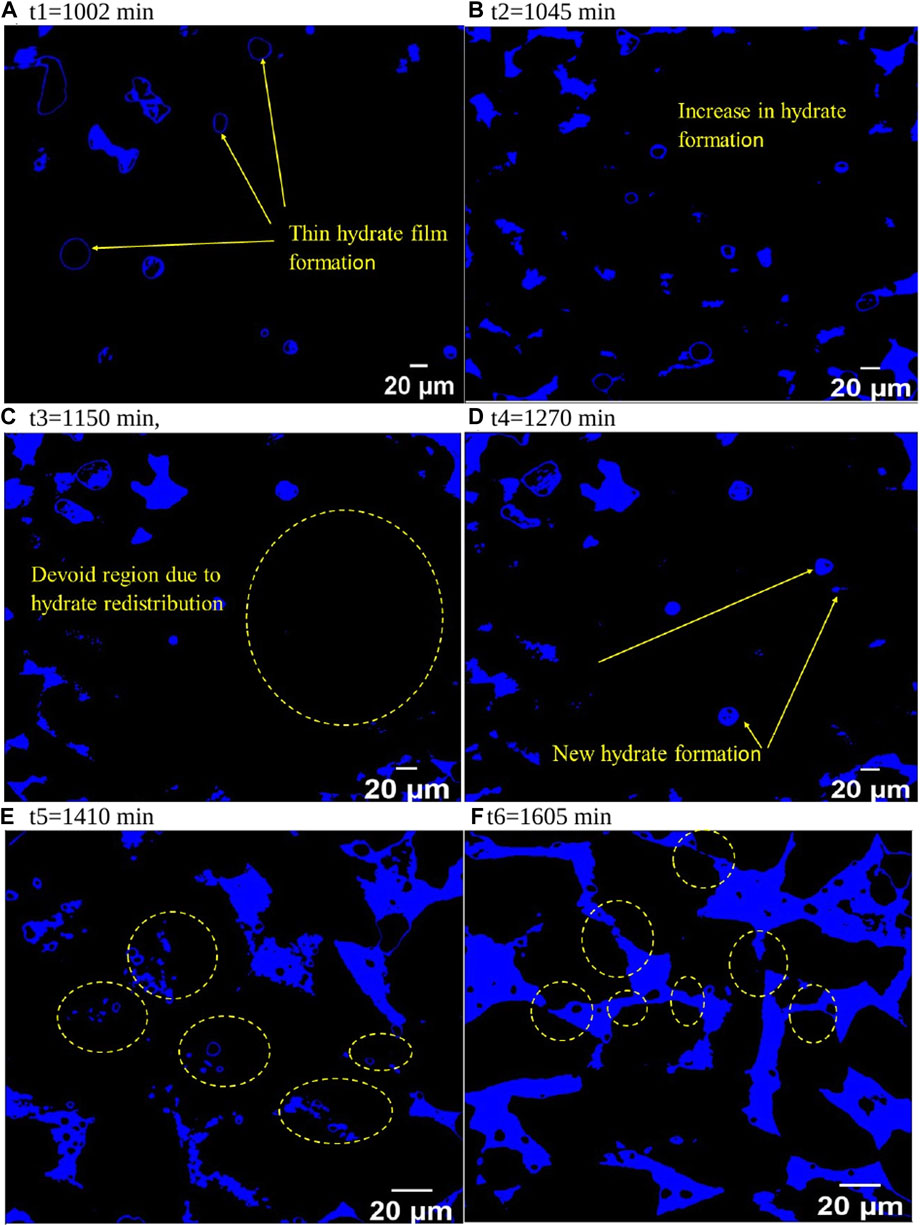
Figure 7. Methane hydrate growth (blue) in sediment pore space over time: (A) t1 = 1,002 min, initial hydrate film around methane bubbles; (B) t2 = 1,045 min, increased hydrate; (C) t3 = 1,150 min, hydrate-devoid region; (D) t4 = 1,270 min, new hydrate in devoid region; (E) t5 = 1,410 min, secondary hydrate formation; (F) t6 = 1,605 min, inter-pore hydrate bridges.
In principle, hydrate film growth occurs from two sides, which can be described as inward and outward cambium growth (Liu et al., 2019; Sun et al., 2019). Figure 8 shows the multiple phenomena associated with the hydrate shell growth, including diffusion of free gas to the outer cambium, utilization of gas for hydrate formation within the pores, water permeation to the inner cambium through capillary pores, and gas diffusion from water to the outer cambium hydrate/water interface. However, when hydrate shell growth occurs without rupture, the diffusion limits the growing rate (Sun et al., 2018). When the hydrate shell ruptures, the gas contained within releases and forms smaller bubbles.
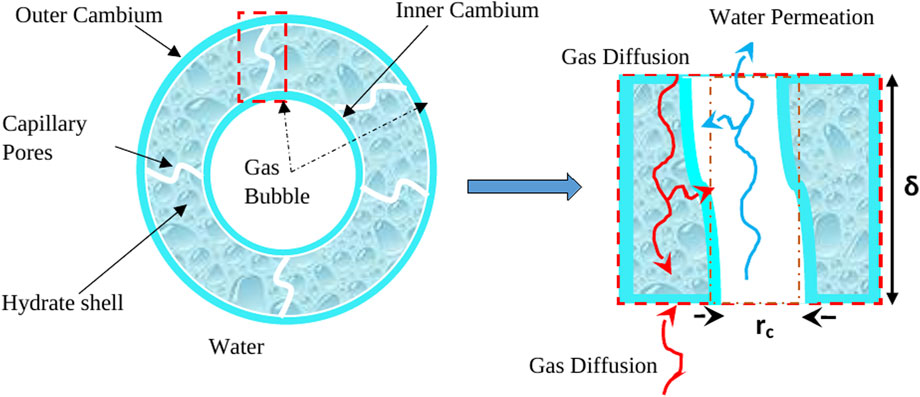
Figure 8. Hydrate shell growth with mass transfer pathways, adapted from Sun et al. (2019).
In our experiment, we think hydrate growth proceeds more from the outer shell and increases in thickness with the diffusion of gas from inside to outside through permeable channels. This is based on the evolving diameter of gas bubbles and increasing hydrate shell thickness. It is also expected that inner growth may occur, but our data cannot determine such growth.
4.2 Analytical validation of hydrate film growth
We compared our hydrate film thickness measurements with a model proposed by Vlasov (2019) to better understand the mechanisms controlling hydrate film growth and validate our measurements. The model assumes that the growth of the hydrate film along the gas-water interface depends on the movement of dissolved gas to the growing edge of the hydrate film. A hydrate film starts to grow along this gas-water interface. Hence, the rate of hydrate film growth depends on the balance between the diffusion velocity of dissolved methane and the kinetics of hydrate formation. The model considers two regimes for predicting the hydrate front propagation rate, i.e., kinetic and diffusion regimes. Both regimes operate in any given scenario, however, depending on the conditions, one of these regimes is the limiting factor for hydrate film growth. In the kinetic regime, the transport of dissolved gas to the hydrate formation front is faster than the hydrate formation reaction. In this case, the rate-limiting step is governed by the attachment to the hydrate crystal structure at the growth front, and the concentration of dissolved gas near the growth front stays close to the equilibrium solubility with the gas phase. In the diffusion regime, the hydrate formation reaction is faster than the transport of dissolved gas to the hydrate formation front. The kinetic reaction model assumes the concentration of dissolved gas (here methane) as the driving force for hydrate formation. The driving force is represented as
The velocity of moving hydrate front data is determined using the procedure outlined in Freer et al. (2001) from the rate of film thickness increase with time. Figure 9 shows a good match between the model predictions and the experimentally measured hydrate film growth. Here we have run the model assuming a diffusion regime (all parameters are listed in Supplementary Material). The slight underprediction during the initial stages is indicative of the rapid hydrate formation kinetics, which progresses into diffusion-governed hydrate film growth during the later stages. We also run the model with kinetic regime, but the model results do not yield satisfactory agreement with experimental data. We calculate an average deviation error of 3.3% using Equation 1.
Here, N is the total number of data points, and
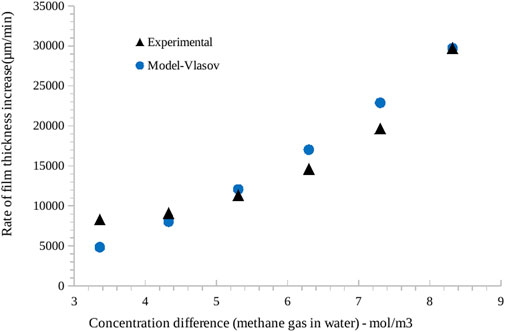
Figure 9. Comparison of rate of hydrate film thickness increase (as measured from synchrotron imaging) with theoretical model of Vlasov (2019). In x-axis, the concentration difference of methane gas in water at different temperatures is considered a driving force. Experimental data points are shown by black triangles (in case reader has b/w copy only), while blue dots show model prediction.
4.3 Insight and stages of hydrate growth
This section summarizes the different changes in gas bubble and hydrate morphology and distribution in sediments observed in our experimental study (Figure 10).
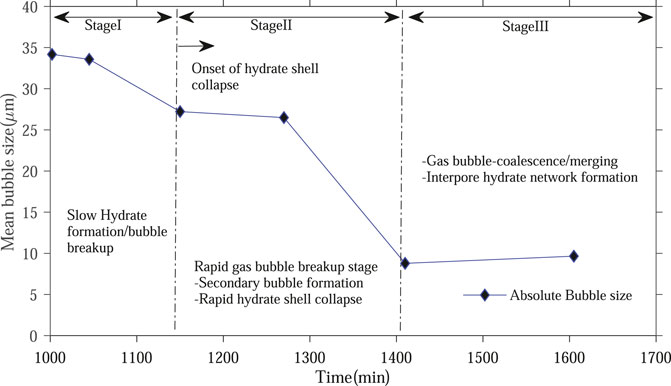
Figure 10. Different stages of hydrate growth depicting initial hydrate formation, onset of hydrate shell collapse, accelerated stage involving secondary gas bubbles formation and coalescence.
Stage I spans the initial hydrate nucleation and film formation phase, encompassing the first two times t1 (1,002 min) and t2 (1,045 min). Here, rapid initial hydrate film formation on gas bubbles occurs without significantly altering bubble size or distribution. Minimal dissolved gas transport limitations through the thin shell allows rapid hydrate film growth. Stage II captures the onset of hydrate shell instabilities and collapse, leading to secondary bubble formation. It includes time instants t3 (1,150 min) and t4 (1,270 min). Here, the hydrate film reaches a critical stability limit and partial rupture occurs, releasing new secondary bubbles that alter the bubble size distribution. The gas supply from breakdown leads to renewed localized hydrate film growth. Stage III incorporates the later phase of renewed bubble coalescence, pore-space redistribution, and the development of interpore hydrate frameworks. It spans time instants t5 (1,410 min) and t6 (1,605 min). Here, small bubbles coalesce and enable re-nucleation in small pores, exploiting residual water.
These three stages are represented by the significant change in the gradient of the lines in Figure 6B. The change in gradient clearly highlights how the distribution of gas bubbles changes with time. As the stages change from I to III, large bubbles are consumed by hydrate formation and smaller bubbles dominate the system. It seems there is a limit to the minimum gas bubble size, as depicted from the slight increase in average bubble size in t6 compared to t5 (Figure 10). Such observation is also shown in Figure 6B, where the curve hints at a minimum bubble size for the system. Our experiment was carried out for a limited time, and we should not conclude the minimum bubble size for natural systems is represented by our measured minimum size. However, we can indeed hypothesize that for laboratory studies forming hydrates from gas, there is likely a minimum gas bubble size limit.
5 Summary and conclusions
We employed 4D time-lapse synchrotron imaging of methane hydrate formation and focused on the evolution of free gas bubbles and hydrate film thickness over a duration of ∼26 h. Initially, a thin hydrate film encapsulated gas bubbles, which later increased in thickness to undergo shrinking, wrinkling, and rupture due to internal gas consumption. The gas bubble size within the system varied widely with elapsed time. Initially, the mean gas bubble size was found to be 34.2 μm (t = 1002 min), while the final mean gas bubble size was reduced to 9.26 μm (t = 1605 min). We conclude:
1. The breakup of larger gas bubbles into smaller ones during hydrate formation indicates that there is a thermodynamic drive for the system to minimize gas bubble size.
2. The coalescence of the gas bubbles is limited by both hydrate film and the pore-hydrate framework. This allows the presence of discrete bubbles in the system.
3. Under the laboratory conditions of our study, the system transitions from a kinetic dominated regime to a diffusion dominated regime with increasing hydrate film growth.
Data availability statement
The raw data supporting the conclusions of this article will be made available by the authors, without undue reservation.
Author contributions
SK: Formal Analysis, Validation, Visualization, Writing–original draft, Writing–review and editing. SS: Conceptualization, Investigation, Methodology, Writing–original draft, Writing–review and editing. IF: Visualization, Writing–review and editing. HM-M: Formal Analysis, Writing–review and editing. HS: Formal Analysis, Writing–original draft. BM: Investigation, Writing–review and editing. CM: Funding acquisition, Writing–review and editing. AA: Funding acquisition, Writing–review and editing. AB: Funding acquisition, Supervision, Writing–review and editing.
Funding
The author(s) declare that financial support was received for the research, authorship, and/or publication of this article. The experimental work was funded NERC, UK grant NE/J020753/1. SK was funded by Newton Bhabha Fellowship grant 2021-22.
Acknowledgments
We thank the Swiss Light Source, SLS, Switzerland for funding the beam time to conduct the synchrotron imaging experiment. The authors are grateful to the editors and reviewers.
Conflict of interest
The authors declare that the research was conducted in the absence of any commercial or financial relationships that could be construed as a potential conflict of interest.
Publisher’s note
All claims expressed in this article are solely those of the authors and do not necessarily represent those of their affiliated organizations, or those of the publisher, the editors and the reviewers. Any product that may be evaluated in this article, or claim that may be made by its manufacturer, is not guaranteed or endorsed by the publisher.
Supplementary material
The Supplementary Material for this article can be found online at: https://www.frontiersin.org/articles/10.3389/feart.2024.1438185/full#supplementary-material
References
Ai, L., Zhao, J., Wang, J., and Song, Y. (2017). Analyzing permeability of the irregular porous media containing methane hydrate using pore network model combined with CT. Energy Procedia 105, 4802–4807. doi:10.1016/j.egypro.2017.03.950
Aladwani, N. S., North, L. J., Falcon-Suarez, I. H., and Best, A. I. (2024). Shale distribution effects on the joint elastic–electrical properties in reservoir sandstone. Geophys. Prospect. 72, 633–656. doi:10.1111/1365-2478.13331
Babaee, S., Hashemi, H., Naidoo, P., and Ramjugernath, D. (2021). Application of gas hydrates in the separation and purification of xenon from a mixture of xenon and argon. J. Chem. Eng. Data 66, 3815–3825. doi:10.1021/acs.jced.1c00435
Best, A. I., Priest, J. A., Clayton, C. R. I., and Rees, E. V. L. (2013). The effect of methane hydrate morphology and water saturation on seismic wave attenuation in sand under shallow sub-seafloor conditions. Earth Planet. Sci. Lett. 368, 78–87. doi:10.1016/j.epsl.2013.02.033
Chen, X., and Espinoza, D. N. (2018). Ostwald ripening changes the pore habit and spatial variability of clathrate hydrate. Fuel 214, 614–622. doi:10.1016/j.fuel.2017.11.065
Chen, L., Sloan, E. D., Koh, C. A., and Sum, A. K. (2014). Methane hydrate formation and dissociation on suspended gas bubbles in water. J. Chem. Eng. Data 59, 1045–1051. doi:10.1021/je400765a
Constable, S. (2013). Review paper: instrumentation for marine magnetotelluric and controlled source electromagnetic sounding. Geophys. Prospect. 61, 505–532. doi:10.1111/j.1365-2478.2012.01117.x
Cordes, E. E., Jones, D. O. B., Schlacher, T. A., Amon, D. J., Bernardino, A. F., Brooke, S., et al. (2016). Environmental impacts of the deep-water oil and gas industry: a review to guide management strategies. Front. Environ. Sci. 4. doi:10.3389/fenvs.2016.00058
Ellis, M. H. (2008). Joint seismic and electrical measurements of gas hydrates in continental margin sediments. Southam: University of Southampton. Available at: https://eprints.soton.ac.uk/63293/ (Doctoral Thesis, 284pp).
Freer, E. M., Sami Selim, M., and Dendy Sloan, E. (2001). Methane hydrate film growth kinetics. Fluid Phase Equilib. 185, 65–75. doi:10.1016/S0378-3812(01)00457-5
Guimin, Y., Hao, J., and Qingwen, K. (2022). Study on hydrate risk in the water drainage pipeline for offshore natural gas hydrate pilot production. Front. Earth Sci. 9. doi:10.3389/feart.2021.816873
Iassonov, P., Gebrenegus, T., and Tuller, M. (2009). Segmentation of X-ray computed tomography images of porous materials: a crucial step for characterization and quantitative analysis of pore structures. Water Resour. Res. 45. doi:10.1029/2009WR008087
Inkong, K., Yodpetch, V., Veluswamy, H. P., Kulprathipanja, S., Rangsunvigit, P., and Linga, P. (2022). Hydrate-based gas storage application using simulated seawater in the presence of a Co-promoter: morphology investigation. Energy and Fuels 36, 1100–1113. doi:10.1021/acs.energyfuels.1c03877
Jin, S., Nagao, J., Takeya, S., Jin, Y., Hayashi, J., Kamata, Y., et al. (2006). Structural investigation of methane hydrate sediments by microfocus X-ray computed tomography technique under high-pressure conditions. Jpn. J. Appl. Phys. 45, L714. doi:10.1143/JJAP.45.L714
Jin, Y., Konno, Y., and Nagao, J. (2014). Pressurized subsampling system for pressured gas-hydrate-bearing sediment: microscale imaging using X-ray computed tomography. Rev. Sci. Instrum. 85, 094502. doi:10.1063/1.4896354
Kerkar, P. B., Horvat, K., Jones, K. W., and Mahajan, D. (2014). Imaging methane hydrates growth dynamics in porous media using synchrotron X-ray computed microtomography. Geochem. Geophys. Geosystems 15, 4759–4768. doi:10.1002/2014gc005373
Kneafsey, T. J., Tomutsa, L., Moridis, G. J., Seol, Y., Freifeld, B. M., Taylor, C. E., et al. (2007). Methane hydrate formation and dissociation in a partially saturated core-scale sand sample. J. Pet. Sci. Eng. 56, 108–126. doi:10.1016/j.petrol.2006.02.002
Konno, Y., Jin, Y., Uchiumi, T., and Nagao, J. (2013). Multiple-pressure-tapped core holder combined with X-ray computed tomography scanning for gas-water permeability measurements of methane-hydrate-bearing sediments. Rev. Sci. Instrum. 84, 064501. doi:10.1063/1.4811379
Le, T.-X., Bornert, M., Aimedieu, P., Chabot, B., King, A., and Tang, A.-M. (2020). An experimental investigation on methane hydrate morphologies and pore habits in sandy sediment using synchrotron X-ray computed tomography. Mar. Pet. Geol. 122, 104646. doi:10.1016/j.marpetgeo.2020.104646
Lei, L., Liu, Z., Seol, Y., Boswell, R., and Dai, S. (2019a). An investigation of hydrate formation in unsaturated sediments using X-Ray computed tomography. J. Geophys. Res. Solid Earth 124, 3335–3349. doi:10.1029/2018jb016125
Lei, L., Seol, Y., Choi, J.-H., and Kneafsey, T. J. (2019b). Pore habit of methane hydrate and its evolution in sediment matrix–Laboratory visualization with phase-contrast micro-CT. Mar. Pet. Geol. 104, 451–467. doi:10.1016/j.marpetgeo.2019.04.004
Li, Y., Hao, Y., Wu, P., Hu, W., and Song, Y. (2024). Mechanical behavior of hydrate-bearing clayey-silty sediments in the south China sea: strain-rate dependency. Energy and Fuels 38, 5959–5973. doi:10.1021/acs.energyfuels.4c00399
Liu, Z., Sun, B., Wang, Z., and Chen, L. (2019). New mass-transfer model for predicting hydrate film thickness at the gas-liquid interface under different thermodynamics-hydrodynamics-saturation conditions. J. Phys. Chem. C 123, 20838–20852. doi:10.1021/acs.jpcc.9b03843
Madhusudhan, B. N., Sahoo, S. K., Alvarez-Borges, F., Ahmed, S., North, L. J., and Best, A. I. (2022). Gas bubble dynamics during methane hydrate formation and its influence on geophysical properties of sediment using high-resolution synchrotron imaging and rock physics modeling. Front. Earth Sci. 10, 877641. doi:10.3389/feart.2022.877641
Marín-Moreno, H., Sahoo, S. K., and Best, A. I. (2017). Theoretical modeling insights into elastic wave attenuation mechanisms in marine sediments with pore-filling methane hydrate. J. Geophys. Res. Solid Earth 122, 1835–1847. doi:10.1002/2016JB013577
McGinnis, D. F., Greinert, J., Artemov, Y., Beaubien, S. E., and Wüest, A. (2006). Fate of rising methane bubbles in stratified waters: how much methane reaches the atmosphere? J. Geophys. Res. Ocean. 111. doi:10.1029/2005JC003183
Morgado, A. O., Miranda, J. M., Araújo, J. D. P., and Campos, J. B. L. M. (2016). Review on vertical gas–liquid slug flow. Int. J. Multiph. Flow. 85, 348–368. doi:10.1016/j.ijmultiphaseflow.2016.07.002
Murshed, M. M., Klapp, S. A., Enzmann, F., Szeder, T., Huthwelker, T., Stampanoni, M., et al. (2008). Natural gas hydrate investigations by synchrotron radiation X-ray cryo-tomographic microscopy (SRXCTM). Geophys. Res. Lett. 35. doi:10.1029/2008GL035460
Nikitin, V. V., Dugarov, G. A., Duchkov, A. A., Fokin, M. I., Drobchik, A. N., Shevchenko, P. D., et al. (2020). Dynamic in-situ imaging of methane hydrate formation and self-preservation in porous media. Mar. Pet. Geol. 115, 104234. doi:10.1016/j.marpetgeo.2020.104234
Nikitin, V. V., Fokin, M. I., Dugarov, G. A., Drobchik, A. N., Andrade, V.De, Shevchenko, P. D., et al. (2021). Dynamic in situ imaging of methane hydrate formation in coal media. Fuel 298, 120699. doi:10.1016/j.fuel.2021.120699
Priest, J. A., Rees, E. V. L., and Clayton, C. R. I. (2009). Influence of gas hydrate morphology on the seismic velocities of sands. J. Geophys. Res. Solid Earth 114. doi:10.1029/2009JB006284
Rajnauth, J., Barrufet, M., and Falcone, G. (2010). “Potential industry applications using gas hydrate technology,” in Trinidad tobago energy resour. Conf. SPE-133466-MS. doi:10.2118/133466-MS
Sahoo, S. K., and Best, A. I. (2021). The influence of gas hydrate morphology on reservoir permeability and geophysical shear wave remote sensing. J. Geophys. Res. Solid Earth 126, e2021JB022206. doi:10.1029/2021jb022206
Sahoo, , Madhusudhan, B. N., Marín-Moreno, H., North, L. J., Ahmed, S., Falcon-Suarez, I. H., et al. (2018a). Laboratory insights into the effect of sediment-hosted methane hydrate morphology on elastic wave velocity from time-lapse 4-D synchrotron X-ray computed tomography. Geochem. Geophys. Geosystems 19, 4502–4521. doi:10.1029/2018GC007710
Sahoo, S. K., Marín-Moreno, H., North, L. J., Falcon-Suarez, I., Madhusudhan, B. N., Best, A. I., et al. (2018b). Presence and consequences of coexisting methane gas with hydrate under two phase water-hydrate stability conditions. J. Geophys. Res. Solid Earth 123, 3377–3390. doi:10.1029/2018JB015598
Sahoo, S. K., North, L. J., Marín-Moreno, H., Minshull, T. A., and Best, A. I. (2019). Laboratory observations of frequency-dependent ultrasonic P-wave velocity and attenuation during methane hydrate formation in Berea sandstone. Geophys. J. Int. 219, 713–723. doi:10.1093/gji/ggz311
Seol, Y., Kneafsey, T. J., Tomutsa, L., and Moridis, G. J. (2006). “Preliminary relative permeability estimates of methane hydrate-bearing sand,” in TOUGH symposium 2006 (Berkeley, California, USA: Lawrence Berkeley National Laboratory), 35–43. Available at: https://digital.library.unt.edu/ark:/67531/metadc882658/.
Sloan, E. D. (2003). Fundamental principles and applications of natural gas hydrates. Nature 426, 353–359. doi:10.1038/nature02135
Sun, X., Wang, Z., Sun, B., Chen, L., and Zhang, J. (2018). Modeling of dynamic hydrate shell growth on bubble surface considering multiple factor interactions. Chem. Eng. J. 331, 221–233. doi:10.1016/j.cej.2017.08.105
Sun, B., Liu, Z., Wang, Z., Chen, L., Li, H., and Duan, W. (2019). Experimental and modeling investigations into hydrate shell growth on suspended bubbles considering pore updating and surface collapse. Chem. Eng. Sci. 207, 1–16. doi:10.1016/j.ces.2019.06.004
Urych, T., Chećko, J., Magdziarczyk, M., and Smoliński, A. (2022). Numerical simulations of carbon dioxide storage in selected geological structures in north-western Poland. Front. Energy Res. 10. doi:10.3389/fenrg.2022.827794
Vlasov, V. A. (2019). Diffusion-kinetic model of gas hydrate film growth along the gas–water interface. Heat. Mass Transf. 55, 3537–3545. doi:10.1007/s00231-019-02671-5
Waltrich, P. J., Falcone, G., and Barbosa, J. R. (2013). Axial development of annular, churn and slug flows in a long vertical tube. Int. J. Multiph. Flow. 57, 38–48. doi:10.1016/j.ijmultiphaseflow.2013.06.008
Wang, Z., Li, F., Fan, T., Xiong, W., and Yang, B. (2015). Research on the application of gas hydrate in cool storage air conditioning. Procedia Eng. 121, 1118–1125. doi:10.1016/j.proeng.2015.09.116
Xu, H., Khan, M. N., Peters, C. J., Sloan, E. D., and Koh, C. A. (2018). Hydrate-based desalination using cyclopentane hydrates at atmospheric pressure. J. Chem. Eng. Data 63, 1081–1087. doi:10.1021/acs.jced.7b00815
Yang, L., Zhao, J., Liu, W., Li, Y., Yang, M., and Song, Y. (2015a). Microstructure observations of natural gas hydrate occurrence in porous media using microfocus X-ray computed tomography. Energy and Fuels 29, 4835–4841. doi:10.1021/acs.energyfuels.5b00881
Yang, L., Zhao, J., Liu, W., Yang, M., and Song, Y. (2015b). Experimental study on the effective thermal conductivity of hydrate-bearing sediments. Energy 79, 203–211. doi:10.1016/j.energy.2014.11.008
Ye, J., Wei, J., Liang, J., Lu, J., Lu, H., and Zhang, W. (2019). Complex gas hydrate system in a gas chimney, South China Sea. Mar. Pet. Geol. 104, 29–39. doi:10.1016/j.marpetgeo.2019.03.023
You, Z., Hao, Y., Hu, W., Shen, S., Wu, P., and Li, Y. (2023). Strength analysis of hydrate-bearing sandy sediments in excess gas and excess water based on drained triaxial compression tests. Eng. Geol. 325, 107292. doi:10.1016/j.enggeo.2023.107292
Zhan, L., Liu, B., Zhang, Y., and Lu, H. (2022). Rock physics modeling of acoustic properties in gas hydrate-bearing sediment. J. Mar. Sci. Eng. 10, 1076. doi:10.3390/jmse10081076
Zhao, J., Yang, L., Liu, Y., and Song, Y. (2015). Microstructural characteristics of natural gas hydrates hosted in various sand sediments. Phys. Chem. Chem. Phys. 17, 22632–22641. doi:10.1039/c5cp03698d
Keywords: hydrate film, XRCT, hydrate formation, methane hydrate, gas bubble dynamics
Citation: Khan SH, Sahoo SK, Falcon-Suarez IH, Marin-Moreno H, Sutiyoso H, Madhusudhan BN, Majumder CB, Arora A and Best AI (2024) Investigation of methane gas bubble dynamics and hydrate film growth during hydrate formation using 4-D time-lapse synchrotron X-ray computed tomography. Front. Earth Sci. 12:1438185. doi: 10.3389/feart.2024.1438185
Received: 25 May 2024; Accepted: 29 July 2024;
Published: 16 August 2024.
Edited by:
Yihuai Zhang, University of Glasgow, United KingdomReviewed by:
Huaimin Dong, Chang’an University, ChinaAmin Taghavinejad, University of Glasgow, United Kingdom
Azibayam Amabogha, University of Glasgow, United Kingdom
Copyright © 2024 Khan, Sahoo, Falcon Suarez, Marin-Moreno, Sutyoso, Madhusudhan, Majumder, Arora and Best. This is an open-access article distributed under the terms of the Creative Commons Attribution License (CC BY). The use, distribution or reproduction in other forums is permitted, provided the original author(s) and the copyright owner(s) are credited and that the original publication in this journal is cited, in accordance with accepted academic practice. No use, distribution or reproduction is permitted which does not comply with these terms.
*Correspondence: Sourav Kumar Sahoo, cy5zYWhvb0Bub2MuYWMudWs=