 Hao Xu
 Xiaodong Yang1,4*
94% of researchers rate our articles as excellent or good
Learn more about the work of our research integrity team to safeguard the quality of each article we publish.
Find out more
ORIGINAL RESEARCH article
Front. Earth Sci., 24 July 2024
Sec. Solid Earth Geophysics
Volume 12 - 2024 | https://doi.org/10.3389/feart.2024.1437850
The development of geothermal energy has received extensive attention because of global energy scarcity and environmental pollution. The Tangquan area is in the north of the Yangtze fold belt, and the lack of magmatic rock development has resulted in a low-temperature type of geothermal reservoir. There are sporadic hot springs and cold springs exposed in the study area, but the uncertain deep geological structure, unknown geothermal reservoir formation mechanism, and lack of detailed exploration data seriously restrict the exploration and development of geothermal resources in the area. Filling underground faults with water can significantly reduce electrical resistivity, while traps filled with warm water can cause a decrease in S-wave velocity. Thus, a new integrated geophysical method, including the controlled source audio-frequency magnetotelluric (CSAMT) and microtremor methods, is applied for geothermal exploration in the region. The combination of CSAMT and microtremor methods can determine thermal-controlled and water-conducting structures more effectively and locate geothermal storage more accurately. The source, channel, storage, and cover of regional geothermal reservoir formation are analyzed using geophysical and geological data. That is, the regional NE- and NW-trending faults are explained as thermal-controlled and water-conducted structures, respectively. The deep Sinian Dengying Formation supplies a heat- and water-bearing space. The tectonic intersection area, especially the tensional fault zone, is found to be closely related to the existence of geothermal reservoirs, which is well verified by later drilling results. Finally, a geothermal reservoir model is established to comprehensively understand the distribution of geothermal energy in the region.
Geothermal energy plays a crucial role in the transition from fossil fuels to clean energy sources (Speer et al., 2014; Abraham and Nkitnam, 2017; Joel et al., 2022). Geothermal energy development is highly concerned with these issues (Kana et al., 2015). Geothermal energy is green, low-carbon, recyclable, and renewable energy with large reserves and wide distribution (Gupta and Roy, 2006; Zhang and Zhao, 2020).
Geophysical exploration methods play an important role in the accurate locating of geothermal reservoirs, which not only save expenses and improve efficiency but also reduce environmental damage and safety risks (Pang et al., 2018; Dalkhani et al., 2021). Each geophysical method has its advantages. Underground thermal aquifers are mostly developed in fracture areas where the rock’s electric resistivity is influenced by a relatively high temperature (Gasperikova et al., 2011). Due to the dissolution of many mineralized ions by groundwater-saturated faults, the electrical resistivity of the area has decreased (Hersir and Arnason, 2009), resulting in dense and steep contour lines, low resistance depressions, and bead-like low resistance anomalies presented on the resistivity curve profile (Cai et al., 2024). In the magnetotelluric method, because the field source is a natural alternating electromagnetic field, the detection depth is large, but the resolution is not high (Xie et al., 2021). The controllable source audio magnetotelluric (CSAMT) method observes the artificial alternating electromagnetic field, and the field source is stable with high signal strength, so it has better fine detection ability with high resolution (Sandberg and Hohmann, 1982; Grandis and Sumintadireja, 2012; Fu et al., 2019). More importantly, it can penetrate shallow high-resistance layers and has a large detection depth attributed to its field alternating current source. The CSAMT method has been used since the establishment of the regional geothermal models (Thanassoulas, 1991; Gasperikova et al., 2011), geological structure mapping (Oskooi et al., 2005; Patro, 2017), and final geothermal resource exploration (Munoz, 2014; Mabuzied et al., 2020; Ruiz-Aguilar et al., 2020).
Underground thermal aquifers also have a great impact on the seismic velocity of rock formation. An underground rock layer containing water will significantly reduce the S-wave velocity and exhibit low-speed anomalies in the S-wave velocity profile, and the low-speed traps in fractured and water-saturated areas can be determined by seismic exploration (Hlousek et al., 2015; Tian et al., 2017). Traditional seismic exploration requires an explosive source, which brings high risks and environmental pollution. The microtremor survey method, however, has recently been developed and offers the advantage of being a passive detection method. This method is also not easily affected by human interference (Sudjono et al., 2019). Xu et al. (2012) and Tian et al. (2017), respectively, use single-point and profiling microtremor methods for geothermal exploration in southern Jiangsu Province, China, and point out that the microtremor method is crucial for locating geothermal wells and reducing the risk of drilling. The geophysical prospecting method should be properly selected according to regional geological conditions. Geothermal resources are dominated by medium-low-temperature hydrothermal resources in the southeast coastal areas (Wang et al., 2020; Liu et al., 2021). The studied Tangquan area is in the Pukou District on the North Bank of the Yangtze River in Nanjing, China, and is adjacent to the Laoshan Uplift in the South and the Chu River in the North. This geological structure is within the north of the Yangtze fold belt, which is the intersection of the Yangtze block and the Northern Jiangsu basin. It is controlled by the Chuhe fault, a secondary fault of the Tancheng-Lujiang (Tan-Lu) fault zone. The complex regional structure has been established through multiple tectonic movements (He et al., 2022). Cold and hot springs have been exposed on the surface of the area, indicating that the area is rich in geothermal resources (Zhao and Zhuang, 2005). However, the accurate scope of the geothermal distribution and the forming and storage mechanisms remain unclear, with limited research revealing the geochemical characteristics of the Tangquan area (Xu et al., 2020; Yu et al., 2021).
Previous geological surveys indicate that the geothermal reservoir of the Tangquan area belongs to the type of tectonic-controlled low-temperature convection (Du et al., 2012). This low-temperature area lacks magmatic rock development, which results in a small variation of electric resistivity and seismic velocity (Soengkono et al., 2013). Geothermal resources are buried deep, and some areas have weathered gravel on the surface, with high-resistance layers in the shallow areas. Meanwhile, because the use of geophysical methods in areas of complex geological structures may be particularly challenging (Mitjanas et al., 2021), various structures may produce the same observation results because of the essential nonuniqueness of geophysical inversion (Cai et al., 2021).
CSAMT can be used in tectonic-controlled geothermal systems to detect fault structures that control geothermal energy and conduct water sources. The presence of geothermal energy can reduce the S-wave velocity of geological bodies, and microtremors can characterize the location of underground thermal storage traps by delineating low-speed anomalies. Therefore, both the CSAMT and the microtremor survey methods are applied in the geothermal prospecting of the Tangquan area. We first laid out comprehensive CSAMT and microtremor profiles on a large area within the study area and obtained preliminary results. Based on the preliminary results, a detailed second-stage comprehensive profile was laid out to accurately obtain the location of the geothermal reservoir. Combining the two methods provides comprehensive imaging of the thermal-controlled structure, the water-conducted structure, and the geothermal location, followed by successful drilling of geothermal water. Furthermore, a geothermal reservoir model is established in the region using the drilling results.
As shown in Figure 1, the studied area’s geographical location is 118°27′03″–118°31′48″E and 32°04′07″–32°06′04″N. The geotectonic unit that includes the study area is part of the Yangtze Paraplatform of the Lower Yangtse Fold Belt and is located at the northern and eastern margins of the Laoshan anticlinorium at the western end of the Ningzhen Uplift, adjacent to the Chuhe Mesozoic-Cenozoic Basin to the north (Yu et al., 2021).
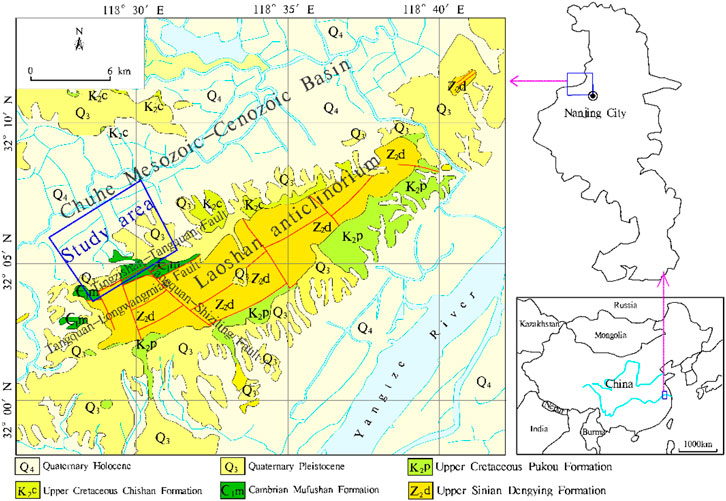
Figure 1. Location of the Tangquan geothermal area and a sketch of local geological structure.
The Laoshan anticlinorium within the area is spreading in a NEE-striking, with the axis inverted to the southeast and the fold axis inclined to the east (Xu et al., 2020). The core of the anticlinorium is mainly composed of the Sinian strata, and its south wing is covered by the Cretaceous strata due to the lack of the Sinian strata because of faults, while its north wing is affected by the Chuhe buried fault. In terms of composition, the Laoshan anticlinorium is mainly formed by dolomite, dolomitic limestone, and siliciclastic rocks of the Dengying Formation, which overlies the dolomitic limestone of the Cambrian Mufushan Formation.
On a larger scale, two NE-striking and NW-striking fault systems exist in the area. The NE-striking faults are mainly compressional-torsional faults, and the NW-striking faults are mainly tensional-torsional faults (Wu, 1994). Among them, the Tingzishan-Tangquan compressional-torsional positive fault and the Tangquan-Longwangmiao compressional-torsional fault of 50–55ºNE are about 10 km long and are major thermal-controlled faults within the area. The Tangquan-Shiziling tension-torsional translational fault that strikes 320–330ºNW comprises several parallel faults with a length of about 5 km (Yu et al., 2021). This fault, in which silicified fault zone, breccia, and scratches are visible, is the main thermal-conducted fault within the area.
According to outcrops, drilling, geological and geophysical data (Wu, 1994; Lu et al., 2018), the strata of the study area and its surrounding regions are composed of limy siliceous dolomite of the Upper Sinian Dengying Formation (Z2d), limestone and limy shale of the Lower Cambrian Mufushan Formation (Є1m), silicarenite of the Lower Cretaceous Gecun Formation (K1g), silty sandstone with mudstone of the Upper Cretaceous Chishan Formation (K2c), argillaceous limestone of the Paleogene Oligocene Sanduo Formation (E3s), sandy conglomerate and mudstone of the Miocene Dongxuanguan Formation (N1d), and clay, sub clay and sandy gravel of the Quaternary (Q) within the Piedmont basin. The Piedmont ridges, gully, and the Chuhe alluvial plain are all Quaternary erosion-covered, and there are cave deposits in karst caves (Du et al., 2012). Among them, dolomite and dolomitic limestone karst fractures are developed. Breccia is also found in dolomite near the Chuhe fault zone (F1). The above karst fractures and tectonic faults provide thermal storage conditions for the geothermal water. However, magmatic rocks in and around the study area are not very developed and are limited to the vicinity of Zhutou Mountain in the Laoshan remnant. Most of the basalts erupt in the Himalayan period with stomatal and amygdaloid structures, and their joints and fissures are well-developed.
The Bouguer gravity anomaly can indicate the existence of regional large deep faults, which are the main factors controlling the regional geothermal distribution (Atef et al., 2016). As shown in Figure 2 (Yuan, 2021), the study area is in a gravity gradient zone at the junction of the Laoshan Uplift and the Liuhe-Quanjiao depression. The high gravity anomaly is caused by the dolomite of the Dengying Formation (Z2d) at the Sinian tectonic uplift to the south, while the low gravity anomaly to the north reflects the Mesozoic and Cenozoic fault depression (Wu, 1994). Within the area, the gradient zone of the gravity anomaly indicates the existence of a buried fault. The gradient distribution of the Bouguer gravity anomaly in the NE strike corresponds to the Laoshan Mountains, and the maximum anomaly reaches 40 mGal. The intensity of aeromagnetic anomalies increases gently from 0 to 50 nT from southeast to northwest, indicating that young magmatic intrusive rocks in the area are less developed. Thus, there is a lack of additional magmatic heat sources other than the gradient geothermal source.
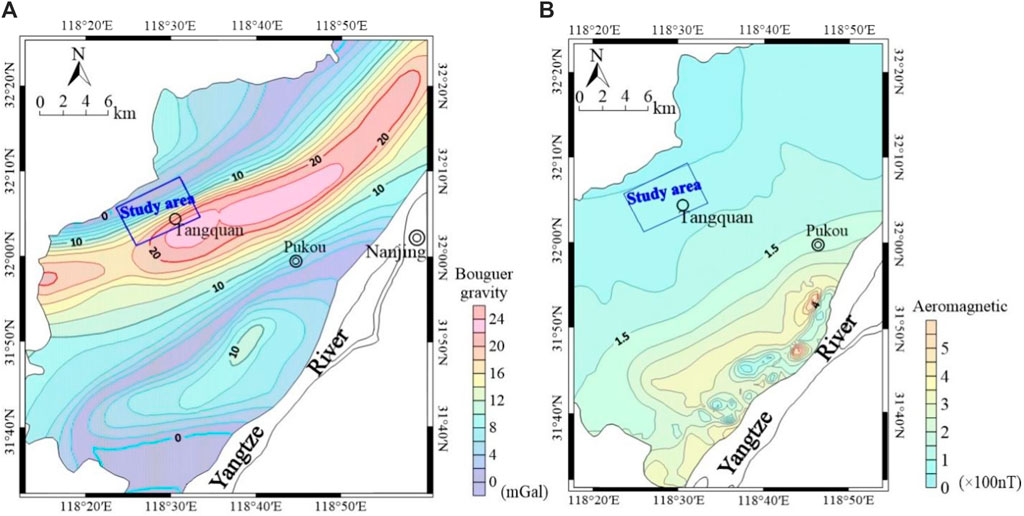
Figure 2. Contour map of regional (A) Bouguer gravity anomaly and (B) aeromagnetic anomalies.
To facilitate the interpretation of CSAMT resistivity profiles and provide additional support for stratigraphic division, the available resistivity measurements of rock samples collected from geological drilling in the study area are shown in Table 1. The overall electrical resistivity increases gradually from new to old strata within the area, according to drilling results (Figure 3). Based on the measured resistivity values of drilling rock samples, the resistivity of the Sinian Dengying Formation (Z2d) is significantly higher than that of the overlying strata, and it is reasonable that the Z2d is the basement stratum. Three sets of strata are divided in the area according to this electrical layering. The upper low resistivity layer consists of the Quaternary (Q) and Cretaceous (K), the low resistivity layer in the middle consists of the Cambrian (Є), and the high resistivity layer in the lowest part consists of the Upper Sinian strata. The Upper Sinian with the Dengying Formation and the Huangxu Formation is mainly composed of dolomite and limestone, and its bottom is dominated by low metamorphic phyllite and sandstone, with relatively low resistivity. These stratigraphic electrical characteristics are listed in Table 1, and they provide a basis for the interpretation of geothermal exploration results.
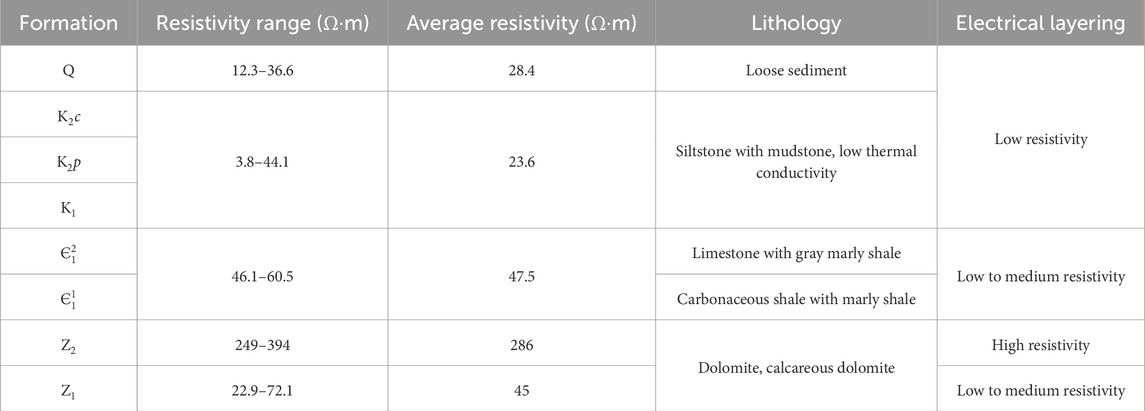
Table 1. Electrical characteristics of strata within the study area (Cai et al., 2021).
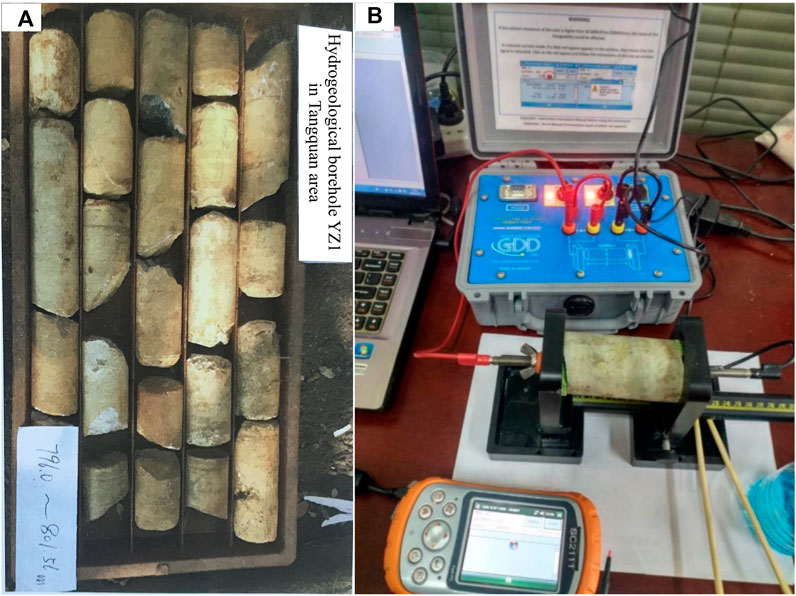
Figure 3. (A) Rock samples of a drilling hole and (B) their resistivity measurement using the Sample Core IP Tester manufactured by Instrumentation GDD Inc.
The integrated geophysical method of CSAMT and microtremor measurement is first applied to the exploration of geothermal resources in the region, effectively detecting thermal control structures, water-conducting structures, and geothermal locations. It plays an important role in the drilling layout.
The CSAMT method has the characteristics of good resolution of a high conductivity layer and is not shielded by a high resistivity layer, making it able to effectively detect deep fractures related to geothermal genesis (Mitsuhata et al., 2002). The field survey of this study is divided into two stages (Figure 4). In the preliminary stage, we carry out a CSAMT survey on five profiles (L1-L5). The CSAMT observation has a point distance of 100 m. To better locate geothermal reservoirs, a subsequent exploration of four profiles of CSAMT survey (L11-L14) with a 50 m point distance is deployed in the fine stage. In these surveys, GDP-32II produced by ZONGE is used in the CSAMT survey. The inline
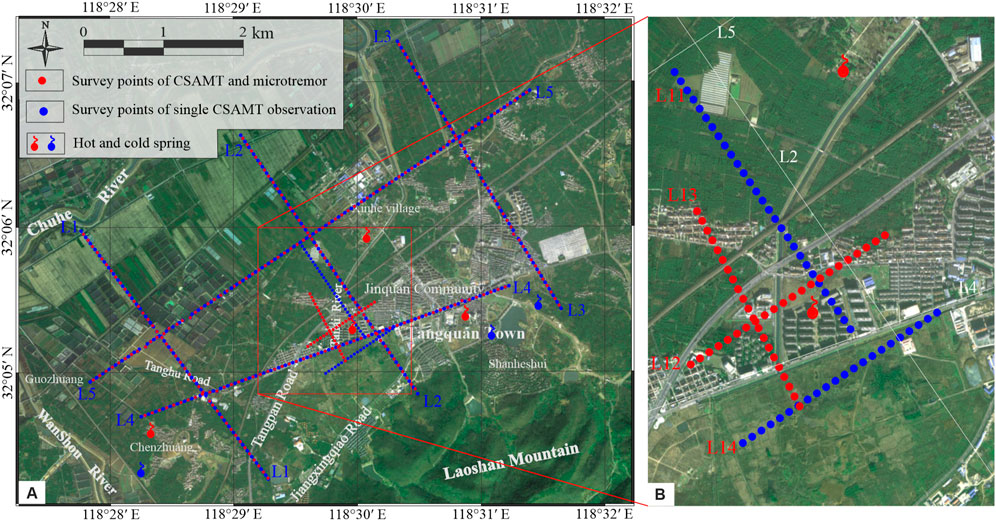
Figure 4. Survey lines layout of (A) preliminary and (B) fine stage investigation of the Tangquan geothermal area.
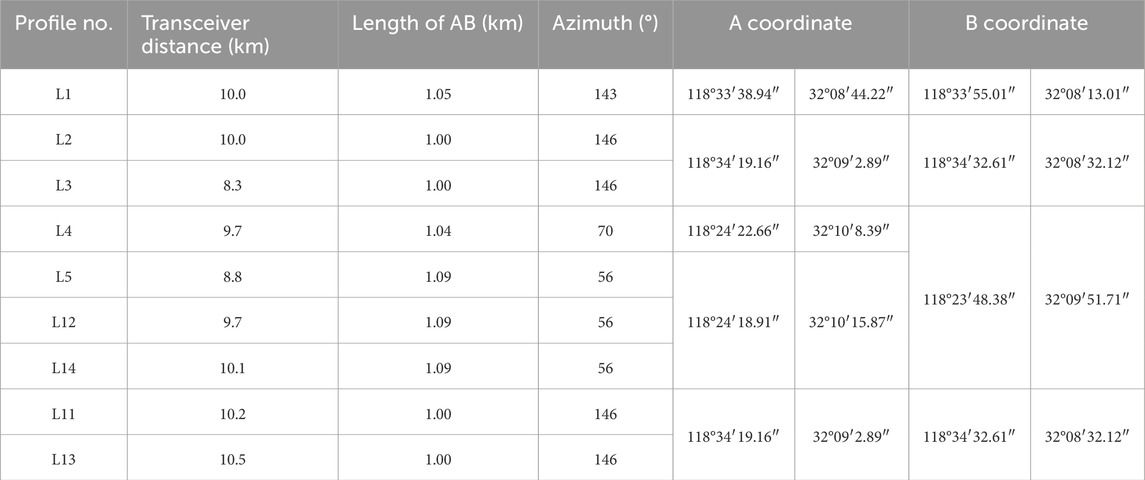
Table 2. The layout of the source dipole of the nine CSAMT profiles.
The inversion software RSCSINV (Scott et al., 2006) provided by ZONGE is applied to carry out 2-D resistivity profiles for interpretation. In the CSAMT survey, we aim to minimize the overall misfit,
which consists of the data misfit,
and the model roughness
The microtremor survey method was proposed long ago (Aki, 1957) and has since matured due to efforts in the last and this century (Asten, 1979; Morales et al., 1991; Okada, 2006). Its effectiveness has been validated (Smith et al., 2013; Chen et al., 2021). Microtremor data processing requires calculating dispersion curves. In this study, we expand the exploration depth of the high-resolution frequency-wave number method proposed by Tokimatsu et al. (1992) while maintaining its high resolution. We adapt the improved method to different microtremor observation arrangements and achieve both fine shallow detection (Xu et al., 2021) and deep structure imaging (Hardesty et al., 2010; Asten et al., 2019; Ismail et al., 2019).
In detail, the cross-power spectrum
where
where
As
where
In the field survey of this study, the microtremor profile is designed to have the same length as the CSAMT profile in the preliminary stage with a point distance of 200 m. Two additional microtremor profiles (L12 and L14) were carried out in the fine stage, with a point distance of 100 m. The observation system applies a triple nested triangular array (Chen et al., 2021), which consists of 10 geophones with a radius of 50–100–200 m (Figure 5). The observation duration of each point is 1 h, and the sampling rate is 250 Hz. The instrument applied in this survey is a broadband CDJ-S2C-2 3-D geophone with a main frequency of 2 Hz. As an example, the waveforms of the original microtremor data (vertical component) acquired from 10 geophones at the No. 120 point on the L12 line are presented in Figure 6.

Figure 5. Triple-nested triangular array configuration of the microtremor survey.
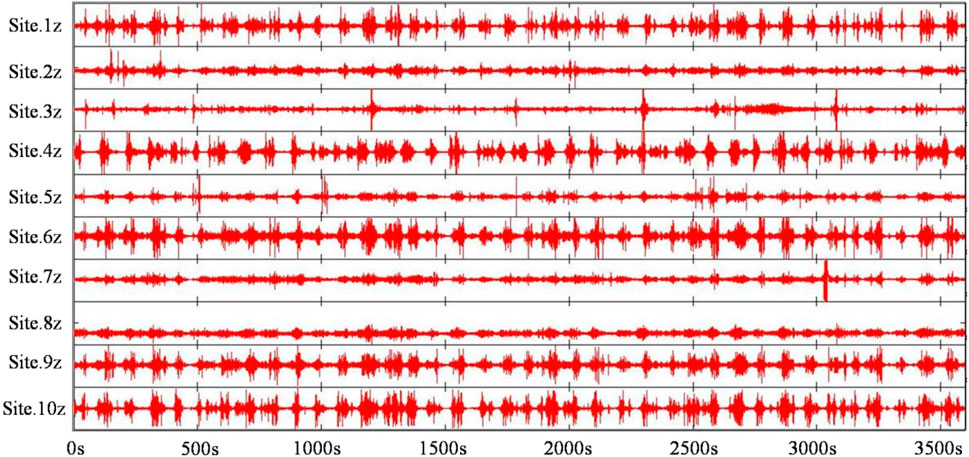
Figure 6. Example waveforms of original microtremor data (vertical component) at the No.120 point of L12.
According to the improved method, the dispersion curves of the microtremor data of 11 points on the L12 line are calculated as shown in Figure 7. A transversely continuous apparent S-wave velocity profile of the underground medium can be obtained using the method suggested by Ling et al. (2006) as
where

Figure 7. Dispersion curves of 11 survey points of L12. The numbers 100–300 represent the point number of the microtremor profile.
According to the above geological data, geophysical data, and previous results (Xu et al., 2020; Tian et al., 2022), the geothermal enrichment area can be characterized by steep and dense resistivity contours and low-velocity anomalies. In addition, the geothermal-controlled structure is mainly a fault zone, and the geothermal storage layer is mainly dolomite of the Sinian Dengying Formation (Z2d): because of its susceptibility to underground hot water dissolution, it forms a water storage cavity. Therefore, the comprehensive geophysical interpretation of the study area is mainly based on the inference of the buried fault system and stratigraphic distribution. Then, the favorable target area for geothermal water is delineated, and the optimal geothermal borehole location is determined. The inference of strata mainly refers to abnormal characteristics and physical property data, such as the resistivity in Table 1, and the high-resistance part at the bottom is inferred as the Sinian strata. The distribution of faults can be comprehensively inferred based on the changes in resistivity and S-wave velocity and combined with the overall geological structure of the region. When the resistivity and S-wave velocity are relatively high, it is inferred that it is the bottom Sinian Dengying Formation. The results are interpreted and extrapolated in stages as follows.
Geophysical exploration results of the CSAMT method and the microtremor survey method are shown in Figures 8–13. Spatially, the L2 line is in the middle of the study area and strikes 146°NW. It intersects with lines L5 and L4 at 1,600 m and 3,100 m, respectively. The L3 line is parallel to the L2 line in the east of the study area, and it intersects with the L5 line at 1,500 m. The L4 line is located in the south of the study area, and it intersects with the L1 and the L2 lines at 2,200 m and 6,800 m, respectively. In Figure 14, we compare the measured apparent resistivity profile and the predicted resistivity profile of the inversion model of the L4 line at two specific frequencies, which proves the reliability of the inversion results. Moreover, the resistivity and velocity structure at the intersection of different profiles in Figure 13 should theoretically be consistent. Actually, the S-wave velocity exhibits high consistency at the intersection of profile L5, profile L2, and profile L3, as well as at the intersection of profile L4 and profile L2. Meanwhile, the consistency of resistivity is good at the intersection of profile L5 and profile L3, and the consistency at the intersection of profile L4 and profile L2 is also reasonable. These further demonstrate the reliability of our results. It is noted that the areas where the inconsistency of S-wave velocity and resistivity is significant are only located at the intersection of profile L1, profile L4, and profile L5, which may be due to anisotropy caused by an underground structure.
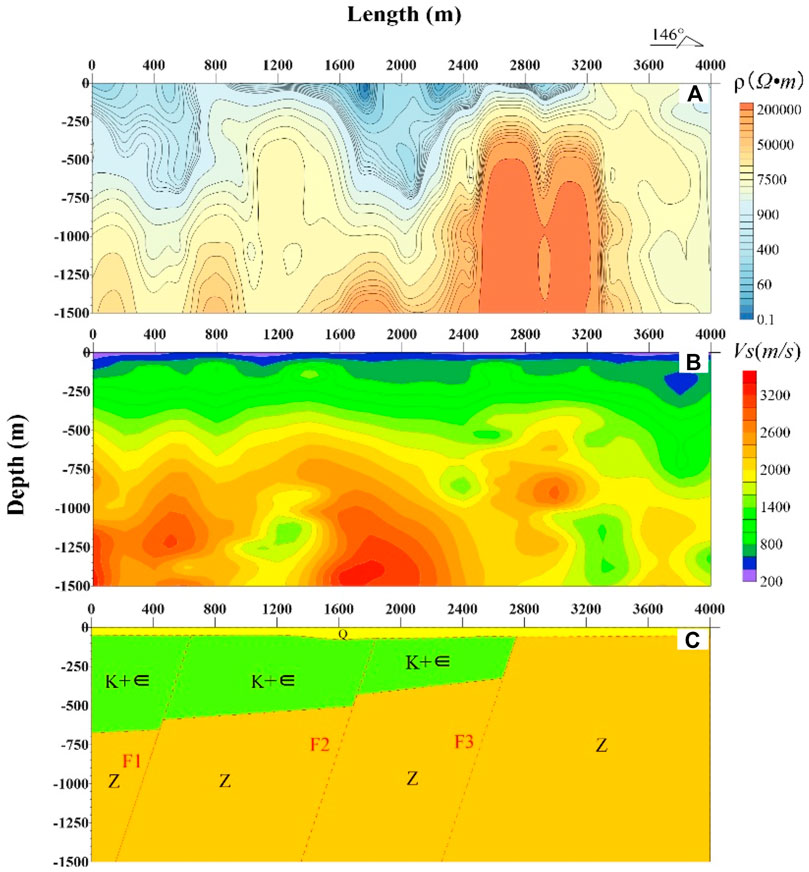
Figure 8. (A) CSAMT inversion, (B) microtremor pseudo section, and (C) strata explanation of the L1 line.
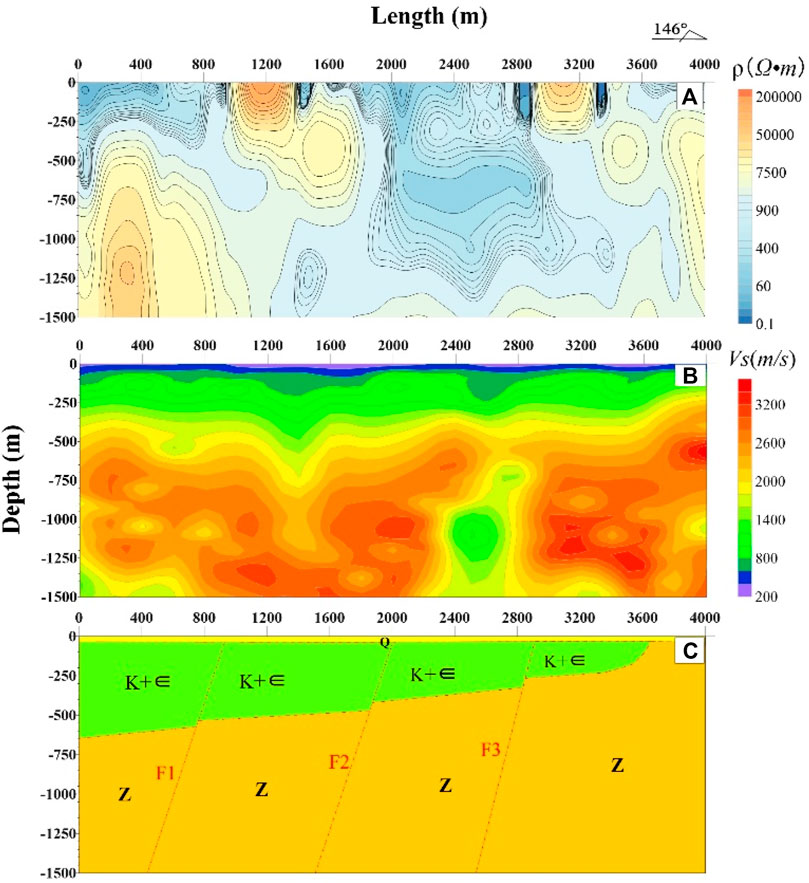
Figure 9. (A) CSAMT inversion, (B) microtremor pseudo section, and (C) strata explanation of the L2 line.
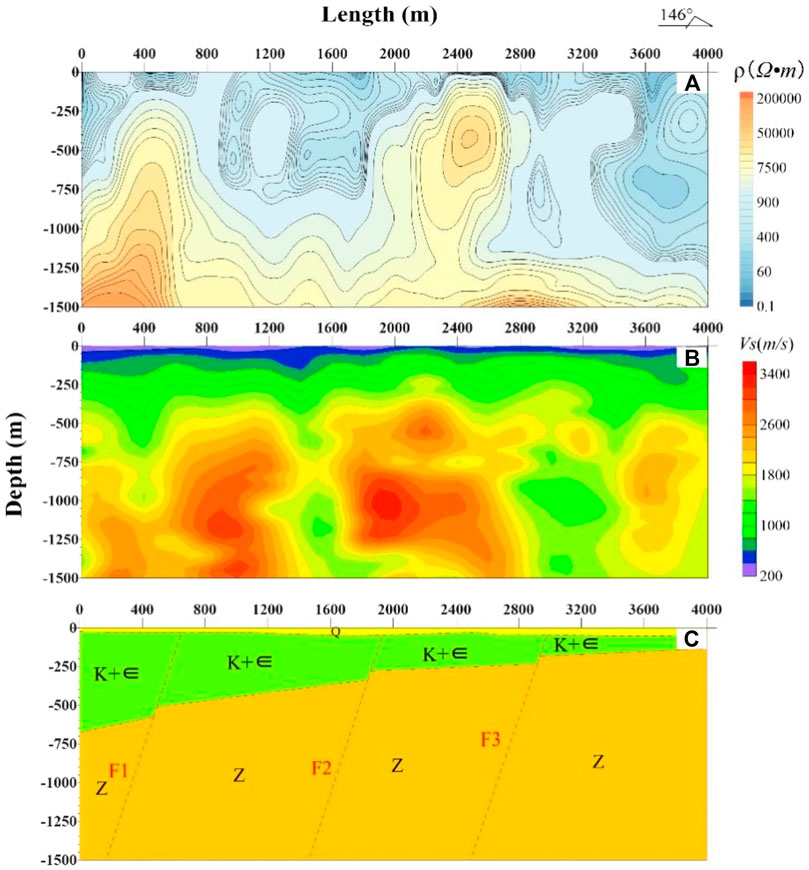
Figure 10. (A) CSAMT inversion, (B) microtremor pseudo section, and (C) strata explanation of the L3 line.
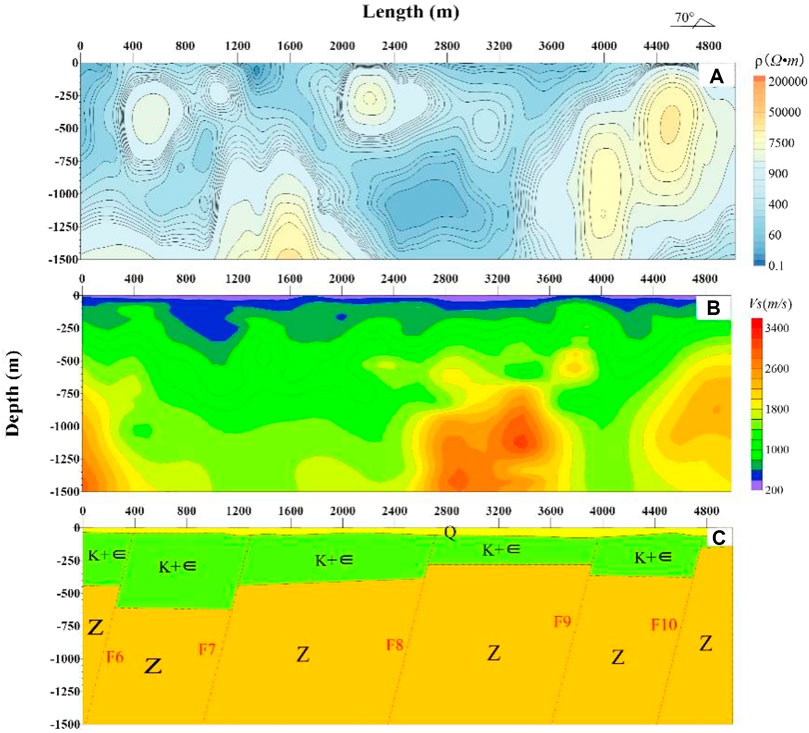
Figure 11. (A) CSAMT inversion, (B) microtremor pseudo section, and (C) strata explanation of the L4 line.
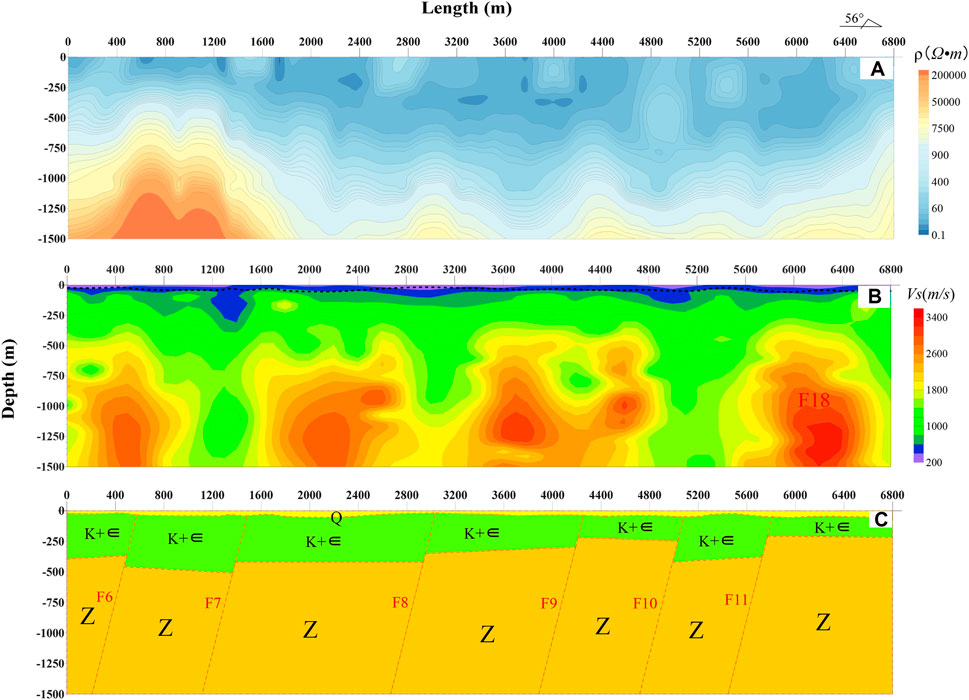
Figure 12. (A) CSAMT inversion, (B) microtremor pseudo section, and (C) strata explanation of the L5 line.
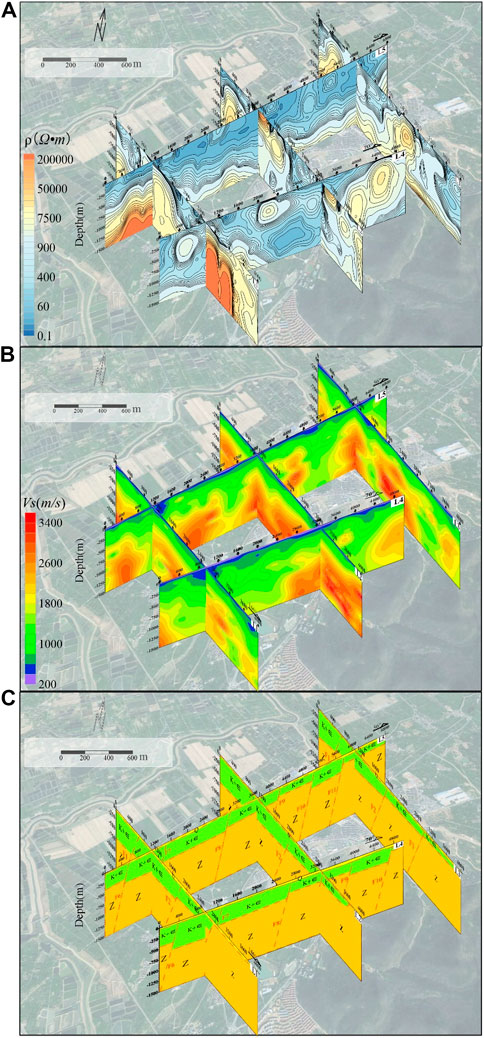
Figure 13. (A) The electrical structure from CSAMT inversion, (B) the wave velocity structure from the microtremor pseudo section, and (C) the inferred stratigraphic system of each profile.
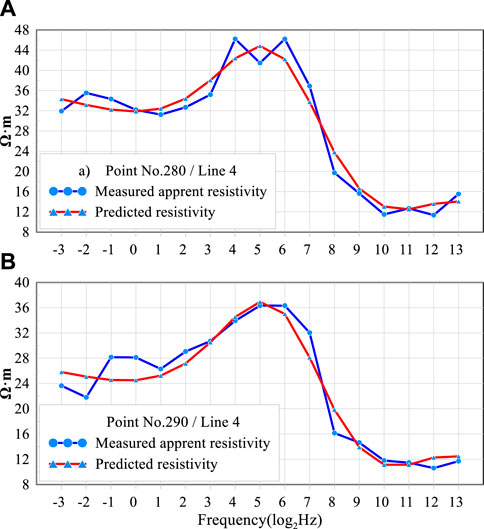
Figure 14. The measured apparent resistivity and predicted resistivity of the inversion model of (A) Point No.280 and (B) Point No.290 in the L4 line.
Horizontal clear, dense contour lines can be seen in the CSAMT profile at 2,700 m in L1, 2,900 m in L2, and 3,000 m in L3. It is inferred that there is a fault F3 crossing these three survey lines at this location. On the microtremor profile, there is a steeply inclined low resistance area at the corresponding position. Based on the distribution of regional geological strata, it is deduced that F3 is the boundary of the Laoshan anticlinorium uplift strata. The main distributed strata on both sides include the Sinian and Cambrian systems on the southeast side and the Quaternary and Cretaceous systems on the northwest side. Many hot springs are exposed around F3, and this fault has great potential for geothermal resource exploration. A steep and dense contour line can be observed at 2,700 m of the microtremor L4 line and 3,100 m of the L5 line, which is inclined to the southwest. It is inferred that there is a fault F8 at this location. A steep and dense contour line may also be seen in the CSAMT resistivity profile of the L4 line, but it is not displayed on the CSAMT resistivity profile of the L5 line. Although there is a hot spring exposed near the intersection of this fault and the F3 fault, the water yield is not large, and the host formations of deep warm or hot water are not clear.
Vertically, combined with the distribution of regional geological strata and Table 1, the electrical characteristics of strata within the study area can be inferred from Figure 13: the strata in the study area are mainly divided into four layers: shallow Quaternary with low resistivity and S-wave velocity, middle Cretaceous with low resistivity, Cambrian with medium resistivity, and deep Sinian with high resistivity and S-wave velocity. From the inferred maps of the L1, L2, and L3 lines, it can be inferred that the shallow lower resistivity is attributed to the Quaternary system, which is distributed throughout the entire study area and significantly thinned near the Laoshan anticlinorium uplift zone. The electrical resistivity of the underlying strata is inferred to be from the Cretaceous and Cambrian strata, with the formation rock Laoshan anticlinorium spreading northwestward and gradually thickening. The Cambrian main concerns of limestone and carbonate shale exist beneath the Quaternary strata on the southeast side of the F3 fault. The underlying strata on the northwest side are Cretaceous strata, which mainly consist of sandstone and mudstone with medium resistance and velocity. The area with high resistance and velocity in the lowest strata is inferred to be the Sinian strata, and the formation is mainly composed of limestone and dolomite with high resistance and velocity.
The above profile analysis method can also be applied to other lines. As shown in Figures 8–12, the inferred faults are abnormally reflected in varying degrees at the corresponding positions of different profiles, which also validates the reliability of fault inference. Based on these results and characteristics of the regional geological structure, nine faults (F1-F3 and F6-F11) are inferred in the preliminary stage, and two other faults numbered F4-F5 are geological measured faults (Table 3). The F1-F4 faults of NE trending constitute the fault system of the area and control the stratigraphic distribution and tectonic movement. Among them, the F1-F3 faults are shown in NW-trending profiles, indicating a continuous electrical and velocity structure. In particular, fault F3 is geologically the boundary of Laoshan Uplift strata, with different strata distributed on both sides. The NW-trending F5-F11 faults are all steep translational faults. These seven faults constitute the water transportation channel within the study area. The geological structure in the study area is complex, as the faults have the characteristics of multi-stage activities and have different properties in different geological periods.
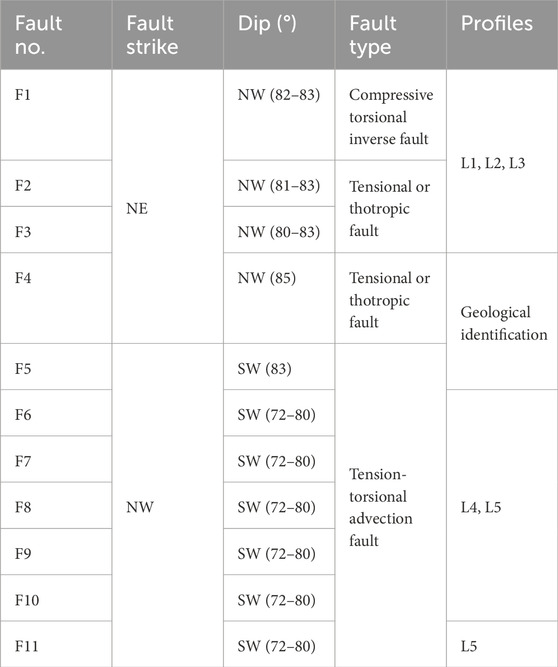
Table 3. Fault characteristics within the study area (Cai et al., 2021).
The distribution of strata in the area is determined in combination with the previous geological data.
Quaternary (Q): The whole study area is covered by the Quaternary with a thickness range of 15–40 m. The shallowest part of the Quaternary is distributed in the southeast of the L1, the L2, and the L3 line, and thus the southeast of the study area, which is close to the Laoshan Mountains. The deepest part of the Quaternary is distributed in Guozhuang and Chenzhuang in the southwest of the study area, corresponding to the central and northern parts of the L1 line and the southwest part of the L5 line.
Cretaceous (K) and Cambrian (Є): It is mostly distributed in the northwest parts of the L1 line, the L2 line, the L3 line, and the whole L5 line, which are also located in the northwest of the study area. The Cretaceous is characterized by low resistivity layers, and the Cambrian consists of relatively high resistivity layers. These strata cover the Sinian (partly Cambrian) strata within the area, and their lithology is mainly sandstone and mudstone.
Sinian (Z): This is the target stratum of this study. The Sinian is distributed throughout the area, and it has a major lithologic composition of dolomite. It can be divided into three regions according to the overlying strata. The first is in the southeast of the L1 and the L2 line, covered by the Quaternary with a shallow burial depth of 50 m. The second is in the southeast of the L3 line and the east of the L4 line, with the overlying strata of the Cambrian Mufushan Formation. The third area is in the northwest of the L1, the L2, the L3 line, and the whole L5 line. The overlying stratum is the Cretaceous Chishan Formation, with intermediate Cambrian Mufushan Formation locally. The burial depth of the Sinian gradually deepens from southeast to northwest.
According to the above interpretation of the preliminary stage, the geophysical inferred fault and strata distribution are given in Figure 15. We conclude that the NE-trending faults F1-F3 are major components of the Chuhe fault, the channels of deep heat source upwelling, and the major thermal-controlled structures. The NW-trending faults F5-F11 are steeper translational faults and are the major water-conducted structures in the area. Geothermal resources are mainly located within the intersection region of these NE- and NW-trending faults. As a sequence from F1 to F3, the buried depth of the heat source tends to become gradually shallower, and hot springs are exposed near the F3 fault. Combined with geological and geophysical data, the F1, F3, F5, and F11 faults are considered to represent the northern, southern, western, and eastern boundary of the Tangquan geothermal area.
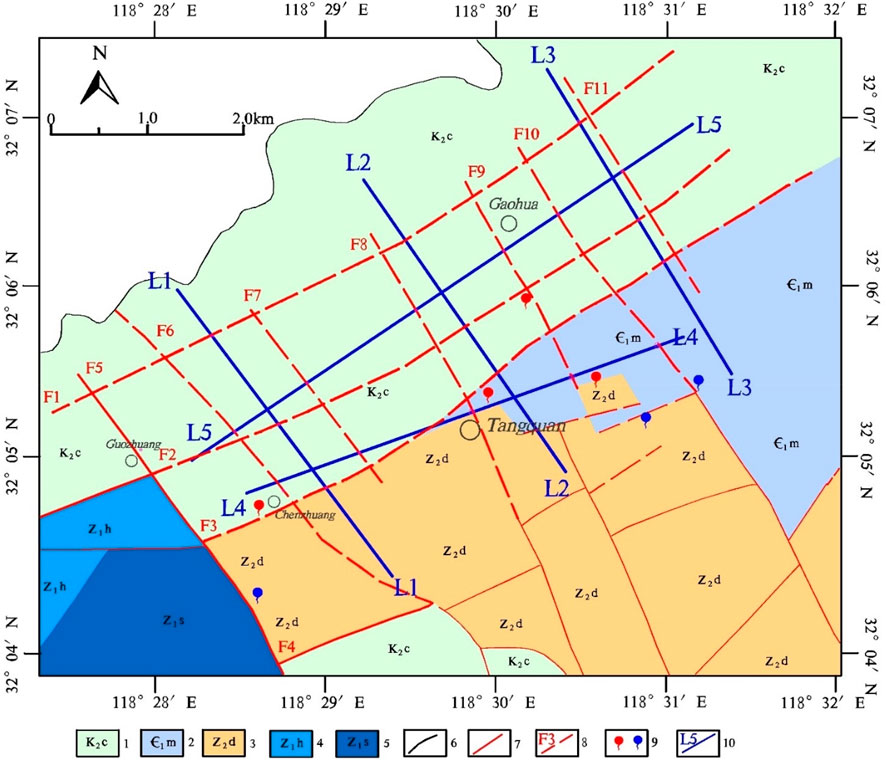
Figure 15. Geophysical inferred faults and bedrock distribution in the study area. 1, the Upper Cretaceous Chishan Formation (K2c); 2, the Lower Cambrian Mufushan formation (Є1m); 3, the Upper Sinian Dengying Formation (Z2d); 4, the Lower Sinian Huangxu Formation (Z1h); 5, the Lower Sinian Sujiawan Formation (Z1s); 6, inferred stratigraphic boundary; 7, geological identified fault; 8, inferred fault; 9, hot and cold springs; 10, survey profile.
Hot springs have been exposed around fault F3, and the anomaly is obvious. It is proposed to select a geothermal drilling well location around fault F3. Considering that the intersection of faults is a favorable location for geothermal formation, and there are hot springs exposed in the intersection area of F3 and F8, this area is selected as the key research point for geothermal exploration. It is less obvious than the CSAMT resistivity anomaly of the fault F8 at the L4 and L5 profile. Although hot springs are exposed, the water yield is low, and the formation conditions of the deep thermal reservoir are unclear. Therefore, a small amount of finer geophysical survey work has been deployed before the implementation of borehole verification.
A fine survey that contains four lines L11-L14 has been suggested based on the imaging results of the preliminary stage. The survey results of the L12 line are shown in Figure 16. The F8 fault, as illustrated on the L4 and the L5 line, is also obvious on the L12 line, as shown in Figure 16A. It is inferred that the F8 fault is a water storage structure with deep cutting. The range of low resistivity areas is relatively large, and the large inferred water-bearing volume can easily form a good groundwater storage space and transport channel under the regional tectonic stress field. Meanwhile, as shown in Figure 16B, the low-velocity anomaly is obvious around the F8 fault, which makes it easy to form a space for hot water. It is inferred that the overlying strata are Quaternary and Cambrian Mufushan Formation with a thickness of 300 m and are mainly composed of marly shale with low permeability and thermal conductivity. These strata are excellent covers for a geothermal storage aquifer.
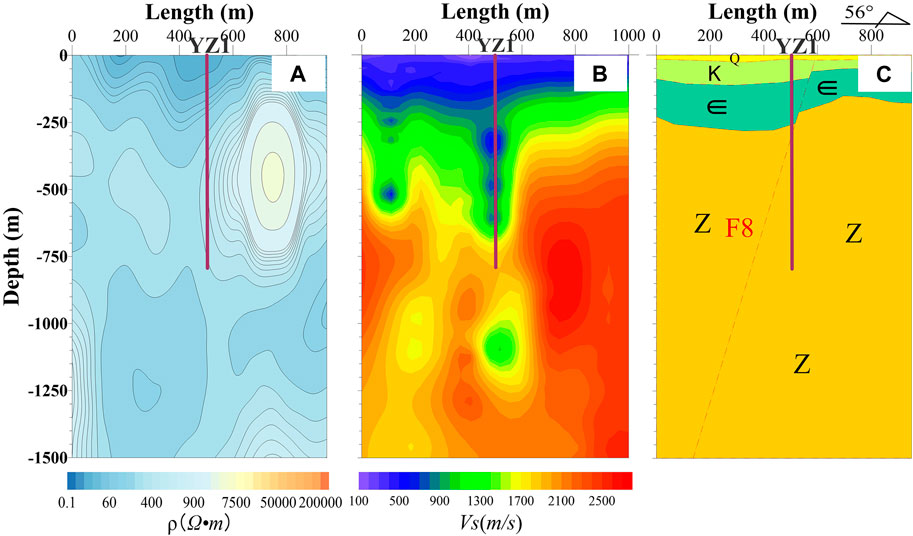
Figure 16. (A) CSAMT inversion, (B) microtremor pseudosection, and (C) strata explanation of the L12 line. The vertical red bar represents the YZ1 borehole.
From the interpretation above, the intersection of the F3 and the F8 fault has hydrogeological conditions for the formation of a geothermal source, channel, storage, and cap rock and is inferred as a fractured geothermal reservoir. A borehole YZ1 was suggested to be drilled at 500 m (observation point No. 200) of the L12 line with a well depth of 500 m (Figure 16). The final drilling depth reaches 801.56 m, and the stratigraphic properties of the borehole YZ1 are recorded in Figure 17. The drilling results of the YZ1 borehole show that two major aquifer sections exist in the borehole. Section 1 is located at a depth of 254.80–319.00 m; the free water outflow is 203.04 m3/d, and the pumping water outflow is 706.08 m3/d. Section 2 is located at a depth of 254.80–605.30 m; the free water outflow is 219.46 m3/d, and the pumping water outflow is 1,180.24 m3/d. The water of Section 2 is supplied by deep faults and fractures, and the water temperature at the wellhead is 46.1°C. Meanwhile, the fracture zone at a depth of 308.0–319.0 m is consistent with the inferred fault F8, as shown in Figure 16C. Furthermore, there may be thermal storage at the depth of 320–380 m and a small aquifer at the depth of 620 m∼640 m according to the temperature curve. These features of borehole drilling correspond well with the fracture-type water-bearing structure, as inferred from the CSAMT and the microtremor surveys.
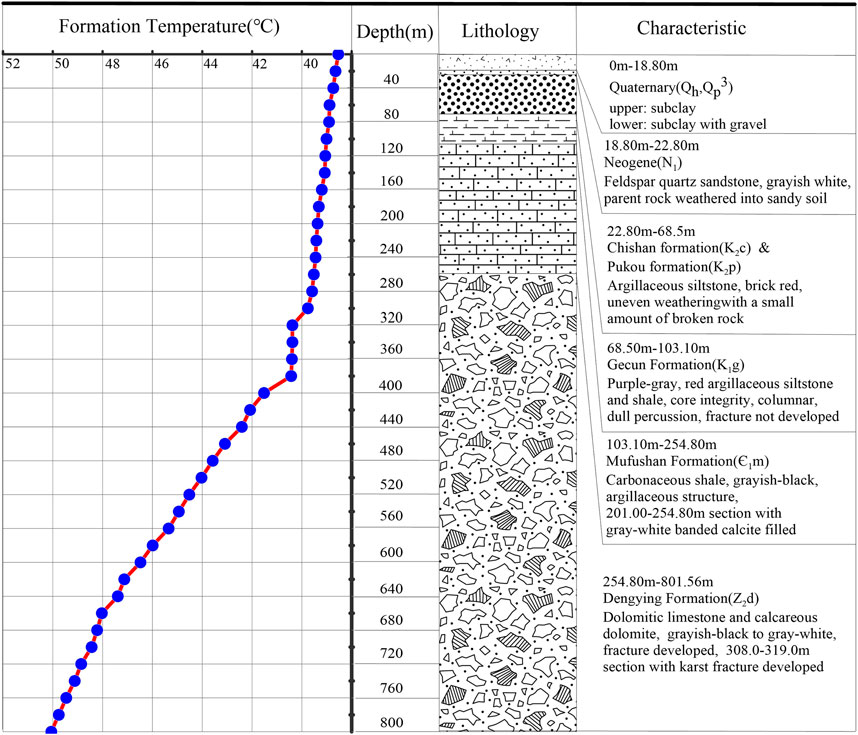
Figure 17. Stratigraphic properties of the borehole YZ1 and the temperature curve.
The geological structure and stratigraphic distribution of the study area have been interpreted and inferred through the resistivity profile and S-wave velocity profile obtained through the CSAMT and microtremor methods mentioned above. Based on the comprehensive understanding of the geological conditions for geothermal formation and the constraints of drilling information, the heat source in the Tangquan area, mainly arising from the deep geothermal flow, is established as the geothermal formation mechanism and reservoir model in the study area.
The geological structure and stratigraphic distribution of the study area have been interpreted and inferred according to the resistivity profile and S-wave velocity profile obtained by the CSAMT and microtremor methods mentioned above. Based on the comprehensive understanding of the geological conditions for geothermal formation and the constraints of drilling information, the heat source in the Tangquan area mainly comes from the deep geothermal flow, and the geothermal formation mechanism and reservoir model in the study area is established. The genetic mechanisms of the source, channel, reservoir, and cap rock are explained in detail below.
(1) The geothermal source. The study area is in the high heat flux anomaly zone along the eastern coast of China, and its genesis is related to the subduction of the Pacific plate to the Eurasian plate and the resultant uplift of the asthenosphere. The lithosphere thickness within the area is about 90 km with a Moho depth of 33 km, and the depth of the Curie interface is about 26 km (Qiu et al., 2022). What is more, the terrestrial heat flow value is about 65 mW/m2, indicating that the region has good geothermal formation conditions (Jiang et al., 2016; Yang et al., 2023). The regional magmatic rocks are not developed, indicating that the heat comes from the earth’s heat flow, that is, the formation of a non-volcanic geothermal system. This determines that within the top 3 km, only low-temperature (<90°C) geothermal resources exist. As for the water source, atmospheric precipitation converges in the Piedmont depression to form rich surface water. Surface water infiltrates into the Cretaceous breccia to form fissure water and into the deep Dengying Formation dolomite to form karst water along the NE-trending deep fault. As the main source of geothermal water in the study area, these two kinds of water are heated by the above geothermal gradient to form geothermal water.
(2) The geothermal tunnel. As mentioned, the NE- and NW-trending faults in the study area and its vicinity interweave into a net of fault structures (Figure 18). The Laoshan surface water migrates through the NE faults and fissures to the deep and gathers into geothermal water. The NW-trending faults, however, are responsible for water and heat conduction. When two or more sets of the NE and NW faults intersect, a heat source channel from deep to shallow is formed. Therefore, the Tangquan geothermal area is tectonically controlled, and the number of fracture zones accompanied by brecciation found during the drilling process of YZ1 are evidence of deep faults as geothermal channels.
(3) Geothermal storage. In the study area, the limy dolomite, siliceous dolomite, and dolomite of the Upper Sinian Dengying Formation (Z2d) have a total thickness of over 1,000 m. The formation is exposed in the core part of the Laoshan anticlinorium and is buried in the Piedmont area. From a hydrogeological view, the above-mentioned carbonate strata experienced many fault activities, uplifts, denudations, and rock dissolutions in the Yanshanian period, resulting in the development of karst fractures. The YZ1 borehole encountered karst caves successively below 315 m, and the drill fell out many times until 800 m. When drilling below 350 m, no rock powder returned out of the borehole, which further confirms the development of water-bearing karst fractures and caves. From the geothermal curve of well logging (Figure 17), the average geothermal gradient significantly increases within this segment, and there is a constant temperature between 320 m–380 m and 620 m–640 m, indicating the presence of multiple excellent thermal storage spaces at this depth.
(4) The geothermal cover. The Cambrian Mufushan Formation (Є1m), the Upper Cretaceous Pukou Formation (K2p), and the Quaternary (Q) have low permeability and thermal conductivity. From Figure 17, the geothermal gradient of shallow layers is low, and the measured thermal conductivity is generally 0.71–0.92 W/m°C (Lu et al., 2018). The value is much lower than that of the limy dolomite (2.01 W/m°C) (Du et al., 2012). A significant temperature increase in the strata is observed near 300 m underground; these all indicate that the overlying strata are a good covering layer for thermal storage aquifers.
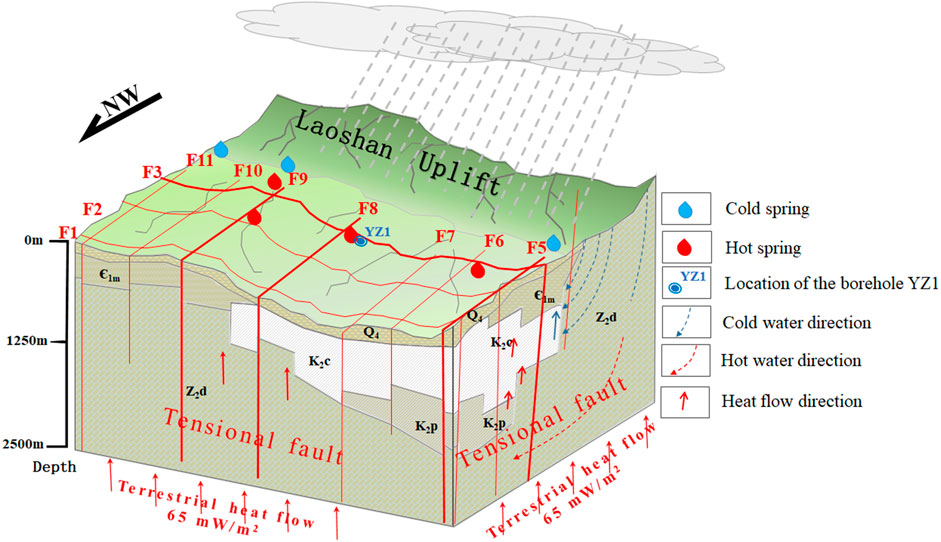
Figure 18. Regional fault system and the geothermal reservoir model.
According to the geothermal reservoir model in the Tangquan area (Figure 18) and the above discussion, the heat source mainly comes from deep terrestrial heat flow, and the formation of geothermal reservoirs is mainly controlled by tectonic convection. The Laoshan Uplift is an inverted anticline, and the rock formations on the north side are mainly northwest trends. Atmospheric precipitation infiltrates deep along exposed carbonate fissures and fault zones, continuously obtaining heat from surrounding rocks and gradually heating to form deep geothermal water. It is expected to reach around 75°C at a depth of 2.3 km (Yu et al., 2021). The intersection of the NE- and NW-trending faults on the north side of the Laoshan Uplift forms a geothermal water upwelling channel. Under the action of water pressure difference, it flows up to the lower permeability Cretaceous and Quaternary strata as geothermal cover, which are blocked by barriers, forming underground thermal reservoirs. Hot springs are exposed on the discontinuity of the geothermal cover, and low-temperature hot springs are exposed at the intersection of NW-trending faults (F8, F9) and NE-trending faults (F3). Deep geothermal anomalies are also observed in CSAMT and microtremor profiles. The cold springs exposed near Laoshan Mountain due to rainwater infiltration are shallower, and their water has no time to absorb heat from the surrounding rock.
CSAMT and microtremor surveys were implemented in two stages to explore geothermal resources in the study. In the preliminary stage, five comprehensive geophysical prospecting profiles L1-L5 were deployed, and high-precision resistivity and S-wave velocity results were obtained. By tracing the isolines of low resistivity, low-velocity anomalies, and dense steep, the fault systems and strata distribution in the study area were comprehensively interpreted and constructed and were consistent with the geological survey data. Based on the results of the preliminary stage, we deployed the fine stage exploration work L11-L12 to obtain the deep geothermal reservoir information more clearly at the intersection of faults F3 and F8 and clarify the deep geothermal formation mechanism. We accurately located an underground thermal reservoir, which was verified by a geothermal well YZ1. The total depth of the drilling is 801.56 m, and geothermal water with a wellhead temperature of 46.1° is obtained. The main aquifer is divided into two sections, and the wellhead water outflow is 1,180.24 m3/d. According to the temperature logging curve, there are two underground geothermal reservoirs, at 320 m–380 m and 620 m–640 m. In addition, fault F8 was observed in the drill core at a depth of 308.0–319.0 m, which shows the effectiveness of the joint interpretation of CSAMT and microtremor survey data.
A geothermal reservoir model was then established based on the fault system and stratigraphic distribution obtained from geophysical exploration in the study area, combined with YZ1 drilling data. The formation process of the geothermal system in the study area is described from the four aspects of “heat source, reservoir, cap rock, and channel” generated by geothermal energy; that is, atmospheric precipitation penetrates deep along the exposed carbonate layer fractures and fault zones, continuously obtains heat from the deep surrounding rock, and gradually heats to form deep geothermal water. The intersection of NE and NW faults forms the geothermal water upwelling channel, which is blocked by the barrier when upwelling to the Cretaceous and Quaternary strata. They have poor permeability as a geothermal cover rock under the effect of water pressure difference and form a geothermal reservoir. Thus, the hot springs in the research area are exposed on the surface at discontinuous areas of the cap rock, with characteristics of distribution along faults. It is suggested that the geothermal system in the Tangquan area is a typical fractured geothermal reservoir with large geothermal resource reserves and great development and utilization value.
The original contributions presented in the study are included in the article/Supplementary Material, and further inquiries can be directed to the corresponding authors.
HX: data curation, writing–original draft, writing–review and editing, validation, investigation, methodology. XY: methodology, writing–review and editing. XC: data curation, investigation, methodology, writing–review and editing. ZX: data curation, investigation, visualization, writing–review and editing. SL: supervision, validation, writing–review and editing. XW: data curation, funding acquisition, methodology, resources, writing–review and editing.
The author(s) declare that financial support was received for the research, authorship, and/or publication of this article. This work is financially supported by the National Key R and D Program of China (Grant number 2022YFF0800702), the National Natural Science Foundation of China (Grant numbers U2039206 and 42304080), and the Natural Science Foundation of Anhui Province, China (Grant number 2308085QD126).
The authors thank the reviewers for their constructive comments.
The authors declare that the research was conducted in the absence of any commercial or financial relationships that could be construed as a potential conflict of interest.
All claims expressed in this article are solely those of the authors and do not necessarily represent those of their affiliated organizations, or those of the publisher, the editors and the reviewers. Any product that may be evaluated in this article, or claim that may be made by its manufacturer, is not guaranteed or endorsed by the publisher.
Abraham, E. M., and Nkitnam, E. E. (2017). Review of geothermal energy research in Nigeria: the geoscience front. Int. J. Earth Sci. Geophys. 3 (1), 1–5. doi:10.35840/2631-5033/1815
Aki, K. (1957). Space and time spectra of stationary stochastic waves with special reference to microtremors. Bull. Earthq. Res. Inst. 35, 415–456.
Asten, M. W. (1979). Comments on “Microtremor site analysis study at Beatty, Nevada” by L. J. Katz and R. J. Bellon. Bull. Seismol. Soc. Am. 69 (5), 1633–1635. doi:10.1785/bssa0690051633
Asten, M. W., Stephenson, W. J., and Hartzell, S. (2019). Spatially averaged coherencies (krSPAC) and Rayleigh effective-mode modeling of microtremor data from asymmetric arrays. Geophysics 84 (3), EN47–EN56. doi:10.1190/geo2018-0524.1
Atef, H., Abd El-Gawad, A. M. S., Abdel, Z. M., and Farag, K. S. I. (2016). The contribution of gravity method in geothermal exploration of southern part of the Gulf of Suez–Sinai region, Egypt. J. Astron. Geophys. 5 (1), 173–185. doi:10.1016/j.nrjag.2016.02.005
Athens, N. D., and Caers, J. K. (2021). Gravity inversion for geothermal exploration with uncertainty quantification. Geothermics 97, 102230. doi:10.1016/j.geothermics.2021.102230
Cai, H., Kong, R., He, Z., Wang, X., Liu, S., Huang, S., et al. (2024). Joint inversion of potential field data with adaptive unstructured tetrahedral mesh. Geophysics 89 (3), G45–G63. doi:10.1190/geo2023-0280.1
Cai, H., Long, Z., Lin, W., Li, J., Lin, P., and Hu, X. (2021a). 3D multinary inversion of controlled-source electromagnetic data based on the finite-element method with unstructured mesh. Geophysics 86 (1), E77–E92. doi:10.1190/geo2020-0164.1
Cai, X., Xu, H., Tian, X., Chen, H., Jia, H., and Liu, W. (2021b). Geophysical report on the investigation and evaluation of underground geothermal resources in tangquan District. Nanjing City Pukou Dist.
Chen, G., Ge, S., Zhao, Y., Chen, K., and Hu, S. (2021). Factors influencing microtremor data collected using nested-triangular array configurations. IOP Conf. Ser. Earth Environ. Sci. 660 (1), 012085. doi:10.1088/1755-1315/660/1/012085
Dalkhani, A. R., Zhang, X., and Weemstra, C. (2021). On the potential of 3D transdimensional surface wave tomography for geothermal prospecting of the reykjanes peninsula. Remote Sens. 13 (23), 4929. doi:10.3390/rs13234929
Du, J., Xu, X., and Fan, D. (2012). Geoheat resource types and development prospect in Jiangsu Province (in Chinese). J. Geol. 36 (1), 86–91. doi:10.3969/j.issn.1674-3636.2012.01.86
Fu, G., Huang, J., Liu, Y., Li, X., Chen, G., and Huang, Y. (2019). Multi-electrode resistivity method and CSAMT method in geothermal exploration of Babei area in Huichang County, Jiangxi Province (in Chinese). Geol. China 46 (4), 927–936. doi:10.12029/gc20190421
Gasperikova, E., Newman, G., Feucht, D., and Arnason, K. (2011). 3D MT characterization of two geothermal fields in Iceland. GRC Trans. 35 (1-2), 1667–1671.
Grandis, H., and Sumintadireja, P. (2012). “A brief review of the proper application of magnetotelluric (MT) and controlled-source audio-frequency magnetotelluric (CSAMT) in geothermal exploration,” in The 12th annual Indonesian geothermal association meeting and conference.
Gupta, H. K., and Roy, S. (2006). Geothermal energy: an alternative resource for the 21st century. Elsevier.
Hardesty, K., Wolf, L. W., and Bodin, P. (2010). Noise to signal: a microtremor study at liquefaction sites in the New Madrid Seismic Zone. Geophysics 75 (3), B83–B90. doi:10.1190/1.3374357
He, K., Huang, R., Xu, Y., Hu, S., and Wei, P. (2022). Crustal structures beneath the Northern Jiangsu Basin and its surrounding areas: implications for geothermal prospecting. J. Geophys. Eng. 19, 316–325. doi:10.1093/jge/gxac018
Hersir, G. P., and Árnason, K. (2009). Resistivity of rocks. Short course on surface exploration for geothermal resources. UNUGTP LaGeo, 17–30.
Hlousek, F., Hellwig, O., and Buske, S. (2015). Three-dimensional focused seismic imaging for geothermal exploration in crystalline rock near Schneeberg, Germany. Geophys. Prospect. 63, 999–1014. doi:10.1111/1365-2478.12239
Ismail, N., Syukri, M., and Idroes, R. (2019). Deep and shallow structures of geothermal SeulawahAgam based on electromagnetic and magnetic data. Int. J. GEOMATE 16 (53), 141–147. doi:10.21660/2019.53.17214
Jiang, G., Gao, P., Rao, S., Zhang, Y., Tang, X., Huang, F., et al. (2016). Compilation of heat flow data in the continental area of China. Chin. J. Geophys 59 (8), 2892–2910. doi:10.6038/cjg20160815
Joel, P. K., Louise-Clotilde, O. A. M., Evariste, N., Nfor, N., Malquaire, K. P. R., and Philippe, N. N. (2022). Identification of geothermal reservoirs in south Cameroon from a combined landsat 8 and AMT data. Int. J. Geophys. 2022, 1–17. doi:10.1155/2022/1324766
Kana, J. D., Djongyang, N., Raïdandi, D., Nouck, P. N., and Dadjé, A. (2015). A review of geophysical methods for geothermal exploration. Renew. Sustain. Energy Rev. 44, 87–95. doi:10.1016/j.rser.2014.12.026
Li, X., and Li, Q. (2017). Rayleigh wave dispersion curve imaging using improved F-K transform approach. Prog. Geophys. (in Chinese) 32 (1), 0191–0197. doi:10.6038/pg20170126
Ling, S., Miwa, S., and Liu, Y. (2006). The evaluation of soil structures by surface wave prospecting method and microtremor survey method - 2004 mid-Niigata prefecture earthquake: in A new technique on engineering geophysical method. Beijing: Geological Publishing House.
Liu, Y., Wang, G., Zhu, X., and Li, T. (2021). Occurrence of geothermal resources and prospects for exploration and development in China. Energy Exploration and Exploitation 39 (2), 536–552. doi:10.1177/0144598719895820
Lu, L., Pang, Z., Kong, Y., Guo, Q., Wang, Y., Xu, C., et al. (2018). Geochemical and isotopic evidence on the recharge and circulation of geothermal water in the Tangshan geothermal system near Nanjing, China: implications for sustainable development. Hydrogeology Journal 26 (5), 1705–1719. doi:10.1007/s10040-018-1721-6
Mabuzied, S. M., Kaiser, M. F., Shendi, E. H., and Abdel-Fattah, M. I. (2020). Multi-criteria decision support for geothermal resources exploration based on remote sensing, GIS and geophysical techniques along the Gulf of Suez coastal area, Egypt. Geothermics 88, 101893. doi:10.1016/j.geothermics.2020.101893
Mitjanas, G., Ledo, J., Macau, A., Alías, G., Queralt, P., Bellmunt, F., et al. (2021). Integrated seismic ambient noise, magnetotellurics and gravity data for the 2D interpretation of the Vallès basin structure in the geothermal system of La Garriga- Samalús (NE Spain). Geothermics 93, 102067. doi:10.1016/j.geothermics.2021.102067
Mitsuhata, Y., Uchida, T., and Amano, H. (2002). 2.5-D inversion of frequency-domain electromagnetic data generated by a grounded-wire source. Geophysics 67 (6), 1753–1768. doi:10.1190/1.1527076
Morales, J., Vidal, F., Pena, J. A., Alguacil, G., and Ibanez, J. M. (1991). Microtremor study in the sediment-filled basin of zafarraya, granada (southern Spain). Bulletin of the Seismological Society of America 81 (2), 687–693. doi:10.1785/bssa0810020687
Munoz, G. (2014). Exploring for geothermal resources with electromagnetic methods. Surveys in geophysics 35 (1), 101–122. doi:10.1007/s10712-013-9236-0
Okada, H. (2006). Theory of efficient array observations of microtremors with special reference to the SPAC method. Exploration Geophysics 37 (1), 73–85. doi:10.1071/eg06073
Oskooi, B., Pedersen, L. B., Smirnov, M., Árnason, K., Eysteinsson, H., Manzella, A., et al. (2005). The deep geothermal structure of the Mid-Atlantic Ridge deduced from MT data in SW Iceland. Physics of the Earth and Planetary Interiors 150 (1-3), 183–195. doi:10.1016/j.pepi.2004.08.027
Pang, Z., Kong, Y., Shao, H., and Kolditz, O. (2018). Progress and perspectives of geothermal energy studies in China: from shallow to deep systems. Environmental Earth Sciences 77 (16), 580–585. doi:10.1007/s12665-018-7757-z
Patro, P. K. (2017). Magnetotelluric studies for hydrocarbon and geothermal resources: examples from the asian region. Surveys in Geophysics 38 (5), 1005–1041. doi:10.1007/s10712-017-9439-x
Peng, C., Pan, B., Xue, L., and Liu, H. (2019). Geophysical survey of geothermal energy potential in the Liaoji Belt, northeastern China. Geothermal Energy 7 (1), 14–19. doi:10.1186/s40517-019-0130-y
Qiu, N., Tang, B., and Zhu, C. (2022). Deep thermal background of hot spring distribution in the Chinese continent. Acta Geologica Sinica 96 (1), 195∼207. doi:10.19762/j.cnki.dizhixuebao.2022022
Ruiz-Aguilar, D., Tezkan, B., Arango-Galván, C., and Romo-Jones, J. M. (2020). 3D inversion of MT data from northern Mexico for geothermal exploration using TEM data as constraints. Journal of Applied Geophysics 172, 103914. doi:10.1016/j.jappgeo.2019.103914
Sandberg, S. K., and Hohmann, G. W. (1982). Controlled-source audio magnetotellurics in geothermal exploration. Geophysics 47 (1), 100–116. doi:10.1190/1.1441272
Scott, M., and Mykle, R. (2006). SCSINV documentation: ZONGE data processing smooth-model CSAMT inversion. Electronic document Zonge International. Available at: http://www.zonge.com/legacy/ModelAMT.html.
Smith, N. R. A., Reading, A. M., Asten, M. W., and Funk, C. W. (2013). Constraining depth to basement for mineral exploration using microtremor: a demonstration study from remote inland Australia. Geophysics 78 (5), B227–B242. doi:10.1190/geo2012-0449.1
Soengkono, S., Bromley, C., Reeves, R., Bennie, S., and Graham, D. (2013). Geophysical techniques for low enthalpy geothermal exploration in New Zealand. Exploration Geophysics 44, 215–227. doi:10.1071/eg13036
Speer, B., Economy, R., Lowder, T., Schwabe, P., and Regenthal, S. (2014). Geothermal exploration policy mechanisms: lessons for the United States from international applications. CO, United States: Presented at National Renewable Energy Laboratory.
Sudjono, D. S., Harmoko, U., and Yuliyanto, G. (2019). “Delineation of geothermal manifestation in sangubanyu area based on microtremor HVSR method,” in E3S web of conferences (EDP Sciences). doi:10.1051/e3sconf/201912514012
Thanassoulas, C. (1991). Geothermal exploration using electrical methods. Geoexploration 27 (3-4), 321–350. doi:10.1016/0016-7142(91)90005-w
Tian, B., Xu, P., Ling, S., Du, J., Xu, X., and Pang, Z. (2017). Application effectiveness of the microtremor survey method in the exploration of geothermal resources. Journal of Geophysics and Engineering 14 (5), 1283–1289. doi:10.1088/1742-2140/aa7f4e
Tian, B., You, Z., Wang, G., and Zhang, J. (2022). Building a geothermal formation model using microtremor array measurement. Geophysics 87 (1), B23–B30. doi:10.1190/geo2021-0014.1
Tokimatsu, K., Shinzawa, K., and Kuwayama, S. (1992). Use of short-period microtremors for vs profiling. Journal of Geotechnical Engineering 118 (10), 1544–1558. doi:10.1061/(asce)0733-9410(1992)118:10(1544)
Wang, G., Liu, Y., Zhu, X., and Zhang, W. (2020). The status and development trend of geothermal resources in China (in Chinese, abstract in English). Earth Science Frontiers 27 (1), 001–009. doi:10.13745/j.esf.2020.1.1
Wu, Z. (1994). Regional geological survey report of quanjiao county(I50E024018) and jiangpu county(I50E024019). Nanjing: Jiangsu Provincial Bureau of Geology and Mineral Resources Investigation and Research Institute.
Xie, J., Cai, H., Hu, X., Long, Z., Xu, S., Fu, C., et al. (2021). 3-D Magnetotelluric inversion and application using the edge-based finite element with Hexahedral mesh. IEEE Transactions on Geoscience and Remote Sensing 60, 1–11. doi:10.1109/tgrs.2021.3079420
Xu, C., Yu, D., and Luo, Z. (2020). Hydrogeochemistry of geothermal water from the Tangquan in Nanjing and its indicating significance (in Chinese). Science Technology and Engineering 20 (28), 11472–11478.
Xu, H., Wu, X., Sheng, Y., Liao, S., Jia, H., and Xu, Z. (2021). Application of microtremor survey in the urban land subsidence (in Chinese, abstract in English). Geophysical and Geochemical Exploration 45 (6), 1512–1519. doi:10.11720/wtyht.2021.0053
Xu, P., Ling, S., Li, C., Du, J., Zhang, D., Xu, X., et al. (2012). Mapping deeply-buried geothermal faults using microtremor array analysis. Geophysical Journal International 188 (1), 115–122. doi:10.1111/j.1365-246x.2011.05266.x
Yang, L., Kuang, R., Guo, H., Zuo, L., Gou, F., Xu, S., et al. (2023). Current geothermal field of the South Jiangsu modernization demonstrative area and its influencing factors (in Chinese, abstract in English). GEOSCIENCE 37 (4), 954–962. doi:10.19657/j.geoscience.1000-8527.2022.095
Yu, D., Xu, C., Luo, Z., Gu, W., and Zhou, L. (2021). Origin and genesis model of the Tangquan geothermal water in Nanjing (in Chinese, abstract in English). Geological Bulletin of China 42 (11), 2006–2013. doi:10.12097/j.issn.1671-2552.2023.11.016
Yuan, X. (2021). 1/200000 regional gravity map of Nanjing (I-50-35) (in Chinese). Beijing, China: China Geological Data Center.
Zakari, A., Nouck, P. N., and Nouayou, R. (2016). A discussion of major geophysical methods used for geothermal exploration in Africa. Renewable and Sustainable Energy Reviews 58, 775–781. doi:10.1016/j.rser.2015.12.277
Zhang, Y., and Zhao, G. (2020). A global review of deep geothermal energy exploration: from a view of rock mechanics and engineering. Geomechanics and Geophysics for Geo-Energy and Geo-Resources 6 (1), 4–26. doi:10.1007/s40948-019-00126-z
Keywords: geothermal resource, microtremor, CSAMT, borehole verification, geothermal reservoir model, geothermal formation mechanism
Citation: Xu H, Yang X, Cai X, Xu Z, Liao S and Wu X (2024) Exploring geothermal resources with the CSAMT and microtremor methods: a case study in Tangquan, Jiangsu Province, China. Front. Earth Sci. 12:1437850. doi: 10.3389/feart.2024.1437850
Received: 24 May 2024; Accepted: 07 June 2024;
Published: 24 July 2024.
Edited by:
Lidong Dai, Chinese Academy of Sciences, ChinaReviewed by:
Handong Tan, China University of Geosciences, ChinaCopyright © 2024 Xu, Yang, Cai, Xu, Liao and Wu. This is an open-access article distributed under the terms of the Creative Commons Attribution License (CC BY). The use, distribution or reproduction in other forums is permitted, provided the original author(s) and the copyright owner(s) are credited and that the original publication in this journal is cited, in accordance with accepted academic practice. No use, distribution or reproduction is permitted which does not comply with these terms.
*Correspondence: Xiaoping Wu, d3hwQHVzdGMuZWR1LmNu; Xiaodong Yang, eXhkZHl4emhAdXN0Yy5lZHUuY24mI3gwMjAwYTs=
Disclaimer: All claims expressed in this article are solely those of the authors and do not necessarily represent those of their affiliated organizations, or those of the publisher, the editors and the reviewers. Any product that may be evaluated in this article or claim that may be made by its manufacturer is not guaranteed or endorsed by the publisher.
Research integrity at Frontiers
Learn more about the work of our research integrity team to safeguard the quality of each article we publish.