 Yue Xiao
 Weidong Jiang
- Research Institute of Petroleum Exploration and Development (RIPED), Beijing, China
The Duvernay Formation in Canada is one of the major oil and gas source formations in the Western Canadian Sedimentary Basin, located at its deepest point. While it demonstrates promising development potential, challenges arise in the urgent need for integration of geology and engineering models, as well as in optimizing sweet spots, particularly as infill wells and pads become central operational objectives for the shale gas field. A lack of the geomechanical understanding of shale gas reservoirs presents a significant obstacle in addressing these challenges. To overcome this, we implemented data acquisition and prepared historical models and profiles, resulting in an extended high-resolution geological and reservoir property model with a fine grid system. Subsequently, a 3D full-field multi-scale geomechanical model was constructed for the main district by integrating seismic data (100 m), geological structures (km), routine logs (m), core data (cm), and borehole imaging (0.25 m), following a well-designed workflow. The predicted fracturability index (brittleness) ranges from 0.6 to 0.78, and a lower horizontal stress difference (STDIFF) is anticipated in the target formation, Upper Duvernay_D, making it a favorable candidate for hydraulic fracturing treatment. Post-analysis of the multi-disciplinary models and various data types provides guidelines for establishing a specific big database, which serves as the foundation for production performance analysis and aggregate sweet spot analysis. Fourteen geological and geomechanical candidate parameters are selected for the subsequent sweet spot analysis. This study highlights the effectiveness of multi-scale geomechanical modeling as a tool for the integration of multi-disciplinary data sources, providing a bridge between geological understanding and future field development decisions. The workflows also offer a data-driven framework for selecting parameters for sweet spot analysis and production dynamic analysis.
1 Introduction
The development of unconventional resources, such as shale gas and tight gas, presents one of the largest challenges for the oil and gas industry. While the fundamental logistics for characterizing and developing unconventional plays are similar to those for conventional resources, the process is complicated by the heterogeneous and anisotropic nature of the reservoirs, as well as the limited operational and dynamic timescales from development to depletion. The industry is currently navigating the complexities of an integrated cross-functional process, where the optimal development plan relies on a multi-scale and multi-disciplinary workflow.
Recent geomechanical studies on shale gas and oil development (Dusseault, 2013) (Rodriguez-Herrera et al., 2013) have focused on several aspects, including experimental mechanical studies that primarily address wellbore integrity and the mechanical parameters of physical models (Mehana et al., 2022). These studies also involve the prediction and calculation of geomechanical properties under experimental conditions (Bohn et al., 2020), the establishment of geomechanical models (Srinivasan et al., 2022)- (Ma et al., 2022), the design of refracturing operations (Zoback et al., 2022), and well pad development (Liu et al., 2022)- (Kuroda and Hayate, 2022). When designing and optimizing multiple-stage hydraulic fracturing, the primary factors influencing the stress field at the target well location include production history, interference among stages, and frac-hit occurrences between wells. Furthermore, in formations where natural fractures (NFs) are well-developed (Weng et al., 2011), it is important to consider the mechanisms and patterns of fault and NF development, as well as the interactions between natural fractures and hydraulic fractures. In China, there has been a detailed discussion and investigation into the establishment and application of geomechanical models during the geological–engineering integrated development of unconventional shale gas plays (Liang et al., 2016)- (Chen et al., 2017).
The success of operations during the Shale Revolution in North America can be attributed to several factors, including technological innovations, management reforms, and the establishment of comprehensive databases by both government and commercial platforms, which enhance data exchange efficiency. Prominent commercial database platforms in Canada, such as GeoSCOUT (GeoSCOUT, 2024) and Canada Discovery (Canadian Discovery, 2024), along with Enverus (Enverus, 2024) in the United States, have significantly contributed to this landscape. Once a permit is granted, access to state government databases can be readily obtained, as federal and state governments impose regulations on the reporting frequency of well data and the updating of field data (State public database in United States, 2024). These commercial databases play a crucial role in operators’ decision-making processes. Even before the shale play boom of the 2010s, technological advancements led to the daily generation of substantial datasets in the oil and gas upstream and downstream sectors. Research indicates that over half of the time of engineers and geoscientists is spent searching for and consolidating data before initiating multi-disciplinary analysis (Brule et al., 2009). Furthermore, major oil companies are reassessing how data quality and density influence engineering decisions (Gaillot et al., 2020). It is essential for drilling and completion engineers to conduct rigorous quality checks on interpreted data provided by geologists and geophysicists prior to modeling activities. Reservoir properties and geomechanical parameters must be inter-validated across multiple data sources and scales; otherwise, the inherent uncertainty in models may lead to unreliable calculations and predictions.
The integration of multi-disciplinary and multi-scale data for informed decision-making necessitates several critical components: 1) high-resolution geomodeling (Ehsan and Gu, 2020)- (Amjad et al., 2023); 2) accurate interpretation of petrophysical and reservoir properties (Ehsan et al., 2024); and 3) robust computation and modeling of geomechanical parameters. Geomechanical modeling plays a pivotal role in bridging the gap between evaluation and design scenarios by incorporating geological complexity and addressing pre-existing mechanical discontinuities and anisotropic deformation, such as faults, bedding planes, and natural fractures (Eze and Hu, 2023), in conjunction with hydraulic fracturing systems. The development of a multi-scale geomechanical model facilitates the prediction of NFs across various scales and the upscaling of geomechanical parameters in three-dimensional distributions using advanced geostatistical methodologies.
By utilizing the geomechanical model, hydraulic fracturing simulations can optimize treatment designs for individual wells (Mariscal-Romero and Rodolfo, 2022) or across designated operational districts. This model effectively captures the evolution of in situ stresses induced by reservoir depletion, infill drilling, and refracturing interventions through iterative calculations, resulting in reliable production history matches (Xiao et al., 2022)- (Pradhan et al., 2022) and accurate production forecasts, thereby enhancing the optimization of landing zone selections (Xiong, 2020). The Duvernay Formation, recognized as one of North America’s most prominent unconventional shale plays (Kleiner, 2019) (Kleiner and Aniekew, 2019), offers an extensive array of case studies focusing on regional geomechanical assessments (Li et al., 2020)- (Leshchyshyn and Thomson, 2016), optimization of hydraulic fracturing treatment parameters (Thomson et al., 2016)- (Bowie, 2018), production prediction and enhancement (Hui et al., 2023), as well as seismic monitoring (Hui and Gu, 2023).
This article presents a case study on the integrated geological–engineering investigation of CNPC’s Duvernay project in Simonette District, as submitted to the journal Frontiers in Earth Science. During the extensive data acquisition and processing phases, multi-disciplinary and multi-scale parameter calculations and modeling workflows for unconventional shale gas reservoirs were developed. First, the processing of multi-disciplinary input data and the related model assumptions are clarified and discussed in detail. Then, the workflows for the multi-scale geomechanical model and reservoir model are outlined, considering the data acquisition conditions established in the previous steps: 1) identification and modeling of NFs; 2) calculation of 1D geomechanical parameters for single wells; and 3) 3D geomechanical modeling and in situ stress predictions. Finally, the quality of the data is reassessed based on the multi-scale geomechanical model, and the controlling parameters for production performance are summarized for both geological and geomechanical candidates. This provides a foundation for the pre-construction of big data-based deep analysis. The development of a regional high-resolution reservoir attribute and geomechanical model offers valuable insights for parameter determination in sweet spot exploration and dynamic production analysis.
2 Project overview
The Duvernay Formation in Canada is a major oil and gas source formation located in the Western Canadian Sedimentary Basin, situated at the deepest point of the basin (Figures 1A, B). As a globally significant unconventional shale gas play, the formation has produced over 70 million barrels of equivalent gas from conventional reservoirs. The unconventional oil and gas zone spans an area of 6 million acres, contributing an estimated 110 to 190 billion barrels of equivalent oil resources. The target formation for the Duvernay project is the Devonian shale, which is rich in condensate oil.
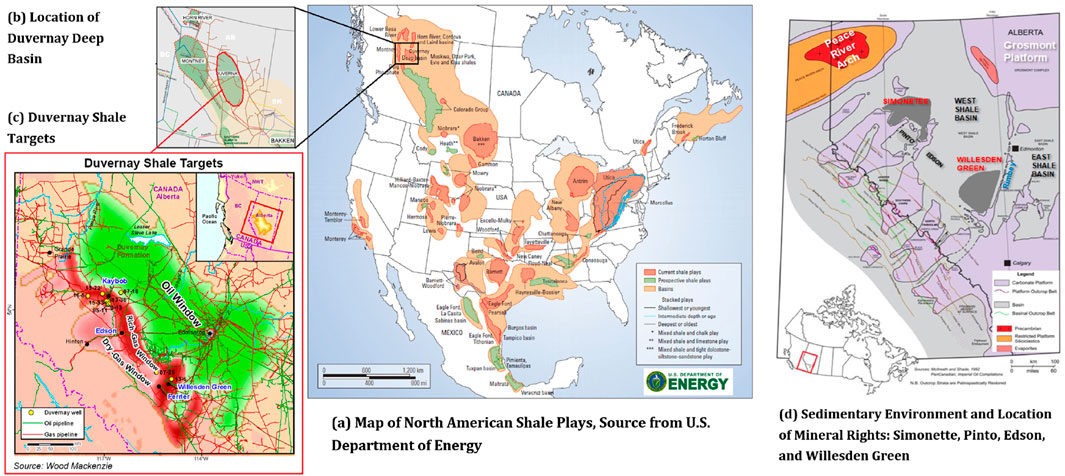
Figure 1. Overview of Duvernay Formation and project district: (A) distribution of shale plays in North America, source: U.S. Department of Energy (DOE); (B) location of Duvernay deep basin, source: U.S. Natural Gas Institute (NGI). (C) Duvernay shale target: Kaybob, Edson, Willesden Green, and Ferrier; well locations and oil–gas window, source: Wood Mackenzie. (D) Locations of mineral rights in Duvernay Formation and geological map of sedimentary basin (modified from Gilhooly et al., 2014) (Weissenberger et al., 2014).
The joint venture (JV) project began in 2012 with Encana (now Ovintiv), and the assets were segregated in 2020 when CNPC became the sole operator for the districts, including the studied area. The primary development area is Simonette, covering 254 km2, which demonstrates strong development prospects for shale targets (Figure 1C). Dunn et al. (2012) illustrates a typical 3D sedimentary environment near Simonette, while Figure 1D marks the locations of other mineral rights within the Simonette region. The joint lands dip to the southwest. Over the past decade of full-scale development, the JV project has accelerated the iteration of unconventional resource development technologies, leading to a deeper understanding of the underground complexities and rock–liquid characteristics.
Petrophysical analyses were conducted on exploration wells as part of resource evaluation efforts during the early development stage. Although detailed discussions and consortium processes are beyond the scope of the current study, the results of the stratigraphical interpretation are presented in Figure 2. The Simonette Devonian formation features organic-rich shale with total organic carbon (TOC) levels ranging from 2% to 6%. It is vertically divided into three segments: Upper Duvernay shale, Middle Duvernay carbonate, and Lower Duvernay clay. The major production zone, the Upper Duvernay, is approximately 60 m thick and includes 10 m of limestone interlayers along with thin layers of clay limestone.
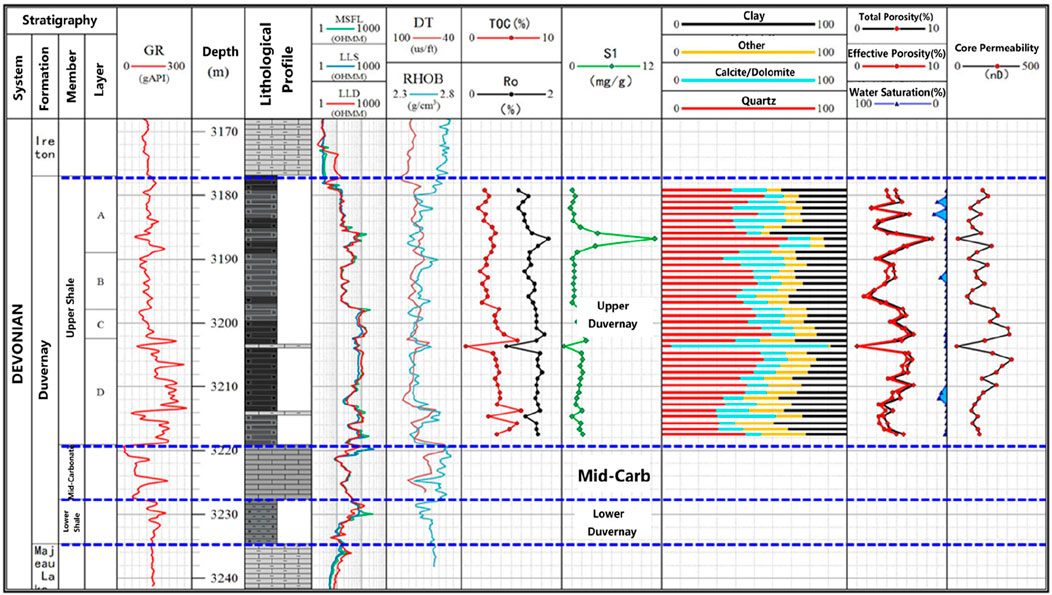
Figure 2. Duvernay composite stratigraphy of exploration well #1. Panel content in sequence: stratigraphy, gamma ray (GR), depth, resistivity logs (shallow, LLS; deep, LLD; medium, MSFL), sonic velocity and density logs (DT and RHOB), total organic carbon and maturity (TOC and Ro), absorbed gas Content (S1), lithological composition, log-interpreted porosity and water saturation, and core-based permeability.
Characteristically, the Duvernay Formation is a classic high-resistivity shale reservoir with near-zero water saturation and interconnected organic porosity structures. Key coring and formation property observations confirm that permeable, interconnected effective porosity structures are accessible via highly connected, orthogonal fracture patterns. The Upper Duvernay is further subdivided into segments A, B, C, and D based on the TOC and lithological composition, with Upper Duvernay_D being identified as the most favorable landing zone due to its greater thickness and superior TOC performance.
We compare the reservoir properties of typical shale plays in North America with those of the Canadian Duvernay formation: Haynesville, Marcellus, Eagle Ford, and Barnett. Notably, unconventional plays in North America, such as Horn River, Bakken, and Marcellus, have achieved successful and economical production levels comparable to those found in the Duvernay Formation.
3 Data acquisition and preparation
The primary task before undertaking multi-scale geomechanical modeling is the comprehensive assembly of data, which involves evaluating both the density and quantity of multi-source data within the studied area. Adequate data density is essential to ensure that sufficient effective data are available for most of the target district; this includes verifying the well count and ensuring that well data are sufficient to support the establishment of a foundational geological model, as insufficient data density can introduce significant uncertainty into the model from the outset. In terms of quantity, it is important to verify specific data types, such as reservoir pore pressure obtained from formation leak-off tests compared to measurements derived from diagnostic fracture injection tests; substantial discrepancies among these data sources can undermine their reliability and necessitate further investigation into their measurement processes and derivation methods. A summary of the current data acquisition efforts is provided in Table 1. Prior to any analysis or decision-making, integrating these data through various software tools from multiple vendors is critical for ensuring the robustness and accuracy of the subsequent analyses.
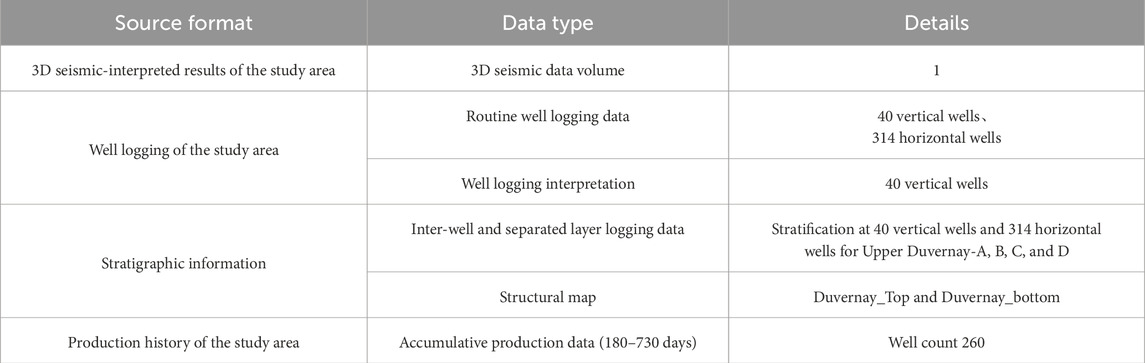
Table 1. List of old data and model acquisition, data source, data type, and dataset details.
4 Problems and methodologies
Since the inception of the Joint Adventure Project in 2012, the targeted district has undergone significant changes, with infill drilling of wells and pads emerging as the predominant operational strategy during the middle-to-late stages of gas reservoir development. An analysis of current data acquisition along with historical models has identified several unresolved issues that impede future development.
i) 1) Absence of a discrete fracture network (DFN) model: the presence of horizontal beddings and well-developed high-angle natural fractures is advantageous for increasing the stimulated reservoir volume (SRV) and facilitating height-constrained fracture propagation. The lack of a DFN model poses substantial challenges to the development of a reliable reservoir depletion model and the optimization of the field development plan (FDP).
ii) 2) Lack of an integrated geological–engineering model: the existing geological model is limited to the original seismic explored area and does not incorporate geomechanical properties or in situ stress models. This limitation hinders the ability to conduct comprehensive reservoir and hydraulic fracturing simulations.
iii) 3) Ambiguity regarding dominant controlling factors: the primary factors influencing productivity and the enhancement of fracturing stimulation remain poorly defined.
iv) 4) Requirement for systematic sweet spot analysis: based on the current data acquisition efforts, improvement in data quality can be achieved by validating reservoir properties across multiple sources.
The concerns delineated in points iii) and iv) will extend beyond the scope of this study and will be addressed in subsequent publications. The reconstruction of a refined geological model and a multi-scale natural fracture DFN model will adhere to the integrated flowchart illustrated in Figures 3A, B. Furthermore, the prediction and calculation of the geomechanical model and three-dimensional stress distribution, as depicted in Figure 12, serve as critical inputs for optimizing hydraulic fracture design. These outputs, resulting from petrophysical analyses, highlight the geological complexity and anisotropy inherent in unconventional shale and tight gas reservoir developments. Advanced methodologies for hydraulic fracturing and flow simulation must account for multiple geological phenomena; failure to accurately capture fine-scale formation property inputs could lead to questionable predictions regarding hydraulic fracturing outcomes and effective SRV.
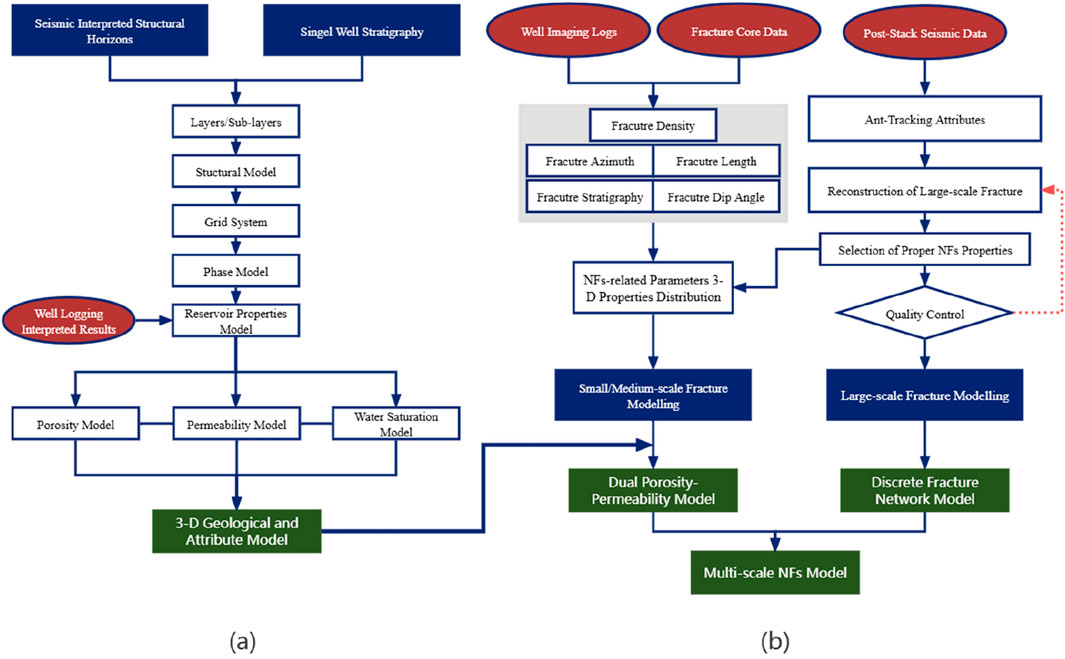
Figure 3. Integrated workflow of multi-scale geological modeling. (A) Flowchart adopted for reconstruction of the high-resolution geological model. (B) Workflow applied for multi-scale natural fracture (NF) prediction and evaluation.
The methodologies utilized in establishing models and performing simulation upscaling are summarized in Table 2 and will be discussed in detail in the following sections.
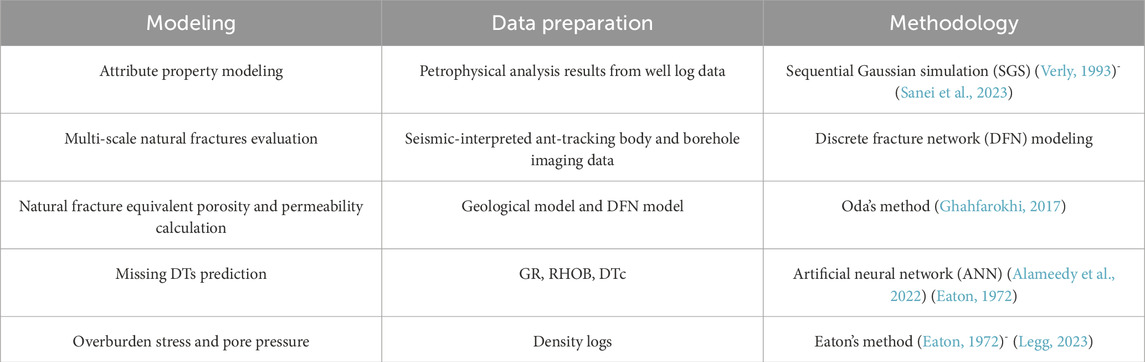
Table 2. Simulation and calculation methodologies summary.
5 Redefinition of geological models
The reconstruction of the multi-scale integrated geological model effectively utilizes all available data types, including drilling and completion data, well logging, seismic interpretation, sedimentary analysis, and reservoir characteristics. This process represents a fundamental workflow that requires meticulous processing and standardization of all data, whether in real-time or interpreted. The acquired drilling and completion data encompass wellhead locations, measured depth (MD), completion depths, and well trajectories. Well logging provides critical interpretations of lithology, reservoir properties, and stratigraphy derived from routine logs.
By integrating precise reservoir descriptions obtained from well log interpretations with seismic data, a three-dimensional geological structural model, geological grid system, and reservoir property model are constructed, as delineated in the flowchart given in Figure 3A, and detailed in Section 5.1, Section 5.2, and Section 5.3, respectively. The prediction and evaluation of NFs are detailed in Section 5.4, where the modeling of NFs builds upon the previously established geological and attribute models, resulting in a dual porosity–permeability model. Furthermore, as depicted in Figure 3B, medium and small NFs interpreted from borehole imaging and core data, combined with large-scale NFs extracted from ant-tracking data, contribute to the development of the multi-scale discrete fracture network (DFN) model, quantifying the strength and density of NFs.
In comparison to the original two-dimensional seismic exploration area, the current target model encompasses all production wells for PetroChina’s Duvernay project in Simonette District, as depicted in Figure 4. The original geological model (navy-colored area) does not cover potential districts for infill pad or wells. Moreover, it dismisses more than half of the well information in the current mineral rights area. The new model (in magenta color) incorporates adequate well data while preserving an optimal level of data density, thereby mitigating the uncertainty associated with the model.
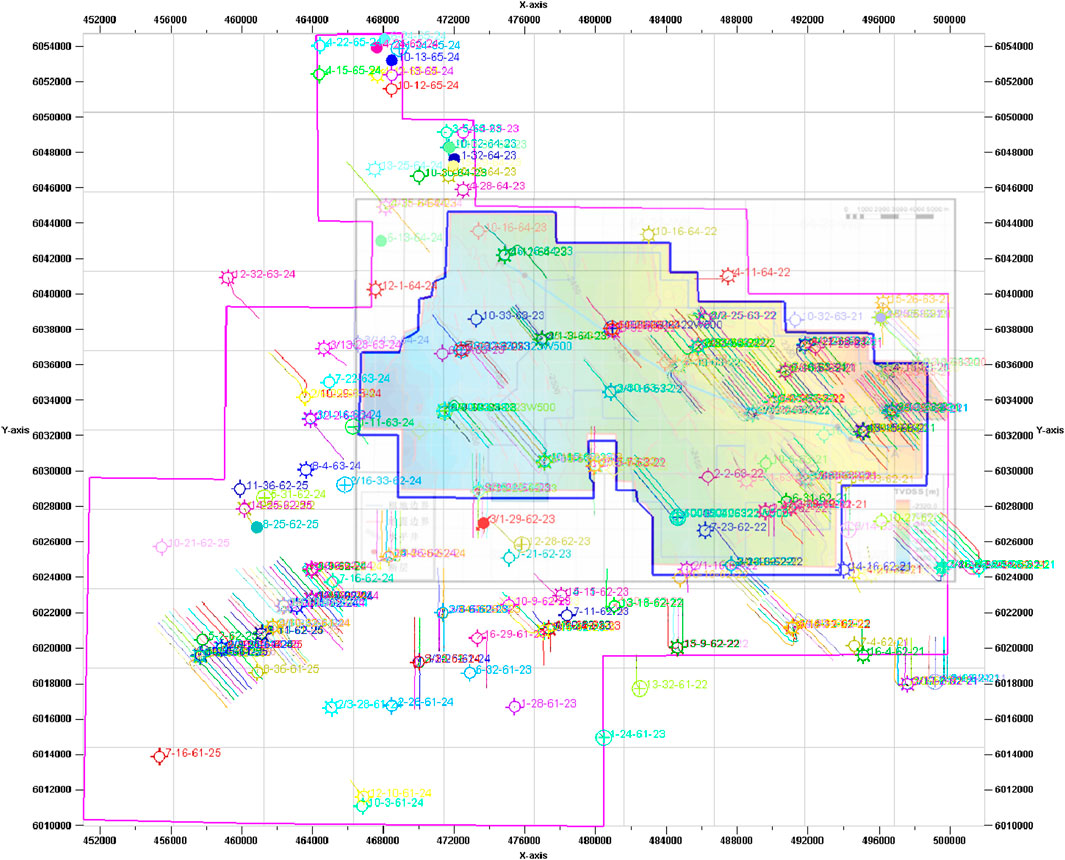
Figure 4. Comparison of old (navy blue) and new (magenta) study area with well locations in Duvernay Formation. The old one: 3D seismic interpreted structural tops of Duvernay Formation (early-stage geophysical data covered area).
5.1 Geological structural modeling
During the process of structural modeling, seismic-interpreted layering positions are incorporated, utilizing constraints obtained from the layering at each well location. The workflow includes a quality control protocol for the structural layering model that encompasses 1) the conformity between well locations and the layering model, 2) conformity between the structural shape and the original structural map, and 3) accuracy of the layering contact relationships. The primary objective of these quality control measures is to achieve a strong correlation between the K elements related to layering and the initial findings from geophysical and geological studies, as well as to establish rational inter-layer contact relationships.
The final quality evaluation of the three-dimensional layering model indicates its effectiveness in accurately representing the overall structure of faults and sublayers, while also providing quantitative characteristics of minor structural changes within each layer and the outer geometry of the gas reservoir. Based on layer division data derived from drilling information, four series (Upper Duvernay, Mid_Carb, Lower Duvernay, and MLK) and eight structural surfaces have been established for seven geological layers and sublayers. Furthermore, the thickness distribution of each sublayer is calculated using a thickness contour map. The entire structural model extends from higher elevations in the west to lower elevations in the east in a monoclinic configuration, demonstrating reasonable structural inheritance in each layer with a gentle dip.
5.2 Geological grid system
The three-dimensional geological meshing constitutes the grid structure established on layering and faults, which is essential for supporting subsequent modeling and geomechanical analysis. The types, sizes, orientations, and magnitudes of the meshing collectively enhance the accuracy and reliability of the simulation results. A corner-point grid system is employed to capture the characteristics of discrete spatial locations through the coordination of eight hexahedral points. The undefined elemental lines are advantageous for reflecting the geological characteristics and geometry of the reservoir, particularly in complex gas reservoirs exhibiting well-developed natural fractures and structural variations.
The Petrel platform software is utilized to achieve this gridding objective, with the dimensions of the grid system primarily determined by well (pad) spacing, seismic trace spacing, and the computational capacity necessitated by the specific numerical model.
Meshing of the structural layering model results in a layering grid system comprising three horizontal components: top, middle, and base skeleton grids, which govern the overall construction of the three-dimensional model, as shown in Figure 5 the skeleton grids for Upper Duvernay_A. Quality control is also imperative to identify any abnormal twisting or folding of grids, particularly in proximity to faults, where a five-point key pillar gridding approach is applied; the location of the remaining two-point grids must be reconfirmed along the I and J directions. The new model builds upon geological and stratigraphical insights from previous analyses (as indicated in the workflow chart) and demonstrates a finer grid system, as detailed below.
i) The model encompasses an area of 1,321 km2, integrating data from 40 vertical wells and 314 horizontal wells. The original seismic-interpreted area spans 414 km2.
ii) Vertical layer distribution consists of Upper Duvernay, Mid_Carb, Lower Duvernay, and MLK sequentially, with Mid_Carb functioning as the carbonate inter-layer. The principal target layer, Upper Duvernay, is subdivided into A, B, C, and D sublayers.
iii) The structural layers of Upper Duvernay-A, Upper Duvernay-B, Upper Duvernay-C, Upper Duvernay-D, Mid_Carb, Lower Duvernay, and MLK exhibit an average thickness of approximately 13.7 m, with the most favorable layer being Upper Duvernay-D, which displays the greatest thickness of 25 m.
iv) The grid system of the geological model, within the target area of 1,321 km2, features a horizontal distribution resolution of 100 × 100 m, resulting in a grid count of 498 × 565. The average grid thickness is 54 m, and vertical grid sizes range from 0.06 to 0.23 m, with each sublayer in Upper Duvernay divided into K = 50 sections. The total grid count for the high-resolution geological model exceeds 98 million (refer to Table 3 for details).
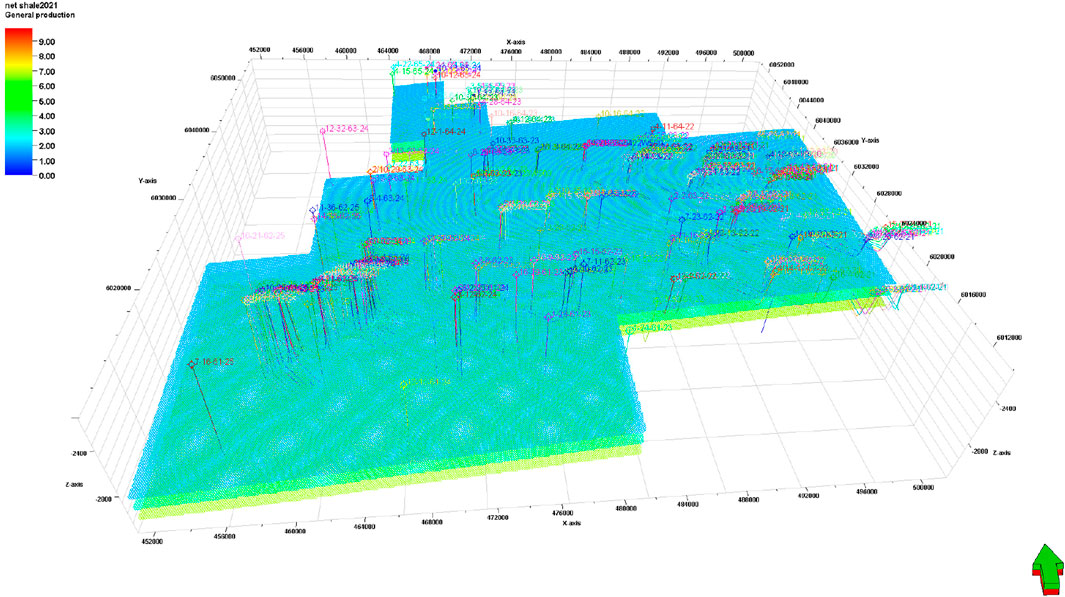
Figure 5. Geological grid system of the geological model in the studied area (layer Upper Duvernay_A with top, middle, and bottom geological grid).
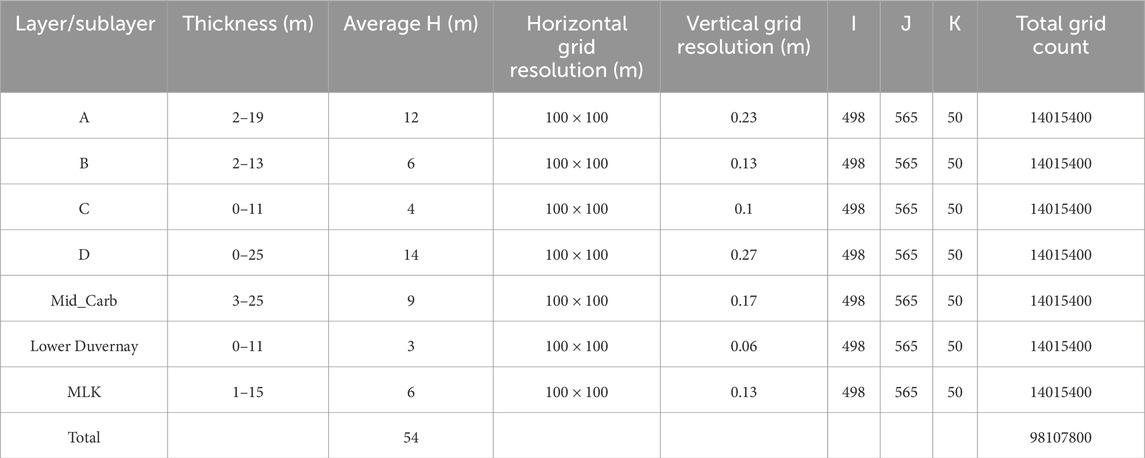
Table 3. Grid system of all layers in the studied area, Resolution, and number count in the I*J*K direction of grids in each structural layer.
5.3 Attribute modeling
Petrophysical analysis is conducted for each well within the target area, and three-dimensional attributes are modeled using the sequential Gaussian simulation (SGS) methodology, upscaling petrophysical parameters at well locations for absorbed shale gas content (m³/t), total organic carbon (TOC) (%), effective hydrocarbon pore volume (HCPV) (mg/g), porosity (%), permeability (mD), and water saturation (Sw) (%). Reservoir property models are assigned based on the geological model for each structural layer. Three-dimensional models illustrating absorbed shale gas content are presented in both vertical shown in Figure 6A and two-dimensional horizontal distribution profiles shown in Figure 6B. The average absorbed shale gas content ranges from 1.3 to 1.6 m³/t, reaffirming Upper Duvernay-D as the most favorable sublayer, with maximum absorbed gas content reaching 2.2 m³/t. Additional reservoir property models are depicted in Figure 6.
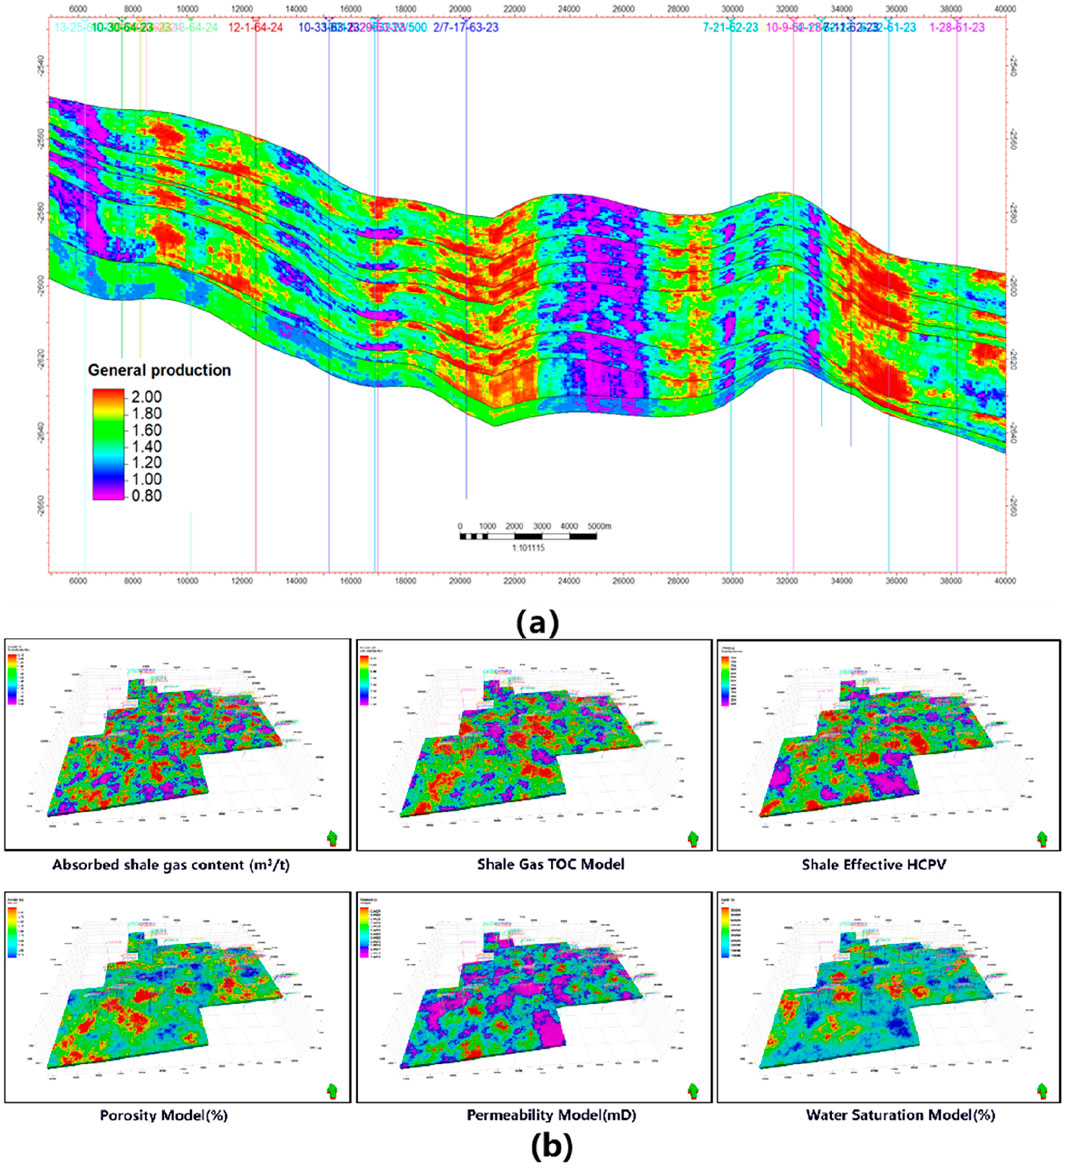
Figure 6. (A) Vertical profile of the absorbed shale gas content in the Duvernay Formation (m3/t). (B) Reservoir parameter distribution in the 3D model. Absorbed shale gas content (m3/t); shale gas total organic carbon (TOC); shale effective hydrocarbon pore volume (HCPV), porosity (%), permeability (mD), and water saturation (%).
5.4 Natural fracture interpretation
The prediction and evaluation of multi-scale NFs are accomplished through the application of the discrete fracture network (DFN) technique. The flowchart illustrating DFN modeling for multi-scale NFs is presented in Figure 3B. The identification and classification of large-, medium-, and small-scale NFs are facilitated by results from seismic interpretation and borehole image logging data. Large-scale NFs, such as faults, are recognized based on pre-stack seismic interpretations, while medium- and small-scale NFs (including tectonic fractures, bedding fractures, and fissures) are recognized based on fracture strength attributes interpreted from borehole image logging data. The prediction of medium- and small-scale NFs is achieved by leveraging fracture density attributes referenced from fracture strength attributes.
The extraction of ant-tracking attributes from the eight structural surfaces across layers A to MLK is illustrated in Figure 7A. The planar configurations of ant-tracking attributes in each layer exhibit minimal variation with pronounced vertical inheritance. NFs are significantly more developed in the southwestern portion compared to other areas of the seismic exploration region. A total of seven large-scale NF systems have been extracted for layers A to MLK from the ant-tracking attributes, with the predominant NF direction orienting north–south, intersecting regionally across networks. Among the seven layers, large-scale NFs are more extensively developed in Upper Duvernay_A, B, D, and Mid-Carb, as shown in Figure 7B.
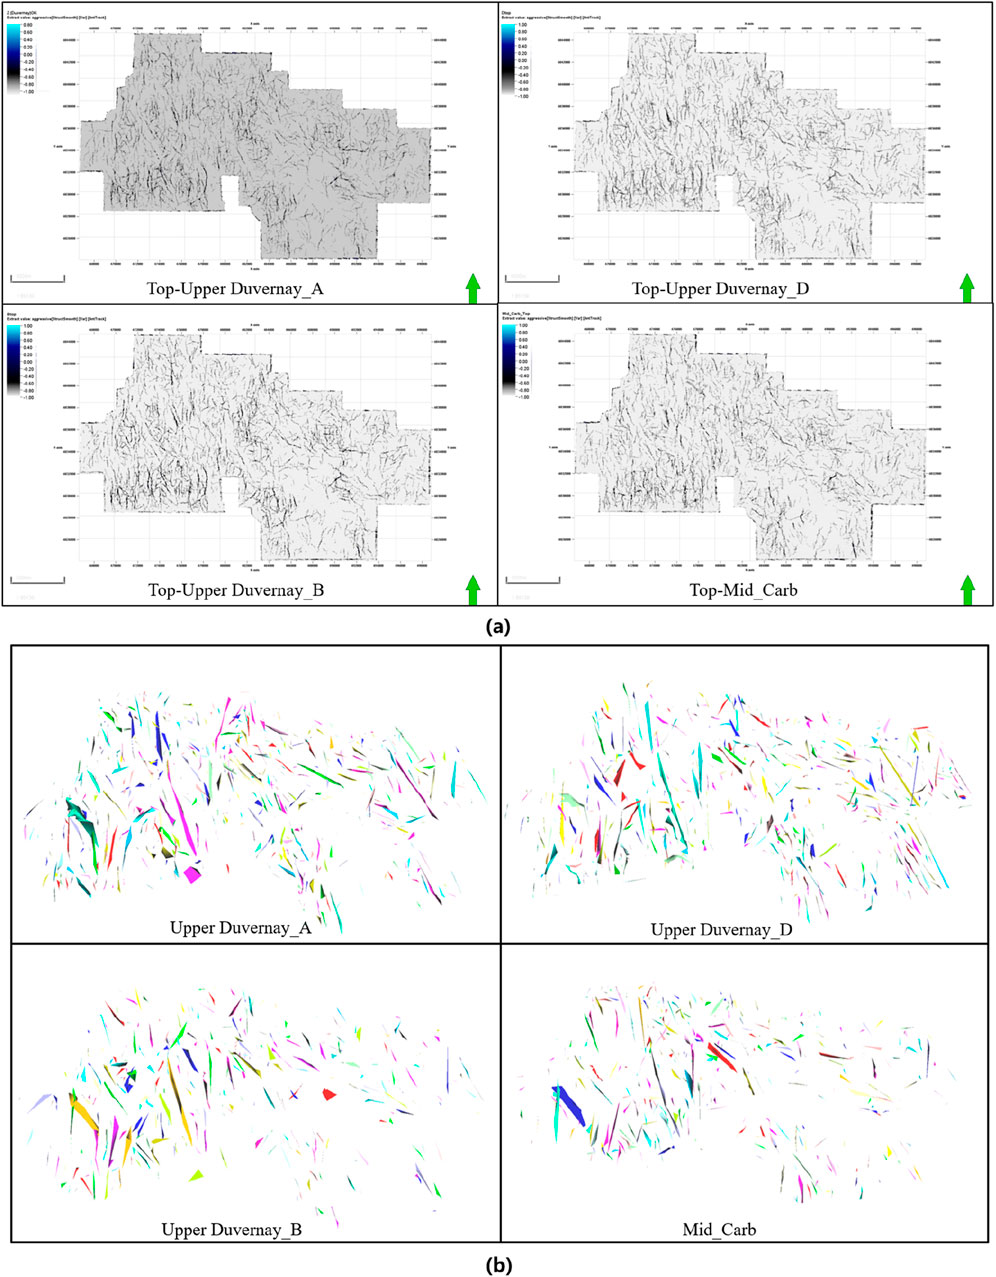
Figure 7. (A) Ant-tracking body model calculated from seismic interpretation along the eight structural surfaces across layers A to MLK of the Upper Duvernay. (B) Extraction of large-scale NFs from the ant-tracking attribute in the Duvernay Formation; NFs highly developed in Upper Duvernay_A, B, and D and Mid_Carb.
Figure 8 depicts the locations of wells with borehole imaging logs for bedding NF interpretation (Figure 8A) and tectonic NF interpretation (Figure 8B). A total of seven borehole imaging logs have been recorded and analyzed, with cross-well plots illustrating the tectonic fractures in two wells (Figure 9B) and bedding fractures in five wells (Figure 9A). In Figure 13, bedding fractures are notably more developed in Upper Duvernay, Mid_Carb, and MLK, with no indications present in Lower Duvernay. The interpretation of borehole imaging from these two wells predicts 382 bedding fractures, exhibiting dip angles ranging from 0° to 10°, with an average dip angle of 4° and northwest direction (142°). Tectonic NFs are estimated at a count of 15,503 with an average dip angle of 84° and a direction of northeast (45°). The predicted fracture strengths for the seven wells are summarized in Table 4.
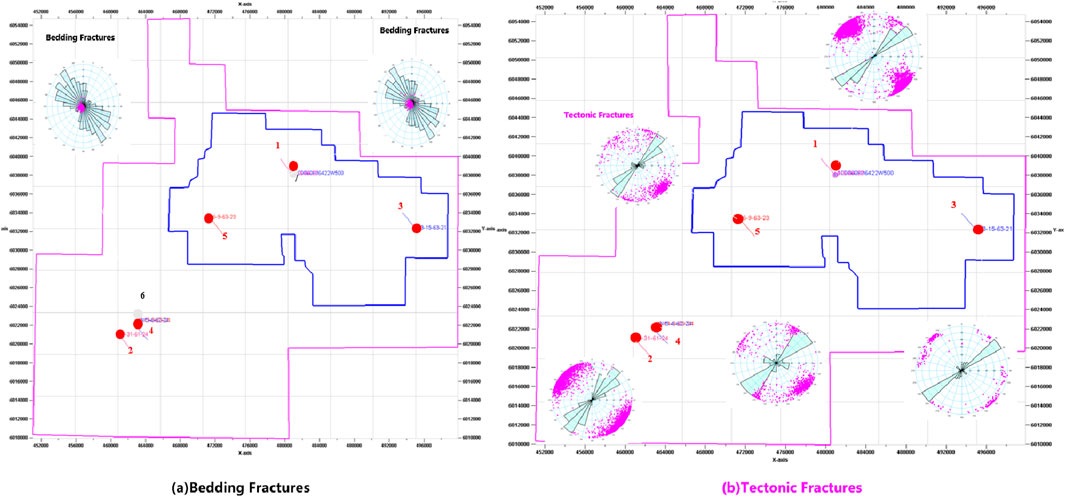
Figure 8. Well locations of (A) bedding fractures and (B) tectonic fractures in the study area, with the NF rosemap located in neighbor wells for well no. 1 to well No. 7.
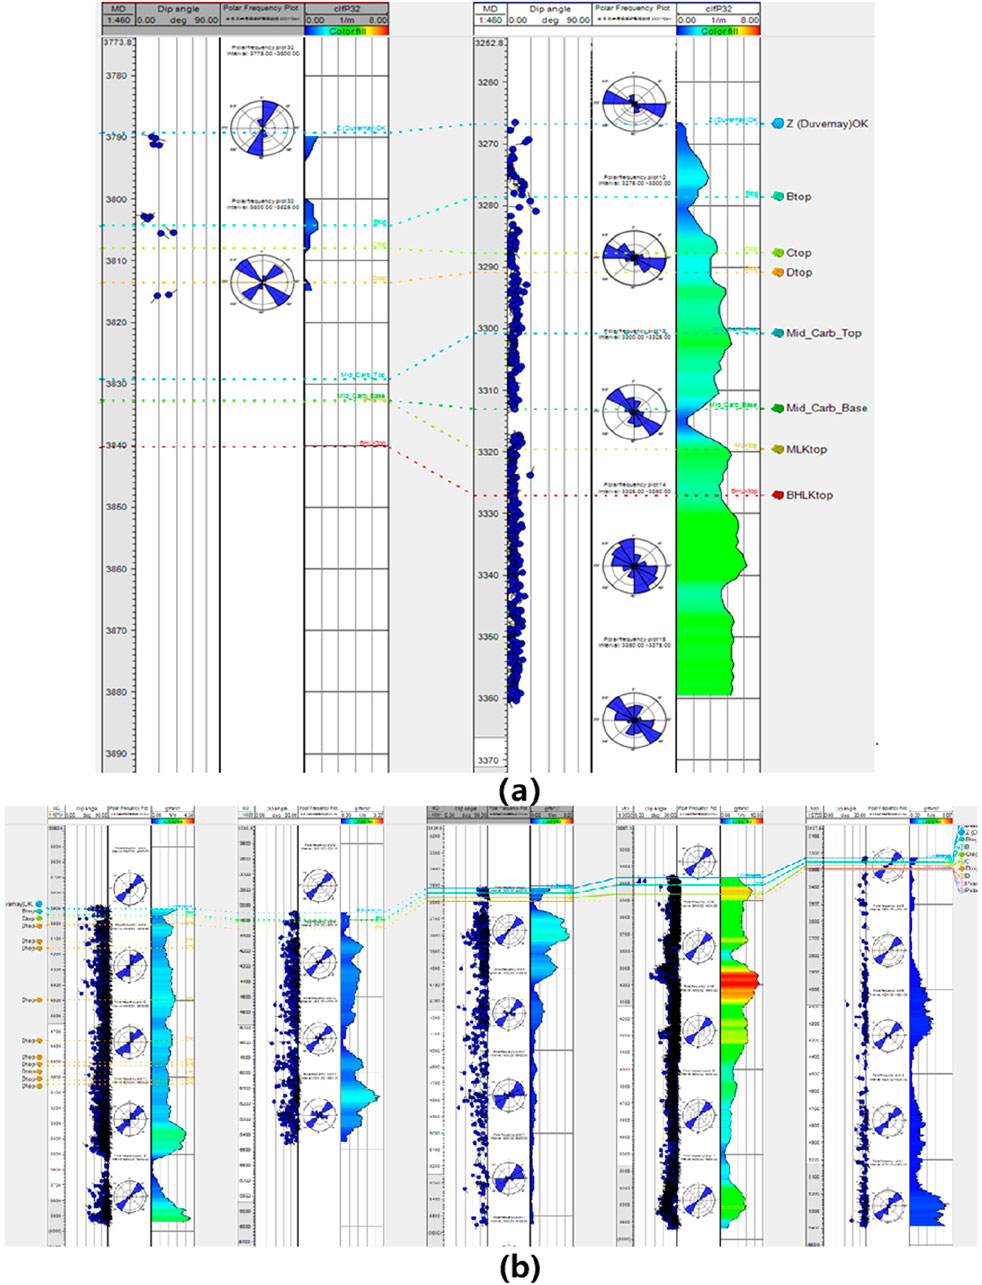
Figure 9. Cross-well plot for (A) bedding NF interpretation and (B)tectonic NF interpretation.
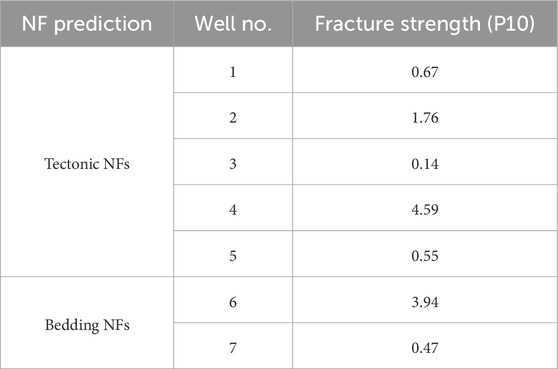
Table 4. Fracture strength prediction in borehole imaging logs.
The three-dimensional volumetric strengths of bedding fractures (Figure 10, left) and tectonic fractures (Figure 10, right) are upscaled from the interpreted results of well imaging logs in each well through interpolation. The vertical profiles of fracture strength at the wellbore plane correspond closely with the fracture density curves for each well. The volumetric strength of fractures governs fracture development density, while the analysis of bedding fracture strike provides orientation insights. Consequently, the DFN (discrete fracture network) is established for the seven layers from A to MLK, comprising both bedding and tectonic fractures.
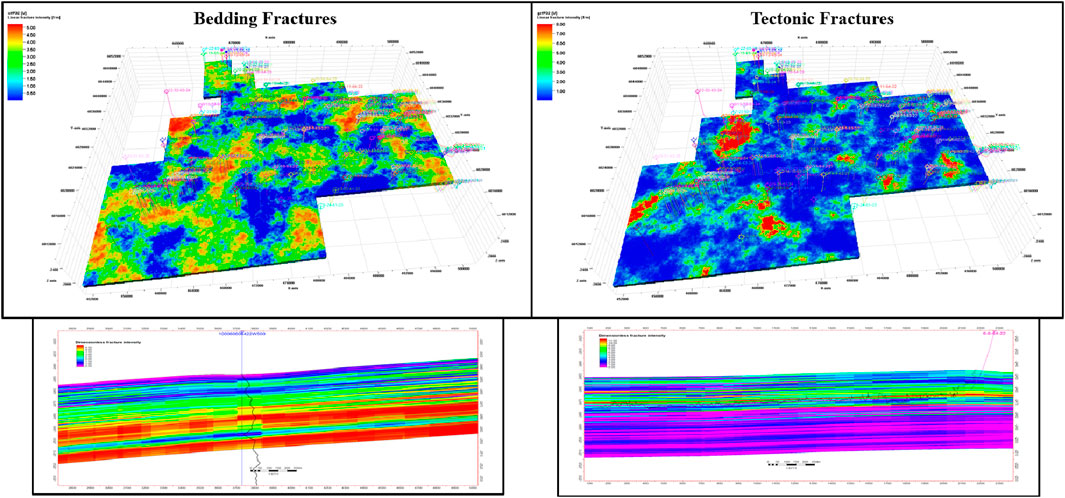
Figure 10. Strength attributes of medium-/small-scale NFs (interpreted bedding fractures and tectonic fractures), 3D model distribution in the top area and vertical profile in the bottom area.
Employing Oda’s approach, the fluid properties of the DFN model are upscaled for both macroscopic and microscopic fractures. The porosity and permeability attribute models are illustrated in Figure 11 at the target well pad location, in 3D view and vertical profile. The equivalent fracture porosity and fracture permeability are within the ranges of 0%–1% and 2–486 mD, respectively.
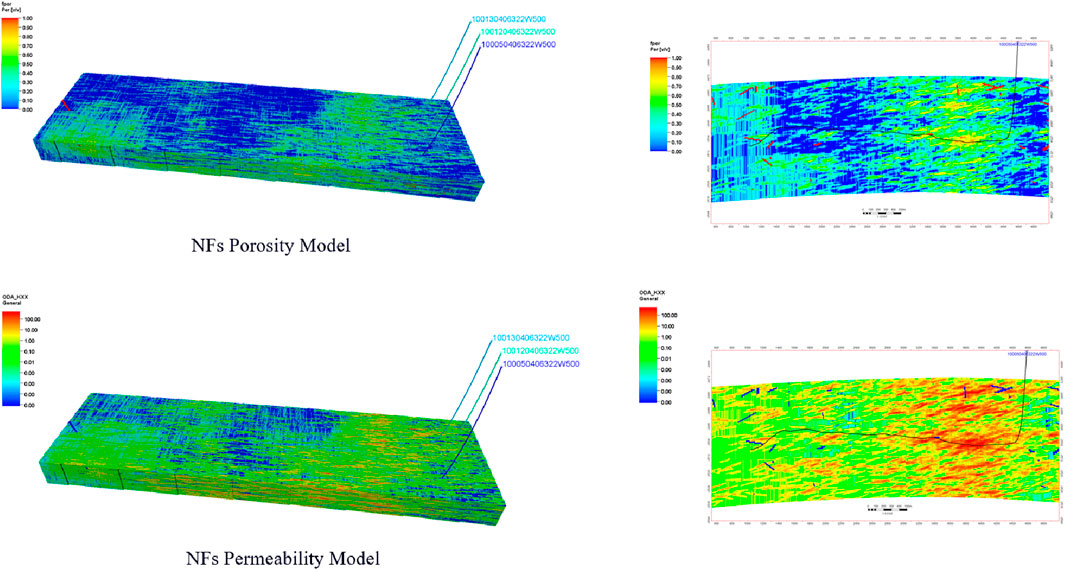
Figure 11. Porosity and permeability attributes of multi-scale NFs, 3D model, and vertical profile at the target well and pad location.
6 Multi-scale 3D geomechanical modeling
Utilizing the updated geological model grid system, a comprehensive geomechanical analysis is performed at each designated well location. Subsequently, the three-dimensional geomechanical parameters and stress distribution are simulated. Static mechanical parameters are derived from experimental rock mechanical measurements at specified depths, while continuous dynamic mechanical parameters are predicted from well logging data. To ensure accuracy in the modeling process, a conversion coefficient from dynamic to static parameters is applied. The foundational logic for developing a 1D single well geomechanical model is depicted in the accompanying flowchart (Figure 12). The 1D geomechanical model based on the single well location outputs both rock mechanical properties (Young’s modulus, Poisson’s ratio, and brittleness) and pressure–stress profile (overburden stress and pore pressure and in situ stresses).
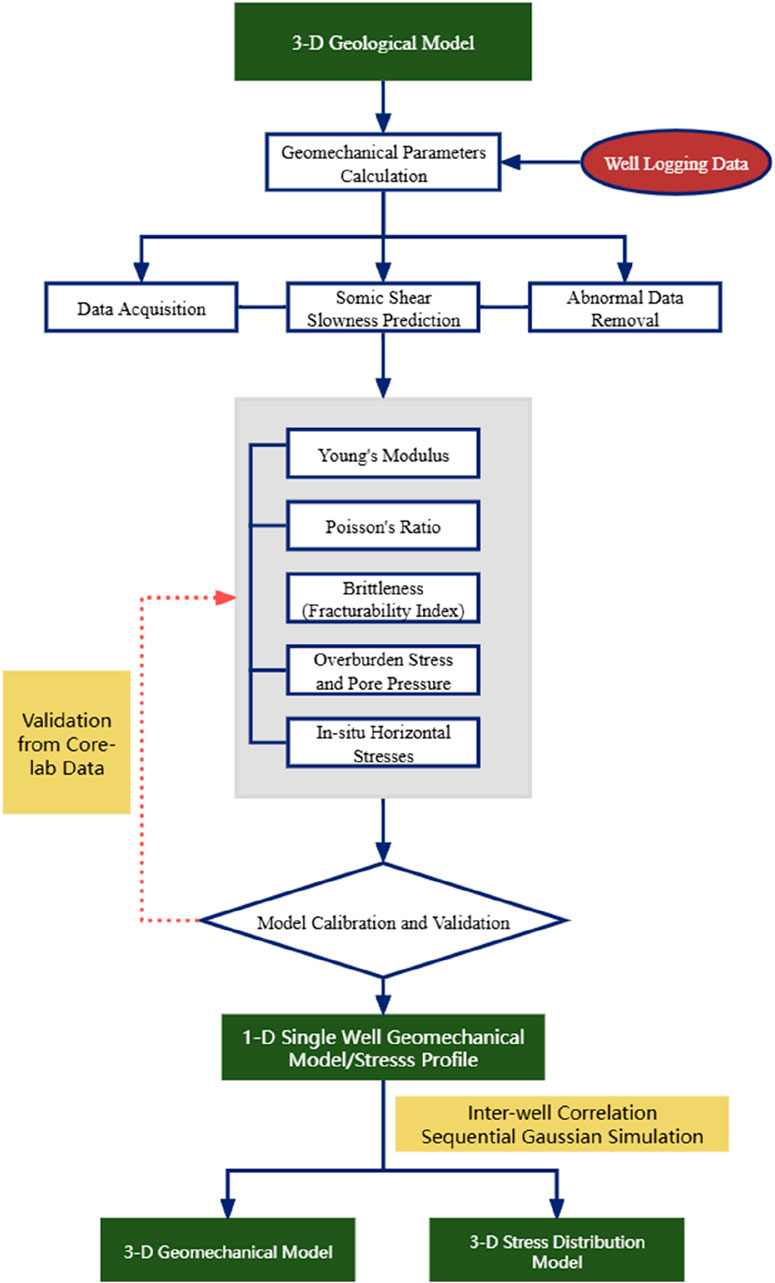
Figure 12. Flowchart for developing the multi-scale 3D geomechanical model, starts with results of reconstruction of the high-resolution 3D geological model in Figure 3.
6.1 Data quality check
The preliminary phase involves a comprehensive screening of well data, which encompasses laboratory core data, well logging data, and diagnostic fracture injection test (DFIT) data. A well is considered suitable for analysis only if all three data types are complete and have been cross-verified across multiple sources. By rigorously evaluating these real-time or derived datasets against established regional reservoir characteristics, particularly pore pressure, wells that exhibit anomalous values are excluded from the preliminary database. As a result, only 30 wells have successfully passed this initial screening.
Geomechanical parameter upscaling and calculations are commonly derived from specific logs, including gamma ray (GR), density log (RHOB), sonic compressional slowness (DTc), and sonic shear slowness (DTs). The current dataset comprises comprehensive well log information for only four wells; the remaining wells are deficient in sufficient number of DT segments. It is imperative to emphasize the vitality of DT data for accurately establishing single-well geomechanics; its absence or misinterpretation could substantially increase uncertainty in the geomechanical model. Given the interrelationships and predictive capacities of density, DTc, and DTs, a total of 13 wells—comprising exploratory and vertical wells—are selected as target wells for the development of the 1D geomechanical model. This selection process is critical to ensuring adequate spatial coverage within the study area, thereby enhancing the reliability of the final 3D model’s distribution. The workflow for Sections 5.2 and 5.3 is illustrated in Figure 12.
6.2 Single-well geomechanical parameter calculation
6.2.1 Sonic shear slowness match and prediction
The empirical correlations typically used for predicting DTs are primarily based on the theoretical equations as indicated below (Equation 1), where
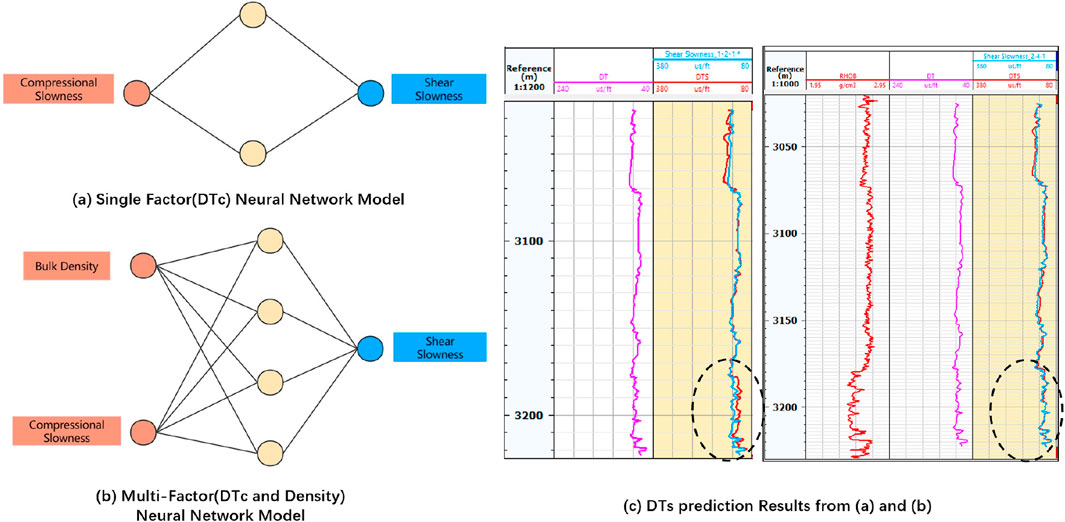
Figure 13. (A) Single-factor ANN model based only on DTc. (B) Multi-factor ANN based on both DTc and density. (C) Comparison of single-factor and multi-factor prediction on segment with real-time DTs.
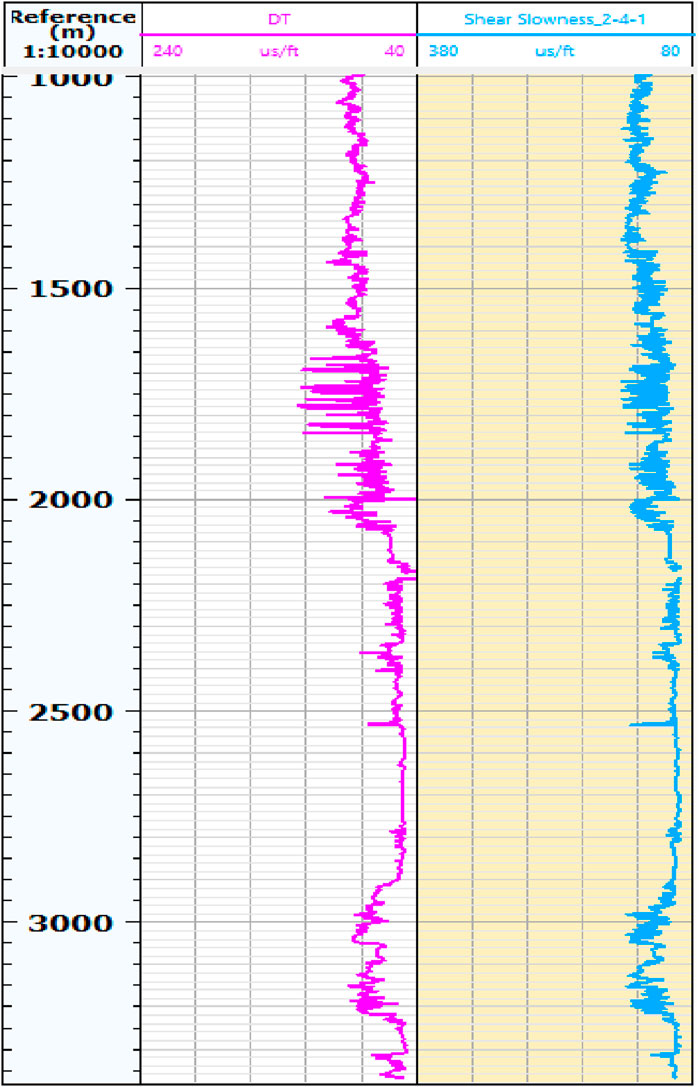
Figure 14. Prediction of DTs for missing segments lacking real-time data.
6.2.2 Mechanical elastic-strength parameter calculation
Dynamic Young’s modulus and Poisson’s ratio are calculated from the following theoretical equations (Equations 2, 3):
where
The outputs of the 1D geomechanical model are summarized. The average Young’s modulus for the Upper Duvernay formation ranges from 25.3 to 27.3 GPa, accompanied by Poisson’s ratios from 0.19 to 0.20. The Lower Duvernay formation exhibits an average Young’s modulus of 31.7 GPa and a Poisson’s ratio of 0.24. The results of the 1D geomechanical parameters are visually represented in Figure 15.
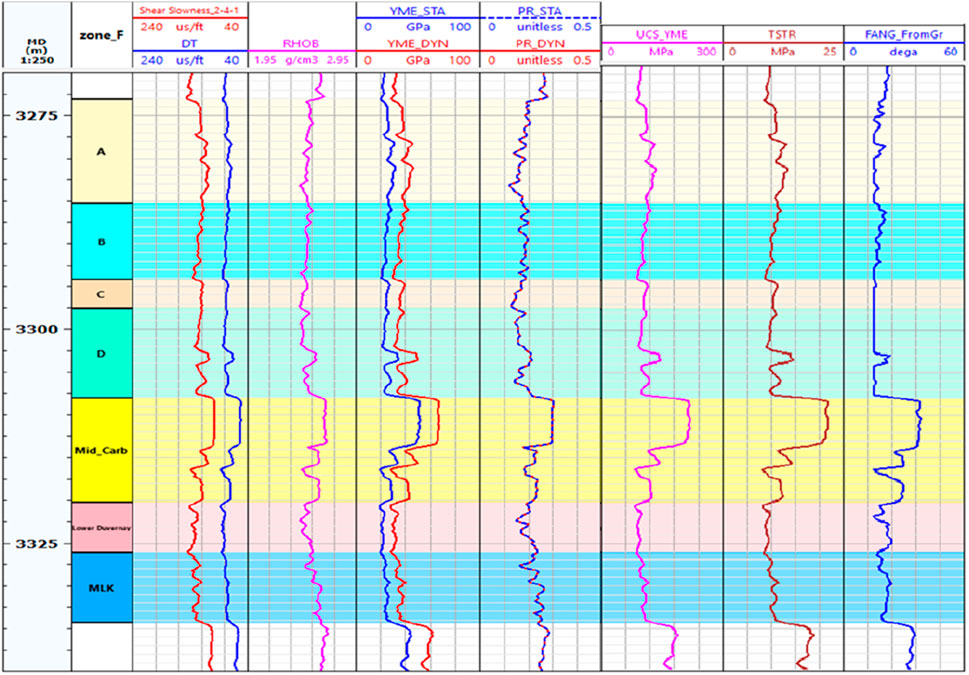
Figure 15. One-dimensional single-well geomechanical parameter calculation (real-time data: DTs and DTc; RHOB; dynamic and static Young’s modulus, dynamic and static Poisson’s ratio, UCS, TSTR, and frictional angle).
6.2.3 Density and reservoir pore pressure prediction
The overburden stress for the target formation is computed by integrating density logs along depth, represented as follows:
The calculated values range from 80.6 to 81.8 MPa and increase with depth. For wells lacking real-time density logs, the trend line is extrapolated using reference points from neighboring wells. A total of 13 wells have been interpreted for overburden stress. Reservoir pore pressure is predicted for these wells using the Eaton method based on sonic data, shown in Equation 4. The resulting pore pressure for the Upper Duvernay_D target ranges from 58.8 to 63.2 MPa, corresponding to a pressure coefficient ranging from 1.79 to 1.91.
where S is the overburden stress,
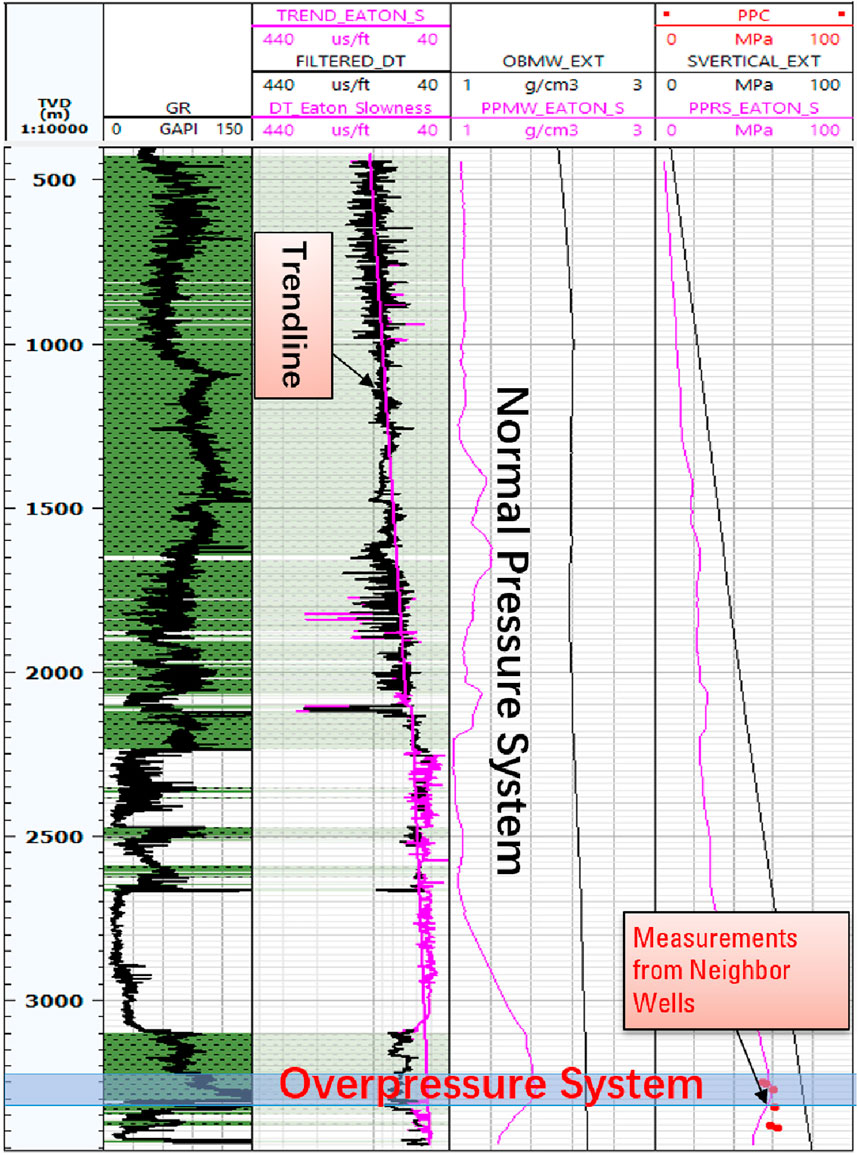
Figure 16. Analysis of overburden stress and reservoir pore pressure, with constraints from measurements of neighbor wells.
6.2.4 In situ stress predictions
By applying a pore-elastic isotropic model, the real-time closure pressure derived from DFIT can be equated to the minimum horizontal stress, facilitating the determination of regional tectonic coefficients. Direct field measurements do not provide evaluations for maximum horizontal stress, only its directional components. The following empirical equations (Equations 5, 6) offer methodologies for calculation, presuming a normal slip fault mechanism (where
The predicted horizontal stress, given these assumptions, yields values of
Investigation into the stress profile of the Duvernay Formation reveals a strike–slip fault mechanism, suggesting that
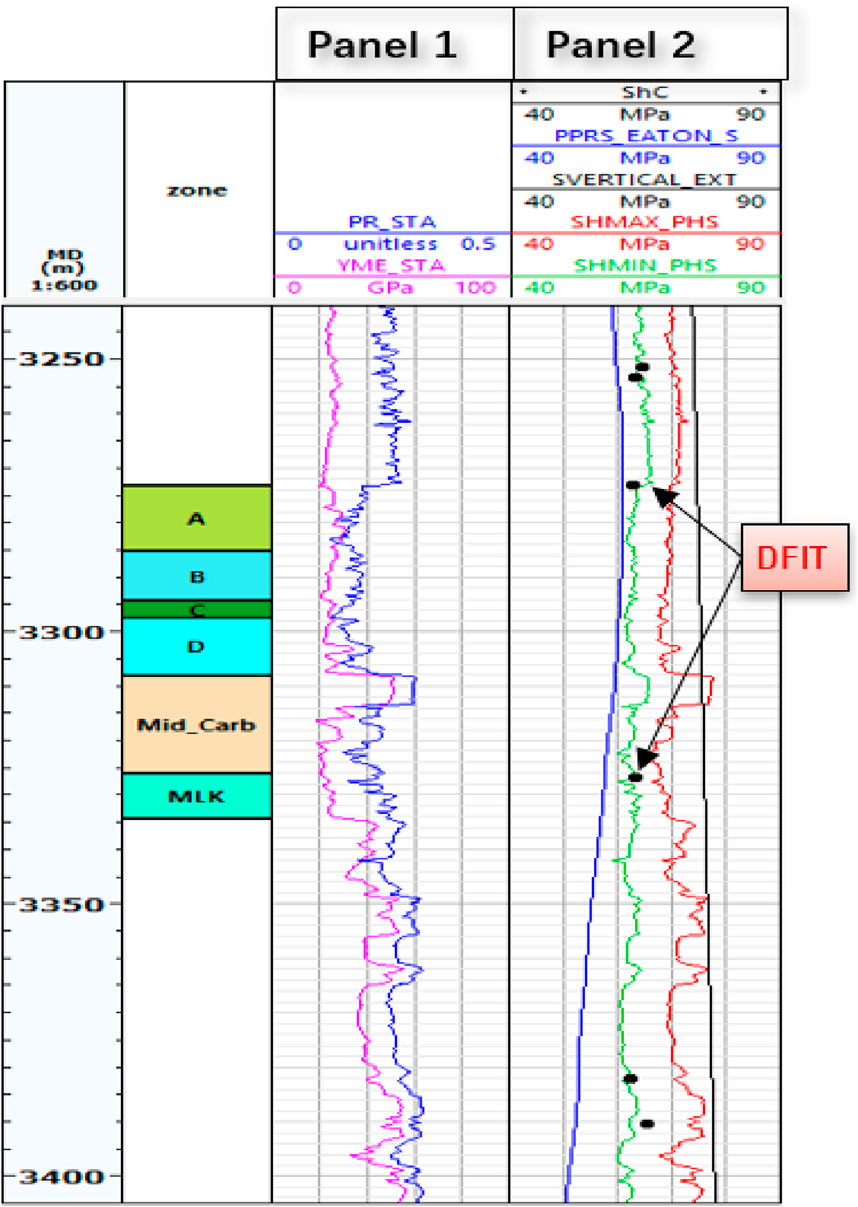
Figure 17. One-dimensional single-well-based In situ stress prediction: Panel 1 static Poisson’s ratio and static Young’s modulus. Panel 2 DFIT closure pressure (MPa), reservoir pore pressure (MPa), overburden stress (MPa), Sh, max (MPa), and Sh, min (MPa).
6.2.5 Formation brittleness (fracturability) prediction
Equations typically used for determining fracturability (BRIT) and the brittleness index (BI) are presented below in Equations 7, 8 and Poisson’s Ratio in Equation 9, where YME and PR denote the dynamic Young’s modulus and Poisson’s ratio, respectively, while
Table 5 summarizes the calculation results across each sublayer. Figure 18 compares the methodologies, revealing that results yield congruent indicators for the Upper Duvernay D layers and the Mid-Carb layer, with the minimum horizontal stress calculated at 62 MPa and 65 MPa, respectively.
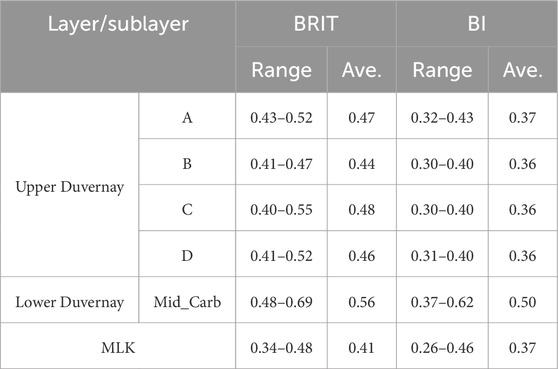
Table 5. Calculated brittleness of all layers in the studied area using BRIT and BI equations.
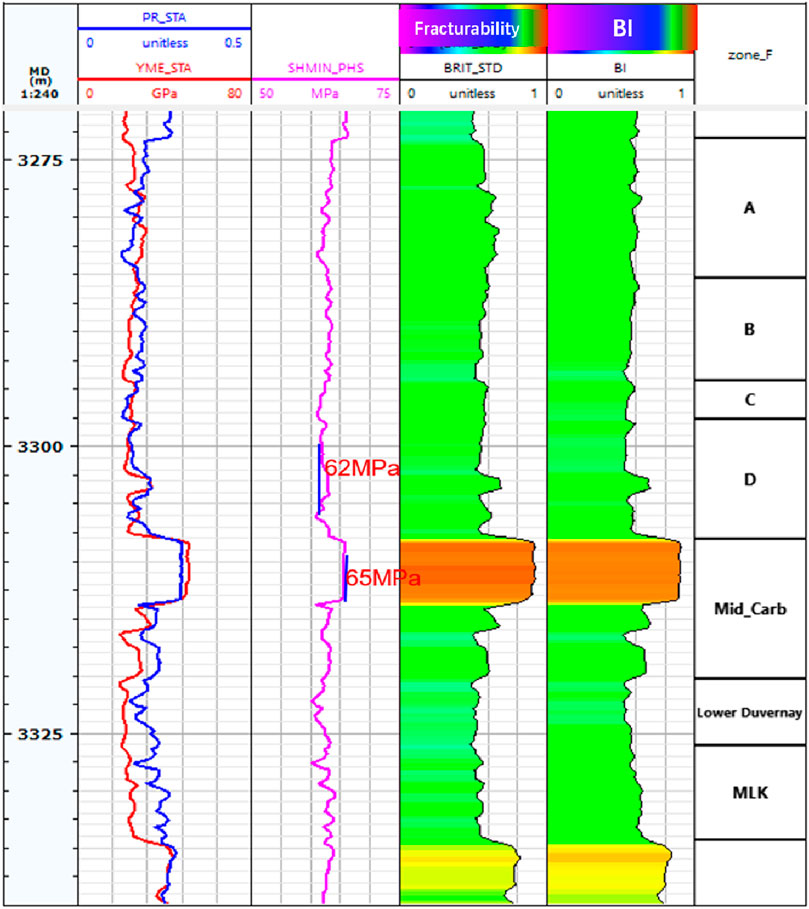
Figure 18. Brittleness Index calculated from two methods: BRIT and BI indicated segment in the target well.
6.3 Three-dimensional geomechanical modeling
The 1D geomechanical modeling calculates geomechanical parameters and in situ stresses at specific well locations. The subsequent step in the workflow involves performing inter-well correlations of these parameters and stress profiles across multiple planes. This process effectively upscales the geomechanical distribution from 1D to 3D by employing SGS for each geomechanical parameter, including Young’s modulus, Poisson’s ratio, pore pressure, brittleness, and fracturability.
As demonstrated in Figure 19, the average Young’s modulus (E) ranges from 24 to 38.2 GPa, while Poisson’s ratio (PR) varies between 0.19 and 0.25. Notably, the Mid_Carb formation exhibits a higher Young’s modulus and a lower Poisson’s ratio in comparison to both the Upper Duvernay and Lower Duvernay formations. This characteristic is advantageous for enhancing height containment during hydraulic fracture treatments, as it serves effectively as barrier bedding. Furthermore, the brittleness index falls within the range of 0.6–0.78, indicating a greater likelihood of developing complex fracture systems. It is also noteworthy that a lower stress differential (STDIFF) is observed in shale formations compared to carbonate formations, which serves as an additional critical indicator for the potential formation of complex fracture systems during hydraulic fracturing operations.
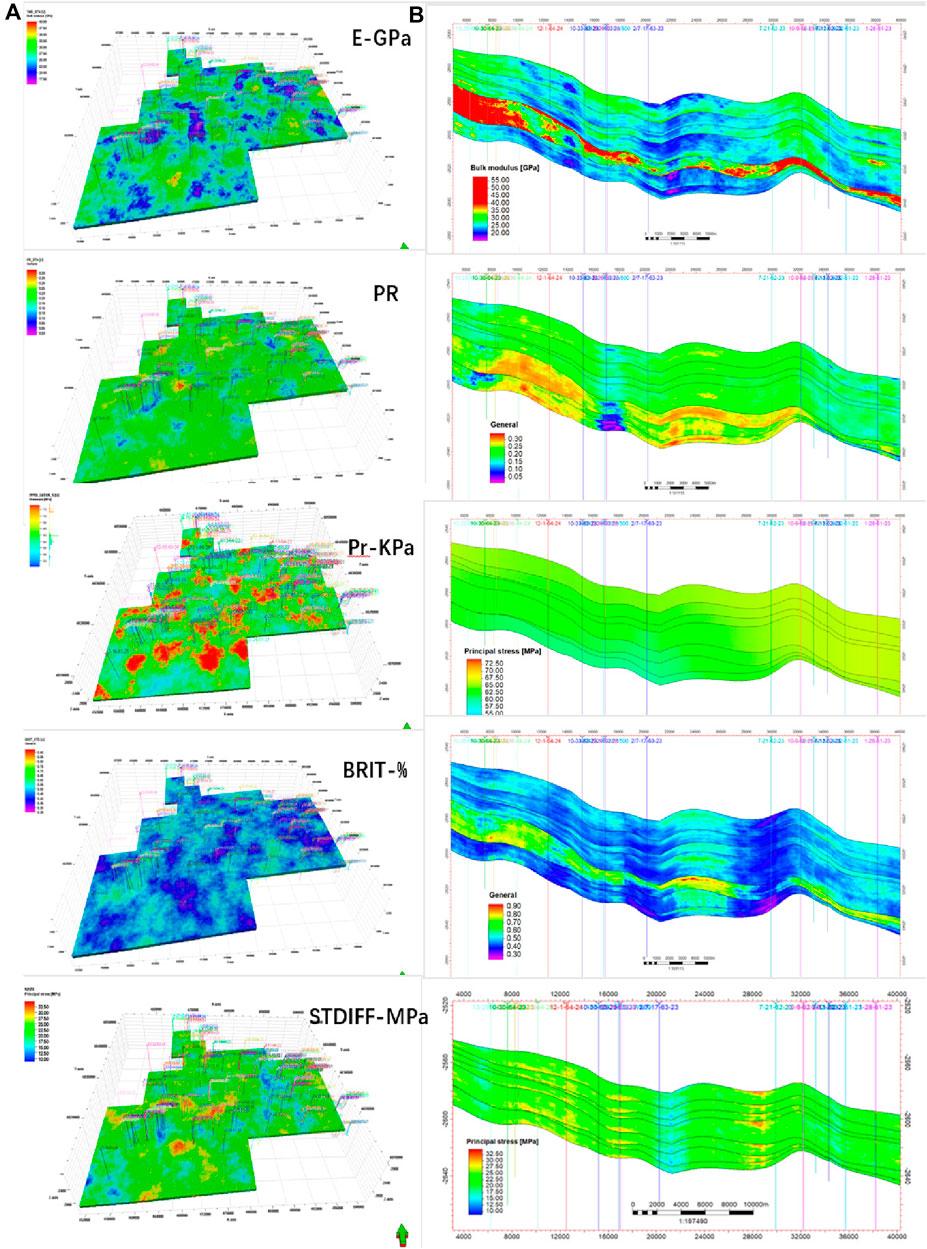
Figure 19. Three-dimensional geomechanical model (A) and vertical profile (B) for key parameters: Young’s modulus (E-GPa), Poisson’s ratio (PR), pore pressure (Pr-KPa), brittleness (%), and STDIFF (MPa).
7 Post-analysis of models and data
In recent years, the significance of data analytics has expanded globally, with the oil and gas industry standing out as a critical sector in this regard. Big Data encompasses advanced technologies designed for the management and analysis of extensive datasets. The utilization of Big Data analytics serves as an effective method for deriving actionable insights from vast amounts of information, particularly concerning underground spatial data. However, the value of such extensive data is limited, unless it is systematically recognized, stored, analyzed, and refined for practical application.
A primary focus within the petroleum industry is to establish correlations between production performance and a multitude of variables within an integrated model that incorporates dynamic data, including production history and well treatment history. The multi-scale integrated geomechanical model provides a foundational framework for the development of a comprehensive database pertaining to the Duvernay Formation. Through the sequential implementation of data collection, data cleaning, model training, and predictive analytics, the foremost controlling factors influencing production performance can be prioritized, ultimately offering innovative solutions to facilitate highly efficient field development.
Previous sections also mark the preliminary construction of a Big Database. Based on the data collection and cleaning processes described in the previous section, where the multi-scale integrated model was established, the geological and engineering parameters identified for inclusion in the Big Data analysis are summarized in Table 6.
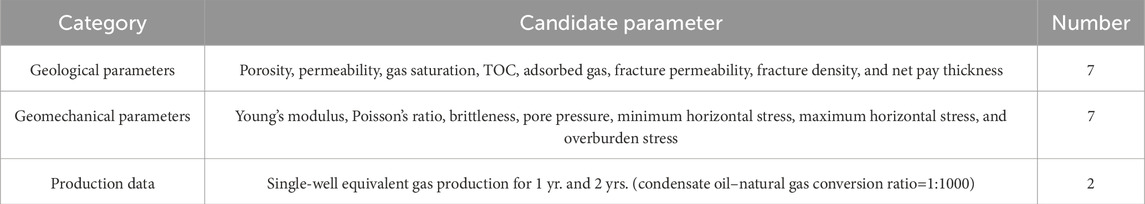
Table 6. Summary of geological parameters, geomechanical parameters, and production history data.
8 Conclusion and perspectives
This study focuses on Simonette District within the Canadian Duvernay shale play, establishing a complex and heterogeneous geomechanical model that incorporates a multi-scale natural fracture system through thorough analysis of the limited formation evaluation data from seismic interpretation, well logging, and well imaging. The model serves as a reliable foundation for simulating intricate hydraulic fracturing systems, optimizing hydraulic designs, and enhancing the productivity. Key achievements include the development of a fine-grid geological model that integrates geological, natural fracture, geomechanical, and stress models, alongside real-time fracturing treatment data and production history. The study also employs ANN methodologies to predict and estimate missing sonic shear slowness (DTs) data, significantly improving data quality through rigorous acquisition and preparation processes prior to analysis. Furthermore, post-analysis has identified 14 candidate parameters contributing to production performance, offering pathways for further sweet spot analysis based on the extensive database constructed.
Data availability statement
The original contributions presented in the study are included in the article/Supplementary Material, further inquiries can be directed to the corresponding author.
Author contributions
YX: data curation, formal analysis, project administration, software, supervision, writing–original draft, and writing–review and editing. WJ: conceptualization, investigation, writing–original draft, and writing–review and editing. CL: data curation, methodology, validation, and writing–original draft.
Funding
The author(s) declare that financial support was received for the research, authorship, and/or publication of this article. The study is supported by the CNPC fundamental and perspective program, “Key Technologies for Canadian Shale Gas High-efficiency Development” (No. 2021DJ3303).
Acknowledgments
We thank CNPC (PetroChina) and RIPED (Research Institute of Petroleum Exploration and Development) for permission to publish this work. Opinions presented in this paper represent only the author’s personal viewpoints. Contributions from WJ and CL are greatly acknowledged.
Conflict of interest
The authors declare that the research was conducted in the absence of any commercial or financial relationships that could be construed as a potential conflict of interest.
Publisher’s note
All claims expressed in this article are solely those of the authors and do not necessarily represent those of their affiliated organizations, or those of the publisher, the editors, and the reviewers. Any product that may be evaluated in this article, or claim that may be made by its manufacturer, is not guaranteed or endorsed by the publisher.
Supplementary material
The Supplementary Material for this article can be found online at: https://www.frontiersin.org/articles/10.3389/feart.2024.1437255/full#supplementary-material
References
Alameedy, U., Alhaleem., A. A., Isah, A., Al-Yaseri, A., El-Husseiny, A., and Mahmoud, M. (2022). Predicting dynamic shear wave slowness from well logs using machine learning methods in the Mishrif Reservoir, Iraq. J. Appl. Geophys. 205, 104760. doi:10.1016/j.jappgeo.2022.104760
Amjad, M. R., Shakir, U., Hussain, M., Rasul, A., Mehmood, S., and Ehsan, M. (2023). Sembar Formation as an unconventional prospect: new insights in evaluating shale gas potential combined with deep learning. Nat. Resour. Res. 32 (6), 2655–2683. doi:10.1007/s11053-023-10244-x
Bohn, R., Hull, R., and Trujillo, K. (2020). “Learnings from the Marcellus shale Energy and environmental lab (MSEEL) using fiber optic tools and geomechanical modeling,” in URTec 2440, prepared for presentation at the unconventional resources technology conference held in austin, Texas, USA, 20-22 july 2020.
Bowie, B. (2018). “Machine learning applied to optimize duvernay well performance,” in Paper presented at the SPE Canada Unconventional Resources Conference, Calgary, Alberta, Canada, March 2018. doi:10.2118/189823-MS
Brule, M., Charalambous, Y., Crawford, M. L., and Crawley, C. (2009). Reducing the “data commute” heightens E& productivity. J. Petroleum Technol. 61 (09), 48–53. doi:10.2118/0909-0048-jpt
Calad, C., Rafiee, J., Sarma, P., Zhao, Y., and Dayanara, B. (2022). “Combining machine learning and reservoir simulation for robust optimization of completion design and well location of unconventional wells,” in Paper presented at the SPE/AAPG/SEG Unconventional Resources Technology Conference. Houston, Texas, USA. doi:10.15530/urtec-2022-3723680
Canadian Discovery (2024). Canadian Discovery. Available at: https://cdl.canadiandiscovery.com/.
Chatterjee, A., Mondal, S., Basu, P., and Patel, B. K. (2012). “Pore pressure prediction using seismic velocities for deepwater high temperature- high pressure well in offshore krishna godavari basin, India,” in SPE oil and gas India conference and exhibition, 153764.
Chen, S., Zhao, W. Z., Ouyang, Y. L., Zeng, Q., Yang, Q., Hou, H., et al. (2017). Prediction of sweet spots in shale reservoir based on geophysical well logging and 3D seismic data: a case study of Lower Silurian Longmaxi Formation in W4 block, Sichuan Basin, China. China 35 (2), P147–P171. doi:10.1177/0144598716679961
Dunn, L., Schmidt, G., Hammermaster, K., Brown, M., Bernard, R., Wen, E., et al. (2012). The Duvernay formation (devonian): sedimentology and reservoir characterization of a shale gas/liquids play in alberta, Canada: CSPG conferences abstract archive, expanded abstracts.
Dusseault, B. M. (2013). “Geomechanical aspects of shale gas development,” in Rock mechanics for resources, Energy and environment, P39–P56.
Eaton, B. A. (1972). The effect of overburden stress on geopressure prediction from well logs. J. Petroleum Technol. 24 (8), 929–934. doi:10.2118/3719-pa
Eaton, B. A. (1975). “The equation for geopressure prediction from well logs,” in Fall meeting of the society of petroleum engineers of AIME.
Ehsan, M., Chen, R., Latif, M. A. U., Abdelrahman, K., Ali, A., Ullah, J., et al. (2024). Unconventional reservoir characterization of patala formation, upper indus basin, Pakistan. ACS Omega 9 (13), 15573–15589. doi:10.1021/acsomega.4c00465
Ehsan, M., and Gu, H. (2020). An integrated approach for the identification of lithofacies and clay mineralogy through Neuro-Fuzzy, cross plot, and statistical analyses, from well log data. J. Earth Syst. Sci. 129 (1), 101. doi:10.1007/s12040-020-1365-5
Ehsan, M., Latif, M. A. U., Ali, A., Radwan, A. E., Amer, M. A., and Abdelrahman, K. (2023). Geocellular modeling of the cambrian to eocene multi-reservoirs, upper indus basin, Pakistan. Nat. Resour. Res. 32 (6), 2583–2607. doi:10.1007/s11053-023-10256-7
Enverus (Drilling Info) (2024). Enverus (Drilling Info). Available at: https://www.enverus.com/.
Eskandari, H., Rezaee, M. R., and Mohammadnia, M. (2004). Application of multiple regression and artificial neural network techniques to predict shear wave velocity from wireline log data fora carbonate reservoir, South-West Iran. CSEG Rec. 29 (7), 40–48.
Eze, P. C., and Hu, L. Y. (2023). “Natural fracture presence prediction in unconventional reservoirs using machine learning and geostatistical methods-workflow and HFTS1 case,” in Paper presented at the SPE/AAPG/SEG Unconventional Resources Technology Conference, Houston, Texas, United States, June 2022. doi:10.15530/urtec-2022-3721712 no. urtec-2022-3721712.
Ferrer, G. G., Faskhoodi, M., Zhmodik, A., Li, Q., and Mukisa, H. (2020). “Completion optimization of child wells in a depleted environment, A Duvernay example,” in Prepared for presentation at the SPE Canada Unconventional Resources Conference originally scheduled to be held in Calgary, Alberta, Canada 18-19 March 2020. Due to COVID-19 the physical event was postponed until 29 September-2 October 2020 and was changed to a virtual event, SPE-200011-MS.
Gaillot, P., Crawford, B., Liang, Y. M., and Alramahi, B. (2020). “Is my completions engineer provided with the correct petrophysical and geomechanical properties input,” in Presented at the abu dhabi international petroleum exhibition and conference, 9-12 november, abu dhabi, UAE, SPE-20337-MS.
GeoSCOUT (2024). GeoSCOUT. Available at: https://www.geologic.com/geoscout/.
Ghahfarokhi, P. K. (2017). The structured gridding implications for upscaling model discrete fracture networks (DFN) using corrected Oda's method. J. Petroleum Sci. Eng. 153, 70–80. doi:10.1016/j.petrol.2017.03.027
Hui, G., Chen, Z., and Wang, H. (2023). “An integrated geology-engineering approach to Duvernay shale gas development: from geological modelling to reservoir simulation,” in SPE Canadian Energy technology conference and exhibition.
Hui, G., and Gu, F. (2023). An integrated method to mitigate hazards from hydraulic fracturing–induced earthquakes in the Duvernay shale play. SPE Reserv. Eval. and Eng. 26 (02), 382–391. doi:10.2118/210287-pa
Kleiner, S., and Aniekew, O. (2019). “The Duvernay shale completion journey,” in Presented at the SPE Kuwait Oil&Gas conference and show held in mishref, Kuwait,13-16 october 2019, SPE-198070-MS.
Kuroda, S., and Hayate, O. (2022). “Field measurement of the formation stress depletion and the pore pressure depletion in the Eagle Ford,” in Paper presented at the SPE/AAPG/SEG Unconventional Resources Technology Conference. Houston, Texas, USA. doi:10.15530/urtec-2022-3708962
Legg, M. J. (2023). Predicting reservoir presence from seismic velocity mapping and pore pressure prediction. Offshore Technol. Conf., 32393–ms. doi:10.4043/32393-MS
Leshchyshyn, T., and Thomson, J. (2016). “Duvernay proppant intensity production case study and frac fluid selection,” in Presented at the SPE annual technical conference and exhibition held in dubai, UAW, 26-28 september 2016, SPE-181687.
Li, Q. G., Michi, O., and Boskovic, D. (2020). “Geomechanical Characterization and Modelling in the Montney fore Hydraulic Fracturing Optimization,” in Paper presented at the SPE Canada Unconventional Resources Conference, Virtual, September 2020. doi:10.2118/199978-MS SPE-199978-MS
Liang, X., Xian, C., and Shu, H. (2016). “Three dimensional full-filed and pad geomechanics modelling assists effective shale gas field development, sichuan basin, China,” in Presented at the international petroleum technology conference held in bangkok, Thailand, 14-16 november 2016. IPTC-18984-MS.
Liu, C., Wu, K., Wu, J., Chang, C., Yang, X., Gong, Y., et al. (2022). “An accurate and efficient fracture propagation model auto-calibration workflow for unconventional reservoirs,” in Paper presented at the SPE/AAPG/SEG Unconventional Resources Technology Conference. Houston, Texas, USA. doi:10.15530/urtec-2022-3720957
Ma, W., Wu, K., Ge, J., and Yu, W. (2022). “Fracture performance evaluation from high-resolution distributed strain sensing measurement during production: insights for completion design optimization,” in Paper presented at the SPE/AAPG/SEG Unconventional Resources Technology Conference. Houston, Texas, USA. doi:10.15530/urtec-2022-3723129
Mariscal-Romero, R. M., and Rodolfo, C. (2022). “Three-dimensional fractal model of hydraulically fractured horizontal wells in anisotropic naturally fractured reservoirs,” in Paper presented at the SPE/AAPG/SEG Unconventional Resources Technology Conference. Houston, Texas, USA. doi:10.15530/urtec-2022-3724064
Mehana, M., Chen, B., and Rajesh, P. (2022). “Reduced-order models for wellbore leakage from depleted reservoirs,” in Paper presented at the SPE/AAPG/SEG Unconventional Resources Technology Conference. Houston, Texas, USA. doi:10.15530/urtec-2022-3725868
Pradhan, Y., Lee, W. J., Lam, D., Hanna, K., Nguyen, T., and Andrew (Quang), T. (2022). “Forecasting well-to-well interference in the permian basin by applying neural networks on pre-run simulations,” in Paper presented at the SPE/AAPG/SEG Unconventional Resources Technology Conference. Houston, Texas, USA. doi:10.15530/urtec-2022-3723394
Richards, G. J., Bere, A. T., Roberts, D. T., and Thomas, S. D. (2020). “Hydraulic fracturing in heterogenous reservoirs; modelling at petrophysical vs. Geomechanical resolution,” in ARMA 20-1842, prepared for presentation at the 54th US rock mechanics/geomechanics symposium held in golden, Colorado, USA, 28 june-1 july 2020.
Rodriguez-Herrera, A. E., Suarez-Rivera, R., and Handwerger, D. (2013). “Field-scale geomechanical characterization of the Haynesville shale,” in Prepared for presentation at the 47th US rock mechanics/geomechanics symposium held in San Francisco, CA, USA, 23-26 june 2013.
Sanei, M., Ramezanzadeh, A., and Asgari, A. (2023). Building 1D and 3D static reservoir geomechanical properties models in the oil field. J. Petroleum Explor. Prod. Technol. 13 (1), 329–351. doi:10.1007/s13202-022-01553-7
Shabelansky, A. H., Nihei, K. T., Fradelizio, G., Tracey, S., and Dimitri, B. (2022). “A numerical simulation of microseismic depletion delineation for duverney oilfield in Canada using a fast approach for a fully coupled 3D quasistatic poroelastic modeling,” in Paper presented at the SPE/AAPG/SEG Unconventional Resources Technology Conference. Houston, Texas, USA. doi:10.15530/urtec-2022-3719909
Srinivasan, A., Liu, Y., Wu, K., Jin, G., and George, J. M. (2022). “Geomechanical modeling of fracture-induced vertical strain measured by distributed fiber optic strain sensing,” in Paper presented at the SPE/AAPG/SEG Unconventional Resources Technology Conference. Houston, Texas, USA. doi:10.15530/urtec-2022-3722188
Tao Bai, P. T., and Tahmasebi, P. (2022). Sequential Gaussian simulation for geosystems modeling: a machine learning approach. Geosci. Front. 13 (1), 101258. doi:10.1016/j.gsf.2021.101258
Thomson, J., Zalslavsky, G., and Leshchyshyn, T. (2016). “Completion design production case study in the Duvernay shale formation,” in Presented at the SPE annual technical conference and exhibition held in dubai, UAW, 26-28 september 2016, SPE-181715-MS.
Verly, G. (1993). Sequential Gaussian simulation: a Monte Carlo method for generating models of porosity and permeability. Berlin, Heidelberg: Springer Berlin Heidelberg, 345–356.
Weissenberger, J., Gilhooly, M., and Wong, P. (2014). “Regional frasnian stratigraphic framework, alberta outcrop and subsurface,” in Presented at the AAPG annual convention and exhibition. Houston, Texas, United States. ndx_weissenberger.pdf (searchanddiscovery.com.
Weng, X., Kresse, O., and Cohen, C. (2011). “Modeling of hydraulic fracture network propagation in a naturally fractured formation,” in Presented at the SPE hydraulic fracturing technology conference and exhibition held in woodlands, Texas, USA, 24–26. January 2011, SPE 140253.
Wilson, A. (2017). 3D full-field and pad geomechanics models aid shale gas field development in China. J. Petroleum Technol. 69 (10), P74–P76. doi:10.2118/1017-0074-jpt
Wϋst, A. J. R., Ziarani, S. A., and Cui, X. A. (2020). “Interbedded carbonate and calcareous shales of the devonian Duvernay Formation of alberta, Canada: implications for completion due to high variability of geomechnical properties,” in Prepared for presentation at the SPE Canada Unconventional Resources Conference originally scheduled to be held in Calgary, Alberta, Canada 18-19 March 2020. Due to COVID-19 the physical event was postponed until 29 September-2 October 2020 and was changed to a virtual event, SPE-200011-MS.
Xiao, Y., Liu, C., Yu, W., Sepehrnoori, K., and Zigler, C. (2022). “Robust uncertainty quantification of fracture geometries through automatic history matching with application in real shale gas,” in Paper presented at the SPE/AAPG/SEG Unconventional Resources Technology Conference. Houston, Texas, USA. doi:10.15530/urtec-2022-3720381
Xie, J., Qiu, K. B., and Zhong, B. (2017). “Construction of a 3D geomechanical model for development of a shale gas reservoir in sichuan basin,” in Presented at the SPE Russian petroleum technology conference held in Moscow, Russia, 16-18 october 2017, SPE-187828-MS.
Xiong, H. (2020). “Identify wellbore landing zones-the southern midland basin case study,” in Presented at the unconventional resources technology conference held in austin, Texas, USA, 20-22 july 2020, URTeC 2902624.
Zoback, M., Ruths, T., McClure, M., Singh, A., Kohli, A., Hall, B., et al. (2022). “Lithologically-controlled variations of the least principal stress with depth and resultant frac fingerprints during multi-stage hydraulic fracturing,” in Paper presented at the SPE/AAPG/SEG Unconventional Resources Technology Conference. Houston, Texas, USA. doi:10.15530/urtec-2022-3722883
Keywords: data-driven, nature fracture evaluation, multiscale geomechanical model, Duvernay Formation, unconventional shale gas
Citation: Xiao Y, Jiang W and Liang C (2024) Data-driven multiscale geomechanical modeling of unconventional shale gas reservoirs: a case study of Duvernay Formation, Alberta, West Canadian Basin. Front. Earth Sci. 12:1437255. doi: 10.3389/feart.2024.1437255
Received: 23 May 2024; Accepted: 08 August 2024;
Published: 03 September 2024.
Edited by:
Weichao Yan, Ocean University of China, ChinaCopyright © 2024 Xiao, Jiang and Liang. This is an open-access article distributed under the terms of the Creative Commons Attribution License (CC BY). The use, distribution or reproduction in other forums is permitted, provided the original author(s) and the copyright owner(s) are credited and that the original publication in this journal is cited, in accordance with accepted academic practice. No use, distribution or reproduction is permitted which does not comply with these terms.
*Correspondence: Yue Xiao, eGlhb3l1ZTAzMjRAcGV0cm9jaGluYS5jb20uY24=