 Shichao Zhang
 Xiuqi Wei3†
 Liming Tang
 Bin Gong
94% of researchers rate our articles as excellent or good
Learn more about the work of our research integrity team to safeguard the quality of each article we publish.
Find out more
ORIGINAL RESEARCH article
Front. Earth Sci., 24 July 2024
Sec. Geohazards and Georisks
Volume 12 - 2024 | https://doi.org/10.3389/feart.2024.1436970
This article is part of the Research TopicPrevention, Mitigation, and Relief of Compound and Chained Natural Hazards Volume IIView all 14 articles
Microseismic monitoring has proven to be an effective approach for detecting and preempting water inrush incidents within mining operations. However, challenges persist, particularly in terms of relying on a singular early warning index and the complexities involved in quantification. In response to these obstacles, a dedicated investigation was undertaken against the backdrop of mining activities at the 11,023 working face of Paner Coal Mine. Primarily, a novel methodology for categorizing the roof and floor into distinct zones was established based on the vertical distribution of microseismic events. Furthermore, this study delves into the dynamic evolution of key source parameters, such as microseismic energy, apparent stress, and apparent volume, amidst mining disturbances, enabling a comprehensive evaluation of the risk associated with roof and floor cracking, as well as potential water inrush incidents. A groundbreaking approach to early warning was proposed, operating on three pivotal dimensions: the depth of fractures, the intensity of fractures, and the likelihood of water inrush. Through rigorous validation during mining operations at the 11,023 working face, the efficacy was substantiated. Ultimately, the achievements offer invaluable insights and practical guidance for the advancement and implementation of water inrush early warning systems in coal mining contexts.
Water inrush is a common geological disaster in coal mines. During the process of mining, it is caused by the combined action of disturbed stress and water pressure, leading to the failure of surrounding rocks and the sudden inrush of a large amount of groundwater into the mine (Yin et al., 2022; Li et al., 2024). The water inrush disaster brings extremely heavy economic losses and casualties to coal mining. In recent years, with the exhaustion of shallow coal resources and the increase of mining intensity, coal mine water disasters have become more severe. The incubation of coal mine water inrush is affected by many factors and is a complex process involving the gestation, development and formation of water channels. Researchers have carried out in-depth research on the mechanism of water inrush and reinforcement technology (Kang et al., 2023; Ren et al., 2023; Wang et al., 2023). Zhang (2005) revealed that reduction of confinement due to mining is a major cause of water-conducting failure in the floor strata. Ding et al. (2014) pointed out that high-intensity mining of water-rich coal seams can lead to changes in stratum behavior, such as roof caving and water inrush. Zhang et al. (2017) verified the role of stress fields and seepage fields in the formation of water channels through physical experiments. Mining-induced fractures in the surrounding rock of a coal mine roof connect and extend upward to form these water channels (Sun et al., 2022). Based on a large number of cases of water inrush in karst tunnels, Li et al. (2016) proposed that the main factors affecting water inrush are karst hydrogeology and engineering disturbance. Li et al. (2021a) proposed a logistic regression model to describe the effects of compressive stress and grain size distribution on permeability and nonlinear flow characteristics of fractured rock mass. Ma et al. (2022a), Ma et al. (2022b) conducted one-dimensional radial seepage test and numerical simulation to study the process and law of water channel formation in fault rock until water inrush. In summary, water inrush is closely related to the redistribution of stress fields caused by excavation, cracking damage to surrounding rocks.
It can be seen that micro-fractures are an important precursor feature of water inrush disasters (Zhang et al., 2023; Liu et al., 2024; Shen, 2024; Zhang et al., 2024). Therefore, to monitor and forecast coal mine water inrush disasters, in addition to monitoring water flow, temperature, and pressure, it is crucial to understand the essential mechanism and precursor patterns of micro-fractures for developing analytical and forecasting methods (Li et al., 2021b; Feng et al., 2022; Gong et al., 2022; Feng et al., 2023a; Gong et al., 2024). Microseismic monitoring technology has been proved to be an effective method for coal mine water inrush monitoring and early warning (Chen et al., 2023; Wang et al., 2024). It can accurately locate the spatial position of water inrush channels, and real-time monitor the occurrence and expansion of rock bursting and micro-damage. For example, Liu et al. (2023) used a microseismic monitoring system to accurately predict and locate the water inrush path in a coal mine. Tu et al. (2021) proposed an improved microseismic monitoring technology scheme for locating the spatial position of water inrush channels in tunnel construction. Wang et al. (2021) constructed a comprehensive intelligent early warning recognition model for coal mine water inrush based on analysis of multiple precursor factors using long-term monitoring data. Ma et al. (2021) used microseismic monitoring, theoretical calculation and numerical simulation methods to analyze the failure characteristics of coal seam floor, providing reference for preventing underground water inrush disasters. Yu et al. (2022) proposed the use of mixed frequency microseismic waveform recognition to identify potential water hazards and achieve early warning. Yin et al. (2023) introduced a data-driven method that combines machine learning and deep learning models to analyze microseismic events, improving the accuracy and effectiveness of water inrush prediction. However, the precursor early warning of water inrush based on microseismic monitoring faces challenges in quantifying warning indicators. Water inrush is an occasional disaster, making it difficult to determine the threshold values of disaster warning indicators based on normal microseismic activity characteristics.
In addition, the division of three zones at the roof and floor of coal mines is also conducive to risk assessment and prediction of water inrush. Jing et al. (2006) emphasized the role of geological features such as collapsing rocks and rock layer separation, as well as the impact of overlying strata movements, on the formation of water inrush. Qiu et al. (2022) highlighted the weakening effect of faults on the key stratum, leading to multiple separation layers and increased water-conducting fractures. Wu et al. (2022) simulated the nonlinear water inrush process by solving the Darcy-Brinkman flow equation for the host rock and the fault zone based on the concept of “Three Zones” fault structure. Wei et al. (2010) predicted the risk of water inrush in the water-bearing strata of the coal seam floor based on the “lower three zones” theory. Building on the three-zone theory, Cheng et al. (2017) proposed a more detailed zoning method based on the elevation distribution of microseisms. It can be seen that microseismic monitoring results can help divide three zones and cracking depth at roof and floor, assisting in dynamic early warning of water inrush risks. The division of the three zones is mainly from the perspective of microseismic spatial distribution and disturbance range of roof and floor to assist water inrush early warning. Together, they used the microseismic location results to measure the failure depth of the roof and floor.
To address the issues and shortcomings in water inrush warning, this study was conducted against the background of the 11,023 working face mining in Paner Coal Mine. The roof and floor three-zone classification criteria were established based on the spatial distribution of microseismic activities during initial back mining. The evolution patterns of microseismic events in the roof and floor under mining disturbance were analyzed. On this basis, a comprehensive warning method for roof and floor cracking and water inrush risk was established and applied for verification. The research results can provide references for the research and application of coal mine water inrush warning.
The 11,023 working face of Paner Coal Mine is located in the eastern mining area, Panji District, Huainan City, Anhui Province. The designed length of the upper gate road is 580 m, the lower gate road is 760 m, the cutting length is 130 m, and the working face elevation is −442.8 to −474.1 m. The working face is arranged along the strike, with a mining direction length of 605 m, an inclined width of 125 m, an area of 75,625 m2, and it employs the retreat longwall mining method and fully mechanized top coal caving mining process. The entire caving method is used to manage the roof. The third coal seam thickness in the excavation block of the 11,023 working face ranges from 4.0 to 5.8 m, with an average thickness of 5.0 m. The coal seam angle is 3–15°, with an average of 9°. The overlying fourth coal seam at −350 to −400 m stage has been mined. The underlying 11,221 working face has been connected. The plan view of the 11,023 working face is shown in Figure 1.
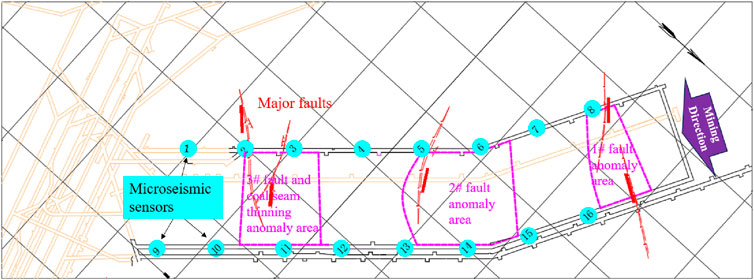
Figure 1. Plan view of the 11,023 working face.
Within the mining block of the working face, the immediate roof consists of dark gray mudstone with a thickness of approximately 1.1–12.0 m and an average thickness of 7.0 m. The compressive strength ranges from 22.2 to 35.1 MPa. The old roof is composed of medium-fine sandstone with a thickness of 7.9–17.0 m and an average thickness of 12.0 m. The direct floor is mudstone with a thickness of 1.0–2.0 m and an average thickness of 1.5 m. The average distance between the third coal seam and the underlying first coal seam is 1.5 m, and the distance from the first coal bottom to the C3Ⅰ limestone roof is 13.20–19.37 m. Details are provided in Table 1. Based on the above information, the roof of the third coal seam is composed of mudstone, sandstone, and medium-fine sandstone. The lithology varies greatly, the thickness is extremely unstable, mostly mud-calcium cemented, and a small amount is silica-cemented. It belongs to an unstable to moderately stable roof, and the overlying rock lithology is classified as medium-hard to soft and weak types. According to the drilling and geological data analysis of the 11,023 bottom extraction roadway, the working face is located in the southern wing of the Panji anticline, and the geological structure is relatively complex. There are 21 faults in the mining area, with a maximum fault drop of 5 m, including three faults with a drop greater than 3 m.
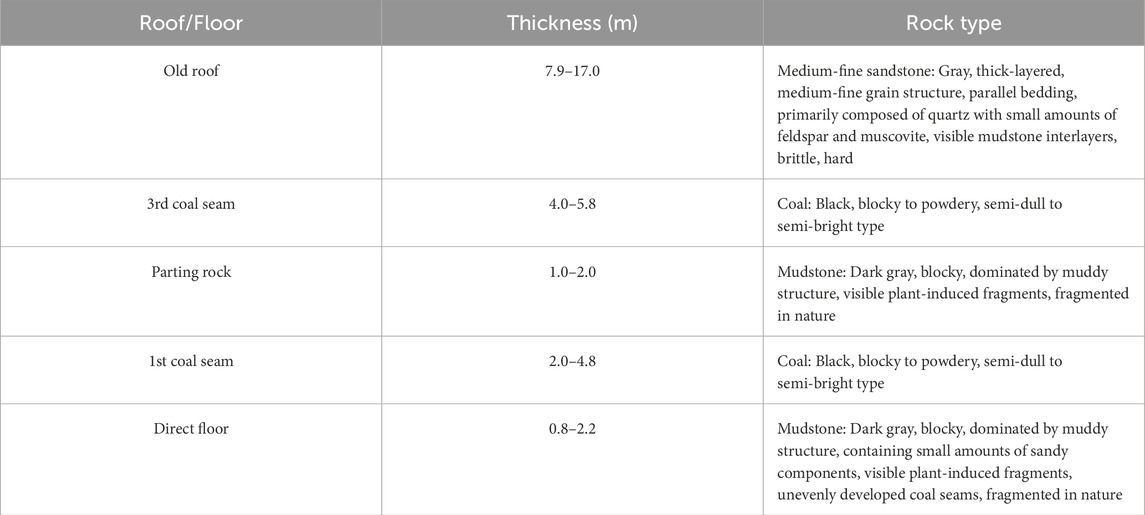
Table 1. Coal seam roof and floor conditions.
Based on mining data, surface drilling, geophysical data, and the analysis of the results of surface area management projects, there are no collapsed columns or water-conducting faults within the scope of the working face. The main factors affecting the advance of the working face are water from Taiyuan Group limestone karst, water from sandstone fractures in the roof, and fault water. The Taiyuan Formation limestone can be divided into three groups from top to bottom, namely, Group C3I, Group C3II, and Group C3III, with each group containing 3-6 layers of limestone. They are all weakly water-rich. The bottom of 11,023 working face is 12.2–32.0 m away from Group C3I limestone, with an average distance of 20.7 m. During excavation, the direct source of water supply is the karst water from Group C3I limestone in the floor, which is the main threat of water damage during the mining period.
According to exploration data, Group C3I limestone includes four layers of limestone, with C3 I1 and C3I2 as thin layers without water, and C3I3 upper and C3I3 lower as thicker layers with slight water content. The thickness of Group C3I is 16.9–43.1 m with an average of 32.5 m, and the total thickness of limestone is 11.4–23.1 m with an average of 16.1 m. Two pumping tests and one water injection test were conducted within the mining area for Group C3I limestone, with unit water inflow Q = 0.000009–0.0003L/(s.m), permeability coefficient K = 0.000021–0.0013 m/d, weak water richness, and poor water conductivity; the mineralization degree is 2.104–2.980 g/L, and the water quality is Cl-HCO3-K+Na type with a temperature range of 38°C–42°C.
When cracks occur, propagate, and friction within rocks, the cumulative energy is released in the form of stress waves, generating microseismic events that propagate in the form of P-waves and S-waves. The microseismic monitoring system uses seismic detectors or acceleration sensors to convert received waveforms into electrical signals, which are then transformed into data signals through a data acquisition system. With specialized data processing software, the system can accurately determine the time, location, and magnitude (space-time strength) of microseismic events in three-dimensional space. This enables qualitative and quantitative evaluations of the extent, stability, and development trends of rock damage activities.
The adopted fiber optic microseismic monitoring system is based on Michelson fiber optic vibration monitoring technology, providing high-precision and intelligent monitoring of rock microfractures. The fiber optic microseismic monitoring instrument, with advantages such as high sensitivity, wide frequency response, and large dynamic range, meets the monitoring requirements for a broad frequency band of coal and rock fracture vibrations from low seismic to high seismic frequencies. The fiber optic microseismic monitoring system in this project consists of one host unit of a 16-channel mine explosion-proof and intrinsically safe fiber optic microseismic monitoring device, 16 sensors, one set of ground collection servers, and supporting microseismic collection and processing software systems, all connected by armored fiber optics, as shown in Figure 2.
(1) The mine explosion-proof and intrinsically safe fiber optic microseismic monitoring device host is divided into three main components: fiber optic laser module, signal acquisition and demodulation module, and data acquisition module. The host creates a fiber optic microseismic monitoring array through a wavelength division multiplexing network using the light generated by the fiber optic laser module. The microseismic vibrations collected by the fiber optic sensors are converted into analog signals by the signal acquisition and demodulation module, then transformed into digital signals by the data acquisition module before being sent to the data processing and analysis warning center for further analysis.
(2) The fiber optic acceleration sensor uses a polarization-independent fiber optic Michelson interferometer based on a push-pull structure. Under the action of microvibrations generated by rock fractures, the mass block stretches or compresses the elastic body, causing deformation in the fiber wound around the elastic body, creating interference phase difference. The change in optical phase shift is proportional to acceleration. Through backend phase demodulation technology, the acceleration signal is restored, achieving microseismic acceleration monitoring.
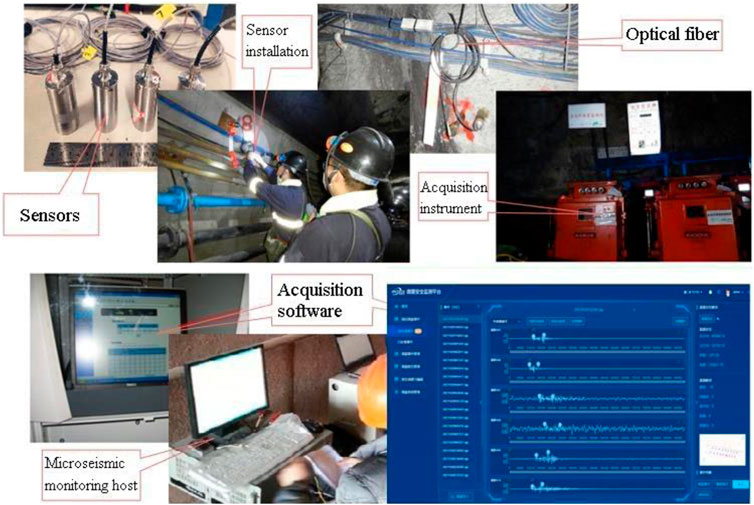
Figure 2. Fiber optic microseismic monitoring system.
Considering the geological conditions of the 11,023 working face and ensuring the accuracy of event location, a total of 16 microseismic monitoring points were deployed in the 11,023 working face network, as shown by the cyan dot in Figure 1. Eight microseismic monitoring points were arranged in the upper gate road with a distance of approximately 80 m between adjacent points, and eight were arranged in the lower gate road with a distance of about 85 m between adjacent points. This spatial arrangement provided comprehensive monitoring of the 11,023 working face in all directions. The first microseismic monitoring point in the upper gate road was approximately 95 m from the cutting head, while the first point in the lower gate road was about 145 m from the cutting head. The collection station located in the return airway and connected to the surface through fiber optics for signal transmission to the ground server and storage. The layout scheme of the microseismic monitoring system network is shown in Figure 3. The detectors adopted the single-axis highly sensitive acceleration sensors, which needed to be placed at the tail of the support anchor rod (anchor rod length 2.5 m) with the help of connecting joints.
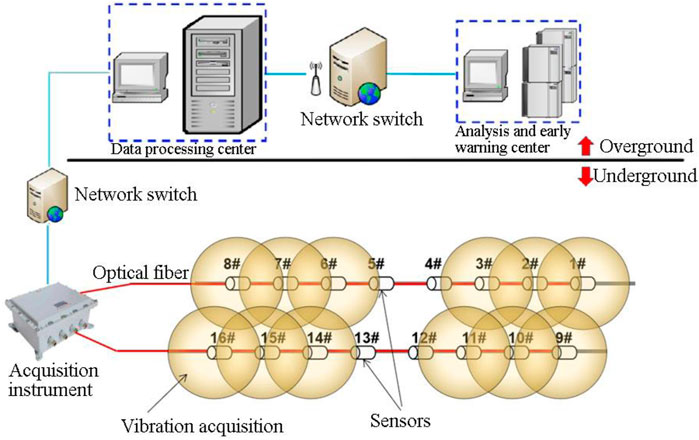
Figure 3. The layout scheme of microseismic monitoring system on the 11,023 working face.
Once microseismic waveforms are collected, the system uses a recursive STA/LTA algorithm for initial screening. Waveforms triggered by four or more channels within 0.4 s are marked as suspected events and saved. Suspected events contain both microseismic signals (as shown in Figure 4A) and a significant amount of construction noise and interference signals, such as drilling, human movement, drainage pumps, etc. (as shown in Figure 4B). Noise signals are identified and removed through signal analysis. After picking the arrival times of microseismic P waves, the simplex method is used for location. Based on feedback from location results, the software calculates theoretical P wave arrival times for correcting and optimizing arrival time picking and location errors.
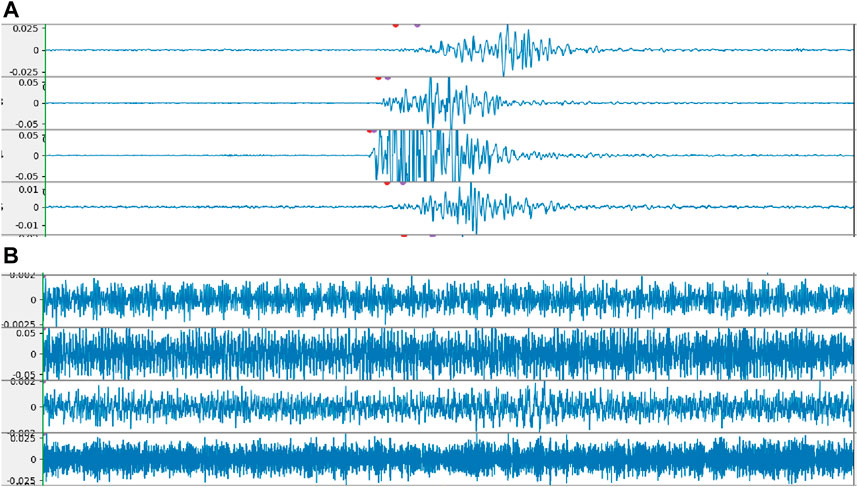
Figure 4. Typical waveforms: (A) rock fracture waveform and (B) noise waveform.
After microseismic event location, source parameters can be solved, focusing on seismic moment, energy, apparent stress, and apparent volume, and energy density.
The seismic moment numerically equals the work done during the source tension or faulting process, causing corresponding non-elastic deformation. It is a scalar quantity. A larger seismic moment indicates more severe damage to the source area. The seismic moment can be estimated using Eq. 1 (Aki, 1968):
where ρ is the density of the source rock, v is the P-wave or S-wave velocity, R is the source distance, Ω is the low-frequency displacement amplitude, and F is the root mean square of the far-field displacement pattern mapped onto the source sphere for P-waves (
Microseismic radiation energy (referred to as energy) is the energy of stress waves radiated outward during the rock fracture process. In the time domain, the radiated seismic energy of P-waves or S-waves is proportional to the integral of squared velocity signal, represented by Eq. 2 (Snoke, 1987):
where
The apparent stress represents the stress level at the source, expressed by Eq. 3 (Wyss and Brune, 1968; Wyss and Brune, 1971):
where μ is the rigidity of the rock mass,
The apparent volume measures the volume of rock body that undergoes the corresponding non-elastic strain under the effect of apparent stress, and the calculation formula is as follows:
In Eq. 4, the physical unit of the apparent volume is m3, so it is convenient to accumulate and can also be analyzed in the form of a heat map.
The rock failure of the roof and floor and the evolution of water-conducting fractures caused by mining in the working face are essentially the macroscopic manifestations of micro-fracture behaviors such as the expansion of the original cracks and the formation of new cracks. Based on the spatial clustering properties of microseismic events, the depth of the concentrated region of micro-fracturing is regarded as the depth of roof and floor damage. Therefore, it is reasonable to associate the spatial distribution of microseismic events with the distribution of geological layers to determine the depth of floor damage.
Based on the analysis of microseismic data from 11,023 working face from October to November 2022, spatial analysis of the microseismic events was conducted. Figure 5 represents the statistical count of microseismic events changing with elevation. It can be seen that microseismic events during different time periods show similar distribution characteristics in terms of elevation. Most of the microseismic events are distributed within the range of 0–30 m in the floor and 0–20 m in the roof. There are more microseismic events in the floor than in the roof, indicating that the floor is affected by mining activities resulting in more extensive damage.
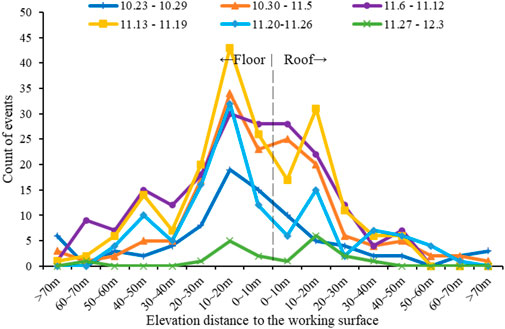
Figure 5. The distribution of microseismic events on elevation in different time ranges.
Additionally, the variation in the degree of microseismic event clustering in the roof and floor can be observed. There are notable turning points in the number of microseismic events within the 30–40 m range of the floor and the 20–30 m range of the roof. This indicates that the failure depth of the floor is not completely stratified according to the geological structure. Consequently, it is necessary to determine the depth of roof and floor damage based on the vertical distribution of microseismic events to dynamically assess the damage situation.
Figure 6 shows the distribution of microseismic events in the horizontal direction. It can be seen that during October and November, microseismic events were mainly distributed within a range of 100 m in front of the working face. The quantity and energy of the events increased near the 1# fault anomaly area, mainly due to the mining activities that disrupted the static equilibrium of the fault structure, causing the fault to release a large amount of energy and inducing a great deal of microseismic activity. Early roadway sides also saw microseismic activity, mainly due to mining disturbance-caused stress changes in the surrounding rock, plus the extension of the 1# fault anomaly area from the working face to beyond. The rock on the outer side of the roadway is prone to fragmentation.
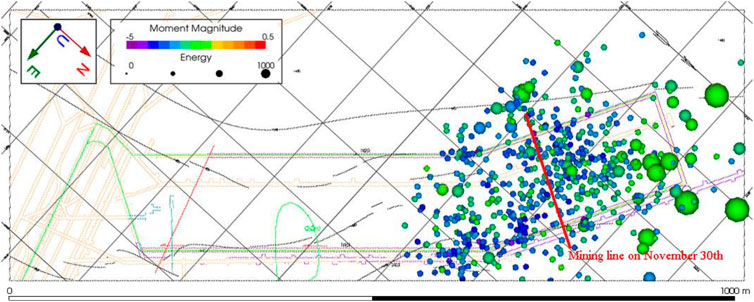
Figure 6. The distribution of microseismic events in the horizontal direction.
After the roof of a coal mining face collapses, the rock layers above progressively fall, layer by layer, until the collapsed gangue comes into contact with the overlying rock layers. This zone of collapse and damage is known as the roof caved zone. After the free fall of the roof rock, the rock layers above the collapse zone continue to sink and bend. When this bending exceeds the strength of the rock layers, tensile fractures and eventual breakage occur. This process develops layer by layer upwards until the overall sinking and bending of the overlying rock layers ceases. This part is referred to as the fractured zone.
Based on the range of microseismic activity in the roof, an analysis of the damage height of the roof rock layers is conducted. Since the distribution of microseismic events’ height may not necessarily conform to the statistical distribution in Figure 5, using the turning point of the statistical distribution as the basis for dividing the three zones may not reflect the actual situation. Therefore, the height of the caved zone is inferred from the height of 80% of the microseismic events. The data analysis infers the height of the caved zone to be about 31.72 m. The height of the fractured zone is inferred from the height of the maximum distance between the microseismic event and the roof. The inferred height of the fractured zone is about 44.52 m according to data analysis.
According to the geological conditions of the 11,023 working face. The heights of the caved zone and fractured zone of the roof are calculated using empirical formulas from the Regulations on the Preservation of Roof Pillars of Buildings, Water Bodies, Railways and Main Wells and the Mining Procedure of Pressurized Coal (short for Regulations) and the Standards for Hydro-geological Geological Survey in the Mining Area (short for Standards). The calculations are compared with the heights of the caved zone and fractured zone of the roof inferred from the microseismic monitoring, as shown in Table 2. It can be seen that compared with the empirical formulas, the caved zone height inferred by microseismic monitoring is higher, and the fractured zone height is in good agreement.
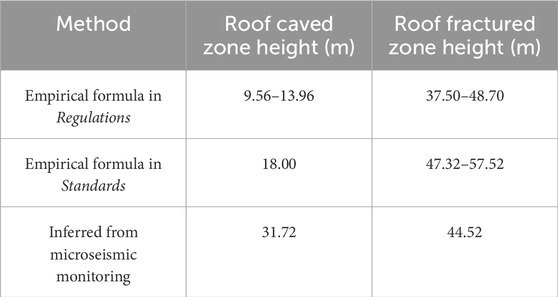
Table 2. Inferred heights of roof caved zone and fractured zone from empirical formulas and microseismic monitoring.
Due to the effect of mining pressure, the floor rock strata are continuously damaged, and the layer zone with significantly changed water conductivity is called the floor damaged zone. The floor water-blocking zone is the part where the rock layer at the bottom of the coal seam maintains its integrity and original waterproof performance. This zone is located between the floor damaged zone and the confined water uplift zone. This zone plays a role in preventing the connection between the floor damaged zone and the confined water uplift zone. Since the Floor Direct Water-bearing Layer of 3 Coal is a weak water-bearing layer, the confined water uplift zone can be ignored. According to the range of microseismic activity in the floor, the depth of floor damaged is analyzed. Using the depth where 80% of the microseismic events are concentrated to infer the height of the floor damaged zone, the data analysis infers that the floor damaged zone is about 33.94 m below the coal seam floor; using the deepest depth of the microseismic events from the floor to infer the height of floor water-blocking zone, according to the data analysis, the height of the water-blocking zone is about 54.68 m.
According to the geological conditions of the 11,023 working face, the height of the floor damaged zone of the floor is calculated using the empirical formulas from the Regulations and the Standards. The calculation results of the floor damaged zone height and the water-blocking zone height are compared with the results inferred from the microseismic monitoring, as shown in Table 3. It can be seen that compared with the empirical formula, the height of the floor damaged zone inferred by microseismic monitoring is higher. There is no empirical formula for predicting the height of floor water-blocking zone.
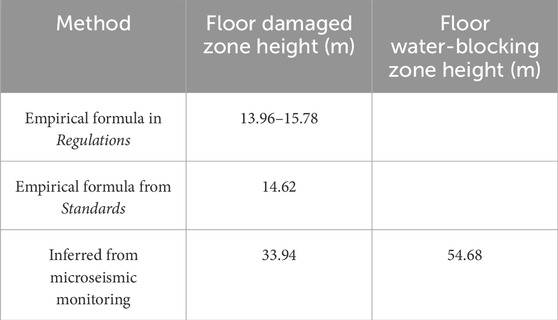
Table 3. Inferred heights of the floor damaged zone and water-blocking zone from empirical formulas and microseismic monitoring.
The formation of water-conducting fractures in coal mine surrounding rock under mining activities is an evolutionary process of stress and strain, inevitably accompanied by rock fracturing, crack expansion, and other rock mechanics phenomena, leading to microseismic events. Studying the evolution of microseismic parameters under the action of mining disturbance can be used to evaluate the formation of water-conducting channels and the risk of water inrush.
The correlation between the cumulative energy of daily microseismic events, the cumulative number of events, and the daily footage in November is statistically summarised, as shown in Figure 7. It can be seen that the mining speed was relatively high at the beginning of November. Correspondingly, the number of microseismic events was also higher. As the mining speed decreased, the degree of mining disturbance reduced, and the number of microseismic events also showed a downward trend. Overall, there is a certain positive correlation between the two.
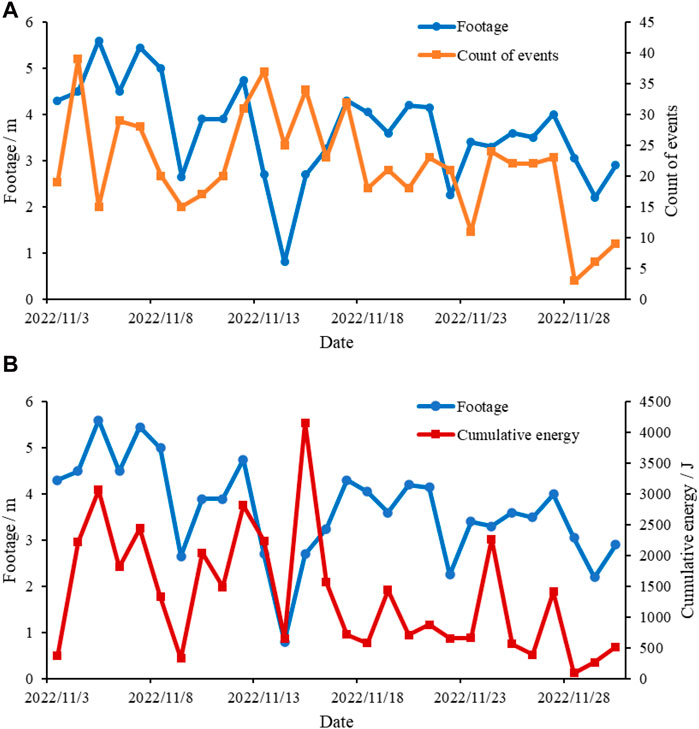
Figure 7. Changes of microseismic parameters under excavation disturbance in November. (A) Relationship between daily microseismic event count and daily footage, (B) Relationship between daily cumulative energy and daily footage.
Similarly, the daily cumulative energy of the microseismic events on the 11,023 working face is positively related to the mining speed. Since the energy release size during the surrounding rock destruction mainly depends on the original geostress field and the coal rock geological conditions, the defects like joints, structural planes, and other adverse geological bodies existing in the surrounding rock make different sections have certain differences in the stress field and geological conditions. Therefore, the fluctuation of cumulative energy is relatively more apparent. The advancement speed of the working face and the frequency and energy of the microseismic events caused by disturbances are somewhat related. When the mining speed is faster, the intensity of microseismic activity will increase, thereby increasing the risk of roof and floor fracturing and water inrush. Thus, the risk of roof and floor fracturing and water inrush can be reduced by reasonably controlling the mining speed of the working face.
By taking daily excavating progress, microseismic event counts, cumulative energy, apparent stress, and apparent volume as five parameters in November, their correlation coefficients are calculated and the resultant confusion matrix is acquired, as shown in Figure 8. The excavation progress has a low correlation coefficient with various source parameters. The number of microseismic events and the cumulative energy are significantly positively correlated, and the apparent stress and apparent volume are negatively correlated at a smaller degree. In short, these microseismic parameters characterize the evolution of rock micro-fractures under the influence of mining disturbance from different dimensions. Through the statistical analysis of the abnormal changes of these parameters, dynamic early warning of roof and floor fracturing and water inrush risks can be realized.
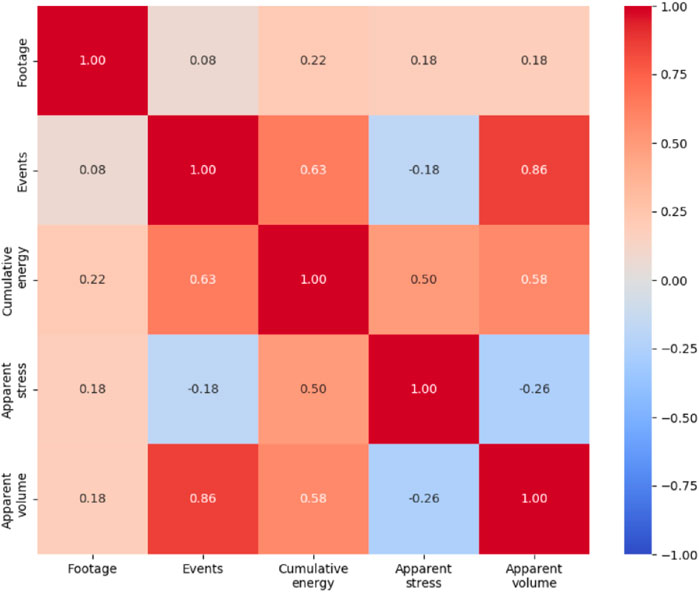
Figure 8. Confusion matrix of excavation footage and microseismic parameters.
Figure 9 shows the variation curves of the daily average apparent stress and cumulative apparent volume of the roof microseismic events from October to November. It can be seen that the apparent stress and apparent volume are roughly negatively correlated. Moreover, the apparent stress and apparent volume generally show periodic changes. The time interval for the trough of the apparent volume is about 3 days.
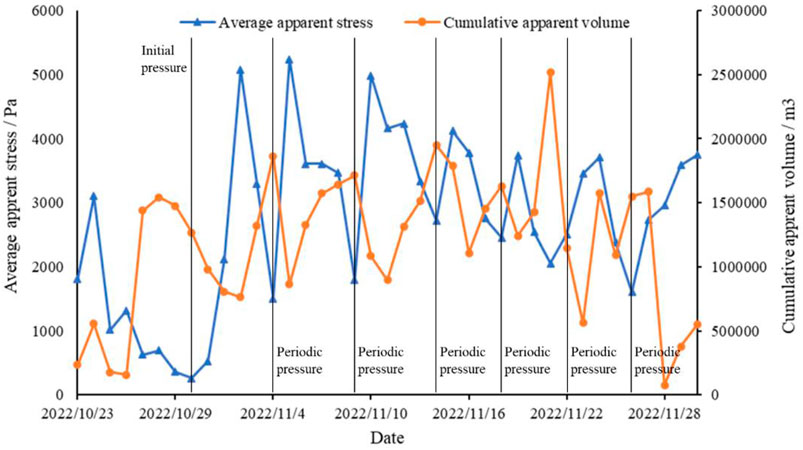
Figure 9. The daily average apparent stress and cumulative apparent volume of the roof microseismic events from October to November 2022.
Periodic pressure is a phenomenon that occurs when the mining face continues to advance and the span of roof exposure reaches a certain length, causing the roof to break and collapse along the coal wall. Influenced by the advancement of the working face, this collapse phenomenon often appears periodically. According to field records, the periodic pressure time interval of the initial mining face roof is about 4 days. Judging from the periodic changes of the microseismic event parameters above, the two have a good correspondence. Specifically, when periodic pressure occurs, the average microseismic apparent stress is often low, and the cumulative apparent volume is often high. Then the average apparent stress gradually increases and the apparent volume decreases. When the next periodic pressure event occurs, the apparent stress of a microseismic event drops again, and the cumulative apparent volume increases simultaneously.
According to the periodic changes in microseismic parameters, it can be considered that the rock mass has undergone a process of stress accumulation and stress release. As the working face advances, the roof continues to accumulate stress under its own weight and the load of the overlying rock layer, which is manifested as an increase in microseismic apparent stress. When the accumulated stress reaches a certain level, the accumulated stress starts to be released and the roof collapses as weight, manifested as an increase in microseismic apparent volume. With the release of stress, the apparent stress also starts to decrease. In summary, the apparent stress and apparent volume effectively reflect the stress-strain process in the rock mass under excavation disturbance. Apparent stress can serve as an indicator to measure the degree of stress accumulation in the rock mass, while the apparent volume can serve as an important index to quantify the extent of rock fracturing.
The energy released during rock fracturing involves dissipative energy and elastic strain energy. Elastic strain energy is positively correlated with high stress, which is a necessary condition for the fracturing and water permeability of the roof and floor. Therefore, the vertical distribution of microseismic energy obtained from monitoring can indirectly reflect the high-stress distribution necessary for the formation of water-conducting channels.
From October to November 2022, the maximum energy of a microseismic event on the mine floor was 6,655.89 J. The number of events in the energy ranges of 0J–100J, 100J–500J, 500J–1000J, and above 1000 J were 401, 58, 5, and 1, respectively, accounting for 86.24%, 12.47%, 1.08%, and 0.22% of the total. The energy of microseismic events is low, indicating a lesser degree of rock fracturing. Vertically, high-energy events are mainly concentrated within 20 m of the mine floor (as shown in Figure 10). In the Carboniferous II group limestone and below, only scattered low-energy microseismic events were observed, with no deep aquifer microseismic events detected. No hidden water-conducting structures or weak areas were found in the monitored area of the working face floor, making it impossible to form water inrush channels.
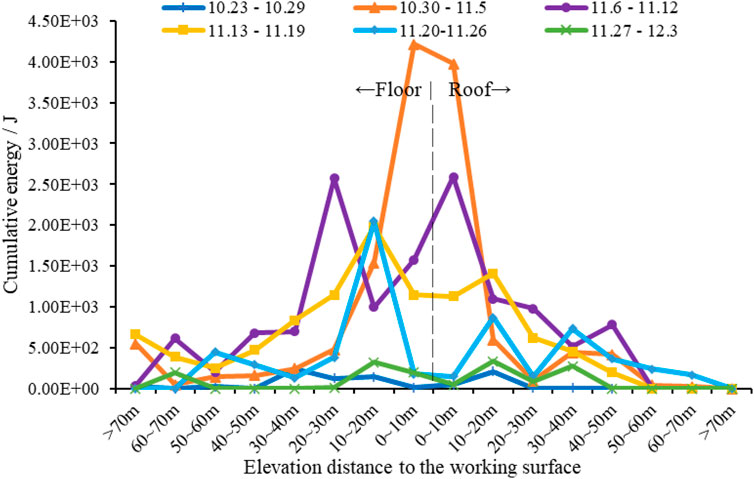
Figure 10. The distribution of cumulative energy on elevation in different time ranges.
Since apparent volume can quantify the degree of rock fracturing, it can be used to assess the development of water-conducting fracture zones in the mine floor and the risk of water inrush. Project the microseismic events of the mine floor onto a horizontal plane and divide the mining area into a grid of 30 × 160. Calculate the cumulative apparent volume of microseismic events in each grid. Based on the cumulative apparent volume in each grid, draw an apparent volume cloud map. By analyzing the apparent volume cloud map, the extent of non-elastic deformation of the mine floor and the potential locations of water-conducting fractures can be determined. Finally, the potential directions of extension of water-conducting channels can be identified based on areas with higher apparent volumes on the map.
The apparent volume cloud map of the mine floor from October to November is shown in Figure 11. It can be seen that the areas with higher apparent volumes overlap with the distribution of 1# fault anomaly area. The highest cumulative apparent volume is 204,514 m3. According to hydrogeological conditions, this magnitude of cumulative apparent volume is insufficient to form fault water. In early warning practices, microseismic energy and apparent volume are often complementary parameters. For example, a large apparent volume may indicate a broad area of fracturing and deformation but does not necessarily mean that these areas are accompanied by a significant release of energy. On the other hand, high-energy microseismic activity may indicate a localized area undergoing severe damage, representing the manifestation of high stress. Therefore, using both indicators in combination can provide a more comprehensive assessment of the rock damage status and water inrush risk.
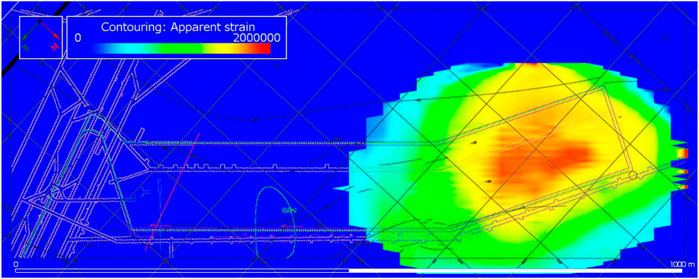
Figure 11. Cumulative apparent volume contour of the floor during October-November.
Due to the fact that microseismic activity is mainly concentrated in the range of 0–20 m on the roof and 0–40 m on the floor, and the microseismic energy is generally small, the risk of water inrush is relatively low, making it difficult to establish a microseismic index quantization early warning model based on traditional intelligent algorithms and established water inrush disasters. Therefore, this study adopts an anomaly detection approach to establish an early warning model for water inrush risk based on anomaly judgment criteria. From the three dimensions of fracture depth, fracture strength, and water inrush risk, different discriminant indicators are used for early warning. Based on the results of previous microseismic monitoring, the distribution of each indicator is determined, and the expected value and standard deviation of each indicator under normal conditions are solved. Then, the double standard deviation is taken as the early warning threshold. That is, if the indicator deviates from the double standard deviation, it is considered abnormal and an early warning judgment is made. The greater the degree of deviation of the indicator, the higher the risk of cracking and water inrush. Therefore, every time a standard deviation is exceeded, the early warning level is raised one level.
During early warning, the size of the early warning indicator is calculated based on the current monitoring data, and the early warning level is determined. Finally, the comprehensive early warning results of the depth of fractures, the intensity of fractures, and the water inrush risk are provided, providing a reference for the prevention and control of water disasters. This comprehensive early warning method can be integrated with the microseismic data processing and positioning interface based on artificial intelligence to achieve automatic early warning and generate early warning reports automatically.
The depth of fractures mainly depends on the vertical distribution of microseismic events in the 3 days before the warning. Following the stratification criteria determined in Section 4, the height at which 80% of the microseismic events are concentrated is used to infer the height of the roof caved zone and the floor damaged zone. The maximum distance between microseismic events and the roof and floor are used to infer the height of the roof fractured zone and the floor water-blocking zone. According to the statistical results of monitoring from October-November, the average height, standard deviation, and the range of warning indicators for the depth of fractures obtained from the warning criteria are shown in Table 4.
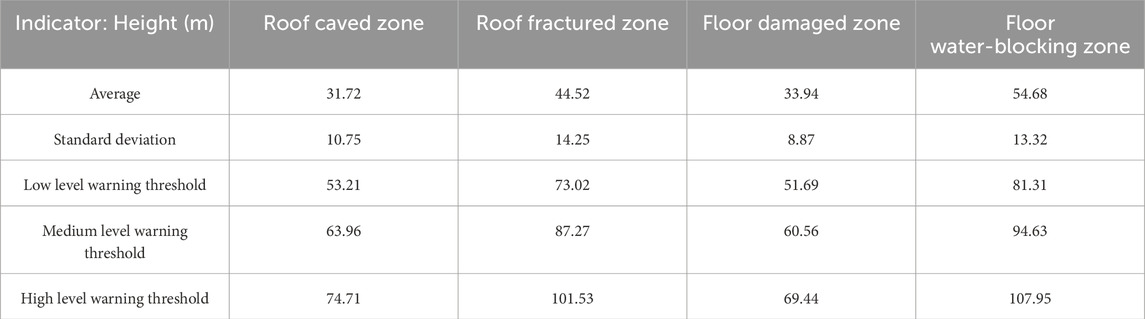
Table 4. The range of warning indicators for the depth of fractures.
The intensity of fractures is primarily determined based on the number of microseismic events and the cumulative energy in the roof and floor during the 3 days preceding the warning. According to the statistical results of the monitoring from October to November, the average number detected in the floor over three consecutive days was 36.86, the average cumulative energy was 2060.14 J, and the standard deviations were 12.63 and 1,598.01 J, respectively. For the roof, the average number of events was 21.95, the average cumulative energy was 1,460.53 J, and the standard deviations were 9.22 and 1,115.67 J, respectively. According to the warning criteria, the range of the intensity of fracture warning indicators are shown in Table 5. A warning is issued if any one of the event count or cumulative energy exceeds the warning indicator.
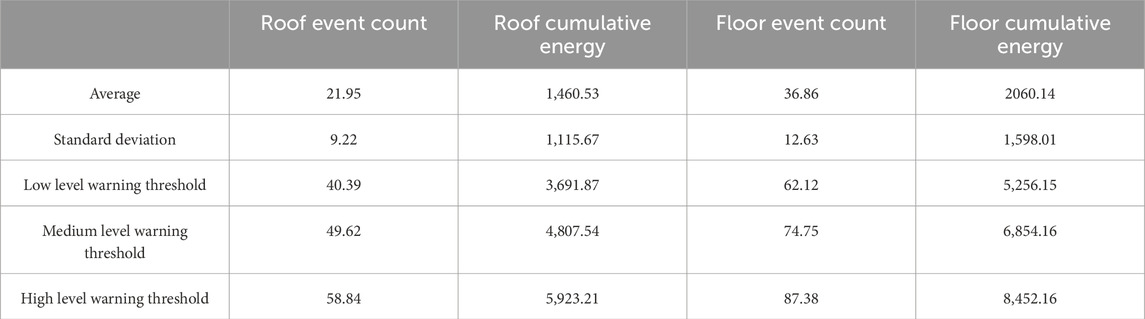
Table 5. The range of warning indicators for the intensity of fractures.
The water inrush risk is primarily based on the cumulative apparent volume cloud map of the floor in the 3 days preceding the warning moment. To simplify calculations, only the maximum cumulative apparent volume in each grid cell of the cloud map is taken as the warning indicator for assessing the risk of water inrush. According to the warning criteria, the range of warning indicators for the water inrush risk is shown in the table. As a useful supplement, the elevation of the daily maximum microseismic energy is also used as an indicator of water inrush risk warning, in order to quantify the depth of stress accumulation. According to the statistics of the monitoring results from October to November, the range of the warning indicator obtained is shown in Table 6.
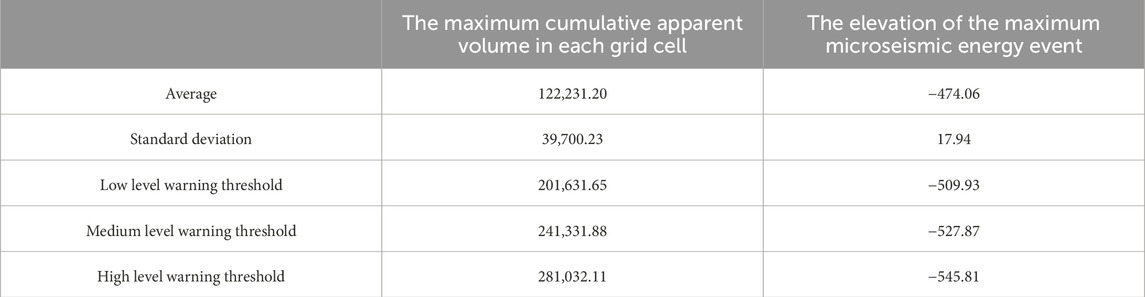
Table 6. The range of warning indicators for the water inrush risk.
The proposed early warning method was applied to the roof and floor cracking and water inrush warning for the 11,023 working face since December. During the application process, input parameters needed to update daily. Microseismic data were collected, input classification and arrival picking algorithms. The location and solution of the source parameters were carried out, and warning indicators were calculated and the warning level determined, finally giving the early warning result. The fracture depth and warning results from December to May are shown in Figure 12. After December 2022, as the mining face gradually moved away from 1# fault anomaly area, the roof fracture depth gradually decreased. Then, during February 2023, while crossing 2# fault anomaly area, the roof damage depth increased. Until April 2023, when the mining essentially crossed 3# fault and coal seam thinning anomaly area, as the mining speed slowed down, the depth of roof fractures decreased. In comparison, the change of depth was insignificant in the floor damaged zone and the floor water-blocking zone. As the warning indicators did not exceed the threshold, no fracture depth warning was triggered.
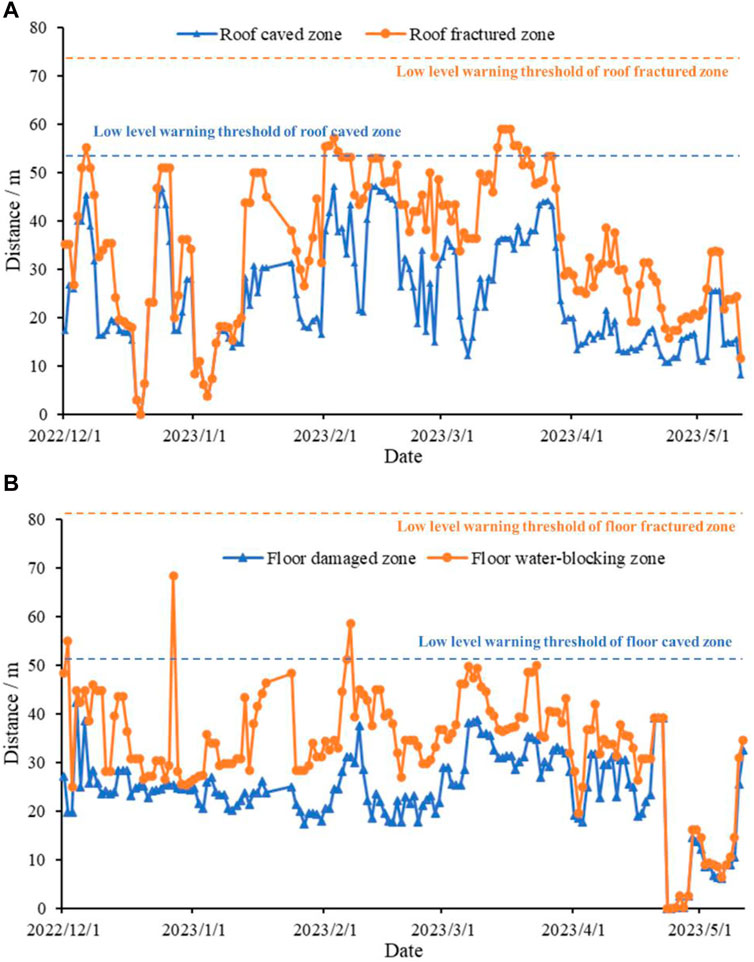
Figure 12. The fracture depth and warning results from December 2022 to May 2023. (A) Roof, (B) Floor.
The fracture intensity and warning results from December to May are shown in Figure 13. Due to the slowdown of the mining pace in December 2022, the number of roof microseismic events was small. From February 2023, as the mining speed increased, the number of roof microseismic events increased, but the cumulative energy decreased. From March to April 2023, with a faster mining speed, and crossing 3# fault and coal seam thinning anomaly area, the disturbance caused the surrounding rock to fracture more, thus the number of roof microseismic events and cumulative energy reached their peaks. As the mining speed decreased in the late period, the number and energy of microseismic events also decreased. As the cumulative energy exceeded the threshold in mid-April, a low and medium level warning was triggered for roof fracture intensity. In comparison, the peak of floor microseismic events occurred in March, and the peak of cumulative energy occurred in April, overall being less influenced by geological conditions. As the warning indicators exceeded the threshold in March, a low-level warning was triggered for floor fracture intensity.
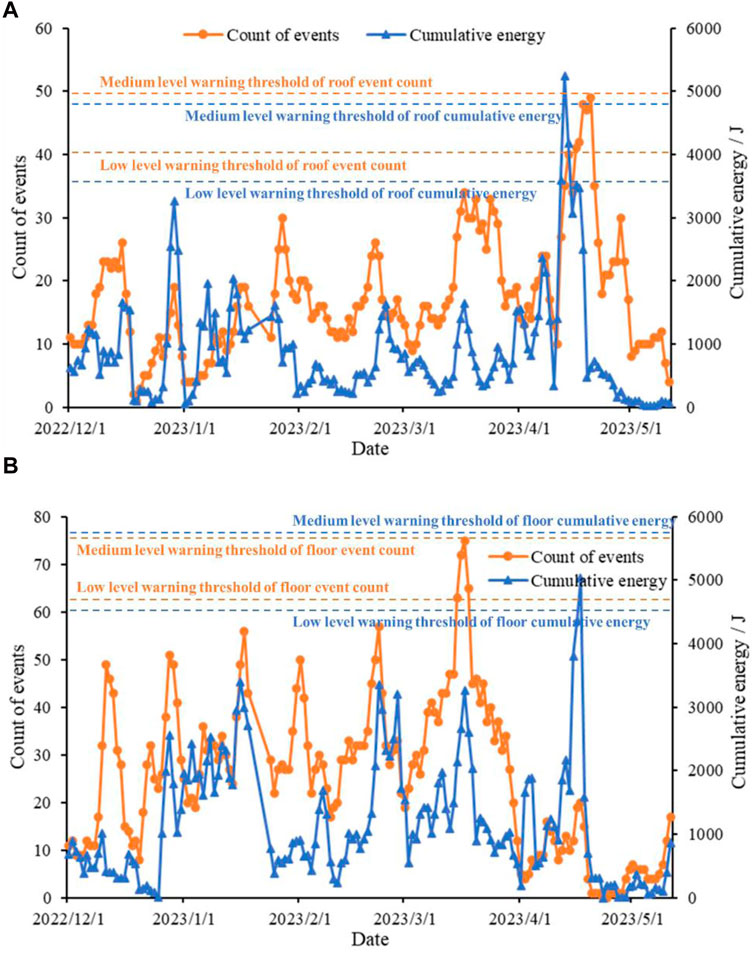
Figure 13. The fracture intensity and warning results from December 2022 to May 2023. (A) Roof, (B) Floor.
The water inrush risk and warning results from December to May are shown in Figure 14. Since December 2022, as the mining face gradually moved away from 1# fault anomaly area, the stress release of the working face slowed down, keeping the apparent volume low. From January to March 2023, as the face crossed 2# fault anomaly area, 3# fault and coal seam thinning anomaly area, the apparent volume returned to the level established by the warning indicators from October to November. After April, the apparent volume continuously decreased. In comparison, the elevation of the maximum microseismic energy event does not show any apparent anomalies. Since the warning indicators did not exceed the threshold, no warning was triggered for water inrush risk. In summary, the changes in microseismic activity, geological conditions, and early warning indicators during the mining period have a good correspondence, which demonstrates the effectiveness of the established early warning method.
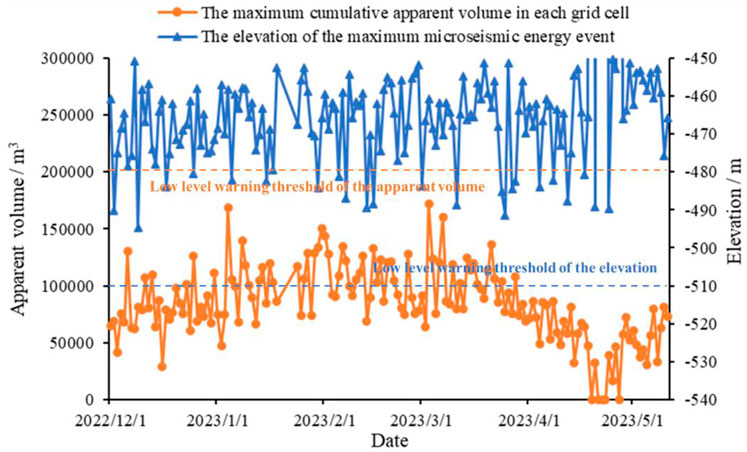
Figure 14. The water inrush risk and warning results from December 2022 to May 2023.
Based on the initial monitoring data from working face 11,023, the early warning method for water inrush proposed in this study has established a comprehensive early warning model. The characteristics of microseismic activity may vary for different projects, but remain self-similar within the same project. Figures 5, 10, as well as other figures, also demonstrate similar spatial and energy distribution characteristics of microseismic activity across different time periods. Therefore, it is reasonable to develop an early warning model based on the self-similar nature of microearthquakes.
However, due to variations in microseismic activity among different projects, the actual distribution characteristics of microseismic activity used to divide the three zones and establish a comprehensive early warning model may differ significantly from those observed in this case. For instance, at the Dongjiahe Coal Mine, most microearthquakes are concentrated in the roof area and occurrences within tens to hundreds of meters depth are not uncommon (Cheng et al., 2017). In such cases, appropriate adjustments should be made to the segmentation threshold of the comprehensive early warning model based on actual microseismic distribution and geological conditions.
Additionally, this study utilizes the standard deviation of microseismic distribution to establish the warning threshold. Depending on the degree of similarity of the specific problem, the distribution characteristics of key early warning indicators, and mathematical modeling skills, other types of early warning methods can also be considered (Feng et al., 2023b; Xiang et al., 2023; Cai et al., 2024).
This study focuses on assessing the cracking of both the roof and floor within the 11,023 working face of the Paner Coal Mine, particularly under the influence of mining disturbances and hydraulic pressure, while also evaluating the potential risk of water inrush incidents. Through meticulous analysis of the spatiotemporal distribution of microseismic events and an in-depth exploration of the interplay between key source parameters including energy, apparent stress, and apparent volume, and excavation disturbances, the research endeavors to gauge the extent of roof and floor cracking and the associated risk of water inrush. Moreover, the study pioneers the establishment of a comprehensive early warning methodology tailored to predict roof and floor fractures as well as anticipate water inrush risks. The conclusions can be drawn as follows:
(1) It proposes to use the height at which 80% of microseismic events are concentrated to infer the height of the roof caved zone and the floor damaged zone; and to use the maximum distance between microseismic events and the roof and floor to infer the height of the roof fractured zone and the floor water-blocking zone. Compared to the three-zone height division based on empirical formulas, the three-zone division through microseismic monitoring can dynamically identify the current fractured zone height of the roof and floor of the working face, better predicting the impact of mining disturbances and hydraulic pressure on them.
(2) The advancement speed of the working face has a certain correlation with the frequency and energy of microseismic events caused by disturbances. The periodic changes in average apparent stress and cumulative apparent volume correspond well with the roof pressure during back mining. Apparent stress can be used as an indicator to measure the degree of stress accumulation in the rock mass, while apparent volume is an important indicator for quantifying the degree of rock fracturing.
(3) It proposes a comprehensive early warning method for roof and floor cracking and water inrush risk, considering three dimensions: the depth of fractures, the intensity of fractures, and the water inrush risk. Based on previous microseismic monitoring results, twice the standard deviation of each warning indicator is used as the warning threshold. The application and verification during the back mining period of the 11,023 working face show a good correspondence between microseismic activity, geological conditions, and the change in warning indicators, demonstrating the effectiveness of the established warning method.
The raw data supporting the conclusions of this article will be made available by the authors, without undue reservation.
SoZ: Formal Analysis, Funding acquisition, Investigation, Writing–original draft. XW: Formal Analysis, Investigation, Writing–original draft. LT: Data curation, Investigation, Validation, Writing–review and editing. WD: Formal Analysis, Validation, Writing–review and editing. BG: Conceptualization, Methodology, Supervision, Writing–review and editing. CM: Formal Analysis, Project administration, Writing–review and editing. SnZ: Formal Analysis, Visualization, Writing–review and editing.
The author(s) declare that financial support was received for the research, authorship, and/or publication of this article. This research was funded by the Collaborative Innovation Project of Colleges and Universities in Anhui Province (Grant No. GXXT-2022-020); the Scientific Research Foundation for High-level Talents of Anhui University of Science and Technology (Grant No. 2023yjrc07); the University Natural Science Foundation of Anhui Province (Grant No. 2022AH030088); the Anhui Provincial Natural Science Foundation (Grant No. 2308085ME153); the Foundation of Joint National-Local Engineering Research Centre for Safe and Precise Coal Mining (Grant No. EC2022011); the National Natural Science Foundation of China (Grant No. 52227901); the Guizhou Provincial Key Technology R&D Program (Grant No. 2022-005).
Author XW was employed by Anhui Zhibo Photoelectric Technology Co., Ltd. Author SnZ was employed by Guizhou Mine Safety Scientific Research Institute Co., Ltd.
The remaining authors declare that the research was conducted in the absence of any commercial or financial relationships that could be construed as a potential conflict of interest.
All claims expressed in this article are solely those of the authors and do not necessarily represent those of their affiliated organizations, or those of the publisher, the editors and the reviewers. Any product that may be evaluated in this article, or claim that may be made by its manufacturer, is not guaranteed or endorsed by the publisher.
Aki, K. (1968). Seismic displacements near a fault. J. Geophys. Res. 73, 5359–5376. doi:10.1029/jb073i016p05359
Cai, W., Lan, F., Huang, X., Hao, J., Xia, W., Tang, R., et al. (2024). Generative probabilistic prediction of precipitation induced landslide deformation with variational autoencoder and gated recurrent unit. Front. Earth Sci. 12, 1394129. doi:10.3389/feart.2024.1394129
Chen, G., Liu, X., and Song, D. (2023). Research on in situ stress inversion of deep-buried tunnel based on pressure/tension axis mechanism and geological structure. Deep Undergr. Sci. Eng. 2 (1), 61–73. doi:10.1002/dug2.12025
Cheng, G., Ma, T., Tang, C., Liu, H., and Wang, S. (2017). A zoning model for coal mining-induced strata movement based on microseismic monitoring. Int. J. Rock Mech. Min. Sci. 94, 123–138. doi:10.1016/j.ijrmms.2017.03.001
Ding, H., Miao, X., Ju, F., Wang, X., and Wang, Q. (2014). Strata behavior investigation for high-intensity mining in the water-rich coal seam. Int. J. Min. Sci. Technol. 24 (3), 299–304. doi:10.1016/j.ijmst.2014.03.002
Feng, X., Gong, B., Cheng, X., Zhang, H., and Tang, C. (2022). Anisotropy and microcrack-induced failure precursor of shales under dynamic splitting. Geomatics, Nat. Hazards Risk 13, 2864–2889. doi:10.1080/19475705.2022.2137440
Feng, X., Gong, B., Liang, Z., Wang, S., Tang, C., Li, H., et al. (2023a). Study of the dynamic failure characteristics of anisotropic shales under impact Brazilian splitting. Rock Mech. Rock Eng. 57, 2213–2230. doi:10.1007/s00603-023-03673-w
Feng, Y., Yang, W., Wan, J., and Li, H. (2023b). Granular risk assessment of earthquake induced landslide via latent representations of stacked autoencoder. Front. Environ. Sci. 11. doi:10.3389/fenvs.2023.1308808
Gong, B., Liang, Z., and Liu, X. (2022). Nonlinear deformation and failure characteristics of horseshoe-shaped tunnel under varying principal stress direction. Arabian J. Geosciences 15, 475. doi:10.1007/s12517-022-09678-z
Gong, B., Zhao, T., Thusyanthan, I., and Tang, C. (2024). Modelling rock fracturing by a novel implicit continuous to discontinuous method. Comput. Geotechnics 166, 106035. doi:10.1016/j.compgeo.2023.106035
Jing, J., Shi, L., Li, Z., Liu, T., Wei, J., and Li, S. (2006). Mechanism of water-inrush from roof in Huafeng mine. J. China. Univ. Min. Tech. 35.
Kang, H., Li, W., Gao, F., and Yang, J. (2023). Grouting theories and technologies for the reinforcement of fractured rocks surrounding deep roadways. Deep Undergr. Sci. Eng. 2 (1), 2–19. doi:10.1002/dug2.12026
Li, G., Wang, K., Gong, B., Tao, Z., Du, K., and Tang, C. (2021a). A multi-temporal series high-accuracy numerical manifold method for transient thermoelastic fracture problems. Int. J. Solids Struct. 230-231, 111151. doi:10.1016/j.ijsolstr.2021.111151
Li, L., Tu, W., Shi, S., Chen, J., and Zhang, Y. (2016). Mechanism of water inrush in tunnel construction in karst area. Geomatics, Nat. Hazards Risk 7, 35–46. doi:10.1080/19475705.2016.1181342
Li, Q., Ma, D., Zhang, Y., Liu, Y., Ma, Y., and Hu, D. (2021b). Insights into controlling factors of pore structure and hydraulic properties of broken rock mass in a geothermal reservoir. Lithosphere 2021 (Special 5). doi:10.2113/2022/3887832
Li, W., Wang, Y., Ye, Z., Liu, Y. A., and Wang, L. (2024). Development of a mixed reality assisted escape system for underground mine-based on the mine water-inrush accident background. Tunn. Undergr. Space Technol. 143, 105471. doi:10.1016/j.tust.2023.105471
Liu, R., Zhi, G., Yang, S., and Xu, X. (2023). Investigation on mining-induced floor water inrush from column and its control based on microseismic monitoring. Adv. Civ. Eng. 5 (20), 3754079.
Liu, X., Zhang, X., Wang, L., Qu, F., Shao, A., Zhao, L., et al. (2024). Research progress and prospects of intelligent technology in underground mining of hard rock mines. Green Smart Min. Eng. 1 (1), 12–26. doi:10.1016/j.gsme.2024.03.007
Ma, D., Duan, H., and Zhang, J. (2022b). Solid grain migration on hydraulic properties of fault rocks in underground mining tunnel: radial seepage experiments and verification of permeability prediction. Tunn. Undergr. Space Technol. 126, 104525. doi:10.1016/j.tust.2022.104525
Ma, D., Duan, H., Zhang, J., Liu, X., and Li, Z. (2022a). Numerical simulation of water–silt inrush hazard of fault rock: a three-phase flow model. Rock Mech. Rock Eng. 55 (8), 5163–5182. doi:10.1007/s00603-022-02878-9
Ma, K., Sun, X. Y., Tang, C. A., Yuan, F. Z., Wang, S. J., and Chen, T. (2021). Floor water inrush analysis based on mechanical failure characters and microseismic monitoring. Tunn. Undergr. Space Technol. 108, 103698. doi:10.1016/j.tust.2020.103698
Qiu, Q., Zheng, L., Hong, L., Zhang, W., He, H., Zhao, C., et al. (2022). Water inrush mechanism of roof induced by the fault weakening effect in the coal mining. Math. Problems Eng. 2022, 5737738.
Ren, Z., Zhang, C., Wang, Y., Lan, S., and Liu, S. (2023). Stability analysis and grouting treatment of inclined shaft lining structure in water-rich strata: a case study. Geohazard Mech. 1 (4), 308–318. doi:10.1016/j.ghm.2023.11.002
Shen, W. Q. (2024). Effective yield strength of a saturated porous medium with a spheroidal meso-pore and spherical micro-pores. Rock Mech. Bull. 3 (1), 100097. doi:10.1016/j.rockmb.2023.100097
Snoke, J. A. (1987). Stable determination of (Brune) stress drops. Bull. Seismol. Soc. Am. 77 (2), 530–538.
Sun, D., Hou, X., Yang, T., Zhao, Y., Zhang, P., Yang, B., et al. (2022). Calibration of water inrush channel and numerical simulation of water inrush process in coal mine roof. Front. Earth Sci. 10, 931508. doi:10.3389/feart.2022.931508
Tu, W., Li, L., Cheng, S., Chen, D., Yuan, Y., and Chen, Y. (2021). Evolution mechanism, monitoring, and early warning method of water inrush in deep-buried long tunnel. Geofluids 2021, 1–6. doi:10.1155/2021/2023782
Wang, W., Yao, Q., Wang, A., Hudson-Edwards, K. A., Zheng, C., Yan, L., et al. (2023). Study of a damage constitutive model for water-bearing coal measures sedimentary rock with nonlinear deformation during compaction stage. Geohazard Mech. 1 (3), 244–254. doi:10.1016/j.ghm.2023.09.002
Wang, X., Xu, Z., Sun, Y., Zheng, J., Zhang, C., and Duan, Z. (2021). Construction of multi-factor identification model for real-time monitoring and early warning of mine water inrush. Int. J. Min. Sci. Technol. 31 (5), 853–866. doi:10.1016/j.ijmst.2021.07.012
Wang, Y., Chen, Q., Dai, B., and Wang, D. (2024). Guidance and review: advancing mining technology for enhanced production and supply of strategic minerals in China. Green Smart Min. Eng. 1 (1), 2–11. doi:10.1016/j.gsme.2024.03.005
Wei, J., Li, Z., Shi, L., Guan, Y., and Yin, H. (2010). Comprehensive evaluation of water-inrush risk from coal floors. Min. Sci. Technol. 20 (1), 121–125. doi:10.1016/s1674-5264(09)60172-1
Wu, J., Wang, X., Wu, L., Lu, Y. N., and Han, Y. H. (2022). Parametric study of water inrush in a tunnel crossing a fault based on the “three zones” fault structure. KSCE J. Civ. Eng. 26 (8), 3600–3619. doi:10.1007/s12205-022-1310-z
Wyss, M., and Brune, J. N. (1968). Seismic moment, stress, and source dimensions for earthquakes in the California-Nevada region. J. Geophys. Res. 73 (14), 4681–4694. doi:10.1029/jb073i014p04681
Wyss, M., and Brune, J. N. (1971). Regional variations of source properties in southern California estimated from the ratio of short-to long-period amplitudes. Bull. Seismol. Soc. Am. 61 (5), 1153–1167. doi:10.1785/bssa0610051153
Xiang, G., Jiang, T., Yang, Q., Cui, S., Zhu, L., He, Y., et al. (2023). The influence of vertical seismic acceleration on the triggering of landslides constrained by bedding faults under an inertial frame reference: the case of the daguangbao (DGB) landslide. Appl. Sci. 13 (23), 12911. doi:10.3390/app132312911
Yin, H., Wu, Q., Yin, S., Dong, S., Dai, Z., and Soltanian, M. Z. (2022). Predicting mine water inrush accidents based on water level anomalies of borehole groups using long short-term memory and isolation forest. J. Hydrology 616, 128813. doi:10.1016/j.jhydrol.2022.128813
Yin, H., Zhang, G., Wu, Q., Yin, S., Soltanian, M. R., Thanh, H. V., et al. (2023). A deep learning-based data-driven approach for predicting mining water inrush from coal seam floor using micro-seismic monitoring data. IEEE Trans. Geoscience Remote Sens. 61, 1–15. doi:10.1109/tgrs.2023.3300012
Yu, R., Qian, J., Liu, L., Zha, H., and Li, N. (2022). Microseismic precursors of coal mine water inrush characterized by different waveforms manifest as dry to wet fracturing. Int. J. Environ. Res. Public Health 19 (21), 14291. doi:10.3390/ijerph192114291
Zhang, C., Chen, Y., Ren, Z., and Wang, F. (2024). Compaction and seepage characteristics of broken coal and rock masses in coal mining: a review in laboratory tests. Rock Mech. Bull. 3 (2), 100102. doi:10.1016/j.rockmb.2024.100102
Zhang, J. (2005). Investigations of water inrushes from aquifers under coal seams. Int. J. Rock Mech. Min. Sci. 42 (3), 350–360. doi:10.1016/j.ijrmms.2004.11.010
Zhang, S., Guo, W., Li, Y., Sun, W., and Yin, D. (2017). Experimental simulation of fault water inrush channel evolution in a coal mine floor. Mine Water Environ. 36 (3), 443–451. doi:10.1007/s10230-017-0433-9
Keywords: coal mine, water inrush, early warning, microseismic monitoring, periodic pressure
Citation: Zhang S, Wei X, Tang L, Duan W, Gong B, Mu C and Zhang S (2024) Study on the early warning of cracking and water inrush risk of coal mine roof and floor. Front. Earth Sci. 12:1436970. doi: 10.3389/feart.2024.1436970
Received: 22 May 2024; Accepted: 01 July 2024;
Published: 24 July 2024.
Edited by:
Chong Xu, Ministry of Emergency Management, ChinaReviewed by:
Huajin Li, Chengdu University, ChinaCopyright © 2024 Zhang, Wei, Tang, Duan, Gong, Mu and Zhang. This is an open-access article distributed under the terms of the Creative Commons Attribution License (CC BY). The use, distribution or reproduction in other forums is permitted, provided the original author(s) and the copyright owner(s) are credited and that the original publication in this journal is cited, in accordance with accepted academic practice. No use, distribution or reproduction is permitted which does not comply with these terms.
*Correspondence: Bin Gong, YmluLmdvbmdAYnJ1bmVsLmFjLnVr
†These authors have contributed equally to this work
Disclaimer: All claims expressed in this article are solely those of the authors and do not necessarily represent those of their affiliated organizations, or those of the publisher, the editors and the reviewers. Any product that may be evaluated in this article or claim that may be made by its manufacturer is not guaranteed or endorsed by the publisher.
Research integrity at Frontiers
Learn more about the work of our research integrity team to safeguard the quality of each article we publish.