 Dong Ji
 Jing Hou3
 Zhiliang Cheng
 Shuai Wei
- 1College of Civil Engineering and Transport, Weifang University, Weifang, China
- 2Key Laboratory of Near Coastal Engineering, Weifang, China
- 3Qingdao Surveying and Mapping Institute, Qingdao, China
- 4Xiangyang Institute of Surveying and Mapping, Xiangyang, China
The 3D geological model serves as a cornerstone, establishing the essential foundation and prerequisite for numerical simulations, analytical assessments, and evaluative procedures that are integral to the disciplines of geotechnical and geological engineering. The task of integrating vast quantities of multi-source, heterogeneous modeling data, the absence of stratigraphic division standards to meet varying precision requirements, and addressing the application demands of 3D geological models beyond the geological domain, pose significant challenges to the endeavor of 3D geological modeling. This is especially true for the construction of large-scale, high-precision 3D geological models at the urban level. Our research introduces a methodology for 3D geological modelling, with a particular focus on the dual-weighted interpolation technique for the integration of land-sea data and the establishment of a three-tiered coding system for bedrock layers. Focusing on Qingdao, a city characterized by its bedrock geology and situated along the eastern coastal region of China, our proposed method has successfully catalyzed the creation of models across four distinct scales: a comprehensive city-wide model covering an area of 11,282 square kilometers, five general models, two demonstration models, and five refined models. Further application cases have demonstrated that these models are not only capable of meeting the requirements of geological and geotechnical engineering across various scenarios, but also exhibit excellent interoperability and significant application potential when integrated with Building Information Modeling (BIM), Geographic Information Systems (GIS), and Internet of Things (IoT) technologies. The outcomes of this study are significant for the theoretical development and technological advancement of 3D geological modeling, and can also bring inspiration and reference to the work of 3D geological modeling in other areas.
1 Introduction
The materials dealing with geotechnical engineering, such as soil, rock, and groundwater, exhibit a significant level of inhomogeneity and uncertainty (Kabeta et al., 2023; Zhang J. et al., 2023; Jiang et al., 2024). Traditional theories, such as the Safety Factor Method, Limit Equilibrium Method, and Allowable Stress Design Methods, often encounter challenges in accurately simulating and predicting geotechnical engineering issues. These challenges frequently result in outcomes that deviate from anticipated results (Otake and Honjo, 2022). In recent years, the application of artificial intelligence (AI), Internet of Things (IoT), modern communication, big data and technologies in the field of geotechnical engineering has been developing, which greatly improves the risk perception and crisis management ability of geotechnical engineering (Zhang J. W. et al., 2020; Chen et al., 2022; Kovačević et al., 2022; Zhang et al., 2022; Niu et al., 2024). Geotechnical engineering includes various stages, such as planning, design, construction, operation, maintenance and risk assessment. Each of these domains offers integration potential with the aforementioned novel technologies, thereby presenting fresh avenues for the advancement of traditional geotechnical engineering practices (Kovačević et al., 2018; Yin et al., 2020; Adewoyin et al., 2021). At the same time, this brings new challenges for the sustainable development of geotechnical engineering.
With the rapid advancement of geotechnical engineering information technology, the establishment of reliable 3D geological models has become crucial for data storage and visualization (Woldesenbet et al., 2023). A reliable geological model allows engineers to gain a detailed understanding of unfavorable geological conditions and the three-dimensional spatial distribution characteristics of soil layers. Moreover, it facilitates subsequent planning, design, and construction activities. Additionally, geological models are essential for numerical simulations in geotechnical engineering; their reliability directly impacts the final analysis and calculation results (Cao et al., 2023). As the world increasingly embraces advancements in intelligence and digitalization, the significance and status of 3D geological modeling technology continue to rise, underscoring its vital role in the sustainable development of modern geotechnical engineering (Augarde et al., 2021).
The fundamental concept of 3D geological modeling integrates various technologies for an innovative approach to geological analysis and research, initially introduced by Houlding (1994). Key studies in this field include She et al. (2019), who enhanced 3D city modeling with an effective methodology for building label placement, and Hou et al. (2016), who constructed a 3D geological model using MapGIS software, emphasizing the importance of geological feature incorporation in Urban Underground Space assessments. He et al. (2023) developed a practical 3D geological model for urban Quaternary sedimentary strata, contributing to a comprehensive evaluation of subsurface conditions in Beijing’s Tongzhou District. Madsen et al. (2022) introduced GDM, a probabilistic 3D geological modeling framework that integrates uncertain geological interpretations, tested in Denmark’s Horsens region, demonstrating its effectiveness in uncertainty communication for decision-making.
Although the above studies have greatly contributed to the development of theory and technology for 3D geological modelling and geotechnical numerical simulation, constructing 3D geological models at various scales in urban environments remains challenging, especially in cases with complex geological conditions, integration of land and sea areas and scattered data sources. For the construction of 3D geological models at the regional level, modelling relies on data that are often multi-sourced and non-uniform, which makes the uniformity of stratigraphic codes a challenging task (Tognoli et al., 2024). In specific, the standardization of rock layer is particularly complex and requires the consideration of multiple factors. Furthermore, numerous studies have made beneficial progress in the theoretical methods and implementation processes of 3D geological modeling, but there has been relatively limited focus on the applications of these models. While many cases have demonstrated three-dimensional visualization and limited data statistics and presentation of the models, there is an urgent need to enrich the research on deep-level and multi-domain applications of the constructed models. Especially on the integrated application of 3D geological models with Geographic Information System (GIS), Building Information Modeling (BIM) and Internet of Things (IoT) technologies.
The primary objective of this study is to develop an innovative approach for constructing multi-scale urban geological models that integrate heterogeneous data sources. This methodology is specifically tailored to the bedrock-dominated geological conditions and environmental characteristics of Qingdao City, China.
Qingdao City, an important coastal city in the eastern China, exhibits typical geological characteristics of a coastal bedrock region, encompassing distinct geological features of both land and sea (Li et al., 2018; Ning et al., 2019). Multiple tectonic events have given rise to various geological strata and complicated the emplacement mechanisms of intrusive rocks, resulting in significant differences in geological information among different landforms. Over decades of extensive urbanization and engineering construction, a wealth of data has been accumulated from engineering geology, geotechnical investigations, drilling, and geophysical exploration (Su et al., 2019; Lu et al., 2022; Zhu et al., 2022; Qiao et al., 2024). Since 2019, Qingdao City has initiated an urban geological survey (Dou et al., 2021), making the construction of city-scale 3D geological models that meet diverse technical and application requirements a focal point of the initiative. However, there have been no suitable geotechnical layer criteria and modeling methods that can effectively integrate the diverse requirements of engineering applications and geological investigations in the past.
Our research at Qingdao directly addresses the challenges encountered in large-scale and multi-precision requirements for 3D geological modeling. These include the processing of multi-source heterogeneous modeling data and the absence of stratigraphic division standards that meet various modeling precision requirements. In China and indeed in other parts of the world, urban-level 3D geological modeling efforts are likely to confront similar challenges. We have introduced a novel modeling method that encompasses a dual-weighted interpolation technique for land-sea data integration, coupled with a three-tiered coding system for bedrock layers. This methodology has successfully facilitated the construction of models across four scales in Qingdao City, including a comprehensive city-wide model covering an area of 11,282 square kilometers, five general models, two demonstration models, and five refined models. The construction of high-precision urban-scale models in our study has filled a significant gap in the local field of 3D geological modeling. The novelty of the models we have developed extends beyond their precision; it also includes their effective integration and application with technologies such as BIM, GIS, and IoT. These integrations have been tested and supported by various practical case studies. Our work not only underscores the pivotal role of 3D geological models as a digital foundation for sustainable urban development and the efficient utilization of urban underground space resources, but it also provides valuable insights that can contribute to the advancement of 3D modeling techniques.
2 Study area
2.1 Location and general situation
The study area encompasses the entire city of Qingdao, which is located in longitude 119°30′∼121°00′E, latitude 35°40′∼37°09′N, southeast of the Shandong Peninsula, China, on the west coast of the Pacific Ocean, and along the shore of the Yellow Sea. As illustrated in Figure 1, the city covers a total area of 11,282 square kilometres, with seven Districts of Shinan, Shibei, Licang, Laoshan, Chengyang, Huangdao, and Jimo, as well as three county-level Cities, namely, Jiaozhou, Pingdu, and Laixi. By the end of 2022, the resident population of Qingdao is about 10,342,100 people. Qingdao holds a significant economic status in China, recognized as a major coastal city and an important hub for trade, industry, and tourism (Cong et al., 2023; Zhang H. et al., 2023). With a strong focus on innovation and technology, Qingdao has emerged as a leading center for manufacturing, particularly in fields such as automotive, electronics, and petrochemicals (Lu et al., 2022; Li and Pan, 2023; Pan et al., 2023). Qingdao achieved a gross domestic product (GDP) of 149.2 billion yuan in 2022, ranking 13th in China’s city GDP rankings.
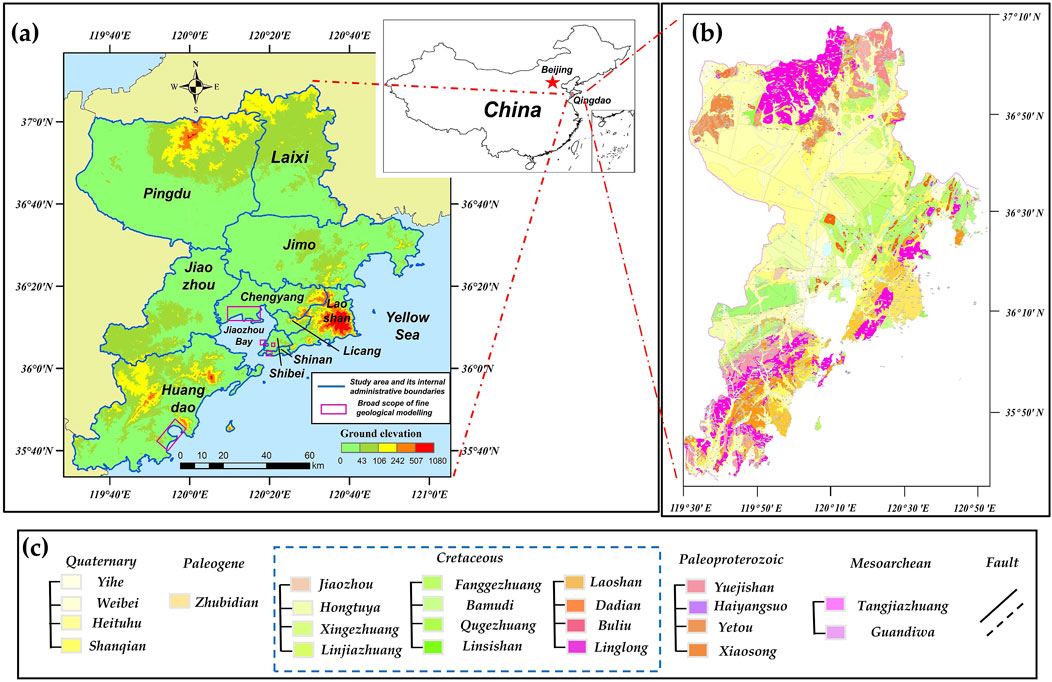
Figure 1. Location and geological maps of study area: (A) Location map of Qingdao City, China; (B) Geological map of Qingdao City, China; (C) Legend illustration of geological map.
Qingdao experiences a temperate continental climate, characterized by distinct four seasons (Shi et al., 2011). Summers are hot and humid, while winters are relatively cool with mean air temperature of 12.1°C and a multi-year average relative humidity of 72%. Spring and autumn offer pleasant weather, making them ideal times to visit. The city receives moderate rainfall throughout the year, with the wettest months being July and August. The average annual rainfall over the last 10 years is 698.9 mm, with the majority of rainfall concentrated in July and August. The average monthly rainfall during these 2 months amounts to 391.5 mm in the last 5 years. The average evaporation in recent years is approximately 1,014 mm. Overall, Qingdao’s climate is considered quite comfortable, attracting visitors from around the world (Von Storch et al., 2019; Zhu et al., 2023).
There are 224 rivers of different sizes in Qingdao, 33 of which have a watershed area of more than 100 km2. These rivers can be categorized into three major water systems: the Dagu River, the North Jialai River, and the coastal rivers (Gu et al., 2022). The main rivers flowing through Qingdao include the Dagu river, the Yang river, the Liugong river, and the Baihe river. These rivers originate from the surrounding mountains and hills, draining into the Yellow sea. In addition to these rivers, Qingdao also boasts a number of reservoirs and lakes, including the Chengyang reservoir and the Jimo lake, which are crucial sources of freshwater for the city.
2.2 Geological conditions
Qingdao exhibits a diverse topography, encompassing both mountainous and coastal regions. The city’s eastern region is generally higher in elevation, transitioning to lower altitudes in the west. The landscape rises from north to south, with the central area being relatively flat. The highest point in Qingdao is the prominent peak of Laoshan, located in the southeast, which stands as a majestic landmark in the city’s terrain (Wang X. et al., 2024). It contains low and medium mountains, hills, and three major types of plains: denudation plains, alluvial floodplains, and alluvial seafloor plains. These diverse landforms correspond to three primary geomorphological units: tectonic denudation landforms (comprising low mountains, hills, and denudation remnants), foothill slope accretionary landforms (featuring quasi-plains, accretionary slopes, and depressions), and fluvial erosion accretionary landforms.
The Quaternary strata in Qingdao are primarily distributed in valleys, river valleys, along both banks, and coastal zones. Typically, their maximum thickness does not exceed 30 m, and they were formed after the mid-Late Pleistocene, with both terrestrial and marine facies. The main genetic types of these strata include alluvial-diluvial deposits, terrestrial marsh deposits, marine coastal marsh deposits, and artificial accumulations. According to the local experience of Quaternary stratigraphy, the Quaternary stratigraphy in Qingdao can be divided into 14 layers. Figure 2 shows a typical geological profile of Qingdao area.
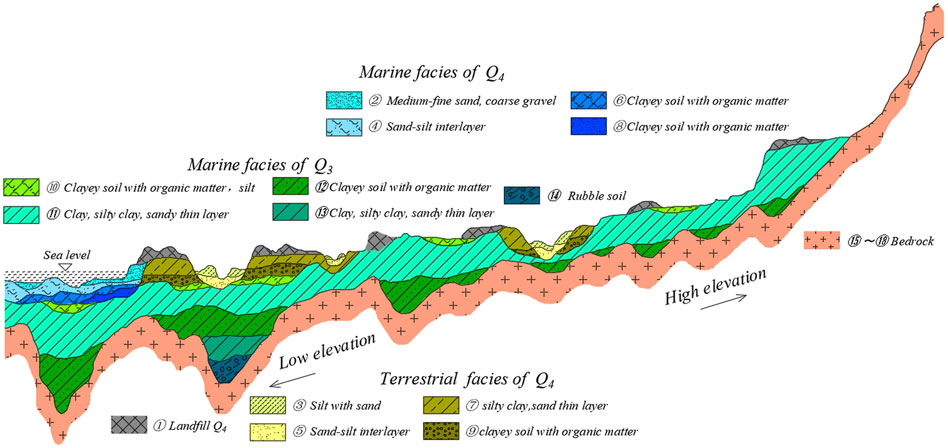
Figure 2. Typical geological profile of study area. Note: The stratigraphy and topographic data depicted in this figure originate from the Qingdao Urban Geological Survey project. The stratum coding and visual elements adhere to the local standards for Quaternary division, and the figure was created using EVS software version 9.5.2 and AutoCAD software version 2018.
The bedrock of Qingdao can be generally classified into three major categories: sedimentary rocks, metamorphic rocks, and igneous rocks. Sedimentary rocks are primarily composed of clastic rocks and volcanic rocks from the Cretaceous Wangshiqun, Qingshanqun, and Laiyangqun formations. Metamorphic rocks are restricted to the Jiaonan Hongshiya area and are composed primarily of gneiss, granulite, and amphibolite from the Yetou Formation of the Jingshan Group in the Paleoproterozoic era. Igneous rocks are the dominant bedrock type in the southern eight districts and cities of Qingdao. They are further categorized based on their formation ages, ranging from younger to older: the Cenozoic Qingshan-age shallow intrusive dikes, Mesozoic Yanshan-age subvolcanic rocks, Mesozoic Yanshan late-age shallow dikes, and late-Yanshan Mesozoic (γ53) intrusive rocks (Wu et al., 2018; Yan et al., 2021).
3 Materials and methodology
The proposed methodology in current study takes 3D geological models at different scales within Qingdao as study case, mainly consists of five steps as shown in Figure 3: full-factor data collection, data pre-processing, analysis and standardization, model creation and optimization, model export and assignment, model application.
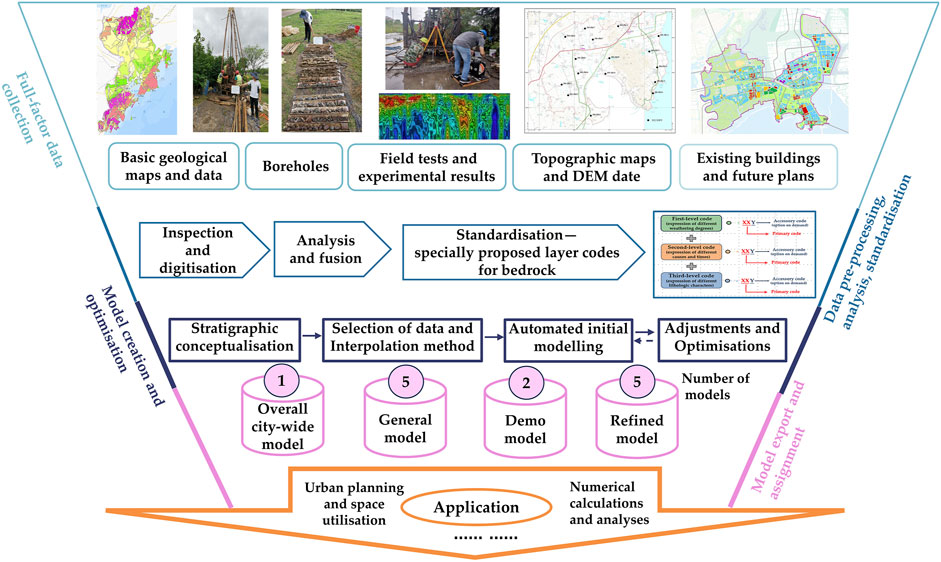
Figure 3. Workflow of modeling and application.
3.1 Data sources and pre-processing
3.1.1 Scope and requirement of data collection
In this case, the geological data sources relied upon for 3D geological modeling are diverse and extensive, encompassing terrain, drilling, geological section maps, geophysical and geochemical exploration interpretation data, stratigraphic boundary isochore maps, geological maps, various specialized geological graphics, and experimental and observational data. The formats of these data span a range of types, including raw basic fields, graphical charts, text reports, imagery, and models. Due to the extensive volume and complex format of the data required for urban-scale 3D geological modeling, it is necessary to conduct a formal review and screening process prior to modeling (Andersen et al., 2020). The overall modeling data requirements are summarized in Table 1.
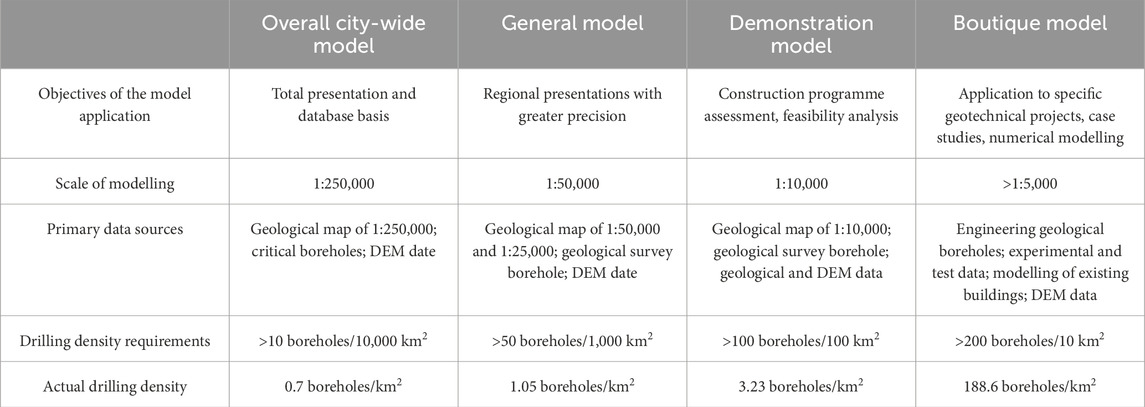
Table 1. Modelling process, modelling methods and technical requirements for 3D geological models at different scales.
Furthermore, the input data utilized during the modeling process should aim to satisfy the following conditions to the fullest extent possible. Firstly, as far as possible, the data should fully express the geological information and possess a high degree of timeliness and quality, obtained from geological or geotechnical engineering projects completed by highly qualified and technically strong units. Secondly, the priority of outcome data should be higher than that of raw data, especially for geological surveys and engineering geological mapping materials. Finally, attention should be paid to the collection and utilization of geological maps, particularly geological sections and boundaries, as well as corresponding descriptive data. These data can serve as substitutes for speculative or interpolated data, thereby enhancing the accuracy and reliability of the model.
To enhance the application potential of urban 3D geological modeling, it is imperative to comprehensively represent both existing and future aboveground and underground spatial information within the city model. Our work team also focused on collecting data on existing underground spaces and the latest construction plans for certain regions. The specific content included spatial distribution, type, construction time, material, ownership, purpose, and other relevant information. The above information contains a considerable amount of vector data, achieved by the instrumentality of BIM and City Information Modeling (CIM) technologies locally in recent years (Cui et al., 2021). More than 4,000 boreholes, 30 base geological maps, 200 sets of engineering investigation reports (including drawings and test data), and 40 existing and planned subsurface space data were collected for the modelling work in the end. Primary types of data collected are vector graphics and structured data, mainly sourced from government departments and authoritative professional institutions. These data include historical geological and geotechnical work outcomes conducted within Qingdao City, as well as the most recent urban geological survey results.
3.1.2 Date pre-processing
It is crucial to conduct quality checks, screenings, and range clipping after the completion of the collection of various types of data. Among them, data consistency and logic checking and correction are the key concerns; they should be validated and adjusted according to specific principles when there are contradictions in the collected data. The topological relationship is ensured by taking the borehole and profile data as the basic foundation and adjusting other data sources by manual analysis. This is a reliable principle for dealing with data conflicts in this work.
Some materials are only available in paper drawings and image data owing to preservation issues. It is necessary to digitize, vectorize, and geometrically correct these materials. They should be organized based on their nature and source to form electronic tables or text files. For fundamental geological maps, thematic geological maps, geological section maps, borehole columnar maps, geophysical interpretation maps, and other data with vector format files, three-dimensional geometric correction should be performed. This involves positioning the two-dimensional section maps in a three-dimensional coordinate system and processing stratigraphic consistency for intersecting sections. Effective geological boundaries and descriptive data should be extracted.
3.2 Double-weighted interpolation method for land-sea data fusion
Due to the existence of Jiaozhou Bay, the overall geological model at the city level in this study case consists of two parts: the land area and the marine area. In previous work, the reference benchmarks for land and marine surveys in Qingdao City were inconsistent, and the coordinate reference frameworks were not unified, which hindered the integrated collation of land and marine data. To properly solve the problems of non-uniformity of land and sea datums and non-convergence of waterborne and underwater data results are the prerequisites and difficulties of this modelling work.
In order to solve the above difficulties, we proposed and applied a double-weighted interpolation fitting method for land-sea data fusion, which can satisfy the requirements of smooth transition of land-sea articulation and no degradation of data accuracy. In this study, two data processing methods were employed: the proposed double-weighted interpolation fitting method and the discrete point curve fitting method. These methods facilitated the unification of modeling data for both land and marine areas. As shown in Figure 4, for land-sea spatial coordinate data without overlapping regions (Figure 4A), discrete points near the adjacent areas of land and sea were interpolated to form a continuous surface. When there are overlapping regions in the land-sea spatial coordinate data, the double-weighted interpolation approach was employed (Figure 4B). Mainly terrain data, including but not limited to, data on topography, geological points, geological lines, and boreholes, were effectively processed.
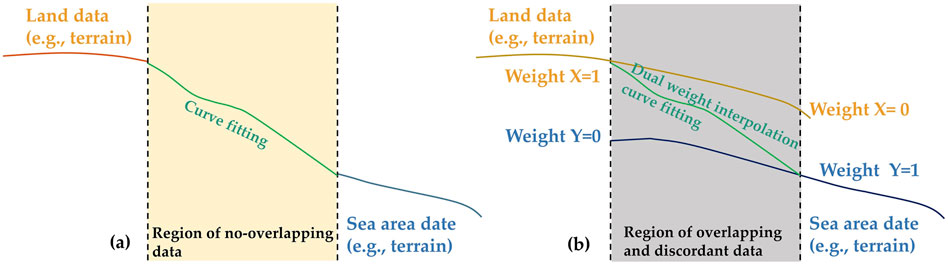
Figure 4. Integration of land and ocean modelling data based on dual-weighted interpolation fitting method: (A) there is only single data source on land or sea; (B) there are overlaps and inconsistencies between terrestrial and marine data sources.
3.3 Bedrock layer codes at three levels
In geological reports, it is common to indicate the distribution of different strata by numbering them sequentially from top to bottom. Each stratigraphic code is usually represented by a specific combination of 1 or 2 digits plus a letter, and these digits or letters are usually assigned based on stratigraphic location, age, lithology, lithofacies, tectonic type, and other characteristics. The classification criteria for strata in engineering boreholes and other materials should be consistent or similar, which is a fundamental prerequisite for implementing 3D geological modeling. As early as 2005, the construction authority of Qingdao City issued specific requirements for the classification criteria of the Quaternary soil strata within the city, including the division and numbering of strata (Layers 1 to 14 in Figure 2). However, the aforementioned standards lack a scientific classification of rock strata, and the single-digit numbering system only provides a limited indication of the degree of weathering of a particular rock stratum.
The lack of valid classification criteria has led to confusion in the classification of rock layers in Qingdao. For instance, in the engineering geological survey boreholes collected for this modelling exercise, the code for layer number ⑯ and ⑯1 corresponds to 176 and 160 different types of strongly weathered rocks. Therefore, it is imperative to research and formulate a scientific and practical classification standard for rock stratigraphy, which can be used for standardizing strata and subsequent modeling work.
In the current study, a three-layer bedrock coded classification system is proposed to solve the above problems. The proposed scheme is not only applicable to geological surveys and geotechnical engineering investigations, but can also be directly utilized for the standardization of strata in 3D geological modeling. As shown in Figure 5, this scheme classifies and codes bedrock based on three tiers: degree of weathering, caused and times, and lithologic characters. The coding system employs a three-digit format “XXY-XXY-XXY” using Arabic numerals, where the first two digits “XX” represent the primary code and the third digit “Y” represents the accessory code. Furthermore, the primary code is a mandatory component, while the accessory code is optional. When the auxiliary code is not required, it can be directly omitted, resulting in a coding format of “XX-XX-XX”. There is no restriction on the use of the auxiliary code Y, which can be added one to three digits as required. The specific classifications for the first-level, second-level, and third-level codes are detailed in Tables 2–4, respectively. Due to space limitations, Tables 3, 4 only list a subset of the codes.
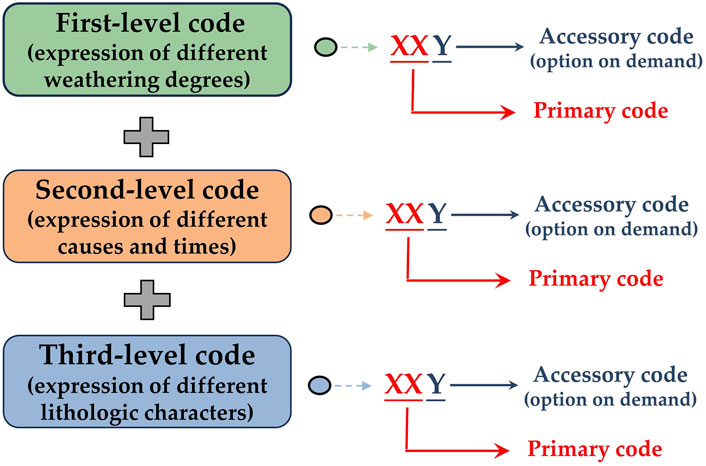
Figure 5. Schema for division of bedrock stratigraphic sequence.
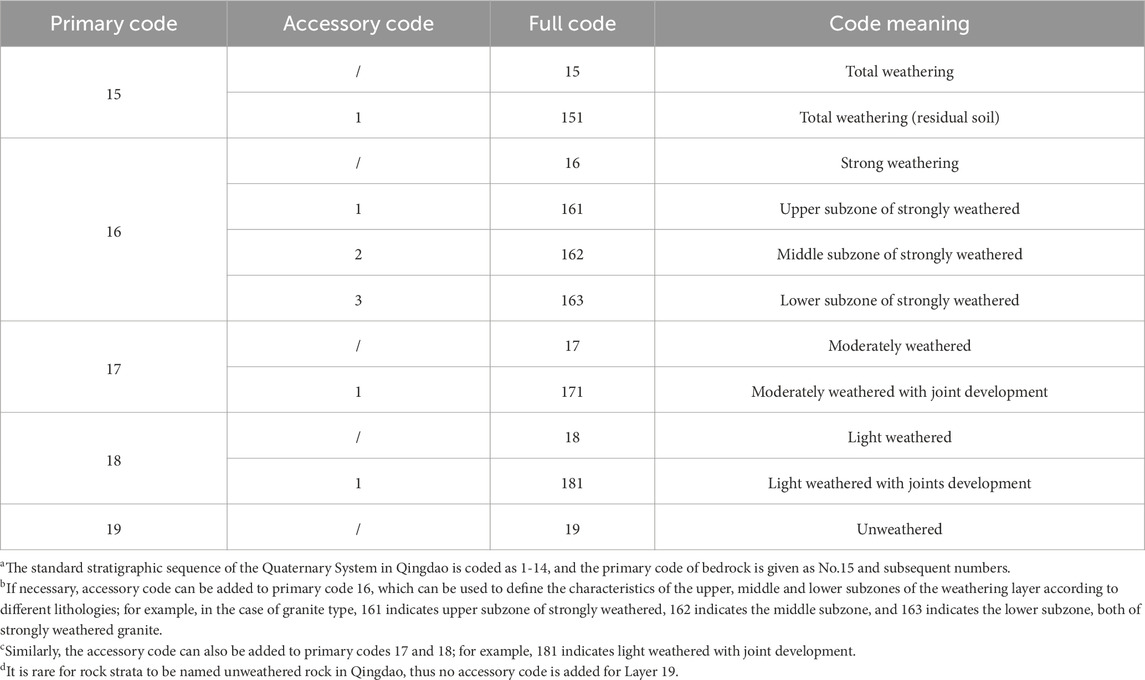
Table 2. Level 1 codes (expression of different degrees of weathering).
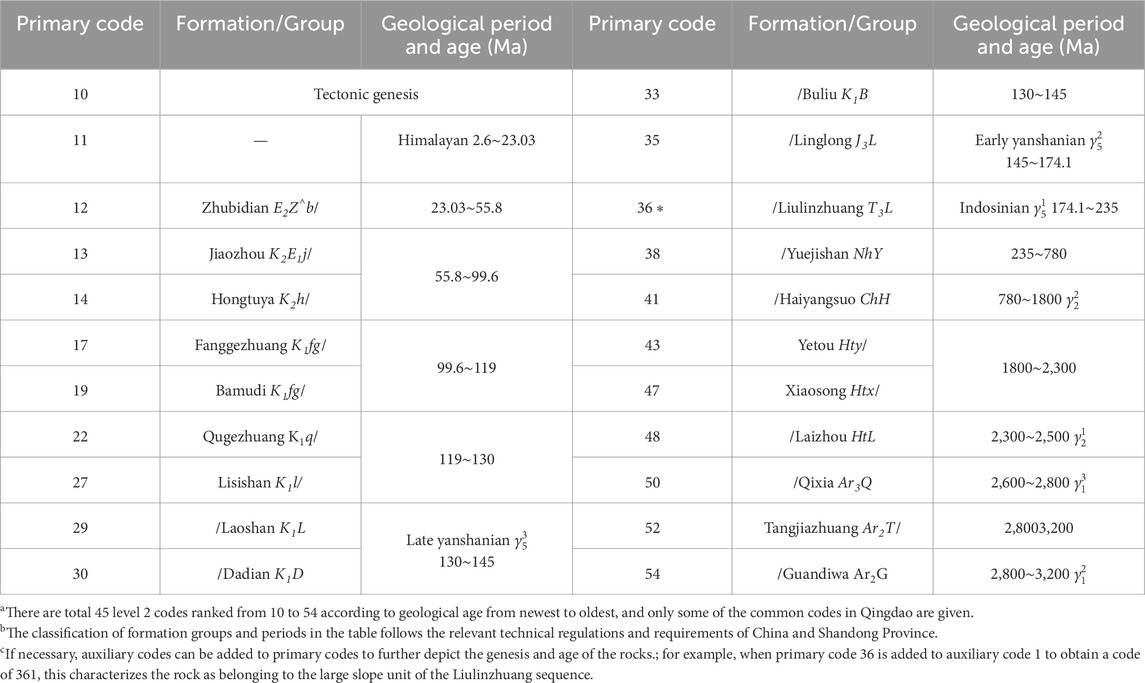
Table 3. Part of level 2 codes (expression of different causes and times).
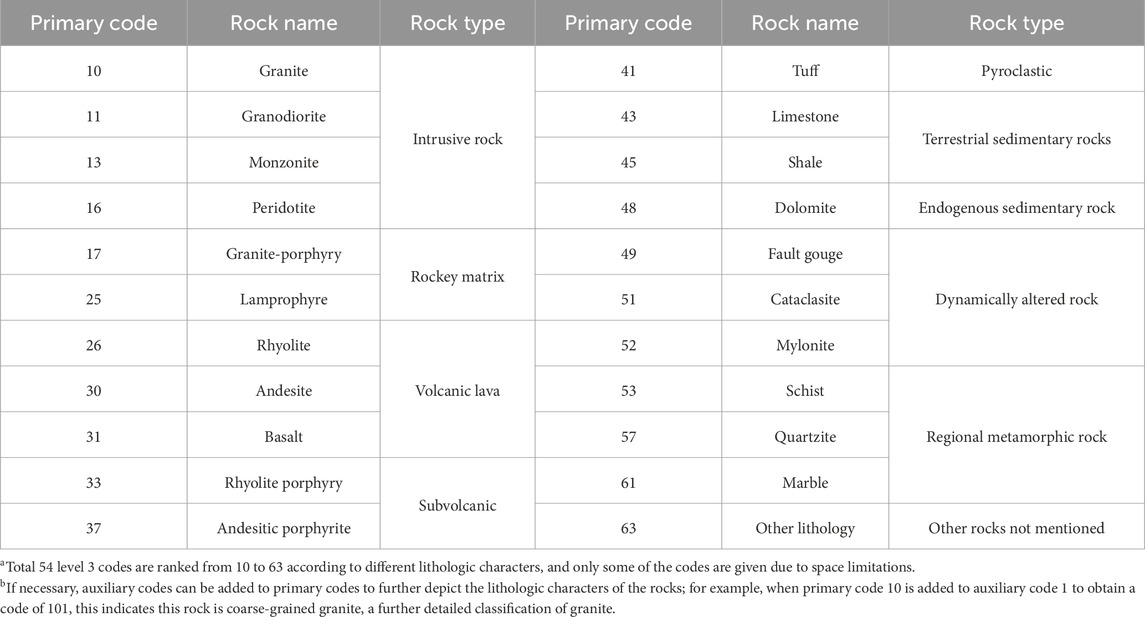
Table 4. Part of level 3 codes (expression of different lithologic characters).
3.4 Primary modelling software
Earth Volumetric Studio (EVS) V9.5.2 was primarily utilized to create the 3D geological model in this study. EVS is a cutting-edge geological modeling software that offers a comprehensive suite of tools and features designed to handle a wide range of geological data types, enabling users to create accurate and insightful 3D models of subsurface geology. One of the key strengths of EVS is its ability to integrate and process vast amounts of geospatial data, including seismic surveys, well logs, geological maps, and more. This data integration capability allows users to build comprehensive models that capture the intricate details of subsurface structures and properties.
Beyond basic visualization, EVS also offers advanced modeling capabilities. It allows users to create complex geological models by combining multiple data sets and applying a range of interpolation and modeling algorithms. These models can then be used for a variety of applications, including resource assessment, risk analysis, and reservoir characterization. The software’s user-friendly interface and intuitive workflow make it accessible to a wide range of users, from geoscientists and engineers to analysts and decision-makers. EVS’s powerful yet easy-to-use features have made it a popular choice for geological modeling and visualization in a wide range of industries, including geotechnical engineering, oil and gas, mining, and environmental sciences.
3.5 Spatial interpolation methods
EVS offers a diverse array of spatial interpolation methods tailored for fitting and interpolating geological horizons. The two most commonly used methods in this modelling work were Kriging and Nearest neighbor method.
3.5.1 Kriging
The Kriging algorithm, also known as the optimal spatial autocorrelation interpolation method, is named after the South African mining engineer (Krige, 1952). This algorithm assigns different weights to the attributes of each sample based on their spatial locations and the degree of correlation among them. These weighted averages are then used to estimate the attributes of the points to be interpolated. The Kriging algorithm has found widespread applications in fields such as groundwater modeling, soil mapping, and other geological studies, serving as an effective method for geostatistical gridding.
The theory can be formulated by considering an intrinsic random function denoted as
where
The purpose of Kriging interpolation is to find a set of weighting coefficients
where
In the stratigraphic interface interpolation process, a specific stratum is selected as the focus of investigation. The thickness data of this stratum, extracted from all available boreholes, constitutes as the sample dataset. The existing borehole locations are then rasterized, and thickness information for the geological rock layer is interpolated based on the Kriging principle. This interpolation process constructs the stratum’s attributes for each raster point, ultimately revealing the stratum’s boundary. Furthermore, a multiple variogram function approach is employed to accurately characterize the potential higher variability properties between distinct geological units in this study. This comprehensive approach ensures accurate and reliable interpolation of stratigraphic interfaces.
3.5.2 Nearest neighbor
The nearest neighbor interpolation method, also known as the Thiessen polygon method, was proposed by the Dutch meteorologist A. H. Thiessen. It was initially employed to derive the average rainfall in a region with the help of rainfall data from discretely distributed weather stations. The principle of the method is to connect any sample point
where
where
where
The nearest neighbor method of interpolation is simple and efficient, and has been developed into one of several commonly used spatial interpolation methods. It is commonly employed for rapid interpolation in the estimation of mineral resource reserves, geospatial analysis, among others (Ben Alaya et al., 2017; Caamaño-Carrillo et al., 2024).
3.6 Unified correction and connection method of stratigraphic sequence with complex inversion
During the construction of 3D geological models, the traditional stratum connection method fails to account for stratum corresponding to adjacent boreholes due to complex geological structure movements resulting in stratum inversion, folding, and jointing. This omission leads to errors in the construction of the 3D model, which is particularly significant in this Qingdao modeling case.
Addressing the identified challenges, this study used an approach for addressing complex stratigraphic sequences and developed unified revision and connection methodology (Hua et al., 2023). This approach incorporates a logical recursive framework for harmonizing stratigraphic sequences. It leverages stratigraphic mathematical discriminant rules for interpolation, which is based on reverse calculations of zero-thickness layer insertions. It enables the alignment of drilling stratigraphic sequences with revised standard stratigraphic sequences, addressing issues such as borehole inversions, losses, and repetitions.
Stratigraphic inversion is the anomalous sequence of older rock layers on top and new rock layers on the bottom due to tectonic movements. The processing flow for applying the method used in this paper is shown in Figure 6. Using the method described in this study, inverted strata will be treated as anomalous layers, and zero-thickness layers will be inserted at corresponding positions in surrounding boreholes to connect with the inverted strata. Figure 6A shows the stratigraphic inversion in Borehole II relative to Boreholes I and III, and stratum No.3 in Borehole II was determined to be a peculiar stratum by the methodology used in this paper. Zero-thickness layer 3′was automatically inserted at the interface of horizons B and C from borehole No.1 to borehole No.3, completing the unification of stratigraphic sequence, as shown in Figure 6B. The top and bottom plates of all drilling strata are connected without considering the stratigraphic pinch-out locations, Figure 6C illustrates the final processed results. This method is capable of connecting inverted or missing strata in a manner that adheres to the general rules of manual connection, and it maintains a high degree of consistency with actual geological conditions.
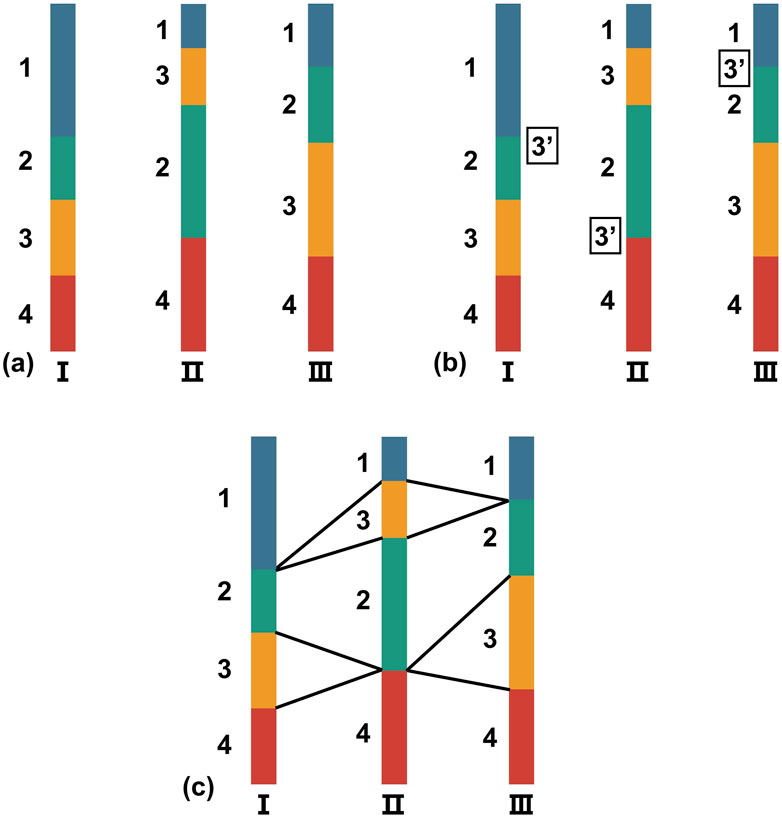
Figure 6. Processing of stratigraphic inversion boreholes: (A) boreholes for inverted strata; (B) identification and processing of layers with thickness of 0; (C) results of processed stratigraphic linkages.
4 Results
4.1 Stratigraphic standardisation
Qingdao is rich in rock types, including intrusive rocks, sedimentary rocks, and metamorphic rocks. Additionally, due to the characteristics of mountainous and hilly areas and the deep burial of bedrock, most of the drilling data used in this modeling work have exposed the bedrock layer. This means that there is a significant amount of work required for inspection, standardization, and analysis of the rock stratigraphy, and it is necessary to select a certain number of samples to pre-evaluate the applicability of the proposed layer code of bedrocks (Zhang X. et al., 2020; He et al., 2023).
We selected 100 deep boreholes with exposed rock thicknesses of no less than 50 m and standardized the rock stratigraphy according to the new coding standards. The resulting sample classification is shown in Table 5. After manual inspection, it meets the logical requirements of geology and effectively resolves the issue of one code corresponding to multiple rock stratifications in the original coding standards. Finally, the classification standard was applied to the generalization of model strata at different scales in this modeling work. For the overall city-wide model, the standardization of 126 rock layers was completed. For the general model, demonstration area model, and boutique model, the standardization of an average of 35, 24, and 11 rock layers was achieved, respectively. Due to the large number of stratum generalizations in the city-wide model, we ignored and merged part of rock codes from practical perspective. Specifically, we ignored the third-level primary codes and all levels of accessory codes, and merged the second-level codes based on the group of rocks. For example, second level codes of 21–27, which all belong to the Laiyang group, were merged as 21; thus second-level code 21 were used to represent all rocks of the Laiyang group.
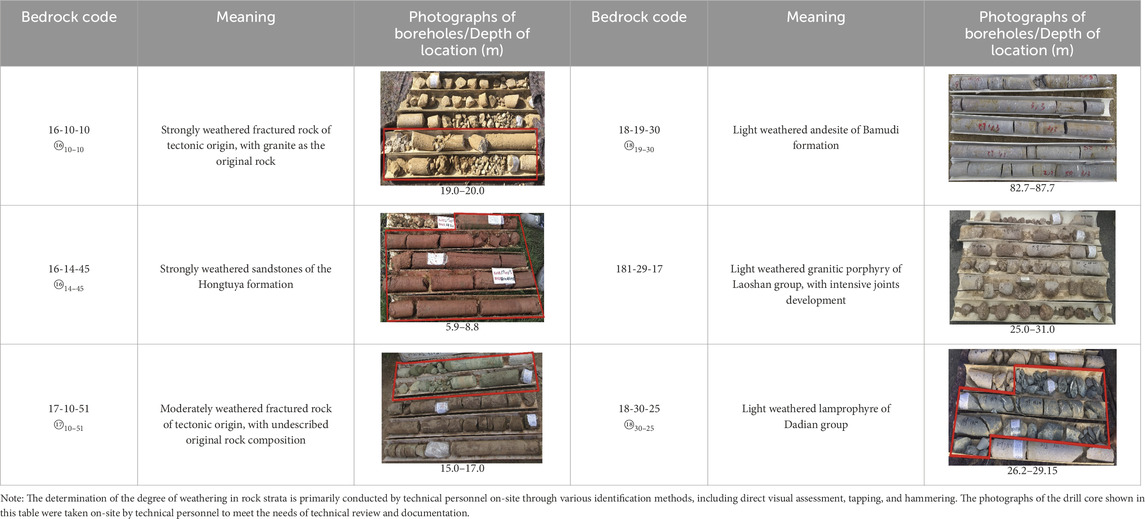
Table 5. Example results of bedrock coding and photographs of drill core.
In 2023, the rock standards proposed by our research were officially approved and implemented as technical specifications for Qingdao City. This technical specification is not only applicable to 3D geological modeling work, but also to the on-site survey work of local geotechnical engineering, engineering geological, environ-mental geological, hydrogeological, and engineering geological. Additionally, it serves as a standard for recording original geological stratigraphy data using a bedrock layer code. The adoption of the new layer coding standard in the field raw data recording is conducive to reducing the workload of stratigraphic standardization in modelling; however, as the new standard is more complex compared to old one, the direct application of the layer code standard to the field practice of engineering survey have resulted in an increase in the field workload, in particular, the problem of determining the causes and times of the rocks. To enhance the utility of this standard for technical personnel, the subsequent phase will focus on the development of specialized index maps and complementary software tools. This initiative aims to augment operational efficiency and streamline the application of the standard in practice. The increasing promotion and implementation of the three-layer bedrock coded classification system locally has resulted in more standardized field recording of original geological data. This will facilitate the reduction of stratum simplification and merging due to inconsistent stratification standards. In the future, we will have the opportunity to create 3D geological models with a broader scope and higher precision, freeing from the confusion caused by chaotic and inconsistent original geological records.
4.2 Structural model results
After the uniform of modelling standards and integration of terrestrial and marine data, a comprehensive 3D geological model for the entire territory of Qingdao City was first established in this work. This model serves as the data foundation for the city’s geological infrastructure, macroscopically portraying Qingdao’s terrain and geomorphic features, particularly its coastal bedrock geology. As shown in Figure 7A, it clearly reveals the major geological structures that control the tectonic units of Qingdao City. Data including 30-m resolution DEM, geological maps at scales of 1:100,000 to 1:250,000, 72 geological attitude points, and 7,967 information points were primarily utilized during the modeling process. The stratigraphic division of the Quaternary and bedrock strata was conducted with a degree of merging and simplification based on the methods outlined in Section 3.4. Specifically, the Quaternary strata were classified into groups, sedimentary rock strata were grouped by formations, and other rock types were categorized by periods. Manual methods were employed to further verify and constrain the spatial distribution of stratigraphic interfaces and fault zones after the initial computer-generated model. The model provides a clear expression and attribute assignment of geological information within a vertical depth of 200 m, including the depiction of band-shaped geological features with a plane length exceeding 3 km and areal geological information encompassing an area greater than 5 square kilometers.
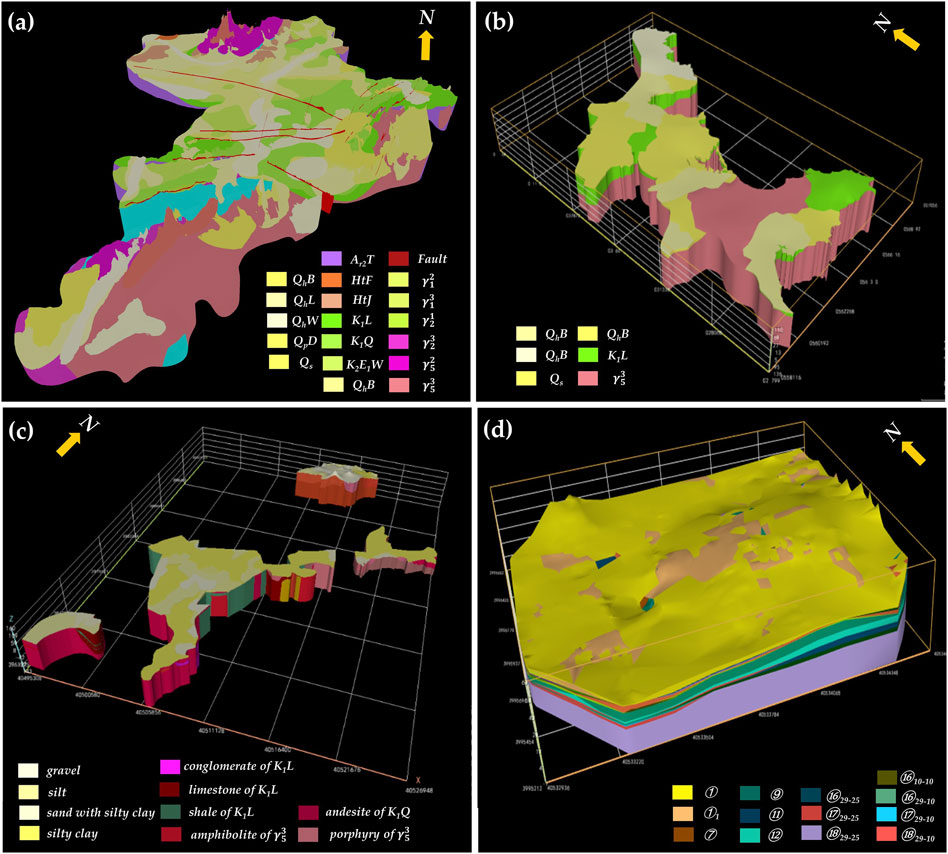
Figure 7. Three-dimensional geological structure models of Qingdao with different accuracies: (A) overall city-wide model; (B) general model of Langu District; (C) demonstration model of focus areas in West Coast District; (D) central business in Shibei District.
Five general-level geological models were further constructed based on the establishment of the entire city-wide model, which were mainly divided on administrative districts. The construction of the model primarily leveraged 30-m resolution DEM, geological maps with scales ranging from 1:100,000 to 1:50,000, and approximately 1,300 various geological borehole data. The models were primarily created using interpolation algorithms outlined in Section 3.6, and was further refined and modified with the assistance of solid editing tools. Figure 7B illustrates the completed model of Langu District, which comprehensively depicts band-shaped geological information with a plane length exceeding 2 km and areal geological information encompassing an area greater than 1 square kilometer.
The Demonstration model primarily relies on 5000-scale topographic survey maps, 10,000-scale geological maps, and engineering geological drilling data to complete its creation. Concurrent with structural modeling, comprehensive hybrid modeling is also conducted by integrating attribute-based data. This involves interpolating spatial attribute data within the constraints of boundaries and grids established by the structural model. The expression of band-shaped geological information with a plane length exceeding 1 km and areal geological information encompassing an area greater than 0.25 km2 is supported in the demonstration model. Depending on the requirements for stratigraphic division, the Quaternary system and bedrock can be categorized based on lithological characteristics or the three-level coding outlined in Section 3.4. Figure 7C presents the modeling outcomes of the focus areas in the West Coast District of Qingdao. The attribute outputs of this model primarily encompass geophysical exploration results, such as those obtained from high-density resistivity methods and borehole wave velocity measurements, as well as the outcomes of groundwater sample testing. The model not only reflects geological structural information but also effectively demonstrates the spatial distribution of attribute field data. For geotechnical engineering professionals, the construction and analysis of the Demonstration model facilitate a deeper understanding of the geological background surrounding the proposed project area. This work enables them to conduct relevant geotechnical assessments and analyses, such as addressing adverse geological conditions and managing special geotechnical soils and rocks.
In comparison to the three aforementioned models of different scales, the construction of the boutique model relies on geological information of higher precision and density. In this study, a total of five boutique models were established, with data primarily sourced from systematic on-site engineering geological investigations within the modeling area. This comprehensive dataset includes approximately 2,000 engineering geological exploration boreholes, results from 30 hydrogeological field tests, geophysical exploration outcomes, as well as test results pertaining to soil, rock, and groundwater. Figure 7D exhibits the boutique model of the central business area in Shibei District. Given the stringent requirements for model accuracy, all geotechnical layers have been classified in accordance with the three-level coding rules outlined in Section 3.4, without any simplification or merging of strata. After the structural and attribute models are respectively created and integrated, three-dimensional visualization models such as oblique photography, pipelines, and above-ground and underground buildings and structures within the area can be superimposed based on specific requirements. These additional elements will be presented concurrently with the geological model outcomes. We can observe that this model effectively reflects the outcomes of fieldwork during geotechnical engineering investigations, closely approximating the real-world environment and geological conditions on site. Consequently, this model can be directly utilized not only for geotechnical engineering calculations and analyses but also for construction and operational management activities throughout the lifecycle of the construction project.
4.3 Attribute model results
The exhibition and analysis of spatial attributes such as geotechnical parameters and test data within geological bodies in EVS are primarily achieved through interpolation or the importation of external data. This process involves assigning spatial attributes to the true 3D grids of the model to derive the distribution patterns of these attributes. Once the spatial attribute distribution in the study area is obtained, each unit of the attribute model is then endowed with these attribute values. For instance, Figure 8 illustrates various attribute characteristics of the geological body, including profile features, longitudinal wave velocity of boreholes, chloride concentration in groundwater, and groundwater velocity. Depending on the requirements of geotechnical engineering and construction practices, various attribute information can be extracted from the 3D geological model. By selecting appropriate evaluation rules and implementing assessments, diverse outcomes of three-dimensional spatial analysis and applications, such as construction suitability and potential geological hazard risks, can be obtained.
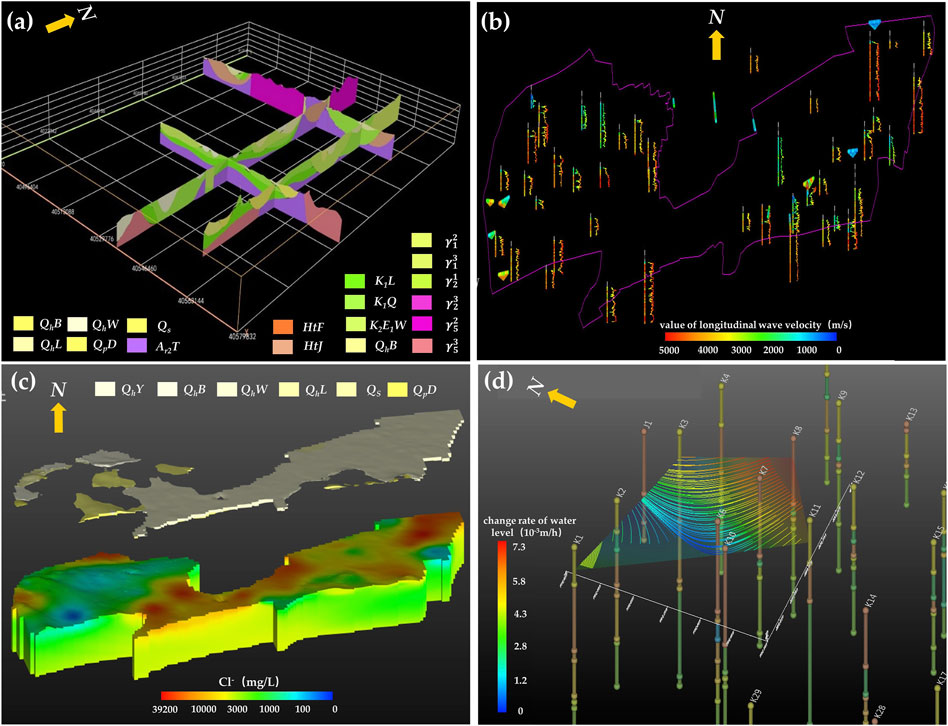
Figure 8. Three-dimensional geological attribute models of Qingdao with different accuracies: (A) profile properties of citywide models; (B) longitudinal wave velocity of the Hongdao area model in Chengyang district; (C) distribution of groundwater chloride concentrations in the Hongdao area of Chengyang District; (D) groundwater level change rates distribution of western port, which belongs to a boutique modelling location.
Figure 8A illustrates the stratigraphic distribution obtained by extracting stratigraphic profiles at arbitrary locations and directions within the model area. A comparison between the fundamental geological profile and the virtual profile at the same location reveals that the attribute values of the virtual profile closely resemble the overall patterns observed in the fundamental geological profile. This signifies that the model can provide fundamental data support for the expression of geological attributes at any location.
The geophysical exploration results, represented by the longitudinal wave velocity of rock and soil masses, are presented in Figure 8B. Geophysical exploration is an indirect means of obtaining geological data compared with engineering drilling, which often leads to results with multiple interpretations (Kovačević and Bačić, 2021). In research and practical applications of geotechnical engineering, it is common to conduct a synchronous comparative analysis of geophysical exploration results with engineering geological drilling, numerical simulations, and experimental outcomes. Leveraging three-dimensional geological software such as EVS, it is convenient to overlay and integrate the attribute models derived from geophysical exploration with geological structure models and other models, such as geotechnical test result models. Furthermore, the utilization of the software’s three-dimensional visualization and statistical analysis functionalities significantly reduces the time required for manual inspection and correction, thereby enhancing efficiency and minimizing reliance on manual efforts. For instance, we conducted a further manual analysis of the geophysical data and structural stratigraphic information within the model depicted in Figure 8B, by leveraging the model’s data screening analysis and stratigraphic slicing functionalities. Specifically, we focused on areas with a vertical depth exceeding 30 m and longitudinal wave velocity values below 3000 m/s. By comparing these results with other available data, we made necessary corrections, thereby providing enhanced references for future field testing and modeling endeavors.
The interaction between groundwater and geotechnical soil masses is one of the primary factors that contribute to geotechnical engineering accidents and geological disasters. As depicted in Figure 8C, the distribution of groundwater chloride concentrations in Hongdao area of Chengyang District is clearly presented, facilitating further analysis of groundwater quality at various depths and layers. It reveals that the northeastern, central, and northwestern regions of the modeled area exhibit elevated concentrations of chloride ions in groundwater, reaching a maximum of 39,200 mg/L. These saline groundwater bodies are primarily distributed within medium to coarse sand and gravel strata of the upper Quaternary. The construction and analysis of this model will facilitate a deeper understanding of the causes of groundwater salinization in the study area, and enable the development of targeted prevention and remediation measures.
Figure 8D illustrates the distribution of groundwater level change rates in the western port area, specifically within the location designated as the Premium Demonstration Ridge. This map was generated based on observations of groundwater levels in boreholes across various time periods in the region, providing valuable insights to project developers regarding the connectivity between groundwater and adjacent seawater in this area. The results indicate that the groundwater level change rate is highest in the southeastern region of the site, which coincides with the changes in oceanic tides on the same day. This suggests that this area may have good connectivity with seawater, requiring careful consideration in the later stages of foundation pit support engineering.
5 Discussion and applications
5.1 Practical application of the proposed methodology and modling outcomes
In 2023, the bedrock layer codes at three levels proposed by our research were officially approved and implemented as technical specifications for Qingdao City. This technical specification is not only applicable to 3D geological modeling work, but also to the on-site survey work of local geotechnical engineering, engineering geological, environ-mental geological, hydrogeological, and engineering geological. Additionally, it serves as a standard for recording original geological stratigraphy data using a bedrock layer code. The adoption of the new layer coding standard in the field raw data recording is conducive to reducing the workload of stratigraphic standardization in modelling; however, as the new standard is more complex compared to old one, the direct application of the layer code standard to the field practice of engineering survey has resulted in an increase in the field workload, in particular, the problem of determining the causes and times of the rocks. To enhance the utility of this standard for technical personnel, the subsequent phase will focus on the development of specialized index maps and complementary software tools. This initiative aims to augment operational efficiency and streamline the application of the standard in practice. The increasing promotion and implementation of the three-layer bedrock coded classification system locally has resulted in more standardized field recording of original geological data. This will facilitate the reduction of stratum simplification and merging due to inconsistent stratification standards. In the future, we will have the opportunity to create 3D geological models with a broader scope and higher precision, freeing from the confusion caused by chaotic and inconsistent original geological records.
The results of 3D geological modeling have been presented and analyzed in Section 4.2 and Section 4.3, while the application of these models in stratigraphic structure analysis and the evaluation of geotechnical engineering property values is also discussed. Thanks to the rapid development of technology, such as AI, IoT, modern communication, big data and other technologies, this provides good ideas for expanding the applications of 3D geological modelling. In current study, the constructed 3D geological model has been jointly applied with GIS, BIM and IoT technologies. The aim of these integrated applications is to cater to the needs of major engineering construction and geological disaster prevention in Qingdao City, and some new understanding and application results have been achieved.
5.2 Application case of integrated with BIM technology
Geotechnical engineering encompasses two core elements: geological bodies and structural elements, which interact and influence each other. Currently, numerous scholars have separately studied 3D geological modeling techniques and structural modeling techniques based on Building Information Modeling (BIM) for these two elements (Tang, 2023). Both fields have developed rapidly, with each providing comprehensive and accurate information support for projects in construction and geology. Their integration can further enhance the optimization and management of projects, providing valuable references for urban construction and governance (Tang, 2023; Wang S. et al., 2024). Therefore, we designed and implemented a case study of the joint application of 3D geological modeling and BIM technology.
A typical underground station along Line 6 of Qingdao metro system was selected as a case study. This case station is an island station with two underground floors, and the main structure is about 286.8 m in length along the north and south sides and 21.2 m in width. The construction method of the station involved open-cut excavation, with a maximum excavation depth of approximately 22 m for the foundation pit. To ensure stability during excavation, a support system was utilized, which consisted of cast-in-place piles, concrete steel pipe piles, and prestressed anchor cables. Figure 9A illustrates the complex surrounding environment of the station, encompassing municipal roadways, high-rise buildings, and landscape rivers. Geological exploration through drilling revealed nine major strata types, including Quaternary strata and bedrock.
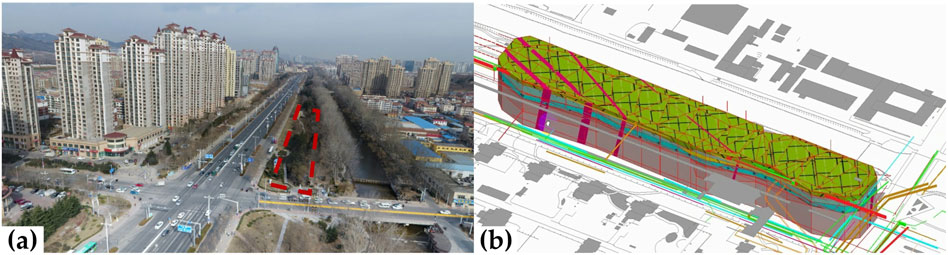
Figure 9. (A) Realistic surroundings and scope of the modelling project case. (B) Integrated presentation of 3D geological model and BIM.
The modeling work for the case station involves two main components: geological modeling and structural modeling. For geological modeling, 60 boreholes completed from the geotechnical engineering investigation conducted at the station, along with other geological data, were utilized. Following the workflow outlined in Figure 3, a boutique 3D geological model was established using EVS software. For structural modeling, Autodesk Revit (AR) software was employed, taking into account various aboveground and underground environmental factors that could affect the station’s structural design and civil construction, including underground municipal pipelines, important adjacent buildings and structures, and surface water systems.
There exists a notable deficiency in the availability of a consolidated spatial data structure and geometric topological relationship between BIM (Building Information Modeling) models and 3D geological models. Furthermore, the methodologies employed for modeling these two types of models differ significantly (Wu et al., 2023). This leads to challenges such as poor consistency, limited interoperability, and limited compatibility when integrating these two models. To address these concerns, we have developed a novel deep integration algorithm leveraging the API functions provided by AR software. This algorithm is designed to reconstruct the geometric topological relationships between geological and structural models, eliminating the need for manual execution of numerous Boolean operations to resolve overlapping issues between the two models. Figure 9B demonstrates the final integrated geological and structural model implemented in AR software.
In the integrated model of BIM and 3D geological modeling, the geological conditions, the project site, surface structures, underground pipelines, and surface rivers are comprehensively and holistically represented. Leveraging the powerful capabilities of BIM simulation software such as Navisworks, the integrated model enables simulations related to design and construction progress, costs, and safety management, which are not feasible with a single geological model. This integrated approach achieves a leap in geological modeling outcomes, significantly reducing communication and collaboration challenges among various participants in subway construction projects. It effectively enhances the efficiency of survey, design, and construction work, shortening the turnaround time for drawings. Its primary advantages lie in the comprehensive display of all engineering construction elements and its robust simulation capabilities, which greatly facilitate the achievement of expected project targets in terms of safety, schedule, quality, and cost.
5.3 Application case of integrated with GIS
The 3D geological model is closely related to GIS. Firstly, the 3D geological model provides a comprehensive visualization of the under-ground geological structures, while GIS technology offers powerful capabilities for spatial data processing, analysis, and visualization (Jiménez-Espada et al., 2023). By integrating the 3D geological model with GIS technology, a comprehensive, efficient, and intuitive management and application of geological data can be achieved. Moreover, data from the 3D geological model can be imported into GIS software as input attribute layers for spatial overlay analysis. This analytical approach allows for the effective integration of parameters from different geological layers, enabling the delineation of geological features such as high bearing capacity and favorable geological areas through methods such as raster image fuzzy pattern recognition or classification. This integration enhances the ac-curacy and efficiency of geological data processing and analysis. The joint application of GIS and the 3D geological models can lead to better recommendations for decision makers in urban planning and construction.
To enable the integrated application of GIS and 3D geological models, a decision support system for geological information of Qingdao City was developed within the SuperMap software, leveraging WebGL and WebGIS technologies. The core functionalities of this system encompass database management, visualization and analysis of multi-source data, querying and retrieval of specialized geological information, generation and editing of geological outputs, statistical analysis, and creation and exportation of reports. GIS base map scenario of this system was developed and enhanced using HTML5 technology of SuperMap, boasting rich content and a smooth user experience. After importing the output and raw data from the 3D geological modeling into the system, they can be displayed in three dimensions through the plugin-free browsing capabilities of WebGL. The system offers services based on a Browser/Server (B/S) architecture, allowing users to select a specific region. Once selected, the system loads the geological body models within the 3D scene and provides a suite of display and analysis features tailored for the 3D geological models. A specific application case of the system serving urban planning and construction is introduced below.
The research case is located near a historical preservation area in Shinan district, Qingdao City. City planners were considering the planning and utilization of the underground space in this region, intending to select an area for the construction of a comprehensive parking lot. However, due to local policies that aimed at protecting ancient buildings and the appearance of the neighborhood, there have been limited construction projects in this area in recent years, and there are no relevant case studies to refer to. This poses significant challenges for decision-makers involved in the planning and construction. To address these challenges, the combined application of GIS and 3D geological models is necessary to provide geological data and decision-making reference suggestions for the site selection and preliminary design of this project.
Once the preliminary planning scheme for the proposed underground parking lot is finalized, designers can conveniently identify multiple potential construction sites within the GIS base map scenario, leveraging the urban scene visualization functionality of the decision support system. Subsequently, they can utilize the system’s geological information retrieval and geological output generation functionalities to conduct data retrieval on the initially selected construction locations. This enables the exportation of geological sections and 3D geological models, facilitating further geological professional assessments. Figure 10 exhibits the evaluation results of a proposed construction site from geological perspective. The geological assessment report exported by the system reveals that the overall structure of the underground parking lot at this site primarily resides within a stable granite mass, exhibiting good site stability and construction suitability. This favorable geological condition is expected to contribute to cost savings in support engineering. Furthermore, the system highlights potential geological hazards such as thin overlying strata and abundant groundwater in certain areas of the parking lot. The efficient and convenient acquisition of these insights is invaluable for decision-makers in further optimizing the design and construction plan of this construction project.
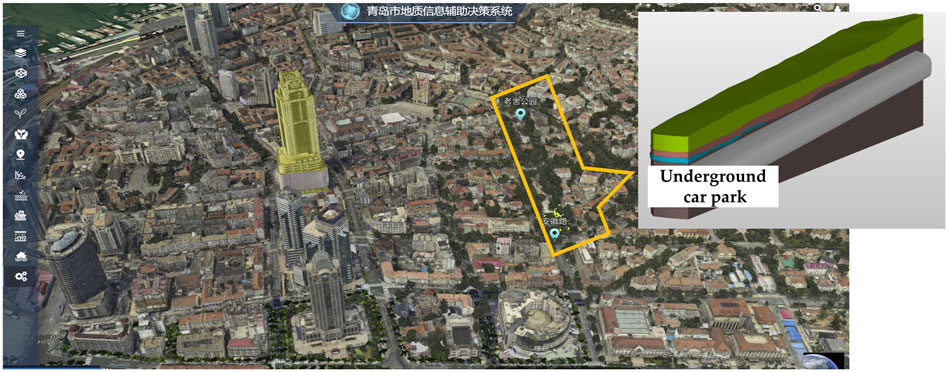
Figure 10. Combined application of 3D geological modeling and GIS technology in the development of underground space in central urban areas.
5.4 Application case of integrated with IoT
Qingdao, a typical coastal city in eastern China, faces the risk of geological disasters, including seawater intrusion, similar to other major coastal cities around the world (Lu and Werner, 2013; Werner, 2017; Lu et al., 2019). In recent years, due to the intensified exploitation of groundwater and the impact of climatic factors, the issue of seawater intrusion in Qingdao has increasingly garnered the attention of authorities. Especially in the northern shore area of Jiaozhou Bay in Qingdao, seawater has intruded into inland regions, resulting in the salinization of groundwater and a decline in its quality, which has constrained the local economic and social development.
Between 2020 and 2021, researchers established 21 new monitoring wells in the northern shore area of Jiaozhou Bay, aiming to monitor groundwater conditions and the extent of seawater intrusion in order to address this pressing crisis. Figure 11 illustrates the construction process of these monitoring wells and provides on-site work photographs. Thanks to the advancements in the Internet of Things technology, the monitoring wells have enabled real-time online transmission of multi-parameter data, including groundwater level, conductivity, and temperature. This has significantly aided researchers in tracking the changes in local groundwater conditions. However, there remain technical challenges due to the absence of a dedicated and efficient data carrier system. In particular, the scattered distribution of monitoring stations and the heterogeneous, multi-source, and massive nature of the collected data have hindered convenient data presentation, management, and application.
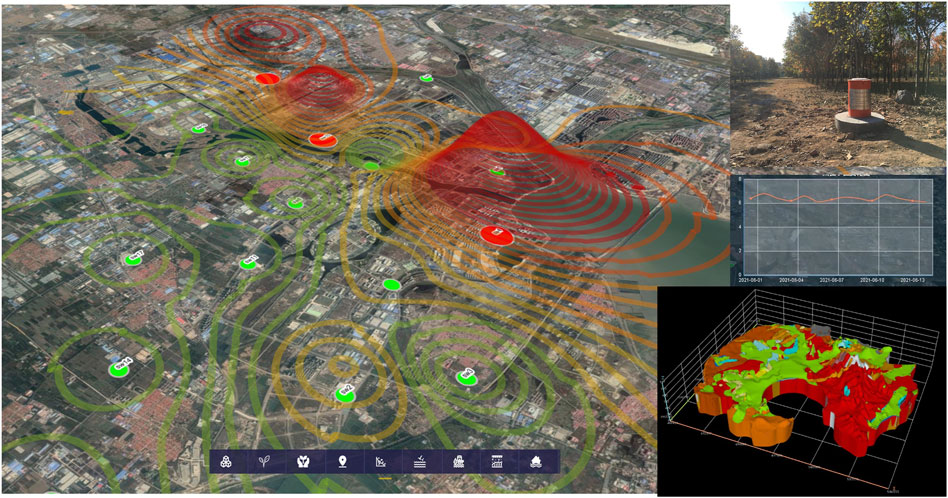
Figure 11. Combined application of 3D geological modeling and IoT technology for monitoring of saltwater intrusion disasters in north Jiaozhou Bay area.
In Section 5.2, a decision support system for geological information of Qingdao City is introduced, which is established through the integration of 3D geological models and GIS technology. This system provides a novel approach for monitoring seawater intrusion disasters through the combined application of the IoT and 3D geological models. We have further developed and upgraded the aforementioned system, establishing a dedicated data interface to enable real-time reception and conversion of groundwater data transmitted from monitoring stations via the IoT. Additionally, an online groundwater monitoring and early warning module within the system was created. This module boasts functionalities such as real-time monitoring data viewing, current and historical data display and analysis, overlaying of 3D geological models, GIS information exhibition, and alarm notifications for exceeding preset thresholds. Figure 11 also demonstrates the distribution map of monitoring data from this module, clearly indicating the locations and specific values of points with a high degree of groundwater salinization. It is noteworthy that once the 3D geological model of the monitoring area is exported from the system, researchers can conveniently conduct a comprehensive analysis of the data from monitoring stations in conjunction with stratum structure, permeability, and other indicators at their respective locations. This functionality, which combines multi-dimensional integration and diverse displays, holds significant value for local managers in making informed decisions regarding water resource utilization and the prevention and control of seawater intrusion disasters.
6 Conclusion
The present study introduces a methodology for constructing multi-scale 3D geological models tailored for coastal bedrock urban environments, offering several key contributions and insights:
(a) We developed a three-tiered coding system for bedrock layers that effectively represents the degree of weathering, geological age, and lithological characteristics, addressing complexities and standardization issues in rock formations.
(b) A double-weighted interpolation fitting method was proposed for the seamless integration of heterogeneous data sources, ensuring a smooth transition and maintaining accuracy in land-sea data fusion.
(c) The methodology was successfully applied to construct 13 models across four scales in Qingdao, demonstrating the capability to handle multi-source, non-uniform data, and a predominance of bedrock strata.
(d) The study highlights the benefits of combining 3D geological modeling with modern technologies, such as BIM, GIS, and IoT technologies. The collaborative application of geological models and emerging technologies has unveiled their immense potential in facilitating urban construction projects and mitigating geological hazards, aligning with the objectives of sustainable development in coastal regions.
(e) The new stratigraphic coding standard has been officially approved as a local technical specification for Qingdao City. The practical significance of this study lies in its notable advancement in 3D geological modeling and its application technologies for coastal bedrock cities. It provides an efficient and integrated platform for urban planners, geological engineers, and geotechnical engineers, contributing to the safety, efficiency, and sustainable development of coastal cities.
While our methodology is specifically tailored for the three-dimensional geological modeling efforts in Qingdao City, the fundamental scientific principles and technologies underlying its geological problem-solving prowess possess broad implications. The exploration of its applicability in other regions, such as inland cities dominated by bedrock, and areas with pressing needs for urban planning or geological disaster prevention and mitigation, holds considerable promise. The three-tiered coding system developed for bedrock layers, can serve as a beneficial reference for formulating stratigraphic coding standards in areas lacking lithostratigraphic division standards. The integration of our modeling results with other technologies such as BIM, CIM, and IoT can enable urban managers and geologists to have a deeper understanding of the application of three-dimensional geological models, which will also benefit the technological advancement of local three-dimensional geological modeling work. However, it is essential to recognize that each region will have unique geological characteristics and data availability that may require localized adjustments and calibrations to our methodology.
In summary, this study provides a robust framework for multi-scale 3D geological city modeling, which is of practical significance for the management and application of engineering geological data. The modeling techniques and case models presented and developed in this paper pave the way for urban geological modeling at the city level under similar geological conditions and technical requirements. Future research can build upon this foundation to refine the modeling techniques, explore new directions for application, expand the scope of urban geological models, and thereby contribute to the advancement of urban development and governance.
Data availability statement
The data analyzed in this study is subject to the following licenses/restrictions: Data will be made available on request, further inquiries can be directed to the corresponding author. Requests to access these datasets should be directed to Y2hlbmd6aGlsaWFuZ0B3ZnUuZWR1LmNu.
Ethics statement
Written informed consent was obtained from the individual(s) for the publication of any potentially identifiable images or data included in this article.
Author contributions
DJ: Conceptualization, Formal Analysis, Funding acquisition, Methodology, Resources, Supervision, Writing–original draft. JH: Conceptualization, Methodology, Software, Validation, Writing–original draft. ZC: Conceptualization, Formal Analysis, Funding acquisition, Validation, Writing–review and editing. SW: Formal Analysis, Software, Writing–review and editing. YZ: Methodology, Writing–review and editing. WL: Software, Writing–review and editing.
Funding
The author(s) declare that financial support was received for the research, authorship, and/or publication of this article. This work was funded by Qingdao Urban Geological Survey Project (grant No. ZFCG2019001542), Higher Education Research Planning Project of China Association of Higher Education (grant No. CX230303), the Doctoral Research Initial Foundation of Weifang University (grant No. 2022BS34) and the Shandong Provincial Natural Science Foundation (grant No. ZR2023QE004).
Acknowledgments
The authors would like to express their sincere thanks to Valerio Acocella, Chief Editor, Kennedy Chibuzor Onyelowe, Associate Editor, as well as the reviewers for their thorough review and constructive comments on the manuscript.
Conflict of interest
The authors declare that the research was conducted in the absence of any commercial or financial relationships that could be construed as a potential conflict of interest.
Publisher’s note
All claims expressed in this article are solely those of the authors and do not necessarily represent those of their affiliated organizations, or those of the publisher, the editors and the reviewers. Any product that may be evaluated in this article, or claim that may be made by its manufacturer, is not guaranteed or endorsed by the publisher.
References
Adewoyin, O. O., Joshua, E. O., Akinyemi, M. L., Omeje, M., and Adagunodo, T. A. (2021). Evaluation of geotechnical parameters of reclaimed land from near-surface seismic refraction method. Heliyon 7, e06765. doi:10.1016/j.heliyon.2021.e06765
Andersen, T. R., Poulsen, S. E., Pagola, M. A., and Medhus, A. B. (2020). Geophysical mapping and 3D geological modelling to support urban planning: a case study from Vejle, Denmark. J. Appl. Geophys. 180, 104130. doi:10.1016/j.jappgeo.2020.104130
Augarde, C. E., Lee, S. J., and Loukidis, D. (2021). Numerical modelling of large deformation problems in geotechnical engineering: a state-of-the-art review. Soils Found. 61, 1718–1735. doi:10.1016/j.sandf.2021.08.007
Ben Alaya, I., Jribi, M., Ghorbel, F., Sappey-Marinier, D., and Kraiem, T. (2017). Fast and accurate estimation of the HARDI signal in diffusion MRI using a nearest-neighbor interpolation approach. IRBM 38, 156–166. doi:10.1016/j.irbm.2017.04.003
Caamaño-Carrillo, C., Bevilacqua, M., López, C., and Morales-Oñate, V. (2024). Nearest neighbors weighted composite likelihood based on pairs for (non-)Gaussian massive spatial data with an application to Tukey-hh random fields estimation. Comput. Statistics and Data Analysis 191, 107887. doi:10.1016/j.csda.2023.107887
Cao, H., Ma, G., Liu, P., Qin, X., Wu, C., and Lu, J. (2023). Multi-factor analysis on the stability of high slopes in open-pit mines. Appl. Sci. 13, 5940. doi:10.3390/app13105940
Chen, X. S., Hong, C. Y., and Su, D. (2022). Intelligent geotechnical engineering. Chin. J. Geotechnical Eng. 44, 2151–2159.
Cong, X., Qi, Z., Wang, S., Su, P., Wang, L., Šaparauskas, J., et al. (2023). Ecological welfare performance evaluation and spatial–temporal difference evolution of blue economic zones: a case study of the blue economic zone of Shandong Peninsula. Land 12, 1886. doi:10.3390/land12101886
Cui, Q., Hu, X., Liu, X., Zhao, L., and Wang, G. (2021). Understanding architectural designers’ continuous use intention regarding BIM technology: a China case. Buildings 11, 448. doi:10.3390/buildings11100448
Dou, Y., Yin, P., Chen, B., Xue, B., Wang, M., Zou, L., et al. (2021). Application exploration, theoretical and technologiacl innovation of geological sur-vey results in coastal bedrock city: taking qingdao as an example. Mar. Geol. Front. 37, 1–9. doi:10.16028/j.1009-2722.2021.122
Gu, X., Lin, C., Wang, B., Wang, J., and Ouyang, W. (2022). A comprehensive assessment of anthropogenic impacts, contamination, and ecological risks of toxic elements in sediments of urban rivers: a case study in Qingdao, East China. Environ. Adv. 7, 100143. doi:10.1016/j.envadv.2021.100143
He, H., Jingze, X., Jing, H., Bo, W., Xiaogang, M., Fan, H., et al. (2023). Three-dimensional geological modeling of the shallow subsurface and its application: a case study in Tongzhou district, Beijing, China. Appl. Sci. 13, 1932. doi:10.3390/app13031932
Hou, W., Yang, L., Deng, D., Ye, J., Clarke, K., Yang, Z., et al. (2016). Assessing quality of urban underground spaces by coupling 3D geological models: the case study of Foshan city, South China. Comput. and Geosciences 89, 1–11. doi:10.1016/j.cageo.2015.07.016
Houlding, S. (1994). 3D geoscience modeling: computer techniques for geological characterization. Berlin: Springer-Verlag. doi:10.1007/978-3-642-79012-6
Hua, W., Guo, D., Liu, X., ZhuYuhua, Z. W., and Su, Z. (2023). Unified correction and connection method of stratigraphic sequence with complex inversion. Eart. Scie. 48, 1532. doi:10.3799/dqkx.2022.201
Jiang, Y., Wang, Z., Jin, X., and Wang, Y. (2024). Acoustic emission features of granite from different rockburst areas in Sangzhuling Railway Tunnel. Heliyon 10, e27385. doi:10.1016/j.heliyon.2024.e27385
Jiménez-Espada, M., Martínez García, F. M., and González-Escobar, R. (2023). Sustainability indicators and GIS as land-use planning instrument tools for urban model assessment. IJGI 12, 42. doi:10.3390/ijgi12020042
Kabeta, W. F., Tamiru, M., Tsige, D., and Ware, H. (2023). An integrated geotechnical and geophysical investigation of landslide in Chira town, Ethiopia. Heliyon 9, e17620. doi:10.1016/j.heliyon.2023.e17620
Kovačević, M. S., and Bačić, M. (2021). Editorial of special issue “modern surveying and geophysical methods for soil and rock.”. Geosciences 11, 396. doi:10.3390/geosciences11090396
Kovačević, M. S., Bačić, M., Librić, L., and Gavin, K. (2022). Evaluation of creep behavior of soft soils by utilizing multisensor data combined with machine learning. Sensors 22, 2888. doi:10.3390/s22082888
Kovačević, M. S., Gavin, K., Stipanović Oslaković, I., and Librić, L. (2018). Monitoring of long term deformations in Bobova tunnel, 5th Int. Conf. Road Rail Infrastructure, 1507–1513. doi:10.5592/CO/CETRA.2018.844
Krige, D. G. (1952). A statistical approach to some basic mine valuation problems on the Witwatersrand. J. South Afr. Inst. Min. Metallurgy 52, 119–139.
Li, M., and Pan, J. (2023). Assessment of influence mechanisms of built environment on street vitality using multisource spatial data: a case study in qingdao, China. Sustainability 15, 1518. doi:10.3390/su15021518
Li, S., Xu, S., Nie, L., Liu, B., Liu, R., Zhang, Q., et al. (2018). Assessment of electrical resistivity imaging for pre-tunneling geological characterization – a case study of the Qingdao R3 metro line tunnel. J. Appl. Geophys. 153, 38–46. doi:10.1016/j.jappgeo.2018.03.024
Liu, X., Zhang, P., Guo, Y., Ma, G., and Liu, M. (2023). Study of a high-precision complex 3D geological modelling method based on a fine KNN and kriging coupling algorithm: a case study for Jiangsu, China. Front. Earth Sci. 11, 1325907. doi:10.3389/feart.2023.1325907
Lloyd, C. D., and Atkinson, P. M. (2001). Assessing uncertainty in estimates with ordinary and indicator kriging. Comput. and Geosciences 27, 929–937. doi:10.1016/S0098-3004(00)00132-1
Lu, C., Cao, H., Ma, J., Shi, W., Rathore, S. S., Wu, J., et al. (2019). A proof-of-concept study of using a less permeable slice along the shoreline to increase fresh groundwater storage of oceanic islands: analytical and experimental validation. Water Resour. Res. 55, 6450–6463. doi:10.1029/2018WR024529
Lu, C., Li, S., Liu, J., and Xu, K. (2022). Coupling coordination and dynamic response analysis of new-type urbanization, urban infrastructure and urban environment—a case study of the jiaodong economic circle. Int. J. Environ. Res. Public Health 19, 14909. doi:10.3390/ijerph192214909
Lu, C., and Werner, A. D. (2013). Timescales of seawater intrusion and retreat. Adv. Water Resour. 59, 39–51. doi:10.1016/j.advwatres.2013.05.005
Madsen, R. B., Høyer, A.-S., Andersen, L. T., Møller, I., and Hansen, T. M. (2022). Geology-driven modeling: a new probabilistic approach for incorporating uncertain geological interpretations in 3D geological modeling. Eng. Geol. 309, 106833. doi:10.1016/j.enggeo.2022.106833
Ning, Z., Lin, M., Zhang, Y., Zhang, X., and Kong, X. (2019). Distribution of potential geological hazards and control factors in Qingdao offshore, China. China Geol. 2, 40–48. doi:10.31035/cg2018074
Niu, G., He, X., Xu, H., and Dai, S. (2024). Development of rock classification systems: a comprehensive review with emphasis on artificial intelligence techniques. Eng 5, 217–245. doi:10.3390/eng5010012
Otake, Y., and Honjo, Y. (2022). Challenges in geotechnical design revealed by reliability assessment: review and future perspectives. Soils Found. 62, 101129. doi:10.1016/j.sandf.2022.101129
Pan, F., Sun, Y., Jiang, N., Jian, Z., Mei, Y., and Liu, Q. (2023). Analysis of the coordination of built-up area expansion and population growth in the Shandong Peninsula urban agglomeration. Sustainability 15, 7763. doi:10.3390/su15107763
Price, D. T., McKenney, D. W., Nalder, I. A., Hutchinson, M. F., and Kesteven, J. L. (2000). A comparison of two statistical methods for spatial interpolation of Canadian monthly mean climate data. Agric. For. Meteorology 101, 81–94. doi:10.1016/S0168-1923(99)00169-0
Qiao, Y.-K., Peng, F.-L., Dong, Y.-H., and Lu, C.-F. (2024). Planning an adaptive reuse development of underutilized urban underground infrastructures: a case study of Qingdao, China. Undergr. Space 14, 18–33. doi:10.1016/j.undsp.2023.05.005
She, J., Li, X., Liu, J., Chen, Y., Tan, J., and Wu, G. (2019). A building label placement method for 3D visualizations based on candidate label evaluation and selection. Int. J. Geogr. Inf. Sci. 33, 2033–2054. doi:10.1080/13658816.2019.1606431
Shi, J., Li, G., and Wang, P. (2011). Anthropogenic influences on the tidal prism and water exchanges in Jiaozhou Bay, qingdao, China. J. Coast. Res. 27, 57–72. doi:10.2112/JCOASTRES-D-09-00011.1
Su, C., Madani, H., and Palm, B. (2019). Spatial data assisted ground source heat pump potential analysis in China, a case of qingdao city. Energy Procedia 158, 6099–6104. doi:10.1016/j.egypro.2019.01.504
Tang, W. (2023). Application of BIM technology in the reinforcement and renovation of existing building inspection projects. Alexandria Eng. J. 82, 240–247. doi:10.1016/j.aej.2023.09.075
Tognoli, F. M. W., Spaniol, A. F., de Mello, M. E., and de Souza, L. V. (2024). A machine-learning based approach to predict facies associations and improve local and regional stratigraphic correlations. Mar. Petroleum Geol. 160, 106636. doi:10.1016/j.marpetgeo.2023.106636
von Storch, H., Chen, X.-E., Pfau-effinger, B., Bray, D., and Ullmann, A. (2019). Attitudes of young scholars in Qingdao and Hamburg about climate change and climate policy – the role of culture for the explanation of differences. Adv. Clim. Change Res. 10, 158–164. doi:10.1016/j.accre.2019.04.001
Wang, S., Chong, H.-Y., and Zhang, W. (2024a). The impact of BIM-based integration management on megaproject performance in China. Alexandria Eng. J. 94, 34–43. doi:10.1016/j.aej.2024.03.036
Wang, X., Yao, W., Luo, Q., and Yun, J. (2024b). Spatial relationship between ecosystem health and urbanization in coastal mountain city, Qingdao, China. Ecol. Inf. 79, 102458. doi:10.1016/j.ecoinf.2023.102458
Werner, A. D. (2017). On the classification of seawater intrusion. J. Hydrology 551, 619–631. doi:10.1016/j.jhydrol.2016.12.012
Woldesenbet, T. T., Arefaine, H. B., and Yesuf, M. B. (2023). Numerical stability analysis and geotechnical investigation of landslide prone area (the case of Gechi district, Western Ethiopia). Environ. Challenges 13, 100762. doi:10.1016/j.envc.2023.100762
Wu, J., Ding, L., Xiao, M., Dai, L., Xue, G., Chen, J., et al. (2023). Deep fusion method of geologgical and structural models based on BIM technolog. J. Basic Sci. Eng. 31, 1410–1426. doi:10.16058/j.issn.1005-0930.2023.06.004
Wu, Y., Wang, K., Zhang, L., and Peng, S. (2018). Sand-layer collapse treatment: an engineering example from Qingdao Metro subway tunnel. J. Clean. Prod. 197, 19–24. doi:10.1016/j.jclepro.2018.05.260
Yan, F., Qiu, W., Sun, K., Jiang, S., Huang, H., Hong, Y., et al. (2021). Investigation of a large ground collapse, water inrush and mud outburst, and countermeasures during subway excavation in Qingdao: a case study. Tunn. Undergr. Space Technol. 117, 104127. doi:10.1016/j.tust.2021.104127
Yin, Z., Jin, Y., and Liu, Z. (2020). Practice of artificial intelligence in geotechnical engineering. J. Zhejiang University-Science A (Applied Phys. and Eng.) 21, 407–411. doi:10.1631/jzus.a20aige1
Zhang, H., Yu, Q., Liu, Y., Jiang, J., Chen, J., and Liu, R. (2023a). The spatio-temporal patterns of regional development in Shandong Province of China from 2012 to 2021 based on nighttime light remote sensing. Sensors 23, 8728. doi:10.3390/s23218728
Zhang, J., Murton, J., Cane, T., Maji, V., Sui, L., Liu, S., et al. (2023b). Evaluation of freezing state of sandstone using ultrasonic time-frequency characteristics. J. Rock Mech. Geotechnical Eng. 15, 584–599. doi:10.1016/j.jrmge.2022.04.013
Zhang, J. W., Murton, J., Liu, S. J., Sui, L. L., Ding, H., Wang, L., et al. (2020a). Sensitivity and regression analysis of acoustic parameters for determining physical properties of frozen fine sand with ultrasonic test. Q. J. Eng. Geol. Hydrogeology 54, qjegh2020–021. doi:10.1144/qjegh2020-021
Zhang, S., Zhou, X., Zhang, J., Sun, T., Ma, W., Liu, Y., et al. (2022). A case study of energy-saving and frost heave control scheme in artificial ground freezing project. Geofluids 2022, 1–15. doi:10.1155/2022/1004735
Zhang, X., Zhang, Y., Xu, L., Zhang, J., Tian, Y., Wang, S., et al. (2020b). Urban geological 3D modeling based on papery borehole log. IJGI 9, 389. doi:10.3390/ijgi9060389
Zhu, P., Mumm, O., Zeringue, R., Endres, E., and Miriam Carlow, V. (2022). Building-related resource use in Chinese eastern cities – qingdao building stock as a case study. Appl. Energy 313, 118697. doi:10.1016/j.apenergy.2022.118697
Keywords: geotechnical engineering, three-dimensional geological model, coast city, multi-scale model, layer code of bedrocks, land-sea data fusion
Citation: Ji D, Hou J, Cheng Z, Wei S, Zhai Y and Li W (2024) Construction and application of multi-scale 3D geological models: an example from Qingdao City, China. Front. Earth Sci. 12:1435824. doi: 10.3389/feart.2024.1435824
Received: 21 May 2024; Accepted: 28 August 2024;
Published: 13 September 2024.
Edited by:
Kennedy Chibuzor Onyelowe, Michael Okpara University of Agriculture, NigeriaReviewed by:
Arif Ali Baig Moghal, National Institute of Technology Warangal, IndiaUgochukwu Okonkwo, Michael Okpara University of Agriculture, Nigeria
Copyright © 2024 Ji, Hou, Cheng, Wei, Zhai and Li. This is an open-access article distributed under the terms of the Creative Commons Attribution License (CC BY). The use, distribution or reproduction in other forums is permitted, provided the original author(s) and the copyright owner(s) are credited and that the original publication in this journal is cited, in accordance with accepted academic practice. No use, distribution or reproduction is permitted which does not comply with these terms.
*Correspondence: Zhiliang Cheng, Y2hlbmd6aGlsaWFuZ0B3ZnUuZWR1LmNu