 Zhou Zhao
 Yuhan Zhang
 Xing Chen
 Jiangbo Wei
 Jianquan Ma
95% of researchers rate our articles as excellent or good
Learn more about the work of our research integrity team to safeguard the quality of each article we publish.
Find out more
ORIGINAL RESEARCH article
Front. Earth Sci. , 26 July 2024
Sec. Geohazards and Georisks
Volume 12 - 2024 | https://doi.org/10.3389/feart.2024.1434519
This article is part of the Research Topic Prevention, Mitigation, and Relief of Compound and Chained Natural Hazards Volume II View all 14 articles
The mountainous areas of the Loess Plateau in China are crisscrossed with ravines, fragile ecological environment, and frequent landslide hazards. Landslides often cause building collapses and casualties, seriously affecting the sustainability of economic and social development in the region. In order to study the damage of loess landslides to village and town buildings, the paper takes the Xingwang landslide in Fugu County, Shaanxi Province, China as an example, and uses discrete element method and finite element method to study the dynamic process of landslide and its damage to houses. Firstly, the geological characteristics of the landslide were identified by means of investigation, surveying, engineering exploration and geotechnical testing. Secondly, a three-dimensional numerical model of the landslide area was established by using the particle flow code system (PFC3D). Finally, the entire movement process of the landslide was simulated, and the impact damage to houses induced from landslide was analyzed and predicted. The results show that the whole movement of the landslide lasted a total of 180 s, with a maximum average velocity of 2.01 m/s and a maximum average displacement of 73.7 m. The first and second rows of houses located at the foot of the landslide will suffer serious damage, with most bricks displacement ranging from 0.1 to 2.5 m and a maximum displacement of 10.3 m, posing a serious safety risk to the houses. Only a portion of the third row houses will be damaged, and the fourth row houses will not be threatened by landslide. By comparing with the prediction results of other methods and the current situation of buildings deformation, the results of this paper have a certain credibility. This study provides a numerical method for quantitative assessment of the risk and building damage for loess landslide, which can be used as a reference. It also provides technical support for formulating hazard prevention and reduction plans for the Xingwang landslide.
Landslides are a common geological hazard in mountainous areas of China, with strong destructiveness and huge harmfulness. Landslides on the Loess Plateau account for at least one-third of the total number of landslides in China (Ji et al., 2024), and more than 16,600 loess landslides have been developed in northern Shaanxi (Peng et al., 2016; Peng et al., 2019), which have caused a large number of casualties and property losses, affecting the socio-economic development of urban areas. For example, the Sale Mountain loess landslide in 1983 resulted in 220 deaths (Yan et al., 2018), the Baqiao loess landslide occurred in 2011 with 32 deaths (Zhuang et al., 2015), and the Jiangliu loess landslide in 1984 buried large areas of farmland and houses (Liu and Kang, 1986). From the perspective of hazard consequences, the mobility of landslide and its impact performance on buildings are the key reasons for these casualties and losses. Therefore, the prediction study on the whole process of loess landslide movement and impact damage to houses of great practical significance for landslide risk prevention and reduction.
The landslide movement is a dynamic process with a time effect. Currently, research in this area mainly focuses on landslide velocity, displacement, influence range and other indicators (Wang et al., 2023; Wu et al., 2023; Xu et al., 2023). On the other hand, the prediction of damage caused by landslides impact to buildings needs to be based on the analysis of the landslide movement, so the study of landslide dynamic processes has always been a hot topic in the field of engineering geology. Considering the significant difficulties in accurately measuring the dynamic indicators of landslides during the sliding process, researchers have begun to use numerical simulation methods to study the motion characteristics in recent years (McDougall, 2006; Xiao and Lin, 2016; Li et al., 2019; Wang et al., 2020; Li et al., 2021; Chang et al., 2022; Song et al., 2023; Zhang et al., 2024), which not only reduces the cost but also visualizes the process of landslide movement and the physical law.
At present, in terms of numerical simulation of landslide dynamic processes, there are generally two types of models: finite element models and discrete element models. The former mainly relies on the continuum theory for the study of landslides dynamic characteristics, and the corresponding software system mainly includes DAN3D (Delaney and Evans, 2015; Jordan and Oldrich, 2016; Gao et al., 2023), FLOW-3D (Zhang et al., 2022; Sabeti et al., 2024), MassMov2D (Monia et al., 2014; Ma et al., 2021), etc. The latter mainly relies on the discontinuous theory and is commonly used to study the dynamic characteristics, energy evolution characteristics, and deformation characteristics of buildings during landslide movement, mainly includes PFC (Wei et al., 2019; Zhao et al., 2023; Li et al., 2021), UDEC (Luo et al., 2021; Zabuski and Marcato, 2020; Li et al., 2021), 3DEC (Wu and Hsieh, 2021; Mreyen et al., 2022) and so on. In contrast, finite element method has the advantages of simple modeling, convenient operation, and low computational complexity. However, it has limitations in analyzing the flow and deformation characteristics of granular materials and solving large deformations. In fact, the most commonly used PFC (particle flow code) in the discrete element method can treat the landslide as a body composed of several particles, and simulate the deformation and motion process of the landslide through the interaction between particles and walls. Compared with the continuous medium model, the PFC does not require the assumption of macroscopic continuity to solve the problems. It can better simulate the deformation, failure, and movement processes of loose rock and soil mass such as loess landslides, and monitor their changes in velocity, impact force, energy transfer, and other characteristics. Therefore, it is increasingly widely used in the study of the dynamic process of soil landslides (Tang et al., 2009; Lo et al., 2011; Hu et al., 2019; Chen, 2022; Zhao et al., 2023). In the research of houses damage induced from landslide, the existing cases have shown that the discrete element model can effectively simulate the dynamic process of masonry structure houses subjected to landslide, especially in simulating the deformation and cracking of masonry. However, it is difficult to express the continuous deformation of the wall (Zhao et al., 2023). The finite element model has obvious advantages in analyzing the continuous deformation and overall displacement of masonry, but it is difficult to express the failure characteristics such as masonry cracking (Luo et al., 2019; Luo et al., 2019).
In the mountainous areas of the Loess Plateau in China, village and town buildings are mostly single story houses with brick and concrete masonry structures. Analyzing and predicting the damage of these types of buildings induced from loess landslides has become a key aspect for landslide quantitative risk assessment. However, most of the available research results focus on the damage to buildings caused by accumulation layers or debris landslides, a few studies on loess landslides. The researchers of this manuscript have used discrete element method and finite element method to predict the dynamic process of a shallow accumulation layer landslide and its impact damage to brick-concrete buildings (Zhao et al., 2023), but whether these methods are also applicable to the scenario simulation of a loess landslide is a small task worthy of discussion. In view of this, the manuscript takes the Xingwang loess landslide as an example. Based on field investigation, UAV survey, geological exploration, and geotechnical test analysis, a three-dimensional numerical model of landslide was established by using PFC3D discrete element program. The entire dynamic process of the landslide was simulated, and dynamic parameters such as velocity, displacement, and impact force were obtained. On this basis, discrete element model and finite element model are used respectively to simulate and predict the landslide damage of buildings. The relevant results have important reference significance for risk assessment and hazard prediction of loess landslides.
The Xingwang landslide is located in the loess mountainous area in the southern part of Fugu County, Shaanxi Province, with geographical coordinates of 38° 59′37″N and 110° 44′16″E (Figure 1). The area belongs to the temperate continental monsoon semi-arid climate, with large temperature differences and variable climate. The rainfall in August is the largest, mostly rainstorm, which is easy to cause landslide occurs. Except for the Jurassic sandstone or mudstone exposed in some local valleys, most areas are covered by Quaternary loess, and the fault structures are not developed.
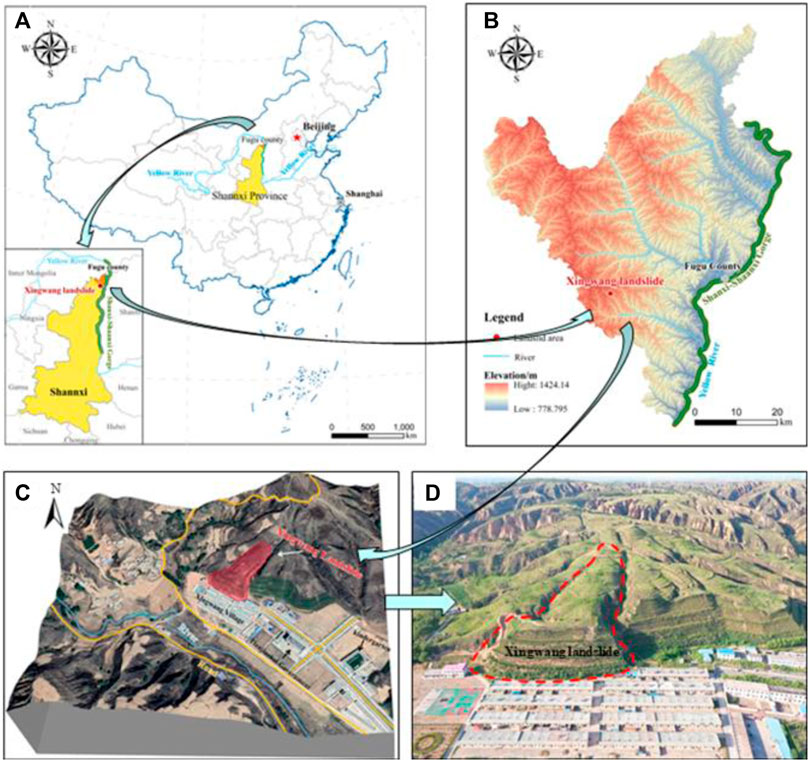
Figure 1. Location and image of Xingwang landslide: (A) and (B) Location of landslide; (C) Image of landslide area; (D) A photo of landslide area.
The landslide is located on a loess slope northeast of Xingwang Village (Figure 2), with a total length of about 300 m, an average width of about 90 m, an average thickness of about 32 m, the height is about 38m, and the volume is about 4.37515 × 10⁵ m3. The main sliding direction is about 210°. The sliding body is tongue shaped on the plane, and due to the influence of engineering excavation, the front edge of the slope is steep with a slope of about 45°. The upper part of the slope is relatively flat, about 5°–10°, with gullies on both sides as the boundary (Figure 2A).
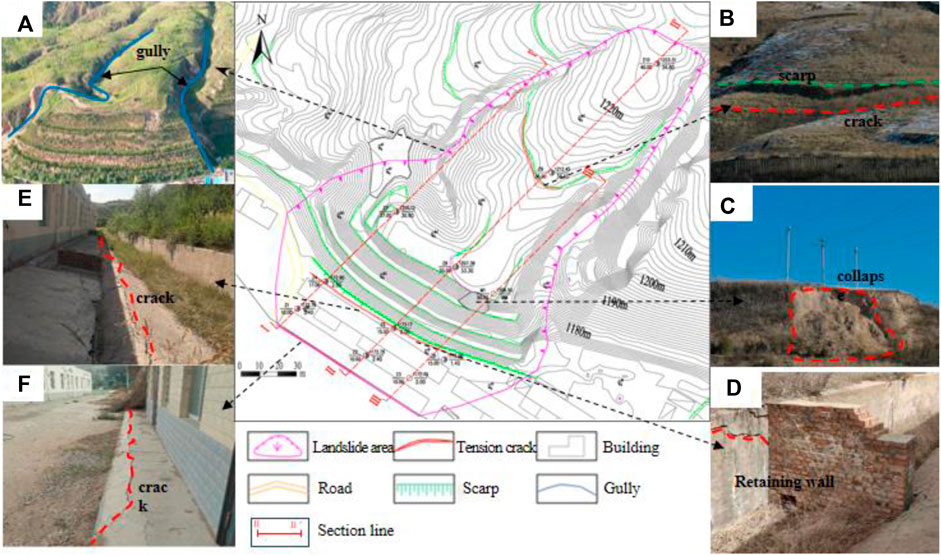
Figure 2. Details of the Xingwang landslide: (A) Gullies on both sides of the landslide; (B) scarp and cracks at the rear edge; (C) Collapse of the steep slope at the front edge; (D) Cracks at the retaining wall; (E) Cracks at the slope foot; (F) Cracks at the house floor.
Over the past 10 years, two tensile cracks with a width of 5–10 cm and a length of about 12 m have appeared at the rear edge of the landslide (Figure 2B). Local collapse has occurred at the top of the steep slope at the front edge (Figure 2C), and the original retaining wall has undergone bulging deformation and cracking (Figure 2D). The horizontal ground at the foot of the slope has raised and cracked (Figures 2E, F). The first row of houses near the foot of the slope threatened by the landslide have also gradually deformed and cracked locally. All these signs of deformation indicate that the Xingwang landslide is in a stage of creep deformation.
Drilling data shows that the Xingwang landslide is a loess landslide, with the sliding body mainly composed of Quaternary loess (Figure 3).In addition; the sliding surface near the shear outlet exhibits an anti-tilting characteristic and intersects with the ground water level (Figure 3).
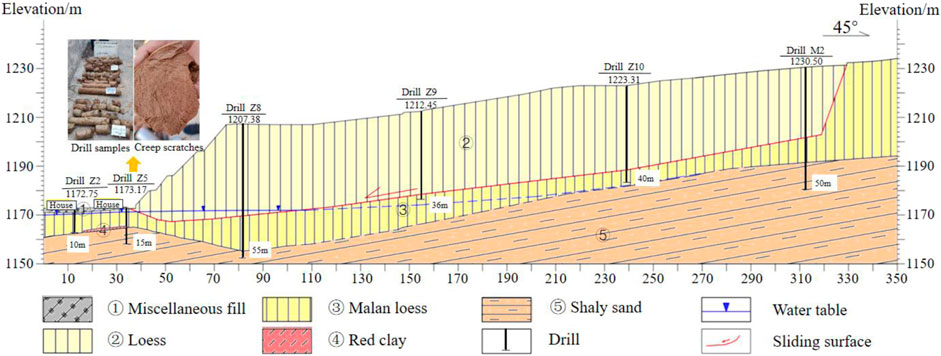
Figure 3. Geological profile of section II-IIʹ of Xingwang landslide. The location of the section is shown in Figure 2.
At the foot of the landslide slope, there are four rows of buildings, each row of 13 houses, all of which are single-storey brick-concrete structures (as shown in Figure 1D). Each room is 7 m wide, 10 m long and 4 m high, with a foundation depth of 0.6 m. The roofs of the houses are 120 mm thick cast-in-place concrete floors, and the walls are 240 mm thick ordinary sintered brick walls. The cross-section size of the structure column and ring beam is 240 mm × 240 mm, and the built-in longitudinal reinforcement bar is made of 4 bars with the diameter of 12. The stirrup adopts the model diameter of 6 steel bars, and the encryption spacing is 150 mm. The hoop reinforcement is made of steel bars with a diameter of 6, with an increased spacing of 150 mm.
The calibration of mesoscopic parameters in the PFC3D determines the performance and accuracy of the landslide simulation, which is a key step in model construction, as well as characterizing the macroscopic mechanical properties of the landslide soils. The main mesoscopic parameters include particle density, particle size, normal stiffness, tangential stiffness, friction coefficient, etc. The inversion trial and error method is usually used to conduct numerical triaxial tests on soil mass with calibrated initial mesoscopic parameters of particles. When the test results are consistent with the physical and mechanical test results in laboratory, these mesoscopic parameters are applied to the construction of landslide numerical models (Wu et al., 2023).
In this paper, the corresponding stress-strain curves under different confining pressures were obtained through laboratory tests (Figure 4A), the Mohr’s stress circle and Mohr’s-Coulomb strength envelope were plotted (Figure 4B), and the macroscopic parameters of the landslide soil mass under saturated conditions were obtained - internal friction angle (13.2°) and cohesive force (11.8 kPa). Numerical triaxial tests were carried out in PFC3D (Figure 4C). After multiple calculations, when the macroscopic shear strength of soil mass obtained by numerical tests is consistent with that obtained by laboratory tests, the current microscopic parameters of particles can be used to build a landslide model (Table 1).
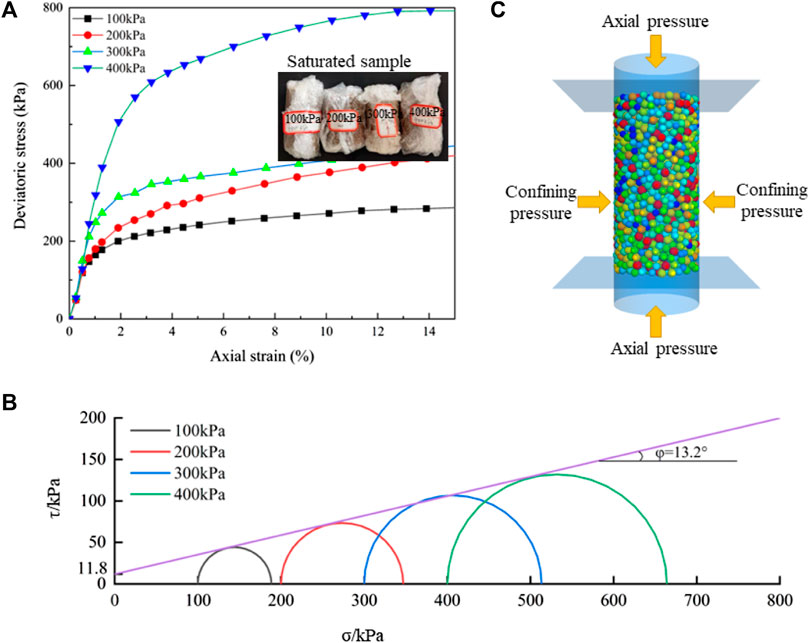
Figure 4. (A) Stress-strain curve; (B) Numerical simulation model of triaxial compression test; (C). Mohr stress circle and Mohr-Coulomb strength envelope.

Table 1. Mesoscopic parameters of the landslide in PFC model.
For the buildings, considering that these houses are all single story and brick concrete structures, the RBlock module in PFC software was chosen for building modeling, and the mortar material was replaced by the bonding between bricks. The parameters for modeling have been detailed in another research paper of the author (Zhao et al., 2023), and the relevant parameter values are shown in Table 2.
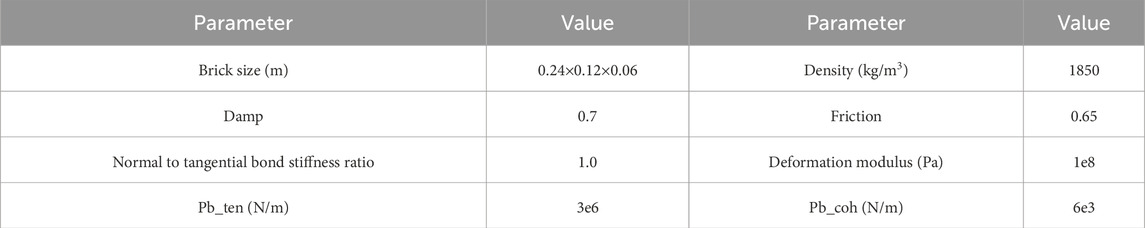
Table 2. Parameters related to the brick house model.
The detailed technical scheme for constructing landslide models has been listed in in two other papers by the author (Zhao et al., 2023; Wei et al., 2019), and will not be elaborated here. The main steps include: Firstly, the DEM data of landslide area was obtained through field survey and UAV mapping, and the sliding surface DEM was generated in ArcGIS by analyzing the drill data. Then, integrate the above two DEM data to produce a complete landslide grid model. Finally, the grid model is imported into the PFC3D system to complete the construction of the landslide three-dimensional numerical model. Considering the limitation of computer performance, 274,505 particles with size between 0.3 and 1.0 m were randomly generated to simulate the landslide body, of which 12 particles were used as monitoring particles (as shown in Figure 5A). And then, the combination model of landslide and buildings was established by using the RBlock module in PFC, combined with the UAV surveying information and the house characteristics shown in Table 2 (the model is shown in Figure 5B).
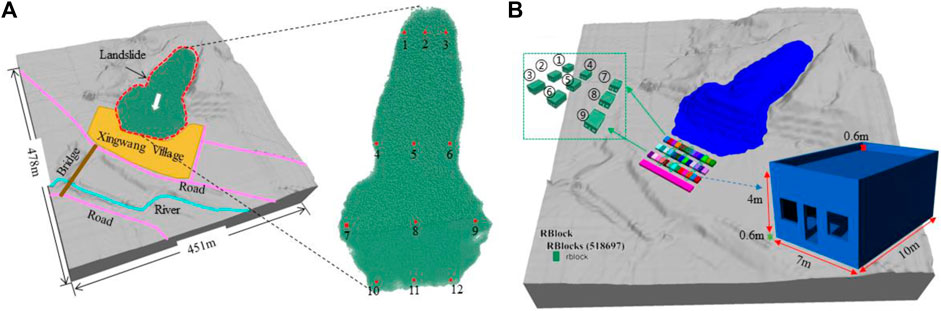
Figure 5. (A) Landslide model, the number represents the serial number of the monitored red particles; (B) Combined model of landslide and buildings, with houses in small windows specifically designed to analyze the impact damage of landslide.
In order to compare with the results of house damage based on discrete element model (PFC model), a house model of the same size is produced based on ABAQUS finite element program to simulate and predict the overall deformation and damage of the houses. Considering the limitation of calculation performance, this paper uses the integral modeling method in ABAQUS to simulate the house located on the main sliding section. In this study, according to the characteristics of buildings investigation, the concrete with strength grade of C25 is selected for building model. In terms of reinforcement, HRB400 was selected for longitudinal reinforcement and HRB335 for stirrup reinforcement. The blocks were selected as sintered ordinary bricks with grade MU10 strength, while the mortar was selected with grade M5 strength. The relevant parameters of the house model are shown in Table 3 and Table 4, and the model is shown in Figure 6.
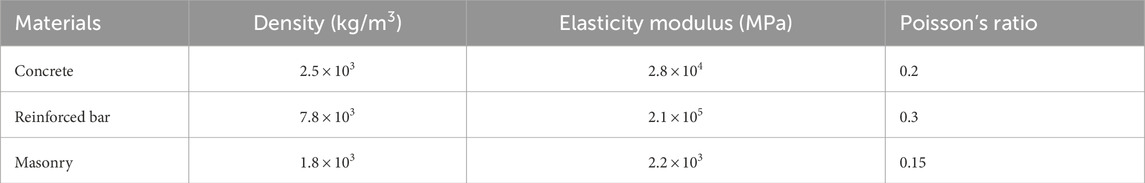
Table 3. Main parameters of building materials.
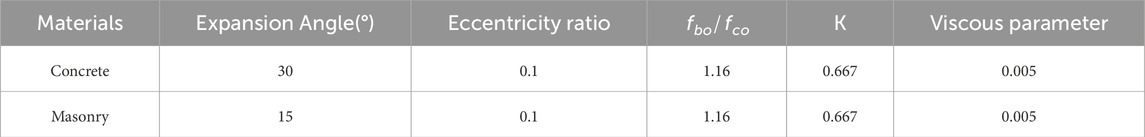
Table 4. The parameters of houses numerical model.
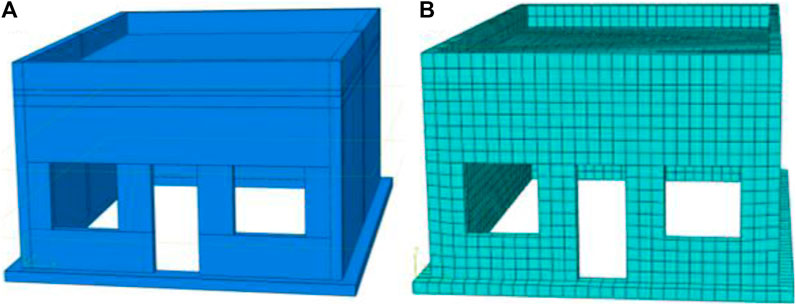
Figure 6. The model produced from ABAQUS: (A) solid model; (B) grid model.
The simulation of the whole process of Xingwang landslide movement and impact damage to houses is shown in Figure 7.
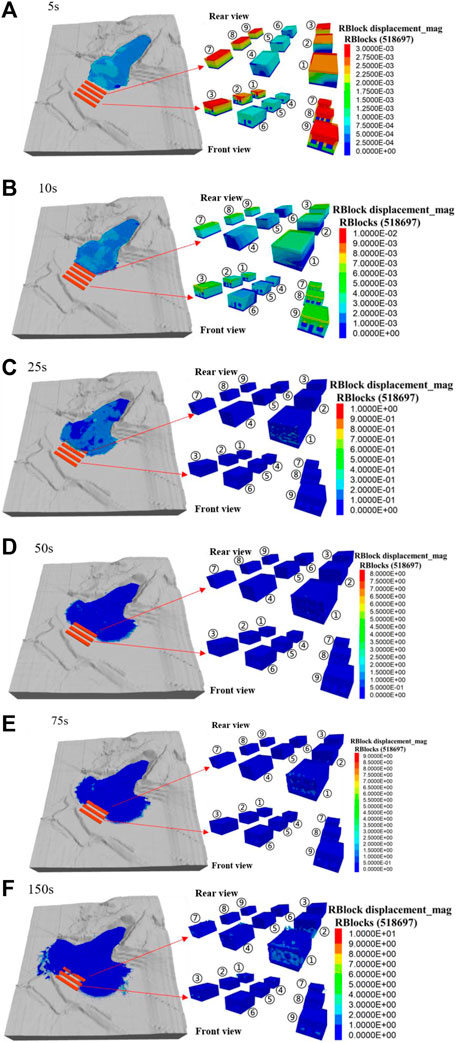
Figure 7. Cloud maps of landslide movement and houses displacement at different times. (A–F) correspond to the cloud maps of landslide and house displacement at times of 5 s, 10 s, 25 s, 50 s, 75 s, and 150 s, respectively.
According to the analysis of the velocity and displacement curves of the monitored particles (as shown in Figure 8), the average peak velocity of the Xingwang landslide is 2.01 m/s, and the average maximum displacement reaches 73.7 m (Figure 9A), this happens to be the distance where the back wall of the fourth row house is located. Compared with the calculated results of the Empirical model, frictional model (Scheidegger,1973; Seng, 1989) and the Li model (Li and Wang, 1989), the maximum velocity and displacement at different reach positions in Figure 9A are both smaller than the calculated values (Table 5; Table 6). The displacement obtained from PFC model is close to the calculation results of empirical model and Li model, while Li models consider the slide conditions. Therefore, the blocking effect of the houses on landslide reduces the maximum displacement, and the influence on landslide velocity is particularly obvious. On the other hand, as a kind of granular material, the collision and friction between the particles of loess dissipate energy in the process of landslide movement, which reduces the kinetic energy, resulting in a decrease in the maximum velocity and displacement.
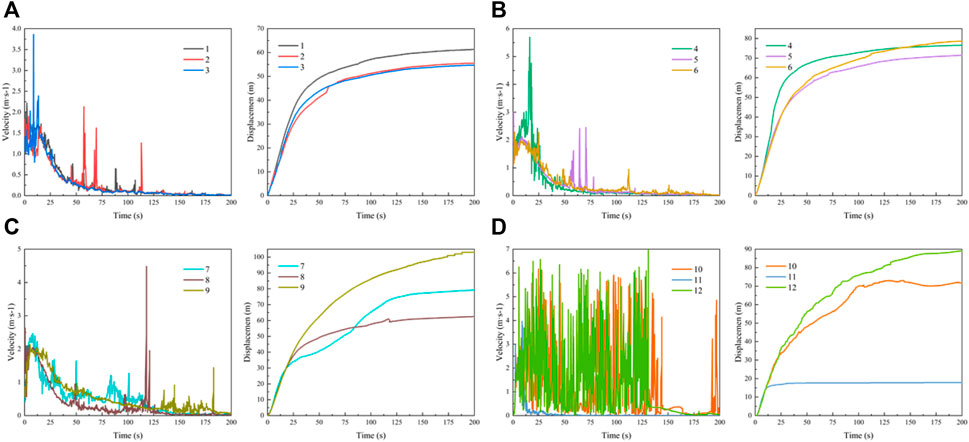
Figure 8. Velocity and displacement curves of the monitored particles: (A) Particle 1, 2, and 3; (B) Particle 4, 5, and 6; (C) Particle 7, 8, and 9; (D) Particle 10, 11, and 12. The monitored particles are shown in Figure 5A.
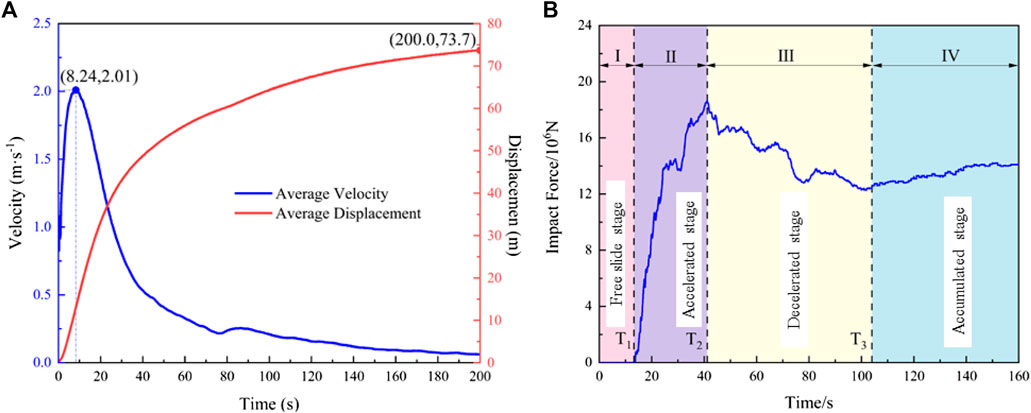
Figure 9. Average velocity, displacement and impact force curves of landslide: (A) Average velocity and displacement; (B) Impact force.
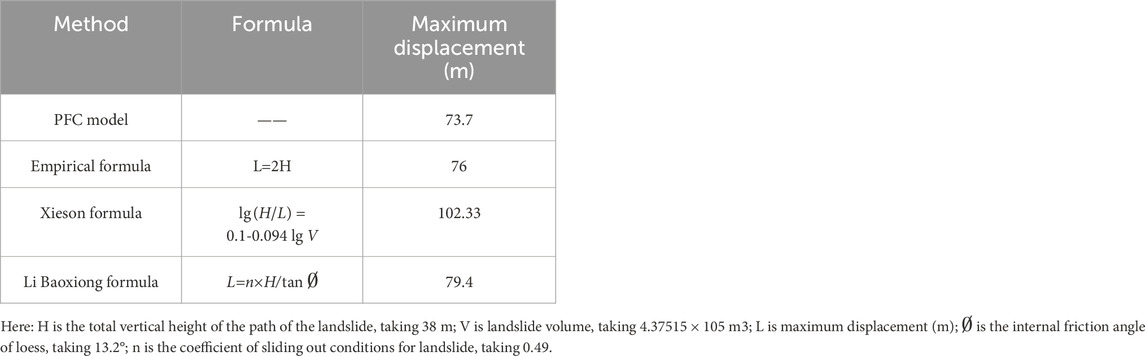
Table 5. List of landslide maximum displacement.
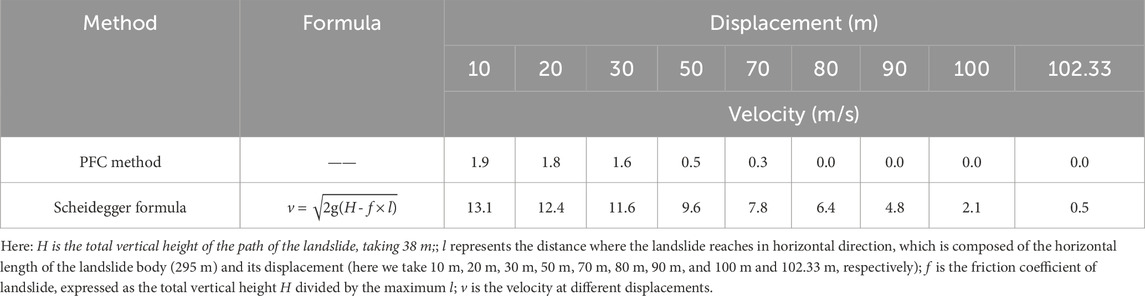
Table 6. List of landslide velocity at different displacement.
The impact force of landslide is a key index to evaluate the vulnerability of the elements at risk. By using PFC model, rigid walls are constructed at different positions of slope foot to monitor the impact force of landslide. Figure 9B shows the dynamic variation of the impact force on the rigid wall (8 m high and 60 m wide) at the first row of houses, and the maximum force is about 19 × 106 N. When the landslide stops moving, the impact force is constant at about 14.5 × 10⁶ N. The results of landslide impact force change with time are basically consistent with those of Shen et al. (2018), Zhao et al. (2023).
Compared with the dry granular flow impact tests (Jiang et al., 2020), the normal impact force (Fn) calculation model is shown in Eq. 1.
In Eq. 1, ρd is the dynamic density (kg·m−3), v is the averaged velocity (m·s−1), b is the chute width (m), h0 is the thickness of the flowing layer (m), k is the earth pressure coefficient, ρs is the static density (kg·m−3), g is gravitational acceleration (m·s−2), and h1 is depth measured vertically down from the front of the free surface (m). According to Eq. 1, for the Xingwang landslide, k is equal to 1 (Ashwood and Hungr, 2016), ρd and ρs are 1580 kg.m−3, g equals 9.81 m.s−2, b is a unit width of 60 m, h0 = 1.0 m, h1 = 8.0 m. Thus,
This study selects three houses from each row of the buildings in front of the slope for analysis the damage induced from landslide (1 house in the east, 1 house in the middle, and 1 house in the west, as shown in Figure 5B). From the simulation of building damage (as shown in Figure 7), the landslide began to impact the first row of houses after 10 s of movement (Figure 7B), and the deformation of the wall gradually expanded from the foot to the top, but there was no significant displacement at this time. After 25 s, the impact strength of the landslide gradually increased, and the deformation of the first row of house walls intensified, causing the bricks are sunken inward (Figure 7C). After 50 s, the first row of houses is completely buried, and the maximum displacement of some bricks reached 8.2 m, while the foot of the second row of houses began to deform (Figure 7D). At 75 s, the landslide soil flooded into the first row of houses, and the deformation of the second row of houses intensified (Figure 7E). After 150 s, the sliding motion gradually stops. At this time, the first and second rows of houses at the foot of the slope were severely damaged, with some bricks reaching a maximum displacement of 10.3 m, and most of the brick displacement was distributed between 0.1 and 2.5 m. The third row of houses is not as severely damaged as the first two rows, with only part of the brick detached from the wall at the window area and some landslide soil pouring into the houses (Figure 7F).
In order to compare with the house damage prediction simulated by discrete element model, the finite element system ABAQUS is used to construct a new house model (Figure 6). Firstly, we need to analyze the distribution characteristics of landslide impact force at different heights to determine the load of the wall per unit area. Because the impact force in Figure 9B is a dynamic force, we need to convert it into an equivalent impact force by using Eqs 2, 3.
where: T1 is the time when the landslide starts to move (s); T3 is the time when the landslide stops moving (s); E is landslide impulse (N·s); S is the area under the impact force curve (N·s); f (t) is to monitor the horizontal impact force (N); F is the equivalent impact force (N). The impact forces at different heights of rigid walls in Figure 9B are shown in Figure 10A. According to Eqs 1, 2, the fitting curves of the equivalent impact force of landslide at different heights of the wall are shown in Figure 10B. The linear relationship between the equivalent impact force and the height is: F = - 1.54 × 10⁶ × Hi + 1.96 × 10⁷ (R2 = 0.98) and the horizontal load is p = −17111.11 × Hi + 217,778, with the maximum impact load being 2.18 × 10⁵Pa. The results demonstrate that the equivalent impact force increases with the height of the wall. Then, we apply the horizontal load to the house model in Figure 6, and the result of house damage is shown in Figure 11.
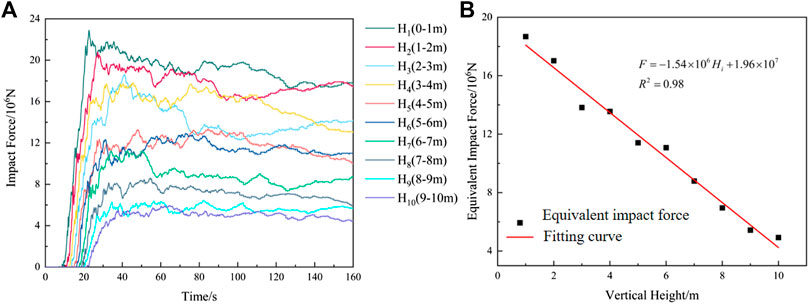
Figure 10. Characteristics of landslide impact force in height direction: (A) curves of dynamic impact force at different heights; (B) the fitting curve of equivalent impact force and height.
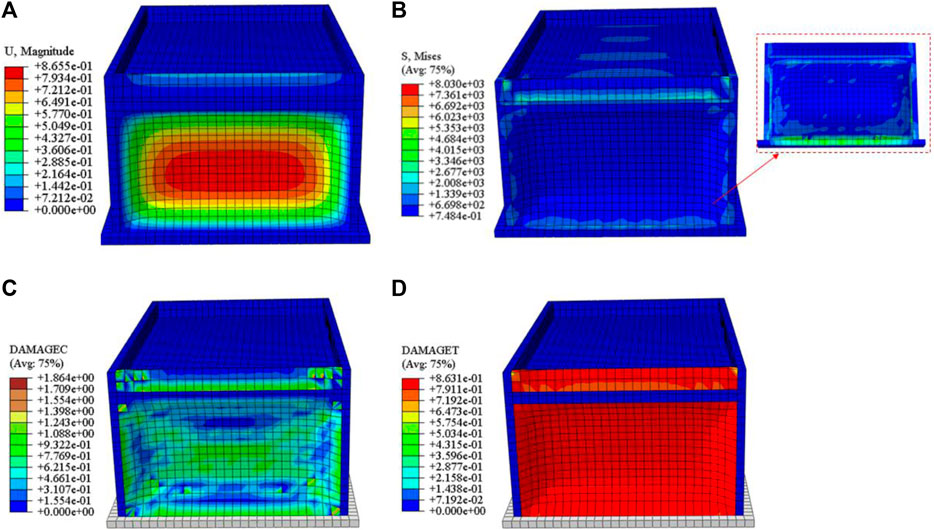
Figure 11. Cloud maps of house damage based on finite element model: (A) Displacement cloud map; (B) Stress cloud map, right red box (inset): stress distribution inside the impacted wall; (C) compression damage cloud map; (D) Tensile damage cloud map.
The simulation results show that the wall moves towards the interior of the room after being impacted by the landslide, with a maximum displacement of 0.87 m (Figure 11A), and a maximum stress of 8.03 Mpa at the foot of the wall (Figure 11B). A large area of compressive and tensile damage occurs around the wall impacted by the landslide (Figures 11C, D), which is completely consistent with the deformation and failure characteristics of the houses at the foot of the Xingwang landslide (Figure 12). Due to the integral modeling method, the simulation results cannot display the collapse situation of the house. However, from the displacement cloud map, stress cloud map, compression and tensile damage cloud map of the wall impacted by landslide, it can be seen that the house located in the first row at the foot of the slope will inevitably collapse and be damaged.
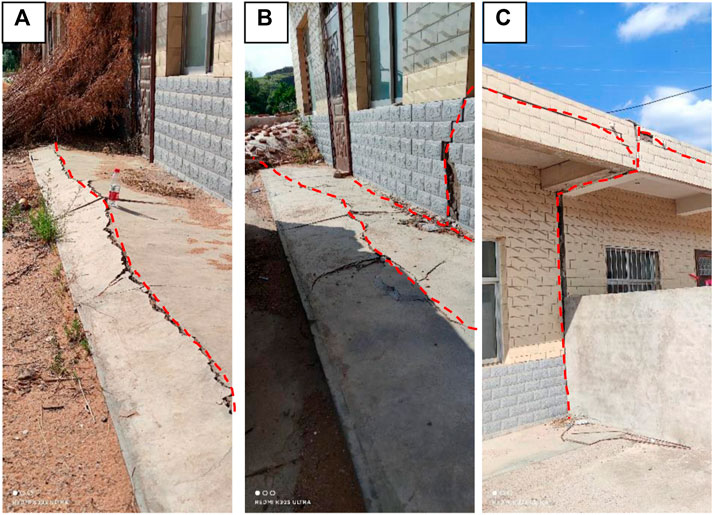
Figure 12. Actual deformation and damage of houses: (A) and (B) The shear cracks at the foot of the wall; (B) and (C) The tensile cracks at the roof and structural columns.
Based on the above research, the dynamic process of the Xingwang loess landslide was simulated using the discrete element method, with a focus on predicting the consequences of landslide damage to buildings using both discrete element and finite element models. Through comparative analysis, the following conclusions can be drawn.
(1) According to the results of discrete element simulation, most of the displacements of wall bricks are between 0.1 and 2.5 m, and the maximum is 10.3 m. The finite element model reveals the displacement, stress and strain characteristics of the building under the landslide impact. The maximum displacement of the building is 0.87 m, the stress around the wall is the most concentrated, and the deformation and damage are the most obvious, which is basically consistent with the field investigation.
(2) From the simulation results, the Xingwang landslide will cause serious damage to the houses at the foot of the slope, and there is a greater safety risk. Measures such as monitoring, early warning and engineering treatment should be taken to reduce the occurrence of landslide accidents and ensure the safety of residents’ lives and property.
(3) The research shows that the discrete element method is suitable for the simulation of the dynamic process of loess landslide, and can accurately predict the dynamic indexes such as the velocity and displacement of landslide, but it is not perfect in the analysis of the overall damage of houses. The finite element model can well simulate the deformation and failure characteristics of masonry structure and the whole buildings, but the loading force is static force, and how to simulate the dynamic impact process of landslide on the buildings is still worthy of further study.
(4) This study improves the necessary reference for loess landslide risk assessment using discrete element method and the finite element method, especially the quantitative prediction of vulnerability for the buildings. However, there are some limitations in the study of this paper. For example, it fails to establish a full simulation model for all buildings due to the limitation of calculation performance. These deficiencies are also the focus of our next research.
The original contributions presented in the study are included in the article/Supplementary Material, further inquiries can be directed to the corresponding author.
ZZ: Investigation, Methodology, Project administration, Validation, Writing–original draft, Writing–review and editing. YZ: Software, Writing–original draft. XC: Software, Writing–review and editing. JW: Software, Writing–review and editing. JM: Investigation, Writing–review and editing. HT: Investigation, Writing–review and editing. FL: Investigation, Writing–review and editing.
The author(s) declare that financial support was received for the research, authorship, and/or publication of this article. This work was supported by the Scientific Research Project of Geological Research Institute for Coal Green Mining, Xi’an University of Science and Technology (MTy2019-22).
The authors declare that the research was conducted in the absence of any commercial or financial relationships that could be construed as a potential conflict of interest.
All claims expressed in this article are solely those of the authors and do not necessarily represent those of their affiliated organizations, or those of the publisher, the editors and the reviewers. Any product that may be evaluated in this article, or claim that may be made by its manufacturer, is not guaranteed or endorsed by the publisher.
Ashwood, W., and Hungr, O. (2016). Estimating total resisting force in flexible barrier im-pacted by a granular avalanche using physical and numerical modeling. Can. Geotechnical J. 53 (10), 1700–1717. doi:10.1139/cgj-2015-0481
Chang, W., Xu, Q., Dong, X., Zhuang, Y., Xing, A., Wang, Q., et al. (2022). Dynamic process analysis of the Xinmo landslide via seismic signal and numerical simulation. Landslides 19 (6), 1463–1478. doi:10.1007/s10346-022-01876-w
Chen, X. (2022). Prediction study of movement characteristics and impact intensity of accumulation landslide of southern Shaanxi-Taking Fenghuang Street landslide in Ningqiang County as an example. Thesis. China: XI'an University of Science and Technology.
Delaney, K., and Evans, S. (2015). The 2000 Yigong landslide (Tibetan Plateau), rockslide-dammed lake and outburst flood: review, remote sensing analysis, and process modelling. Geomorphology 246, 377–393. doi:10.1016/j.geomorph.2015.06.020
Gao, Y., Li, B., Gao, H., Gao, S., Wang, M., and Liu, X. (2023). Risk assessment of the Sedongpu high-altitude and ultra-long-runout landslide in the lower Yarlung Zangbo River, China. Bull. Eng. Geol. Environ. 82 (9), 360. doi:10.1007/s10064-023-03374-2
Hu, X., Fan, X., and Tang, J. (2019). Accumulation characteristics and energy conversion of high-speed and long-distance landslide on the basis of DEM: a case study of Sanxicun landslide. J. Geomech. 25 (4), 527–553. doi:10.12090/j.issn.1006-6616.2019.25.04.051
Ji, Q., Liang, Y., Xie, F., Yu, Z., and Wang, Y. (2024). Automatic and efficient detection of loess landslides based on deep learning. Sustainability 16 (3), 1238. doi:10.3390/su16031238
Jiang, Y. J., Fan, X. Y., Su, L. J., Xiao, S. Y., Sui, J., Zhang, R. X., et al. (2020). Experimental validation of a new semi-empirical impact force model of the dry granular flow impact against a rigid barrier. Landslides 18 (4), 1387–1402. doi:10.1007/s10346-020-01555-8
Jordan, A., and Oldrich, H. (2016). Dynamic simulation of the motion of partially-coherent landslides. Eng. Geol. 205, 1–11. doi:10.1016/j.enggeo.2016.02.006
Li, B., Zhu, Y., Qi, F., and Yuan, Z. (2021). Failure of an under-dip shale slope and its response under excavation conditions. J. Eng. Res. 9 (1), 63–72. doi:10.36909/jer.v9i1.8111
Li, B. X., and Wang, D. K. (1989). A new theory of space forecast for loess landslides. J. Gansu Sci. 10 (3), 57–58. doi:10.16468/j.cnki.issn1004-0366.1998.03.014
Li, D., Zheng, D., Wu, H., Shen, Y., and Nian, T. (2021). Numerical simulation on the longitudinal breach process of landslide dams using an improved coupled DEM-CFD method. Front. EARTH Sci. 9, 673249. doi:10.3389/feart.2021.673249
Li, P., Shen, W., Hou, X., and Li, T. (2019). Numerical simulation of the propagation process of a rapid flow-like landslide considering bed entrainment: a case study. Eng. Geol. 263, 105287. doi:10.1016/j.enggeo.2019.105287
Liu, Z. Y., and Kang, W. L. (1986). Mechanism analysis of high-speed sliding of Jiangliu landslide in Jingyang County. Soil Water Conservation China 1986 (02), 19–21. doi:10.14123/j.cnki.swcc.1986.02.006
Lo, C. M., Lin, M. L., Tang, C. L., and Hu, J. C. (2011). A kinematic model of the Hsiaolin landslide calibrated to the morphology of the landslide deposit. Eng. Geol. 123 (1–2), 22–39. doi:10.1016/j.enggeo.2011.07.002
Luo, H., Zhang, L., Wang, H., and He, J. (2021). Process of building collapse caused by the Po Shan Road landslide in Hong Kong on 18 June 1972. Landslides 18, 3769–3780. doi:10.1007/s10346-021-01745-y
Luo, H., Zhang, L., and Zhang, L. (2019). Progressive failure of buildings under landslide impact. Landslides 16, 1327–1340. doi:10.1007/s10346-019-01164-0
Luo, J., Pei, X., Evans, S., and Huang, R. (2019). Mechanics of the earthquake-induced hongshiyan landslide in the 2014 Mw 6.2 ludian earthquake, yunnan, China. Eng. Geol. 251, 197–213. doi:10.1016/j.enggeo.2018.11.011
Ma, S., Xu, C., Shao, X., Xu, X., and Liu, A. (2021). A large old landslide in sichuan Province, China: surface displacement monitoring and potential instability assessment. Remote Sens. 13 (13), 2552. doi:10.3390/rs13132552
McDougall, S. (2006). A new continuum dynamic model for the analysis of extremely rapid landslide motion across complex three-dimensional terrain. Thesis. CA: The University of British Columbia.
Monia, E. M., Massimiliano, C., and Claudia, M. (2014). r.massmov: an open-source landslide model for dynamic early warning systems. Natrual Hazards 70, 1153–1179. doi:10.1007/s11069-013-0867-8
Mreyen, A., Donati, D., Elmo, D., Donze, F., and Havenith, H. (2022). Dynamic numerical modelling of co-seismic landslides using the 3D distinct element method: insights from the Balta rockslide (Romania). Eng. Geol. 307, 106774–106790. doi:10.1016/j.enggeo.2022.106774
Peng, J., Wang, S., Wang, Q., Zhuang, J., Huang, W., Zhu, X., et al. (2019). Distribution and genetic types of loess landslides in China. J. Asian Earth Sci. 170, 329–350. doi:10.1016/j.jseaes.2018.11.015
Peng, J., Wu, D., Duan, Z., Tang, D., Cheng, Y., Che, W., et al. (2016). Disaster characteristics and destructive mechanism of typical loess landslide cases triggered by human engineering activities. J. Southwest Jiaot. Univ. 51 (05), 971–980. doi:10.3969/j.issn.0258-2724.2016.05.021
Sabeti, R., Heidarzadeh, M., Romano, A., Ojeda, G., and Lara, J. (2024). Three-dimensional simulations of subaerial landslide-generated waves: comparing OpenFOAM and FLOW-3D HYDRO models. Pure Appl. Geophys. 181, 1075–1093. doi:10.1007/s00024-024-03443-x
Scheidegger, A. E. (1973). On the prediction of the reach and velocity of catastrophic landslides. Rock Mech. 5 (4), 65–236. doi:10.1016/0148-9062(74)91709-4
Seng, X. K. (1989). Translated by Wang N. Q. Geomorphologic prediction of landslide movement distance. Railw. Geol. Subgrade 3, 42–∼47.
Shen, W., Zhao, T., Zhao, J., Dai, F., and Zhou, G. (2018). Quantifying the impact of dry debris flow against a rigid barrier by DEM analyses. Eng. Geol. 241, 86–96. doi:10.1016/j.enggeo.2018.05.011
Song, K., Ruan, D., Lyu, H., Han, L., and Huang, H. (2023). Material point method-based simulation and dynamic characteristic analysis of instability-induced landslide movement: a case study of the Yanguan landslide in the Three Gorges Reservoir area. Coal Geol. Explor. 51 (7), 140–150. doi:10.12363/issn.1001-1986.22.11.0897
Tang, C. L., Hu, J. C., Lin, M. L., Angelier, J., Lu, C. Y., Chan, Y. C., et al. (2009). The Tsaoling landslide triggered by the Chi-Chi earthquake, Taiwan: insights from a discrete element simulation. Eng. Geol. 106 (1-2), 1–19. doi:10.1016/j.enggeo.2009.02.011
Wang, G., Gong, W., Xing, L., and Li, B. (2023). Model tests of run-out and deposition process of landslide debris considering influence of deposition zone width. J. Eng. Geol. 31 (5), 1637–1647. doi:10.13544/j.cnki.jeg.2022-0117
Wang, H., Liu, S., Xu, W., Yan, L., Qu, X., and Xie, W. (2020). Numerical investigation on the sliding process and deposit feature of an earthquake-induced landslide: a case study. Landslides 17 (1), 2671–2682. doi:10.1007/s10346-020-01446-y
Wei, J., Zhao, Z., Xu, C., and Wen, Q. (2019). Numerical investigation of landslide kinetics for the recent Mabian landslide (Sichuan, China). Landslides 16 (7), 2287–2298. doi:10.1007/s10346-019-01237-0
Wu, F., Sun, W., Li, X., Guan, Y., and Dong, M. (2023). Material point method-based simulation of dynamic process of soil landslides considering pore fluid pressure. Int. J. Numer. Anal. Methods Geomechanics 47 (13), 2385–2404. doi:10.1002/nag.3581
Wu, J., and Hsieh, P. (2021). Simulating the postfailure behavior of the seismically-triggered Chiu-fen-erh-Shan landslide using 3DEC. Eng. Geol. 287, 106113. doi:10.1016/j.enggeo.2021.106113
Wu, M., Hu, A., Zhou, S., Mao, X., and Fei, W. (2023). Research on calibration method of microscopic parameters of siltstone based on gray theory. Sci. Rep. 13, 15802. doi:10.1038/s41598-023-43008-x
Xiao, H., and Lin, P. (2016). Numerical modeling and experimentation of the dam-overtopping process of landslide-generated waves in an idealized mountainous reservoir. J. Hydraulic Eng. 142 (12), 04016059. doi:10.1061/(ASCE)HY.1943-7900.0001203
Xu, Y., Fan, X., Yang, W., and Wang, J. (2023). Analysis of motion process and dynamic parameters of high-speed and long-distance landslide in shuicheng, guizhou Province. J. Disaster Prev. Mitig. Eng. 43 (5), 987–998. doi:10.13409/j.cnki.jdpme.20220109002
Yan, Y. Z., Liu, G., Yang, X. Y., and Huang, D. (2018). Process simulation of the Sale Mountain landslide based on continuum-based discrete element method. J. Lanzhou Univ. Nat. Sci. 54 (06), 744–752. doi:10.13885/j.issn.0455-2059.2018.06.005
Zabuski, L., and Marcato, G. (2020). Analysis of potential landslide processes in the passo della Morte (carnian alps, Italy). Geol. Q. 64 (3), 681–691. doi:10.7306/gq.1552
Zhang, C., Ma, M., Shan, W., and Guo, Y. (2024). Process and numerical simulation of landslide sliding caused by permafrost degradation and seasonal precipitation. Nat. Hazards 120 (6), 5429–5458. doi:10.1007/s11069-024-06433-3
Zhang, S., Huang, X., Cheng, Y., and Shen, B. (2022). Near and far field division of landslide surge and analysis of water wave characteristics. J. Changjiang River Sci. Res. Inst. 39 (5), 76–82. doi:10.11988/ckyyb.20201283
Zhao, Z. (2013). Study on landslide risk management of county region in southern mountainous area of Shaanxi Province. Thesis. China: XI'an University of Science and Technology.
Zhao, Z., Chen, X., Wei, J., Ma, J., and Ye, W. (2023). Numerical study on landslide dynamic process and its impact damage prediction to brick-concrete buildings, a case from Fenghuang street landslide in Shaanxi, China. Front. Earth Sci. 10, 1004710. doi:10.3389/feart.2022.1004710
Keywords: loess landslide, dynamic process, impact damage to houses, simulation and prediction, the discrete element method, the finite element method
Citation: Zhao Z, Zhang Y, Chen X, Wei J, Ma J, Tang H and Liu F (2024) Simulation and prediction of dynamic process of loess landslide and its impact damage to houses. Front. Earth Sci. 12:1434519. doi: 10.3389/feart.2024.1434519
Received: 18 May 2024; Accepted: 28 June 2024;
Published: 26 July 2024.
Edited by:
Chong Xu, Ministry of Emergency Management, ChinaReviewed by:
Yulong Cui, Anhui University of Science and Technology, ChinaCopyright © 2024 Zhao, Zhang, Chen, Wei, Ma, Tang and Liu. This is an open-access article distributed under the terms of the Creative Commons Attribution License (CC BY). The use, distribution or reproduction in other forums is permitted, provided the original author(s) and the copyright owner(s) are credited and that the original publication in this journal is cited, in accordance with accepted academic practice. No use, distribution or reproduction is permitted which does not comply with these terms.
*Correspondence: Zhou Zhao, emhhb3pob3VAeHVzdC5lZHUuY24=
Disclaimer: All claims expressed in this article are solely those of the authors and do not necessarily represent those of their affiliated organizations, or those of the publisher, the editors and the reviewers. Any product that may be evaluated in this article or claim that may be made by its manufacturer is not guaranteed or endorsed by the publisher.
Research integrity at Frontiers
Learn more about the work of our research integrity team to safeguard the quality of each article we publish.