 Jia Mei Liu
 Bin Zhang
 Xu Dong Zhao
95% of researchers rate our articles as excellent or good
Learn more about the work of our research integrity team to safeguard the quality of each article we publish.
Find out more
ORIGINAL RESEARCH article
Front. Earth Sci. , 15 July 2024
Sec. Geohazards and Georisks
Volume 12 - 2024 | https://doi.org/10.3389/feart.2024.1434194
This article is part of the Research Topic Prevention, Mitigation, and Relief of Compound and Chained Natural Hazards Volume II View all 14 articles
There is little available attenuation relationship for Arias Intensity (AI) in China. Empirical relationships between AI and peak ground acceleration (PGA) provide another option for predicting AI. We establish empirical relationships for AI and PGA for western China, utilizing 3,169 horizontal and 979 vertical strong motion records with PGA ≥0.01 g from 274 earthquakes (MS 4.0–8.0), originating in eight provinces in southwest (Yunnan, Sichuan) and northwest China (Gansu, Shaanxi, Ningxia, Qinghai, Inner Mongolia, and Xinjiang). The influences of MS epicenter distance, and site conditions indicators VS30, generic site classes (i.e., rock and soil) are explored. The results show that the logarithm of AI increases linearly with the increase of the logarithm of PGA and MS, and decreases with the logarithm of VS30. However, the influence of site conditions on AI-PAG relationships can't be recognized by the simple generic rock and soil site classes. The epicenter distance has little effect on the AI-PAG relationships. Empirical relationships are developed to estimate horizontal or vertical AI as a function of PGA (basic model), PGA and MS (model 2) for southwest, northwest, and western China, using all the records. Empirical relationships for AI as a function of PGA, MS, and VS30 (model 1) are established using the 2,248 horizontal (70.9% of the total) and 670 vertical (68.4% of the total) records with VS30 between 148 and 841m/s. The notable disparity between model 1 of the southwest and northwest regions is chiefly attributed to local site conditions, indicating that the AI-PGA correlation is region-dependent. These findings enable one way of estimating AI for western China and will contribute to a better understanding of AI attenuation.
As a mandatory national standard that is currently in force, the national seismic hazard maps of China (GB 18306–2015) employed the attenuation relationships for peak ground acceleration (PGA) developed using the transform method (Yu and Wang, 2007). This is mainly due to the lack of strong motion recordings and sparse distribution of strong ground motion stations, which limits the establishment of attenuation relations through regression analysis. Benefiting from the National Strong Motion Observation Network System (NSMONS) of China, which has been in formal operation since 2008, a large number of high quality strong motion recordings have been obtained in the past decade or so (Ji et al., 2017; Xie et al., 2022). In recent years, the China Earthquake Administration has proposed the Next-Generation Attenuation project. As part of a broader effort to update national seismic hazard maps of China, this project aims to develop ground motion prediction equations (GMPEs) that incorporate broadband and multiple ground motion intensity parameter, such as PGA, peak ground velocity (PGV), peak ground displacement (PGD), response spectral and AI (Arias, 1970; Chousianitis et al., 2016; Zach et al., 2017).
For some widely used parameters in China, such as PGA, PGV, 5% damped response spectrum, some researchers (Li et al., 2020a; Zhang et al., 2021; Zhang et al. 2022; Zhang et al. 2023) investigated the influences of magnitude, rupture distance, fault types, site amplification and hanging-wall scaling on ground motions, and developed GMPEs for southwest China and capital circle region of China. These models incorporate parameters such as magnitude, geometric attenuation, anelastic attenuation, hanging-wall effect, and linear/nonlinear site response terms to improve the accuracy of ground motion predictions. However, in the case of AI, there is very little available attenuation relationship for this intensity measure in China (Liu et al., 2018). Lee et al. (2012) developed a regional AI attenuation relationship for Taiwan considering VS30 (the equivalent shear-wave velocity of soil layers within a depth of 30 m underground). Liu and Ren (2022) developed the AI attenuation relationship for the Sichuan-Yunnan region. Their functional forms were modified from that of Travasarou et al. (2003), which was derived from a point-source model. Before we propose the AI attenuation relation for the next-generation national seismic hazard maps of China, the applicability of existing AI attenuation models still needs further investigation. Moreover, for the region with limited strong ground motions, predicting AI through the relationships between AI and other seismic parameters is another option (Liu et al., 2015; Ji et al., 2021; Macedo et al., 2022). Moreover, correlations of AI and other intensity measures enable an easily ground motion selection and vector hazard analysis (Wang and Du, 2013; Bradley, 2015; Tao et al., 2020; Cheng et al., 2021).
In this study, we developed empirical AI-PGA relationships for western China based on our global empirical relationships (Liu et al., 2016). Our analysis involves 3,169 horizontal and 979 vertical strong motion records from 274 earthquakes with surface wave magnitude (MS) ranging from 4.0 to 8.0. We examine the influences of earthquake magnitude and epicenter distance, as well as the dependencies on local site conditions using VS30 and generic site classes such as rock and soil. Finally, we develop models to predict AI as a function of PGA, PGA and MS, PGA, MS, and VS30 for southwest, northwest, and western China, encompassing both horizontal and vertical components. We investigate the region-dependent of AI-PGA correlation by comparing our southwest and northwest models with previous models, and discusse the potential reasons. These findings provide a methodology for estimating AI from PGA in western China, and contribute to a deeper understanding of the attenuation characteristics of AI in China overall.
The database used for this study comprises accelerograms from over 800 strong motion stations of NSMONS in western China. These records capture earthquakes that occurred in eight provinces of southwest (Yunnan, Sichuan) and northwest China (Gansu, Shaanxi, Ningxia, Qinghai, Inner Mongolia and Xinjiang), contributing nearly 71% earthquakes throughout China from 2009 to now, as documented by the unified earthquake cataloging of China Seismographic Network operated by the China Earthquake Networks Center (CENC). To mitigate the influence of site response, topographic and structural effects on ground motion, records from vertical arrays, topographical arrays, and structural arrays are excluded, with stations deployed at free field ground sites considered. The strong motion records are processed using the method of Zhang et al. (2022), with each horizontal component treated independently. For engineering purposes, we select strong motion data from stations with PGA larger than 0.01 g. By applying these selection criteria, there are finally 3,169 horizontal and 979 vertical strong motion records recorded by 646 strong motion stations. The currently available site information for all these stations is generic site classes (rock and soil) as listed in strong-motion record data files. Ji et al. (2017, 2022) provided site classification for about 170 stations using an empirical H/V spectral ratio method. Xie et al. (2022) developed a soil profile database of geotechnical soil profiles and shear-wave velocity logs, and site parameters for 678 stations in western China (Yunnan, Sichuan, Gansu, and Xinjiang). Unfortunately, there are still many stations without plausible site classification and VS30 value due to the lake of borehole logs or shear wave velocities profiles (Ren et al., 2023). Based on their research, we obtain VS30 for 406 stations, and assign VS30 to 2,248 horizontal (70.9% of the total) and 670 vertical (68.4% of the total) strong-motion records.
These strong-motion records are recorded in 274 earthquakes with magnitude ranging from 4.0 to 8.0. Surface wave magnitude (MS) is provided for majority of the earthquakes, while local magnitude (ML) is used for only 15 earthquakes (13 with 4.1≤ML≤4.9, 1 with ML=6.2, and 1 with ML=6.6) when MS is unavailable. According to the review of Li et al. (2014), the MS and ML measurements are consistent, with the empirical equation by Li et al. (2016) indicating a difference between estimated MS from ML and measured MS of less than 0.1 for these few data. Consequently, we believe that the mixed usage of MS and ML has negligible influence on the final empirical relationships between AI and PGA. The spatial distribution of these earthquakes and strong-motion stations is shown in Figure 1. The data distribution with respect to PGA, magnitude, epicentral distance, VS30 and generic site class are illustrated in Figure 2. Numbers of earthquakes and records for different magnitude ranges are listed is Table 1. For the complete list of the earthquake catalogue used, see Supplementary Tables S1, S2 in the electronic supplement to this article.
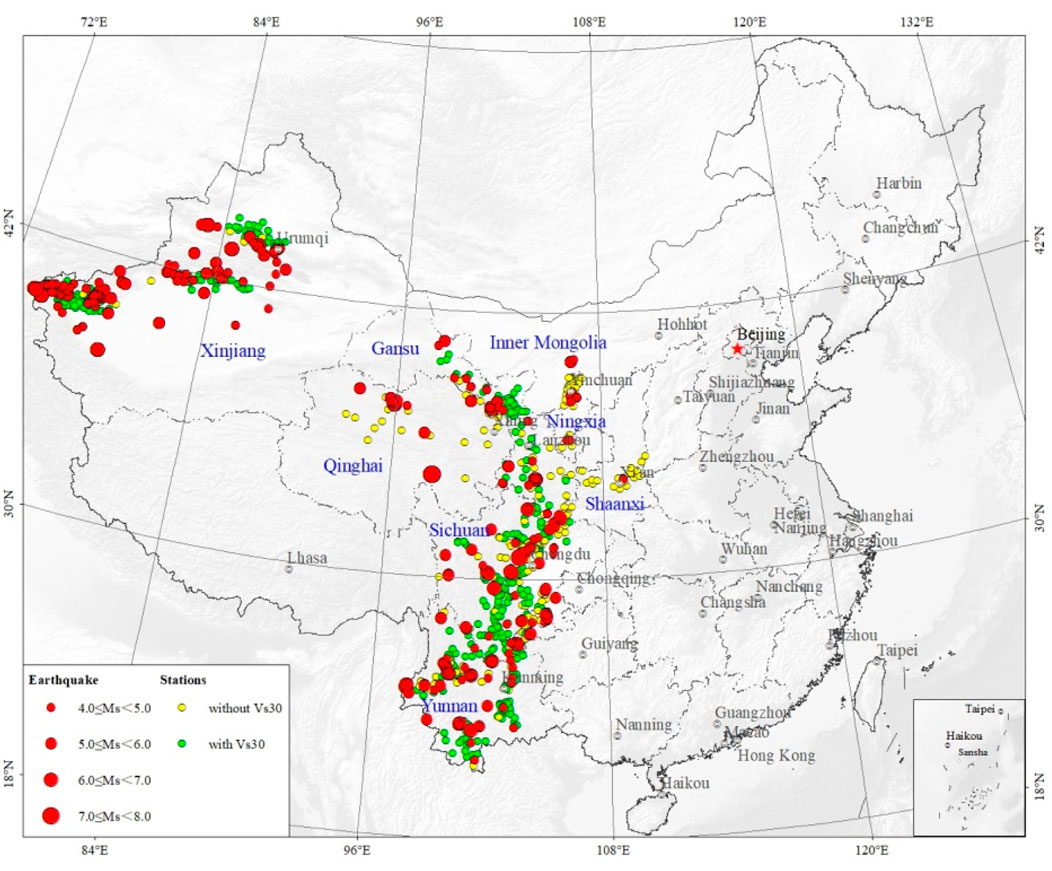
Figure 1. Earthquakes and strong-motion stations selected for this study.
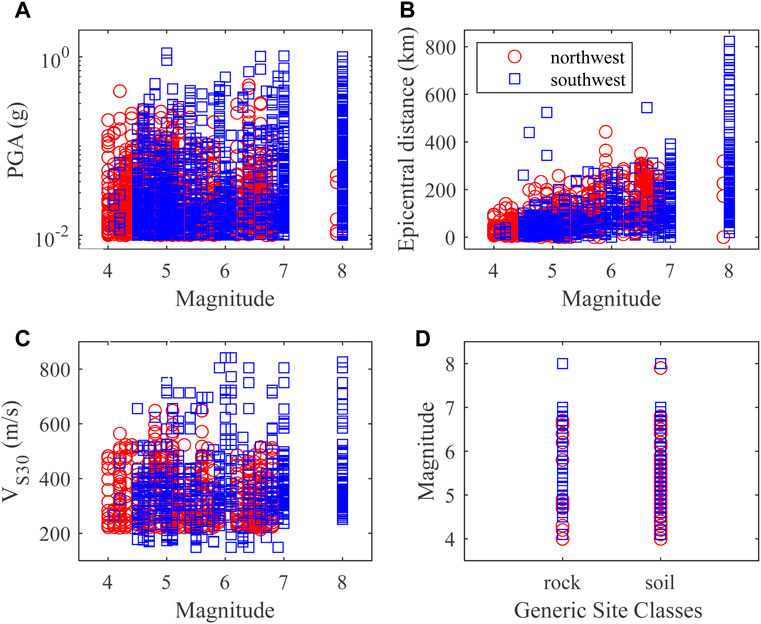
Figure 2. Distribution of strong-motion data used in this study: (A) magnitude and PGA, (B) magnitude and epicentral distance, (C) magnitude and VS30, and (D) generic site class and magnitude.
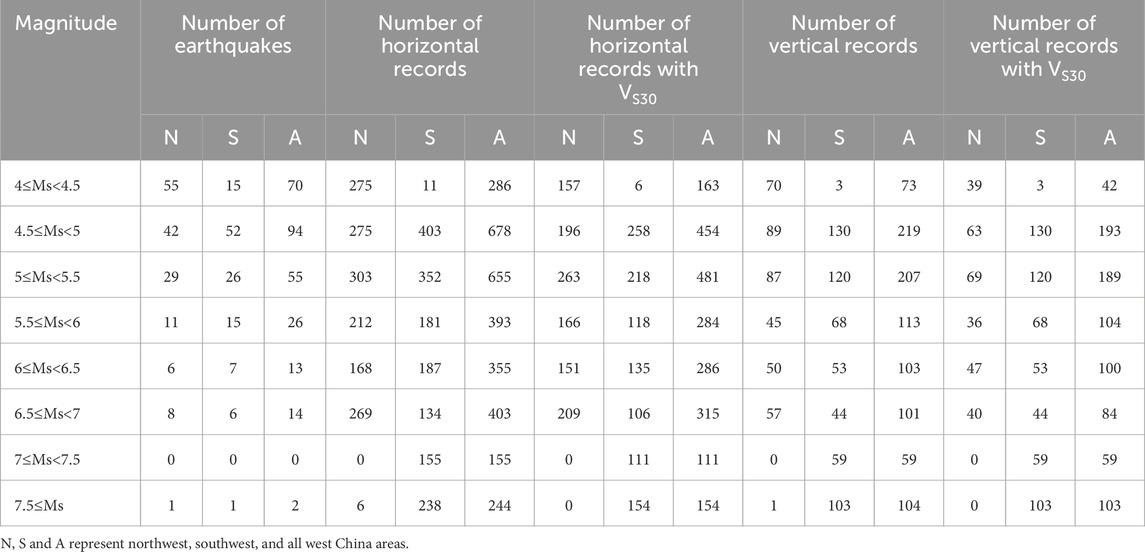
Table 1. Numbers of earthquakes and records for different magnitude ranges.
In previous study (Liu et al., 2016), we proposed global empirical AI-PGA relationships as a function of moment magnitude Mw, and VS30. We concluded that AI-PGA relationship was not significantly affected by focal mechanism and fault distance. These global empirical relationships represented a significant advancement by incorporating such important features as magnitude and VS30 and enable an improved way of estimating AI from PGA. Its function was described as Eq. 1 (referred as model 1)
in which AI is Arias intensity in unit of m/s, and PGA is and peak ground acceleration in unit of g (1g = 9.8 m/s2), MS is the surface wave magnitude, VS30 is in unit of m/s, a, b, c and d are regression parameters.
In this paper, we also investigate the influence of epicentral distance using our data. We confirm that considering epicentral distance is unnecessary due to the absence of any biased residual. Eq. 1 is utilized for the dataset that included VS30 values. For the data without VS30 values, we test the usage of the generic site class (rock or soil) instead of VS30 by taking them as dummy variables. However, it did not yield statistically significant results. Consequently, Eq. 2 (referred to as model 2) is employed for the entire dataset.
in which AI and PGA are Arias intensity and peak ground acceleration in unit of m/s and g (1g = 9.8 m/s2), MS is the surface wave magnitude, a, b and c are regression parameters.
In order to facilitate a comprehensive comparison with previous models, we also establish a basic model that relates AI and PGA, represented by Eq. 3:
where AI and PGA are Arias intensity and peak ground acceleration in unit of m/s and g (1g = 9.8 m/s2), a and b are regression parameters. This basic model is also widely recognized by the PGA versus the Arias intensity graph from series of data (Lenti and Martino, 2010; 2013).
Using the dataset mentioned above, we develop empirical relationships of AI and PGA for southwest, northwest, and western China, considering both the horizontal and vertical components. These relationships are represented by model 1, model 2, and the basic model. The regression coefficients for model 1 and 2 are obtained through the mix-effect model (Lee et al., 2012), and are presented in Tables 2, 3, respectively. The coefficients for the basic model are determined using the least square method, and are shown in Table 4. The linear equation of the basic model can well explain the logarithm of AI linearly increases with the increase of the logarithm of PGA. However, there are noticeable discrepancies in the intercept (the parameter a in Table 4) and slope (the parameter b in Table 4) among the basic models for the southwest, northwest, and western regions. This discrepancy primarily arises from the lack of consideration for earthquake magnitude. By incorporating earthquake magnitude into the analysis (as demonstrated in Table 3), the regression coefficients a, b, and c of model 2 for the southwest, northwest, and western regions exhibit relatively close values within the same horizontal or vertical group. Without consideration the influence of VS30, the estimated horizontal/vertical AI values are about 182%/177% higher for every one-unit increase in magnitude in northwest China, and about 187%/187% higher in southwest China for a given PGA value. In respect to all western China, the estimated horizontal/vertical AI values are roughly 183%/180% higher for every one-unit increase in magnitude. The goodness-of-fit to the observed data is well demonstrated across the entire range of PGA and magnitude, as is illustrated in Figures 3–5 (only horizontal results are shown here for simplicity). The unbiased residuals (data minus model values), as functions of PGA and magnitude, indicate that our models provide a good fit. Furthermore, the addition of earthquake magnitude to the models reduces the standard deviation from over 0.3 to approximately 0.20 log unit, as compared to the basic model. This decrease in the standard deviation of model 2 further affirms the significant influence of earthquake magnitude on the AI-PGA correlation. AI not only increases with increasing PGA but also the increases of magnitude.
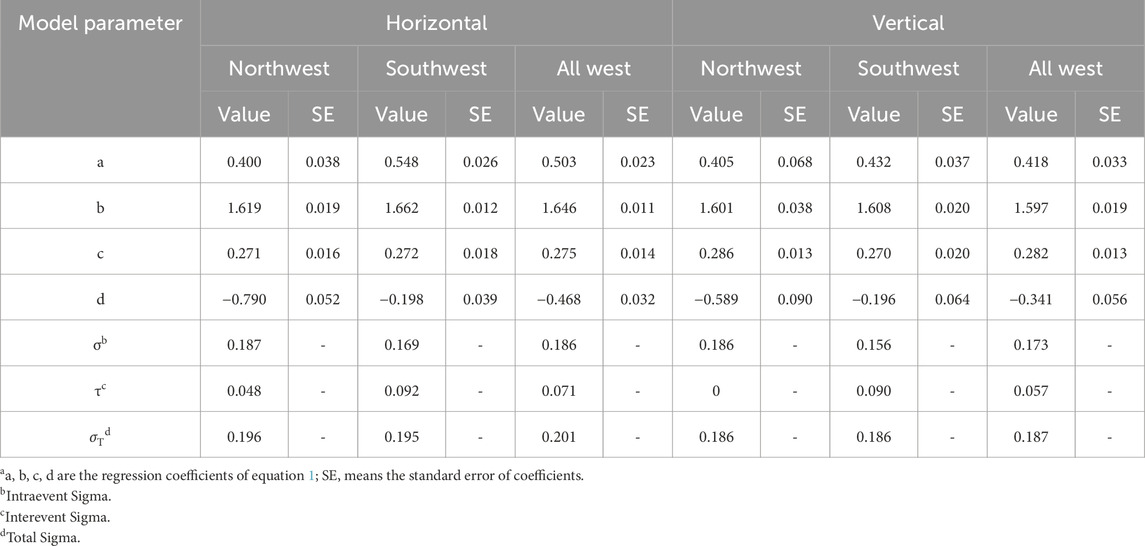
Table 2. Regression coefficients for the horizontal and vertical AI and PGA relationships (Eq. 1).
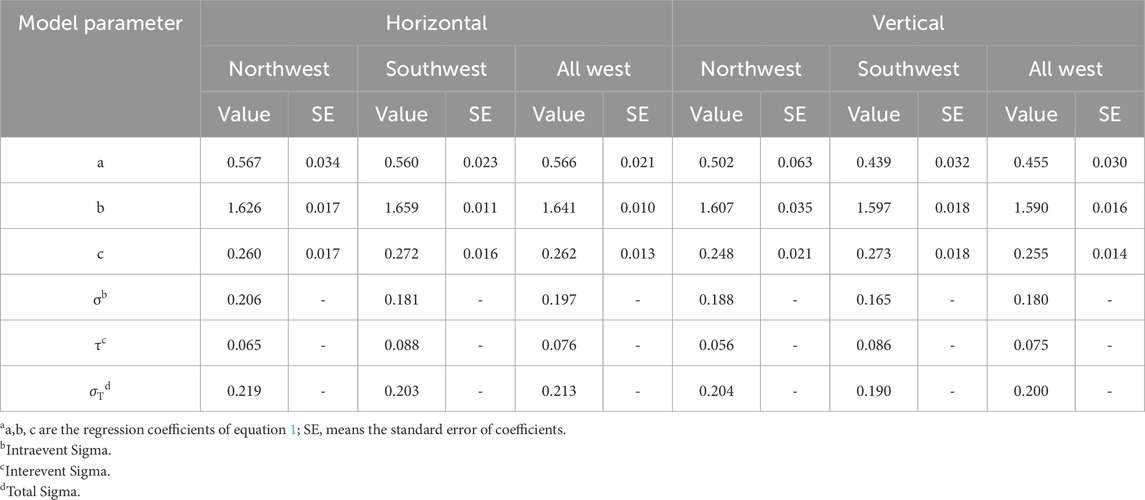
Table 3. Regression coefficients for the horizontal and vertical AI and PGA relationships (Eq. 2).
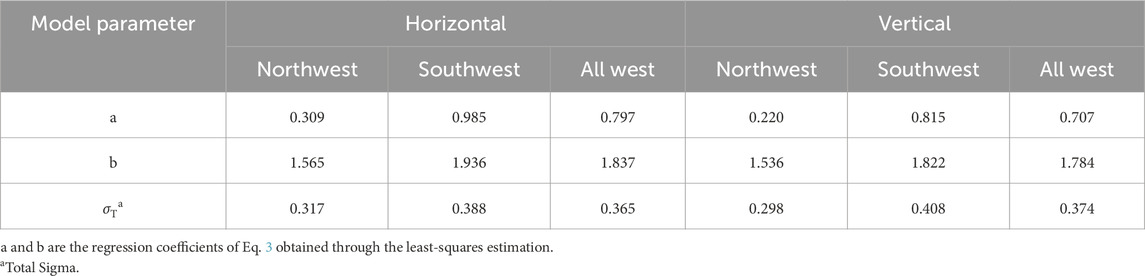
Table 4. Regression coefficients for the horizontal and vertical AI and PGA relationships (Eq. 3).
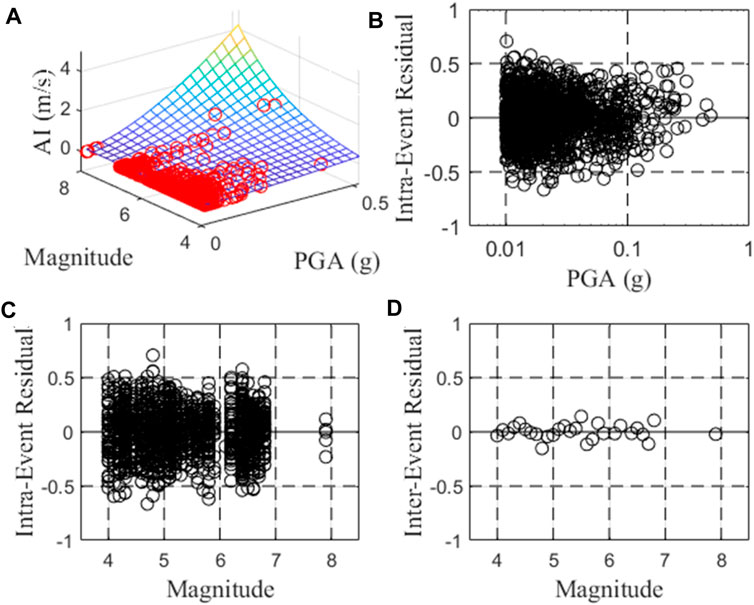
Figure 3. Comparison between the observed data of northwest China with model 2 (A), and Intraevent residuals of model 1 against (B) PGA, (C) VS30, and (D) Interevent residual against magnitude.

Figure 4. Comparison between the observed data of southwest China with model 2 (A), and Intraevent residuals of model 1 against (B) PGA, (C) VS30, and (D) Interevent residual against magnitude.
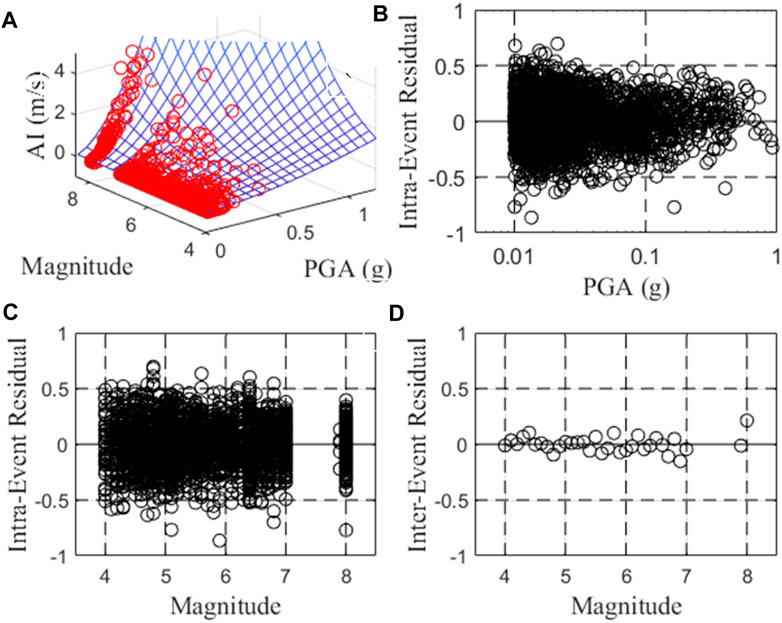
Figure 5. Comparison between the observed data of all west China with model 2 (A), and Intraevent residuals of model 1 against (B) PGA, (C) VS30, and (D) Interevent residual against magnitude.
For the model with VS30 (model 1), the results reveal that the AI-PGA correlation is significantly affected by earthquake magnitude and site parameter VS30. Compared with model 2, the inclusion of VS30 reduces the model standard deviation by approximately 0.01 log unit (Table 2). Given the fixed PGA and VS30 value, the estimated horizontal/vertical AI values are about 187%/193% higher for one-unit increase in magnitude in northwest China, approximately 187%/186% higher in southwest China, and roughly 188%/191% higher in all western China. Likewise, with the fixed PGA and earthquake magnitude, the estimated horizontal/vertical AI values are about 32%/43% (northwest), 75%/75% (southwest) and 51%/61% (all west) lower for a site with a VS30 value of 180 m/s compared to a site with a VS30 value of 760 m/s. To evaluate any potential bias in the regression, the residuals are plotted against PGA, magnitude and VS30 in Figure 6 (northwest China), Figure 7 (southwest China) and Figure 8 (all west China), respectively. Only the horizontal results are displayed here. Overall, no discernible trend is observed in the residuals as a function of PGA, magnitude, or VS30, suggesting that there is no bias present in the regression. Consequently, these findings demonstrate that AI not only increases with increasing PGA and increasing magnitude but also displays an increase with decreasing VS30.
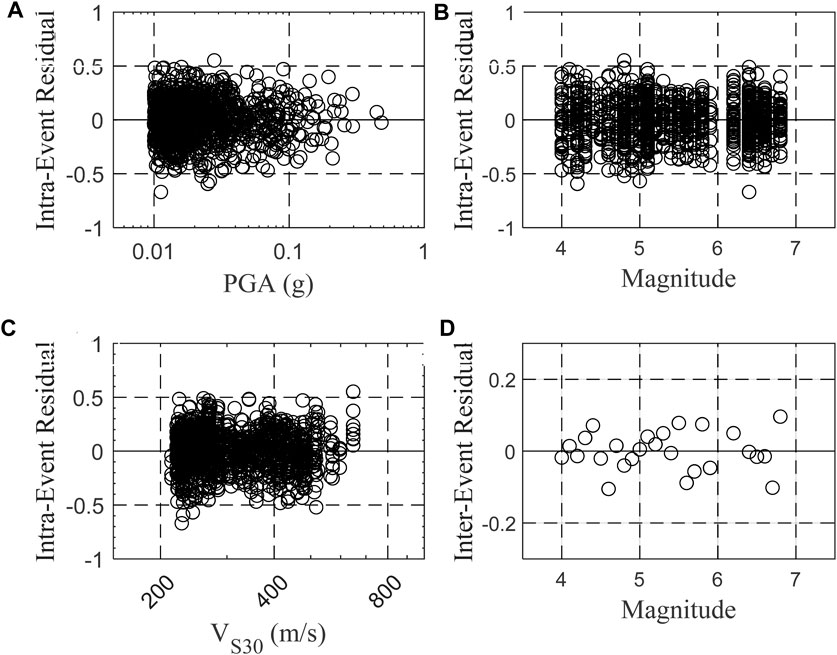
Figure 6. Intraevent residuals of model 1 for northwest China against (A) PGA,(B) magnitude, (C) VS30, and (D) Interevent residual against magnitude.
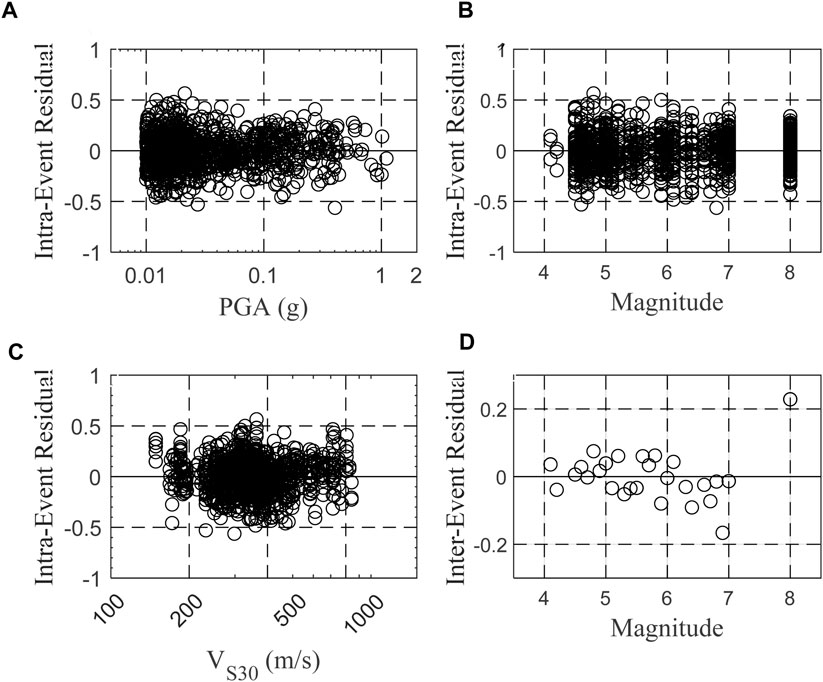
Figure 7. Intraevent residuals of model 1 for southwest China against (A) PGA,(B) magnitude, (C) VS30, and (D) Interevent residual against magnitude.
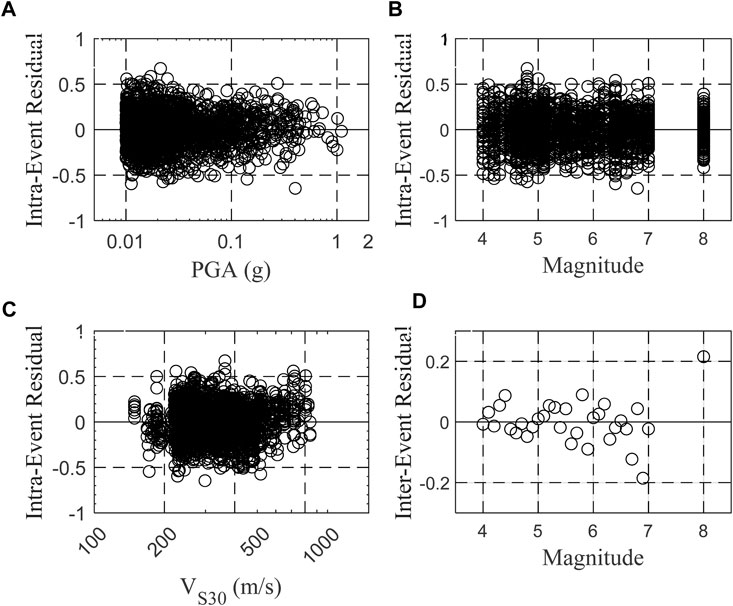
Figure 8. Intraevent residuals of model 1 for all west China against (A) PGA, (B) magnitude, (C) VS30, and (D) Interevent residual against magnitude.
The goodness-of-fit of the empirical relationships to the data is further demonstrated through the actual data plots. As an example, we can examine the case of the MS8.0 Wenchuan earthquake that occurred on 12 May 2008 in Sichuan (Figure 9). In Figures 7D, 8D, the intraevent residuals are seen to be close to zero, indicating a good fit, while the interevent residual of Wenchuan earthquake appears relatively large at around 0.2. According to the VS30 values of the Wenchuan data, we subdivide the Wenchuan data into two groups: data with VS30 values between 249 m/s and 500 m/s, and data with VS30 values between 500 m/s and 826 m/s. We plot the prediction of model 1 for southwest China plus its variability of interevent residual with mean VS30 values as VS30 = 350 m/s and 650 m/s for these two VS30 bins. There is slight difference between these two sub-data. The estimated AI from a site with a VS30 value of 650 m/s is approximately 80% of that from a site with a VS30 value of 350 m/s for Wenchuan earthquake. We can see that this slight difference can be recognized by our model 1. Both model 1 and model 2 provide a good fit with the observations.
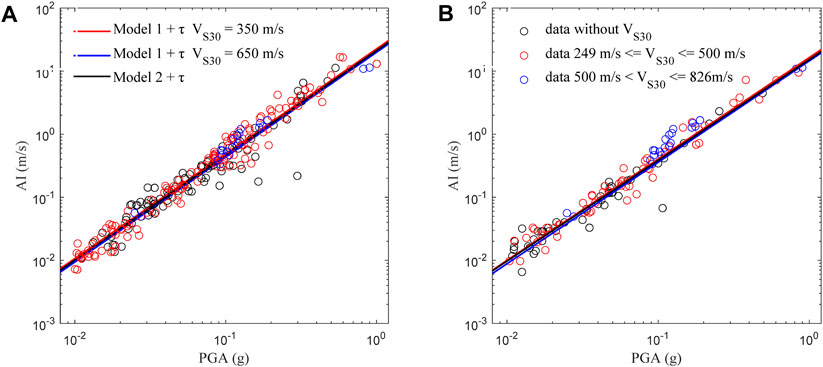
Figure 9. Comparison between the observed horizontal (A) and vertical (B) AI-PGA correlation during the Wenchuan earthquake for model 1 and 2.
The data of the Ms6.4 Gashi earthquake that occurred on 19 January 2020, in Xinjiang, and the Ms6.4 Menyuan earthquake that occurred on 21 January 2016, in Qinghai are plotted together in Figure 10. The VS30 values for the Gashi and Menyuan data fall within the range of 220 m/s to 486 m/s, with the exception of three records from the 65PKY strong motion station (with VS30 values being 512 m/s) in the Gashi earthquake. The prediction of model 1 using a mean VS30 value of 370 m/s is provided. We can see that the logarithms of the observed AI and PGA exhibit a very good linear correlation, with nearly all the data points falling between the predicted lines. This indicates a agreement between the observed data and the predictions from model 1.
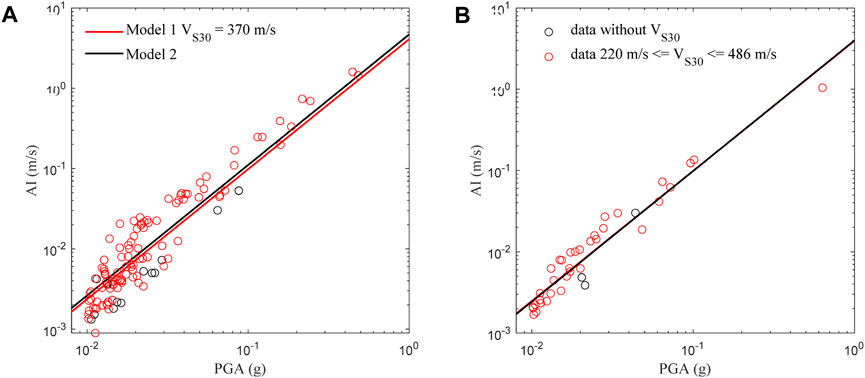
Figure 10. Comparison between the observed horizontal (A) and vertical (B) AI-PGA correlation during the Gashi and Menyuan Ms 6.4 earthquakes for model 1 and 2.
In order to assess the effectiveness of our models, we compare our models with previous studies (Arias, 1970; Jibson, 1993; Romeo, 2000, Liu et al., 2016). Except our NGA models, these models are established mostly using horizontal ground motion data sets from different earthquakes, and they did not take into account the influence of earthquake magnitude. So our comparison is focused on horizontal models. Without considering earthquake magnitude, the slope of the regression lines of the basic model (quantified by parameter b in Eq. 3) exhibits significant variation (Figure 11). This can also explain the large discrepancy among our northwest, southwest, and all western models. When we divide the data as sub-data with different magnitudes and consider the magnitude effect on AI-PGA correlation by model 2, we observe a remarkable consistency in the values of parameters b and c in our regression formula (Eq. 2) across earthquakes of varying magnitudes and regions. The differences between these parameter values are nearly within 0.03, as evidenced in Table 3. This consistency is also shown in Figure 12, where the horizontal model lines for the northwest, southwest, and western China regions appear almost parallel.
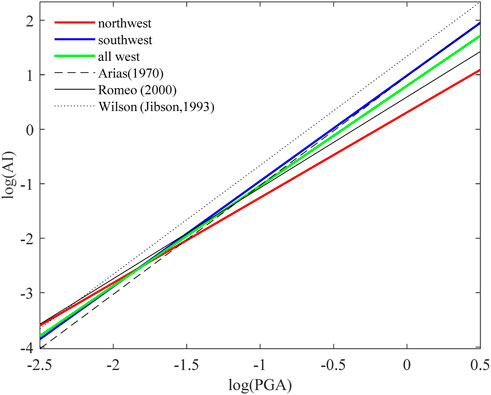
Figure 11. Comparison of the basic model for the northwest, southwest and all west China with existing models.
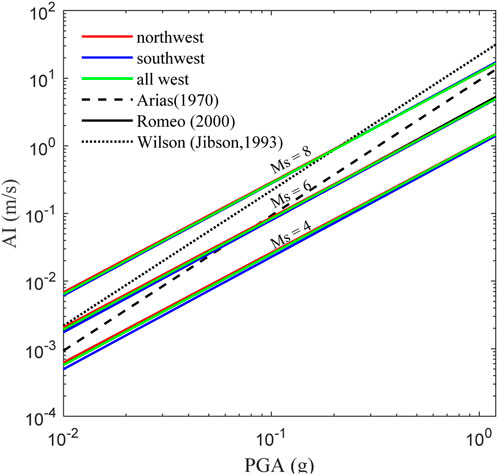
Figure 12. Comparison of model 2 for the northwest, southwest and all west China for selected magnitudes (Ms = 4, 6 and 8) with existing models.
We future analyze the variability between model 2 for northwest and southwest China. The ratio (defined as the prediction of model 2 for northwest or southwest China divided by the prediction of model 2 for all west China) with respect to PGA is plotted in Figure 13. For northwest China, the mean ratios are 1.023, 1.014, and 1.005 for Ms = 4.0, 6.0 and 8.0, respectively. For northwest China, the mean ratios are 0.928, 0.972, and 0.987 accordingly. Consequently, the means ratios of northwest to southwest are approximately 1.102, 1.043, and 0.987 for model 2 with Ms = 4.0, 6.0 and 8.0, respectively. These results reveal that the AI-PGA correlation is region-dependent to some extent, as evidenced by the slightly discrepancy between model 2 of northwest and southwest China.
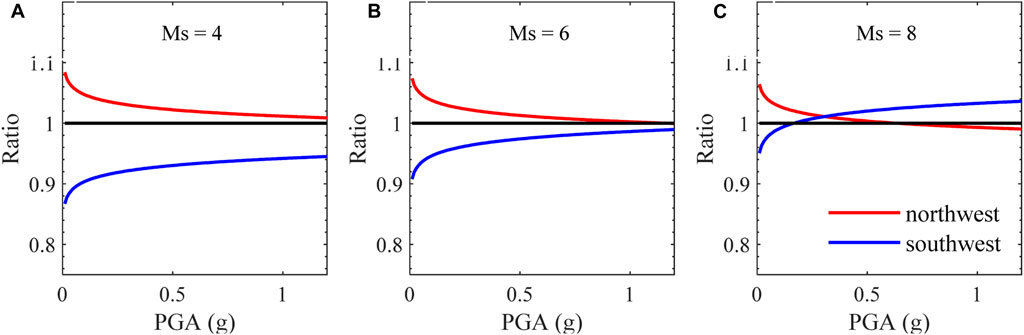
Figure 13. Ratios of model 2 for the northwest and southwest to all west China versus PGA. See the text for more detail for the definition of the ratio. (A) Ms = 4.0. (B) Ms = 6.0. (C) Ms = 8.0.
In this study, our model 1 for northwest, southwest, and all western China utilizes the same function form as our NGA model (Liu et al., 2016). Here, we make a future comparison between our relationships with our NGA relationships (Figure 14, horizontal component only). The result confirms that AI is not only increases with increasing PGA, but also increases with increasing earthquake magnitude and decreasing VS30. These tendencies are consistent across all these four relationships, but are different in details. The ratio (defined as the prediction of model 1 divided by the prediction of NGA model) with respect to PGA is plotted in Figure 15. Given the fixed VS30 values, the mean ratios of northwest, southwest, and all west China are generally decrease with the increase of earthquake magnitude from Ms = 4.0 to 6.0, and 8.0, and the difference among these three regions remain relatively constant. Take VS30 =180 m/s as an example, the mean ratios for northwest, southwest, and all western China are 1.142, 0.844, and 1.001, respectively, for Ms = 4.0. For Ms = 6.0, these values become1.013, 0.752, and 0.905. For Ms = 8.0, the mean ratios are 0.899, 0.670, and 0.817. But the value of mean ratio northwest divided by that of southwest keeps remains 1.35. Conversely, when we fix the earthquake magnitude, the changes in mean ratios of northwest and southwest China exhibit a reversed trend adjustment. Take Ms = 6.0 as an example. The mean ratios for northwest shift from 1.013 (VS30 = 180 m/s) to 0.892 (VS30 = 500 m/s) and 0.625 (VS30 = 760 m/s), indicating a decreasing trend. In contrast, the mean ratios for southwest change from 0.752 (VS30 = 180 m/s) to 0.977 (VS30 = 500 m/s) and 1.088 (VS30 = 760 m/s), indicating an increasing trend.
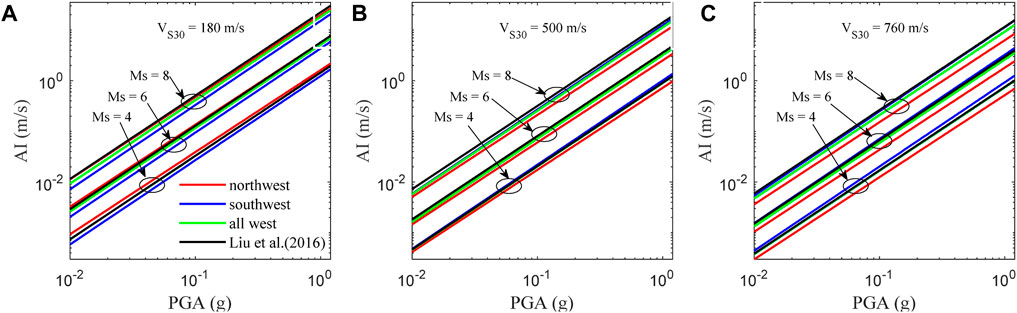
Figure 14. Comparison of model 1 for the northwest, southwest, and all west China or selected magnitudes (Ms = 4, 6 and 8) with the NGA model for (A) VS30 = 300 m/s, (B) VS30 = 500 m/s, and VS30 = 760 m/s.
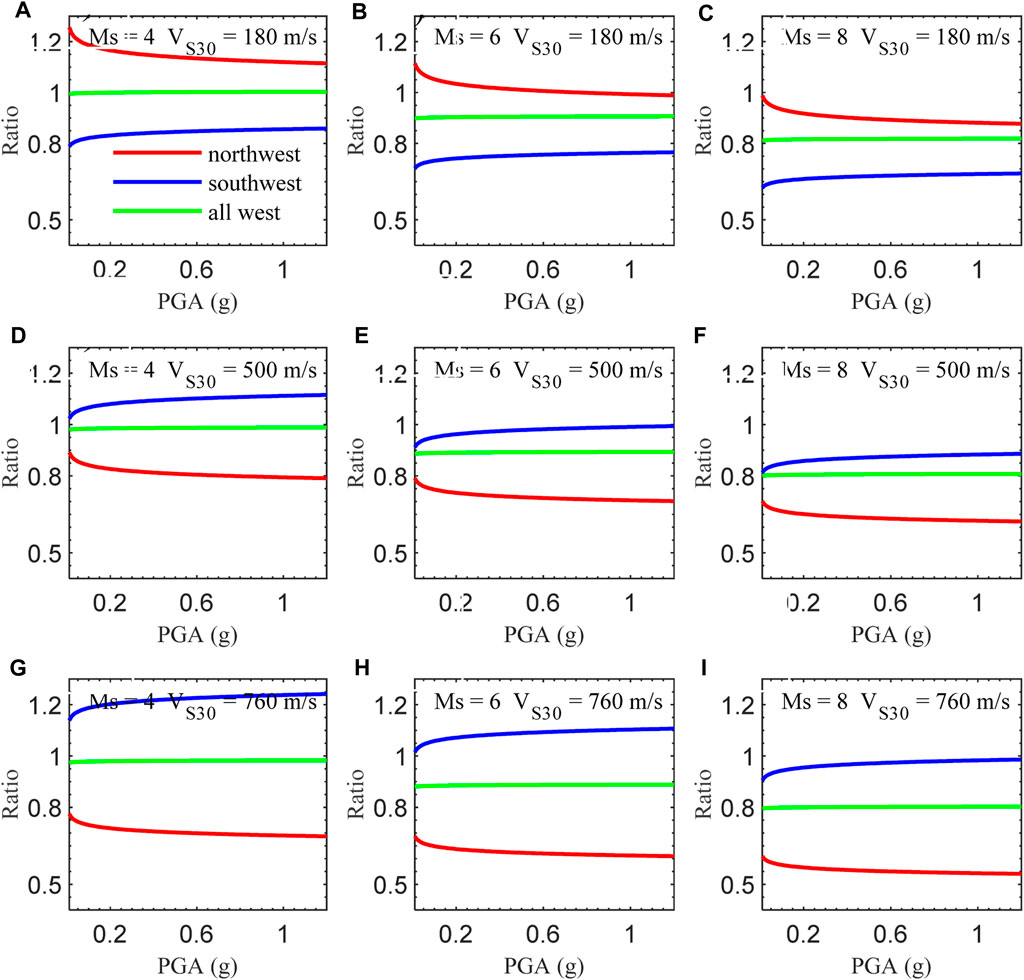
Figure 15. Ratios of model 1 for the northwest, southwest, and all west China to the NGA model versus PGA. See the text for more detail for the definition of the ratio. (A) Ms = 4.0 and VS30 = 180 m/s. (B) Ms = 6.0 and VS30 = 180 m/s. (C) Ms = 8.0 and VS30 = 180 m/s. (D) Ms = 4.0 and VS30 = 500 m/s. (E) Ms = 6.0 and VS30 = 500 m/s. (F) Ms = 8.0 and VS30 = 500 m/s. (G) Ms = 4.0 and VS30 = 760 m/s. (H) Ms = 6.0 and VS30 = 760 m/s. (I) Ms = 8.0 and VS30 = 760 m/s.
In this paper, based on our previous empirical relation models between AI and PGA using the NGA database, we develop empirical relationships between AI and PGA for western China. This effort focuses on strong motion records with PGA ≥0.01g, obtained from eight provinces in southwest China (Yunnan, Sichuan) and northwest China (Gansu, Shaanxi, Ningxia, Qinghai, Inner Mongolia, and Xinjiang). This large set of data consists of 3,169 horizontal and 979 vertical strong motion records from 274 earthquakes with surface wave magnitude (MS) ranging from 4.0 to 8.0. All the records are classed into generic site classes (rock and soil), and VS30 values are assigned to 2,248 horizontal (70.9% of the total) and 670 vertical (68.4% of the total) records. Empirical relationships are developed to estimate AI as a function of PGA (basic model), PGA and MS (model 2), PGA, MS, and VS30 (model 1) for the southwest, northwest, and west China, both for horizontal and vertical components. The results confirm that the logarithm of AI increases linearly with the increase of the logarithm of PGA and MS, and decreases with the logarithm of VS30. However, the influence of site conditions on AI-PAG relationships cannot be recognized by the simple generic rock and soil site classes. The epicenter distance has little effect on the AI-PAG relationships. Furthermore, the significant difference between the model 1 of southwest and northwest reveals that the AI-PGA correlation is region-dependent, which is chiefly attributed to local site conditions. The empirical AI-PGA relationships presented in this paper enable one way of estimating AI from PGA for western China. It will also contribute to a better understanding of the proposal of AI attenuation equations, which is one of the objectives of the next-generation seismic zonation map of China.
In recent years, numerous GMPEs have been developed for PGA and AI (Boore et al., 2014; Zach et al., 2017; Du and Wang, 2017; Farhadi and Pezeshk, 2020; Bahrampouri et al., 2021; Davatgari-Tafreshi and Bora, 2023; Hu et al., 2023). These studies implicitly suggest that attenuation characteristic of PGA and AI, such as the magnitude-scaling effects and site effects are different (Campbell and Bozorgnia, 2012). Similarly, our proposed models demonstrate a significant dependence of AI-PGA correlation on earthquake magnitude and the VS30 value of the site. The distributions of the residuals of model 2 against magnitude and the residuals of model 1 against magnitude and VS30 exhibit no observable trend or change, indicating the absence of bias in our relationships. Notably, the model standard deviation decreases by 0.1 and 0.01 log unit in sequence, starting from the basic model to model 2 and model 1. This reduction signifies that our relationships can effectively identify the discrepancies in AI-PGA correlation across different earthquakes and site conditions, representing a significant advancement.
However, it is worth noting that the AI-PGA correlation does exhibit a certain degree of region-dependent. As we can see from Table 3, the values of parameters b and c in Eq. 2 tend to be consistent for earthquakes of different magnitudes and different regions, with their differences almost within 0.03. In Figure 13, the mean predicted value for northwest China from model 2 is about 110.0%, 104.3% and 98.7% of that for southwest China, for MS = 4.0, 6.0 and 8.0, respectively. It shows that there is a slightly discrepancy between model 2 of northwest and southwest China. With regard to model 1, the discrepancy between northwest China and southwest China can be up to 30%–40% as illustrated in Figure 15. As listed in Table 2, the difference in the values of parameter b between the northwest and southwest is 0.043, while the difference in the values of parameter c is 0.001. The values of parameter d for the northwest and southwest China are −0.790 and −0.198, respectively. This discrepancy in parameter d plays a significant role in determining the difference between the models. The VS30 term, expressed as
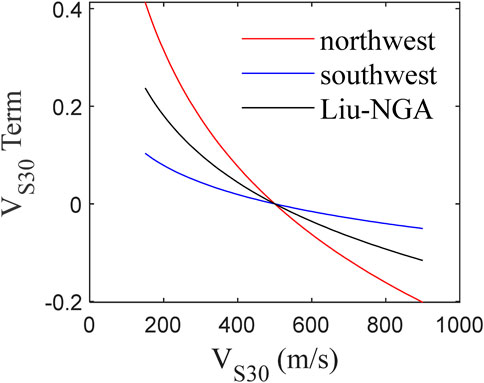
Figure 16. Variation of the VS30 term of model 1 for northwest, southwest China, and the NGA model against VS30.
This means that the region-dependent of AI-PGA correlation is primarily attributed to the local site conditions, represented by VS30 in this study. The research conducted by Li et al. (2020b) indicated that geotechnical types and soil depths have significant effects on the reliability of the relationship between shear wave velocity and buried depth. Though VS30 provides unambiguous definitions of site classes, there might still be high uncertainties associated with determining soil type by VS30. For the strong motion stations located in the plateau basin of northwest China or ravine region of southwest China, even if they have the same VS30 values, the soil depths in the northwest basin region (which belongs to a sedimentary environment) may be greater than those in the ravine region of southwest China (which is predominantly dominated by downward cutting erosion). This could potentially explain why the influence of site conditions on AI-PGA relationships cannot be adequately captured by the currently available rough and simplistic rock and soil site classes.
The datasets presented in this article are not readily available because The strong-motion data used in this research are provided by the Strong Motion observation Center, Institute of Engineering Mechanics, China Earthquake Administration. Please contact them to apply for use. Requests to access the datasets should be directed to Y3NtbmNAaWVtLmFjLmNu.
JL: Conceptualization, Formal Analysis, Funding acquisition, Investigation, Methodology, Software, Writing–original draft, Writing–review and editing. BZ: Data curation, Writing–original draft, Writing–review and editing. XZ: Data curation, Writing–original draft, Writing–review and editing.
The author(s) declare that financial support was received for the research, authorship, and/or publication of this article. This study was supported by the by the National Key R&D Program of China (Grants Nos. 2022YFC3003503, 2022YFC3004302), China Geological Survey Project (Grants No. DD20221738), and the scientific research project (Grants No. 86) of Institute of Geomechanics.
We thank Professor Yefei Ren, Ruizhi Wen, and their research team for the verification of the strong motion records.
The authors declare that the research was conducted in the absence of any commercial or financial relationships that could be construed as a potential conflict of interest.
All claims expressed in this article are solely those of the authors and do not necessarily represent those of their affiliated organizations, or those of the publisher, the editors and the reviewers. Any product that may be evaluated in this article, or claim that may be made by its manufacturer, is not guaranteed or endorsed by the publisher.
The Supplementary Material for this article can be found online at: https://www.frontiersin.org/articles/10.3389/feart.2024.1434194/full#supplementary-material
Arias, A. (1970). “A measure of earthquake intensity,” in Seismic design for nuclear power plants. Editor R. J. Hansen (Cambridge, Massachusetts: MIT Press), 438–483.
Bahrampouri, M., Rodriguez-Marek, A., and Green, R. A. (2021). Ground motion prediction equations for Arias Intensity using the Kik-net database. Earthq. Spectra 37 (1), 428–448. doi:10.1177/8755293020938815
Boore, D. M., Stewart, J. P., Seyhan, E., and Atkinson, G. M. (2014). NGA-West2 equations for predicting PGA, PGV, and 5% damped PSA for shallow crustal earthquakes. Earthq. Spectra 30 (3), 1057–1085. doi:10.1193/070113eqs184m
Bradley, B. A. (2015). Correlation of Arias intensity with amplitude, duration and cumulative intensity measures. Soil Dyn. Earthq. Eng. 78, 89–98. doi:10.1016/j.soildyn.2015.07.009
Campbell, K. W., and Bozorgnia, Y. (2012). A comparison of ground motion prediction equations for Arias intensity and cumulative absolute velocity developed using a consistent database and functional form. Earthq. Spectra 28 (3), 931–941. doi:10.1193/1.4000067
Cheng, Y., Liu, T., Wang, J., and Ning, C. L. (2021). Empirical correlations of spectral input energy with peak amplitude, cumulative, and duration intensity measures. Bull. Seismol. Soc. Am. 112, 978–991. doi:10.1785/0120210164
Chousianitis, K., Gaudio, V. D., Sabatakakis, N., Kavoura, K., Drakatos, G., Bathrellos, G. D., et al. (2016). Assessment of earthquake-induced landslide hazard in Greece: from Arias intensity to spatial distribution of slope resistance demand. Bull. Seismol. Soc. Am. 106 (1), 174–188. doi:10.1785/0120150172
Davatgari-Tafreshi, M., and Bora, S. S. (2023). Empirical ground-motion models (GMMs) and associated correlations for cumulative absolute velocity, Arias intensity, and significant durations calibrated on Iranian strong motion database. Bull. Earthq. Eng. 21, 4139–4166. doi:10.1007/s10518-023-01708-9
Du, W., and Wang, G. (2017). Prediction equations for ground-motion significant durations using the NGA-west2 database. Bull. Seismol. Soc. Am. 107 (1), 319–333. doi:10.1785/0120150352
Farhadi, A., and Pezeshk, S. (2020). A referenced empirical ground-motion model for Arias intensity and cumulative absolute velocity based on the NGA-East database. Bull. Seismol. Soc. Am. 110 (2), 508–518. doi:10.1785/0120190267
Hu, J. J., Hu, L., Jin, C. Y., Wang, Z. W., Ding, Y. T., and Tang, C. (2023). Offshore ground motion models for Arias intensity and cumulative absolute velocity in the Japan trench area. J. Earthq. Eng. 27 (14), 4005–4023. doi:10.1080/13632469.2022.2155732
Ji, K., Ren, Y., and Wen, R. (2021). Empirical correlations between generalized ground-motion intensity measures for earthquakes in China. Bull. Seismol. Soc. Am. 111 (1), 274–294. doi:10.1785/0120200179
Ji, K., Ren, Y. F., and Wen, R. Z. (2017). Site classification for National Strong Motion Observation Network System (NSMONS) stations in China using an empirical H/V spectral ratio method. J. Asian Earth Sci. 147, 79–94. doi:10.1016/j.jseaes.2017.07.032
Ji, K., Ren, Y. F., Wen, R. Z., Zhu, C. B., Liu, Y., and Zhou, B. F. (2022). HVSR-based site classification approach using general regression neural network (GRNN): case study for China strong motion stations. J. Earthq. Eng. 26 (16), 8423–8445. doi:10.1080/13632469.2021.1991520
Jibson, R. W. (1993). Predicting earthquake-induced landslide displacements using Newmark’s sliding block analysis. Transp. Res. Rec., 9–17.
Lee, C. T., Hsieh, B. S., Sung, C. H., and Lin, P. S. (2012). Regional Arias intensity attenuation relationship for Taiwan considering VS30. Bull. Seismol. Soc. Am. 102 (1), 129–142. doi:10.1785/0120100268
Lenti, L., and Martino, S. (2010). New procedure for deriving multifrequential dynamic equivalent signals (LEMA_DES): a test-study based on Italian accelerometric records. Bull. Earthq. Eng. 8, 813–846. doi:10.1007/s10518-009-9169-7
Lenti, L., and Martino, S. (2013). A parametric numerical study of the interaction between seismic waves and landslides for the evaluation of the susceptibility to seismically induced displacements. Bull. Seismol. Soc. Am. 103 (1), 33–56. doi:10.1785/0120120019
Li, M., Li, X. J., and L, J. H. (2016). Empirical relationships of earthquake magnitudes for local regions considering the active tectonic boundary areas. Acta Seismol. Sin. 38 (2), 157–166. doi:10.11939/jass.2016.02.001
Li, Y. Z., Ying, N., and Li, X. H. (2014). Review of the conversional relationship for different magnitude scales. China. Earthq. Eng. J. 36 (1), 80–87. (in Chinese with English abstract). doi:10.3969/i.issn.1000-0844.2014.01.0080
Li, M., Yang, L. G., Chen, H. P., Sheng, T. Q., and Agency, Z. E. (2020b). Relationship between shear wave velocity and soil depth of typical soil layers in Hangzhou area, Technol. Earthq. Disaster Prev. 15 (1), 77–88. (in Chinese with English abstract). doi:10.11899/zzfy20200108
Li, Xi. L., Zhai, C. H., Wen, W. P., and Xie, L. L. (2020a). Ground motion prediction model for horizontal PGA, 5% damped response spectrum in sichuan-yunnan region of China. J. Earthq. Eng. 24 (11), 1829–1866. doi:10.1080/13632469.2018.1485600
Liu, J. M., Gao, M. T., and Xie, J. J. (2015). Spatial variability and attenuation of Arias intensity during the 1999 chi-chi Mw 7.6 earthquake, taiwan. Bull. Seismol. Soc. Am. 105, 1768–1778. doi:10.1785/0120140157
Liu, J. M., Wang, T., Shi, J. S., Xin, P., and Wu, S. R. (2018). The influence of different Newmark displacement models on seismic landslide hazard assessment: a case study of Tianshui area, China. J. Geomech. 24 (1), 87–95. (in Chinese with English abstract). doi:10.12090/j.issn.1006-6616.2018.24.01.010
Liu, J. M., Wang, T., Wu, S. R., and Gao, M. T. (2016). New empirical relationships between Arias intensity and peak ground acceleration. Bull. Seismol. Soc. Am. 106 (5), 2168–2176. doi:10.1785/0120150366
Liu, P., and Ren, T. J. (2022). Arias intensity attenuation relationship in Sichuan–Yunnan region, China. Bull. Earthq. Eng. 20 (12), 6377–6406. doi:10.1007/s10518-022-01467-z
Macedo, J., Liu, C., and Abrahamson, N. A. (2022). On the interpretation of conditional ground-motion models. Bull. Seismol. Soc. Am. 112 (5), 2580–2586. doi:10.1785/0120220006
Ren, Y., Zhang, Y., Ji, K., Wen, R., Kishida, T., and Yao, X. (2023). Site classification scheme based on geological age and genesis for Xinjiang and the Capital Metropolitan areas of China. Earthq. Spectra 40, 174–199. doi:10.1177/87552930231213363
Romeo, R. (2000). Seismically induced landslide displacements: a predictive model. Eng. Geol. 58, 337–351. doi:10.1016/s0013-7952(00)00042-9
Tao, D., Ma, Q., Li, S., Xie, Z., Lin, D., and Li, S. (2020). Support vector regression for the relationships between ground motion parameters and macroseismic intensity in the Sichuan–Yunnan region. Appl. Sci. 10 (9), 3086. doi:10.3390/app10093086
Travasarou, T., Bray, J. D., and Abrahamson, N. A. (2003). Empirical attenuation relationship for Arias intensity. Eng. Struct. Dynam 32, 1133–1155. doi:10.1002/eqe.270
Wang, G., and Du, W. (2013). Spatial cross-correlation models for vector intensity measures (PGA, Ia, PGV, and SAs) considering regional site conditions. Bull. Seismol. Soc. Am. 103 (6), 3189–3204. doi:10.1785/0120130061
Xie, J. J., Li, X. J., Wen, Z. P., Jia, L., An, Z., Cui, J. W., et al. (2022). Soil profile database and site classification for national strong-motion stations in western China. Seismol. Res. Lett. 93 (3), 1930–1942. doi:10.1785/0220210271
Yu, Y. X., and Wang, S. Y. (2006). Attenuation relationship for horizontal peak ground acceleration and response spectrum in eastern and western China, Technol. Earthq. Disaster Prev. 1 (3), 207–217. (in Chinese with English abstract). doi:10.3969/j.issn.1673-5722.2006.03.005
Zach, B., Shideh, D., Abbie, L., Keith, P., Zan, K., and Brendon, B. (2017). Ground motion prediction equations for Arias intensity, cumulative absolute velocity, and peak incremental ground velocity for rock sites in different tectonic environments. Bull. Seismol. Soc. Am. 107 (5), 2293–2309. doi:10.1785/0120160388
Zhang, B., Li, X. J., Yu, Y. X., Sun, J. Z., Rong, M. S., and Chen, S. (2023). A new ground-motion model to predict horizontal PGA, PGV, and spectral acceleration for small-to-moderate earthquakes in the capital circle region of China. J. Asian Earth Sci. 257, 105853. doi:10.1016/j.jseaes.2023.105853
Zhang, B., Yu, Y. X., Li, X. J., and Wang, Y. (2022). Ground motion prediction equation for the average horizontal component of PGA, PGV, and 5% damped acceleration response spectra at periods ranging from 0.033 to 8.0s in southwest China. Soil Dyn. Earthq. Eng. 159, 107297. doi:10.1016/j.soildyn.2022.107297
Keywords: Arias intensity, peak ground acceleration, conditional model for Arias intensity, empirical correlations, western China
Citation: Liu JM, Zhang B and Zhao XD (2024) Empirical relationships between Arias Intensity and peak ground acceleration for western China. Front. Earth Sci. 12:1434194. doi: 10.3389/feart.2024.1434194
Received: 17 May 2024; Accepted: 24 June 2024;
Published: 15 July 2024.
Edited by:
Chong Xu, Ministry of Emergency Management, ChinaReviewed by:
Zongchao Li, China Earthquake Administration, ChinaCopyright © 2024 Liu, Zhang and Zhao. This is an open-access article distributed under the terms of the Creative Commons Attribution License (CC BY). The use, distribution or reproduction in other forums is permitted, provided the original author(s) and the copyright owner(s) are credited and that the original publication in this journal is cited, in accordance with accepted academic practice. No use, distribution or reproduction is permitted which does not comply with these terms.
*Correspondence: Jia Mei Liu, bGptMTk4NzA5MThAMTI2LmNvbQ==
Disclaimer: All claims expressed in this article are solely those of the authors and do not necessarily represent those of their affiliated organizations, or those of the publisher, the editors and the reviewers. Any product that may be evaluated in this article or claim that may be made by its manufacturer is not guaranteed or endorsed by the publisher.
Research integrity at Frontiers
Learn more about the work of our research integrity team to safeguard the quality of each article we publish.