 Samuel T. Thiele1*
 Moritz Kirsch1Sandra Lorenz1Houda Saffi2
 Safia El Alami3Isabel Cecilia Contreras Acosta4Yuleika Madriz1Richard Gloaguen1
- 1Helmholtz-Zentrum Dresden-Rossendorf, Helmholtz Institute Freiberg for Resource Technology, Freiberg, Germany
- 2Ai Movement - International Artificial Intelligence Center of Morocco, University Mohammed VI Polytechnic, Rabat, Morocco
- 3IAV Hassan II, School of Geomatics and Surveying Engineering, Rabat, Morocco
- 4TheiaX GmbH, Freiberg, Germany
Hyperspectral imaging is gaining widespread use in the resource sector, with applications in mineral exploration, geometallurgy and mine mapping. However, the sheer size of many hyperspectral datasets (>1 Tb) and associated correction, visualisation and analysis challenges can limit the integration of this technique into time-critical exploration and mining workflows. In this contribution, we propose and demonstrate a novel open-source workflow for rapidly processing hyperspectral data acquired on exploration drillcores. The resulting products are adaptable to the varied needs of geologists, geophysicists and geological engineers, facilitating better integration of hyperspectral data during decision making. These tools are applied to process hyperspectral data of 6.4 km of exploration drill cores from Stonepark (Ireland), Collinstown (Ireland) and Spremberg (Germany). The results are presented via an open-source web-viewing platform that we have developed to facilitate easy on and off-site access to hyperspectral data and its derivatives. We suggest that maximum value can be extracted from hyperspectral data if it is acquired shortly after drilling and processed on-site in real time, so that results can be quickly validated and used to inform time-critical decisions on sample selection, geological interpretation (logging) and drillhole continuation or termination. This timeliness and accessibility is key to ensure rapid data availability for decision makers during mineral exploration and exploitation. Finally, we discuss several remaining challenges that limit the real-time integration of hyperspectral drill core scanning data, and explore some opportunities that may arise as these rich datasets become more widely collected.
1 Introduction
The need for metalliferous raw materials is growing rapidly (Rankin, 2011), yet exploration successes are simultaneously becoming less frequent (Okada, 2021). Although efficient resource use (and re-use) can make-up for some of this looming supply shortfall, innovative exploration and characterisation techniques are required to identify previously missed or otherwise undiscovered deposits (of which there are likely many; Johnson et al., 2014), and more efficiently process existing resources using adaptive ore-sorting and processing techniques (Dominy et al., 2018).
Various innovative technologies are being developed to meet these needs, including novel geophysical approaches (e.g., full-tensor gravimetry and magnetics, muon tomography, novel seismic and electric approaches; Bryman et al., 2014; Malehmir et al., 2012; Pilkington, 2014; Schmidt et al., 2004) and characterisation methods (e.g., hyperspectral and XRF core-scanning; Barker et al., 2021; Kuhn et al., 2016; Linton et al., 2023). Of these, hyperspectral is one of the most versatile, with applications ranging in scale from satellite and airborne exploration (Cudahy et al., 2008; van der Meer et al., 2012; Bedini, 2017; Thiele et al., 2022), outcrop characterization and mine-face mapping (Kurz et al., 2011; Kirsch et al., 2018; Thiele et al., 2021; Kirsch et al., 2023), drill core scanning (Barker et al., 2021; De La Rosa et al., 2021; Géring et al., 2023; Linton et al., 2023) and petrographic sample characterisation (Nikonow et al., 2019; van Ruitenbeek et al., 2019). These all leverage the ability of hyperspectral techniques to rapidly, remotely and safely acquire continuous mineralogy data over large areas, and have resulted in innovative applications for mineral exploration (De La Rosa et al., 2021; Géring et al., 2023), geometallurgy (Barton et al., 2021), and sensor-based sorting for primary (Tuşa et al., 2020) and secondary (Paclík et al., 2006) resource streams.
The resulting “big data” contain many hundreds of highly-correlated spectral bands, which quantify the absorption or emission features characteristic of a wide range of materials, including many ore, gangue and alteration minerals (Laukamp et al., 2021). However, rapid and accurate on-site processing of these big data remains an outstanding challenge. Off-site work by hyperspectral experts, and integration with, e.g., mineralogical calibration data, will likely always be needed to gain full value from hyperspectral data, however in this contribution we develop a framework for providing real-time data processing, visualisation and (customisable) preliminary analysis products to facilitate better integration with often time-critical exploration decision making.
In the context of mineral exploration and geometallurgy, large hyperspectral datasets are currently applied to maximise the information extracted from expensive drill core samples, by:
1. Capturing an objective digital record of drill cores and their mineralogical composition and lithological variability (Acosta et al., 2019; Barker et al., 2021; e.g.; De La Rosa et al., 2021; Gairola et al., 2023; Rotem et al., 2023), i.e., data-driven geological logging.
2. Identifying alteration footprints that can help vector towards ore-deposits, including often cryptic changes in mineral chemistry (Arne et al., 2016; Lypaczewski et al., 2019; Géring et al., 2023), i.e., exploration vectoring.
3. Facilitating objective and consistent classification into lithological or alteration types (e.g., De La Rosa et al., 2022) for better geomodelling, i.e., domaining.
Each of these applications benefit from the wide-coverage and objective characterisation offered by hyperspectral core scan data. However, optimal use requires complex and computationally expensive preprocessing, correction and data-analysis workflows, making it a challenge to deliver interpretable data on, e.g., mineralogy in a timely fashion. This then limits the ability of hyperspectral data to be integrated with time-critical workflows, such as drilling, logging and sampling, especially as many exploration companies do not have in-house (or on-site) hyperspectral expertise.
Instead, hyperspectral data tends to be acquired, corrected, analysed, interpreted, visualised and delivered by service companies and consultancies (e.g., Terracore, Corescan, TheiaX, GeologicAI, Hyperspectral Intelligence, etc.). Several of these companies have developed or are developing (near) realtime processing solutions, however (to our knowledge) most industrial applications of hyperspectral core scanning rely on off-site data processing, with results typically only available after days to months. As a result, much of the value of hyperspectral data is lost, because decisions on drilling, sampling, and geological interpretation often take place before the processed hyperspectral data becomes available. This implies that the preliminary geological interpretations used to inform these decisions currently rely on potentially inconsistent (and often junior) geologists conducting the initial core logging. Simultaneously, the delay between hyperspectral data acquisition and analysis limits the ability of hyperspectral data suppliers to perform essential quality control and geological validation of hyperspectral predictions, as access to core become difficult if results only become available after logging has been completed and the core material put into storage.
In this contribution we aim to demonstrate that maximum value can be extracted from hyperspectral core scanning if results can be delivered in real time, and present a suite of open-source software tools that we have developed to facilitate the uptake of hyperspectral core scanning data by industry, geological surveys and academia. We then explore the potential of this real-time processing framework by envisaging a core shed in which hyperspectral data is fully integrated into the exploration workflow, allowing rapid interpretation, hypothesis testing, data driven sampling, hyperspectrally enhanced logging and self-updating 3D models.
2 Methods: a framework for real-time processing
Hyperspectral data acquired with a scanning system need to be pre-processed and corrected before accurate reflectance spectra can be derived (Linton et al., 2023). Typically, this involves a chain of 1) spectral and geometric corrections, 2) coregistration with sensors covering, e.g., different wavelength ranges, and often 3) cropping and masking to isolate the material of interest (drill cores). Once these correction steps are completed, the resulting stack of reflectance spectra can be analysed (e.g., Barker et al., 2021; De La Rosa et al., 2021; Géring et al., 2023) to 4) derive qualitative (e.g., band ratios, minimum wavelength maps) or quantitative (e.g., supervised predictions of lithology or mineralogy) results and 5) generate visualisations (e.g., as RGB false-colour composite images). These results, and the spectral data from which they are generated, then need to be saved in some form of database, alongside crucial metadata on, e.g., drillhole ID, scanned depth range, etc.
To achieve real-time processing, each of these computationally intense steps (which can involve the manipulation of several gigabytes worth of spectral data), need to be completed within 100–200 s, the approximate time taken to scan one tray of drill core samples. Some scanners also contain multiple sensors (covering different spectral ranges), increasing the computational load, but also allowing parallel computation. Lastly, the data and derived results need to be stored in a consistent data structure that allows for interactive visualisation, analysis and, e.g., mosaicing of results at the drillcore or project scale.
2.1 File-based workflows with crunchy
To conduct the real-time pre-processing, correction and analysis tasks outlined above, we have developed crunchy (https://github.com/hifexplo/crunchy); a python-based open-source asynchronous processing pipeline. At its core, crunchy (Figure 1) watches input directories for new files or directories that match user-defined patterns and then launches custom processing scripts (termed workflows), using a pool of worker threads to facilitate parallelisation. During hyperspectral data acquisition, a python utility (crunchyMirror) running on each sensor copies data to a storage and processing computer (in our implementation a relatively modest PC with 64 GB RAM and a 4.5 GHz AMD Ryzen 7700X 8-Core CPU) over a local LAN network, where a dedicated thread (crunchyScout) repeatedly checks the size of the new files or directories. Once file size has stabilised (indicating data copying is complete), crunchyMirror passes the new file or directory to a set of (user-defined) fileTriggers, which are represented in code using decorated functions that can instruct crunchy to:
1. Ignore the file,
2. Flag the file as relevant but incomplete, so that crunchy continues monitoring it but waits until the file size has increased further,
3. Trigger a processing workflow, in which the file, user-defined data and adjustable settings are passed through a list of processing functions (hereafter referred to as a workflow) using a separate worker thread.
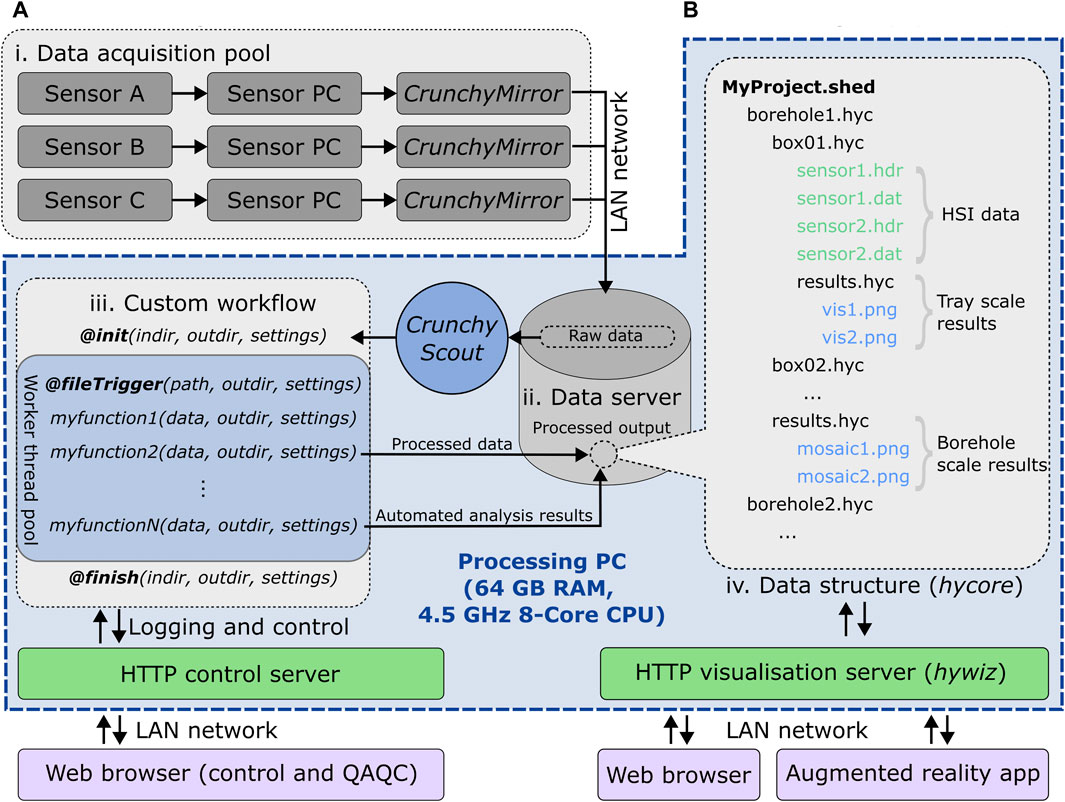
Figure 1. Schematic outline of the processing (A), data storage and visualisation (B) framework we have developed to achieve real time processing. Data is acquired using a pool of sensors (i) and copied over a local area network to the processing and data storage server (ii) using CrunchyMirror. These files are then examined by CrunchyScout and, once fully copied, passed to a fileTrigger that, based on the data type, triggers a custom processing workflow (iii). This workflow is executed in a pool of worker threads that allow for parallel processing (e.g., from different sensors). Workflow functions also write HSI data and analysis results to the data server, using hycore (iv) to ensure consistent data organisation. Processed results become immediately available for browser-based visualisation via a HTTP web visualisation server (hywiz).
We have designed crunchy to be sensor and application agnostic, with all sensor-specific code implemented via importable workflow functions and decorated fileTriggers. In our implementation for the Specim SiSuROCK core scanner (see Section 3), various functions are defined and chained together to preprocess and sensor-correct each image, coregister everything, compute preliminary hyperspectral data products for interpretation (band ratio composites, minimum wavelength maps and false-colour images), and save the results in a consistent data structure. Note that the lack of a robust automatic masking algorithm (as discussed in Section 4) limits this part of the workflow to relatively quick analyses that treat each pixel in the image independently, so that there are no artifacts from including (large numbers of) background pixels.
The core functionality of crunchy is exposed via a HTTP server, which provides an interactive browser-based user interface for monitoring progress and controlling workflow settings. The available settings are defined as a python dictionary included in each workflow script, allowing seamless integration of custom parameters with the HTML user interface. Worker threads can also report processing activity and flag errors, which are then logged in the GUI, facilitating important preliminary QAQC and error identification during data acquisition.
2.2 Data management and visualisation
Hyperspectral drill core databases are inherently large, often many terabytes. They can contain hundreds or thousands of hyperspectral images, often from multiple sensors, associated metadata (e.g., box start and end depths, band positions) and analysis results. Key related data, such as borehole surveys, assays, geochemistry, petrophysics or sample information, are often also relevant, so need to be stored in (or linked to) the data structure. Lastly, to enable real-time processing, this data structure needs to be modular and self-consistent, such that offline-scanning activities can easily be synchronised with a centralised storage system.
We have developed a python utility (hycore; https://github.com/hifexplo/hycore) that meets these needs. For simplicity, speed and flexibility, we use a simple hierarchical directory structure (Figure 1B) that can be constructed, managed and processed using hycore. Metadata is stored as <key>:<value> pairs within header text files (akin to the widely used ENVI format for hyperspectral data), while preview or analysis results are stored as .png files where possible, allowing rapid visualisation. Hyperspectral data (or other large arrays) are stored in a binary format (ENVI or numpy).
This approach, while slightly inefficient in terms of storage size (due to the lack of compression), facilitates: 1) storage of multiple data types for each scanned box, 2) fast read/write operations, 3) consistency over potentially extensive periods of data acquisition and, crucially, 4) flexible adjustment and editing of, e.g., erroneously acquired data. The storage of hyperspectral data in distributed files (each representing a single core tray) also facilitates parallel processing and out-of-core analysis when working at the borehole (or larger) scale. Such parallelism and memory management are essential when analysing multi-Tb data.
On top of this basic data structure, hycore also provides tools for assembling hyperspectral data and derived results into mosaics of one or more drillholes, for, e.g., visualisation, domaining or 3-D modelling. Mosaicing is achieved using a reproducible and flexible templating system: each pixel in a template image records the source box (index) and pixel therein (x, y coordinates) from which data should be extracted when assembling a mosaic. This allows rapid and memory-optimised assembly of geometrically identical mosaics presenting data from different sensors or analysis results. Templates images can be constructed in arbitrarily complex ways, generally involving 1) extraction rows of core from each box, 2) assigning a depth to the top of each row based on the box metadata, and 3) mapping of pixels onto the Template using various stacking or distribution techniques (e.g., pole and fence mosaics in which the cores are arranged lengthwise or as stacked boxes, respectively).
Lastly, we have also developed a HTTP server to accompany hycore, called hywiz (https://github.com/hifexplo/hywiz) that can 1) serve hyperspectral visualisations in an interactive fashion through any web browser, including during data acquisition and real-time processing 2) facilitate data entry during logging activities or quality control, by allowing the interactive addition of metadata or measurement locations, 3) export static websites that allow for easy distribution or web hosting. These visualisation tools can be seen in action here, and also serve as the basis for the augmented reality tool described in the following section.
2.3 AR-enhanced logging and sampling
Relatively recent advancements in the capabilities of mobile devices have facilitated the emergence of technologies such as Augmented Reality (AR; Carmigniani and Furht, 2011). This technology seamlessly overlays information on top of the real world, providing novel ways to interact with the environment. AR systems are based on the generation of real-time interactive graphics by overlaying live video feed with computer-generated imagery using a tracking system capable of determining the user’s viewpoint position and basic scene geometry (Carmigniani and Furht, 2011).
In the context of hyperspectral drill core scanning, these AR systems could be applied to help better integrate the often-complex results from hyperspectral analyses with tactile core logging, sampling or, e.g., XRF measurement activities. We have built a prototype system for the iPad platform (Figure 2) that allows the real-time processing results generated using crunchy and hywiz to be dynamically overlain on the cores using the ARKit framework (Linowes and Babilinski, 2017). Bridging the gap between digital data and physical samples, this approach allows a real-time interaction with the hyperspectral data and enhances the user’s ability to identify and analyse key features.
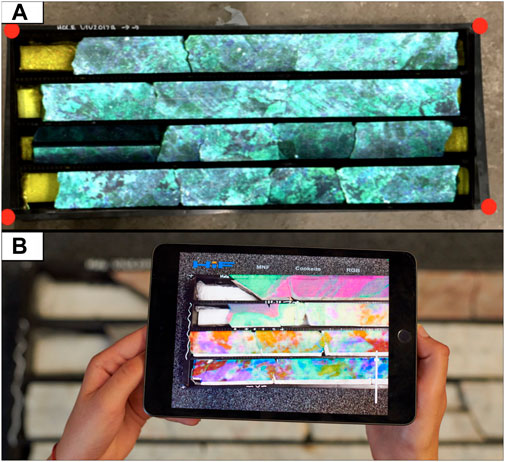
Figure 2. False colour composite of the bands at 3000, 3400 and 3800 nm from the Specim FX50 midwave-infrared sensor overlain on (true colour) video feed of a core box (A). The red circles are adjustable AR markers used to adjust alignment between the overlain image and the video feed. Once alignment is achieved, the tablet can be moved into any orientation while continuing to track the box (B). Different visualisations can also be easily toggled, to rapidly compare hyperspectral results and visual observations of, e.g., colour and texture. A video showing the use of this AR system is included in the Supplementary Material.
Our prototype uses a QR-code to quickly retrieve box details, before querying a (locally networked) hywiz server for the available visualisation products, and using adjustable markers (red spheres in Figure 2) to identify the box corners. Overlay images can then be selected and overlain for visualisation. Although we have not implemented it, such a system could also be extended to, for example, facilitate data entry by allowing easy addition of annotations, samples or measurement locations to the hyperspectral image data by tapping on the AR overlay. The LogAR project has developed similar capability, albeit without the integration of hyperspectral data (https://www.projectlive.org.au/exploration-metaverse).
3 Results: a real-time case study
To test and demonstrate our real time hyperspectral processing workflow, we have acquired hyperspectral data covering >6 km of exploration drill cores from Stonepark (County Limerick, Ireland), Collinstown (County Westmeath, Ireland) and Spremberg (Brandenburg, Germany) as part of the Horizon Europe project Vector (https://vectorproject.eu/). These cores (Table 1) were selected to better understand sediment-hosted lead, zinc and copper mineral systems, with a particular emphasis on potential distal signatures that could be used to “vector” towards mineralisation during exploration.
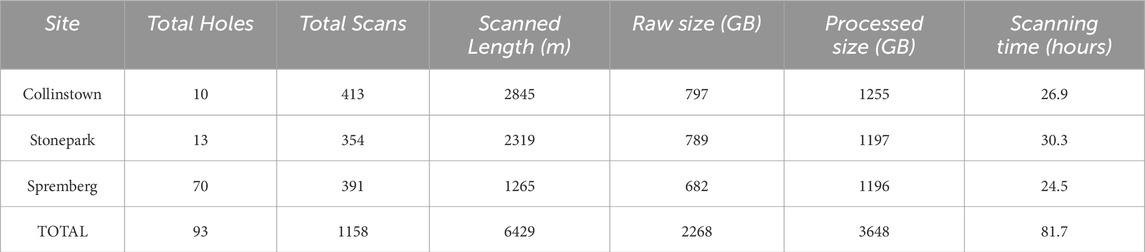
Table 1. Summary of the hyperspectral data acquired at each of the VECTOR study sites. Crunchy was used to generate real-time qualitative results (band ratios, minimum wavelength maps, etc.) during each of these scanning campaigns. The processed datasets are available for download at https://doi.org/10.14278/rodare.2866, https://doi.org/10.14278/rodare.2868 and https://doi.org/10.14278/rodare.2864.
To ensure high quality hyperspectral data, the cores were (where possible) cut, cleaned and levelled prior to scanning. Although laborious, this helps guarantee good quality spectra (Damaschke et al., 2023), especially in the mid- and long-wave spectral ranges, although for larger core diameters scanning uncut cores is also possible. A Specim SiSuROCK hyperspectral drill core scanner (Figure 3) fitted with four cameras covering the visible (RGB-Jai), visible-near infrared to shortwave infrared (380–2500 nm; AisaFENIX), midwave infrared (2700–5300 nm; FX50) and longwave infrared (7700–12300 nm; AisaOWL) spectral ranges (Table 2) was then used to acquire the hyperspectral data. Two to three core boxes (3–6 m of core) fit in the sensor per scan (Figure 3C).
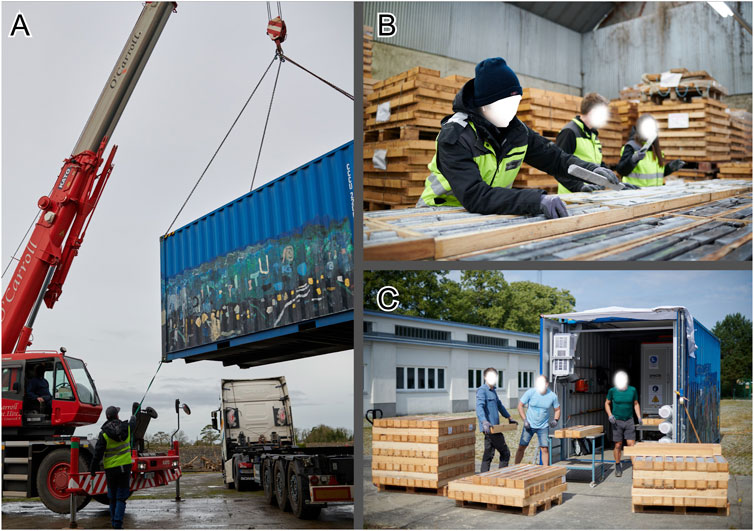
Figure 3. Hyperspectral drill core scanning campaign for the VECTOR project. (A) Container-housed hyperspectral scanner arrives on site at Stonepark, Ireland. (B) Drill core preparation at G11 core repository. (C) Scanning of Kupferschiefer drill cores at the Geological Survey of Brandenburg, Germany.
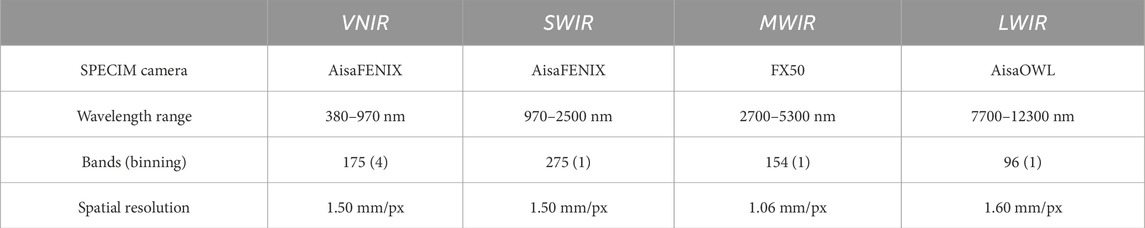
Table 2. Acquisition parameters of the SisuROCK drill core scanner.
At the start of each scanning session, a calibration image containing six fiducial codes was acquired, which our crunchy-based workflow used to automatically estimate the camera offsets and compute an affine transform for coregistering images from each sensor. The FX50 sensor was used as the base for this coregistration, as it has the highest spatial resolution. High-resolution RGB images were also coregistered, but with 6 pixels for every 1 hyperspectral pixel.
Next, the coregistered image stack was subject to a series of hyperspectral analyses to compute a set of real-time results containing spectral indices, false-colour composites and minimum wavelength maps that constrained the distribution of carbonate and clay minerals, iron speciation and water content. These results were stored as PNG files and used to create interactive hywiz visualisations (Figure 4A) that allowed 1) on-site QAQC of the hyperspectral data quality (by interactively checking the spectra and associated derivative data, such as band ratios and minimum wavelength maps), 2) hypothesis testing based on hyperspectral observations, and 3) targeted sampling for mineralogy characterisation based on the hyperspectral results. This latter data-driven sampling approach will be the subject of a future publication.
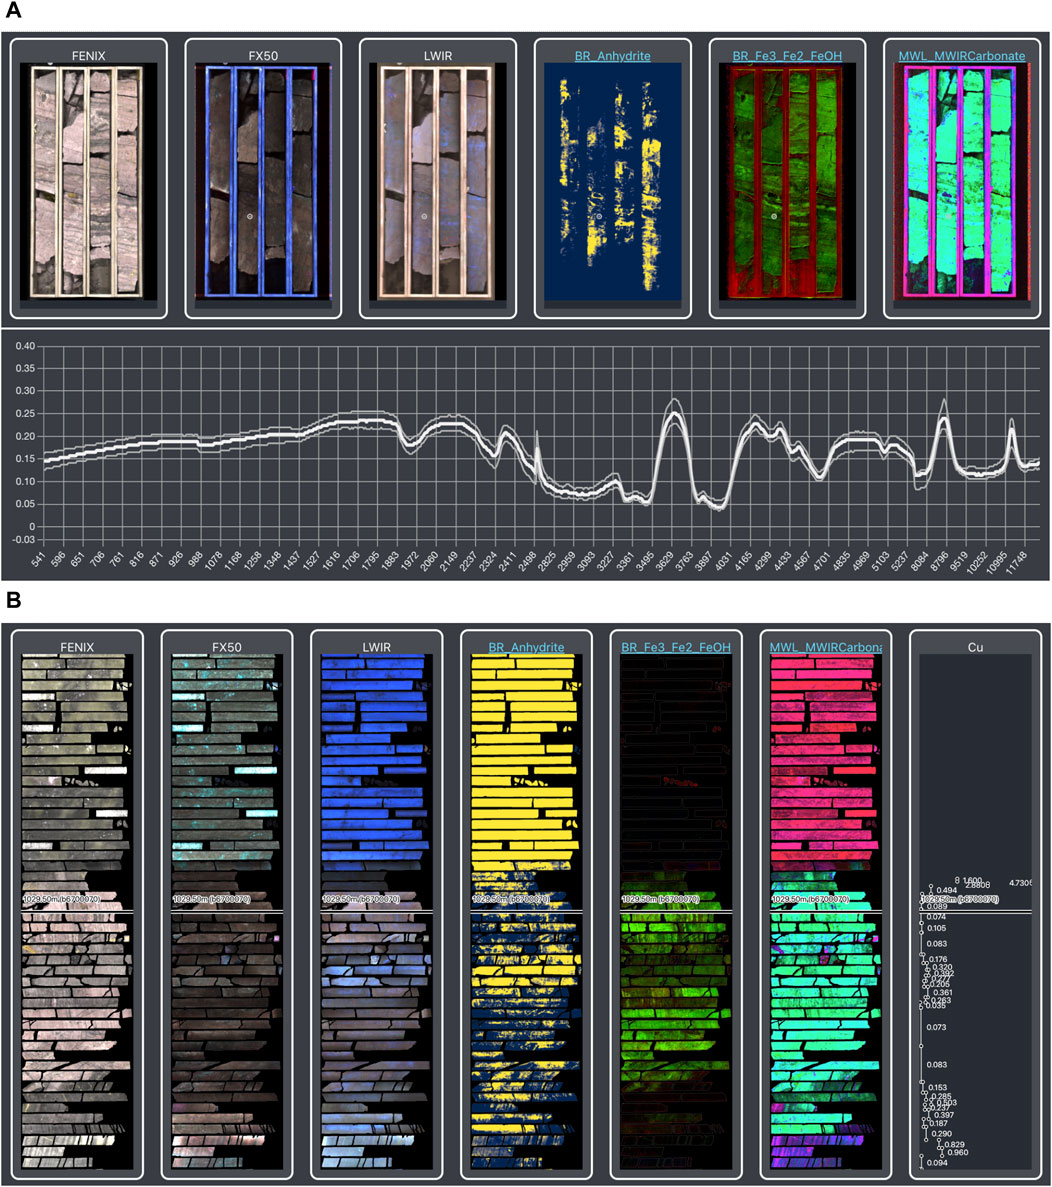
Figure 4. Real time processing results (A) including coregistered false-colour composites of selected bands from each hyperspectral sensor, and qualitative results highlighting anhydrite abundance, iron speciation and carbonate mineralogy. The hywiz visualisation platform delivers these visualisations in real-time, including spectral information for QAQC and on-site interpretation. After masking, hycore was used to construct borehole mosaics that can also be visualised using hywiz as, for example, fence-plots (B). Additional data on, e.g., grade, mineralogy and geochemistry can be included in these visualisations to facilitate integrated interpretation. These results can be viewed online here.
The workflow described by Arbash et al. (2023) was then used to generate automated masks separating the drill cores from the surrounding boxes (and scanning table). This approach applies the Segment Anything Model (Kirillov et al., 2023), a deep convolutional neural network that creates generic object segmentations, to false-colour composite images from the FX50 sensor and then identifies drill cores by their geometric features. While this approach performed surprisingly well (given its relative simplicity), manual vetting and correction of the resulting masks was required.
An interactive plugin for the open-source Napari image viewer (Chiu and Clack, 2022) was developed to help quickly check these masks and correct them when necessary. It also allows the interactive interrogation of image spectra, and addition of annotations (points and polygons) that document, for example, sample locations. The plugin, and its associated documentation, is available at https://github.com/hifexplo/napari-hippo.
After generating these masks (i.e., no longer in real time, as the masks needed to be manually vetted), hycore was used to construct mosaics combining the mask information and real-time results from each of the scanned trays (Figure 4B), to derive summary images for each drillhole. These can be interactively visualised with the hywiz web-compatible interface, as shown at https://www.hzdr.de/FWG/FWGE/Spremberg_html/index.html.
These hyperspectral results capture a portion of the lithological and mineralogical variability associated with sediment hosted base metal deposits in Ireland and Germany. An in-depth analysis of these results is beyond the scope of this contribution (though will be the subject of a follow up paper), however we make a few observations here relating to the power of hyperspectral analyses that can be conducted in real or near-real time.
First and foremost, we were able to compute the band ratio and minimum wavelength products outlined by Géring et al. (2023). These allowed us to distinguish key minerals such as iron oxides, quartz, carbonates, clays and sulphates (which can be challenging to visually identify; Figure 5) within minutes of scanning, and generate images of each core box visualising the mineralogical variability therein. These images (https://www.hzdr.de/FWG/FWGE/Spremberg_html/index.html) were then used to select sampling locations for automated mineralogy analyses, allowing us to identify thin-section blocks containing representative or unusual mineralogy, and devise a sampling strategy aimed to validate specific hyperspectral hypotheses. Although not conducted in the scope of this project, these images could also be integrated into geological logging activities, such that core boxes are laid out on logging racks after scanning and the hyperspectral results (available from a computer or, as outlined in Section 2.3, augmented reality app) used to more accurately log the cores.
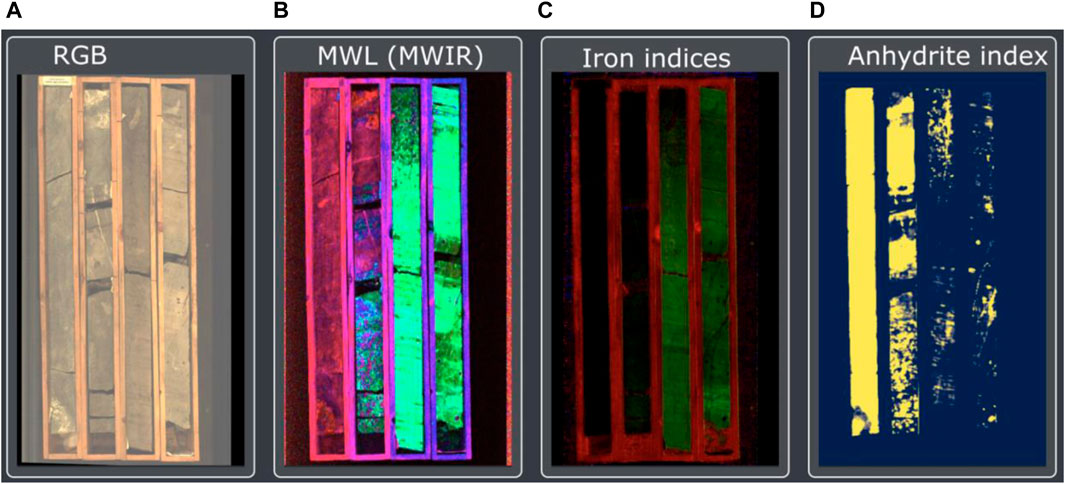
Figure 5. Real-time hyperspectral results highlighting otherwise subtle variations that are difficult to identify and interpret during conventional core-logging or with RGB imagery (A) only. These variations include a gradual transition from calcitic (pink) to dolomitic (green) mineralogy, mapped here using the MWIR data (B), zones of Fe2+ enrichment (green; in this case ferroan dolomite) mapped using VNIR data (C), and patchy/nodular anhydrite cements (yellow); (D), mapped using LWIR data. These results can be viewed in the hywiz viewer here. The specific spectral indices used are described in more detail within Géring et al. (2023).
4 Discussion and future directions
Rapid and agile decision making are particularly crucial in dynamic mining and exploration environments. Real-time hyperspectral analysis, as can be achieved using the methods outlined above, would allow immediate identification of mineral variations, enabling on-the-spot adjustments to drilling strategies or resource delineation. The integration of hyperspectral core scanning into real-time monitoring systems thus has the potential to streamline exploration and production workflows, reducing costs and increasing the overall efficiency of mining and exploration operations. It seems that several service providers are moving in this direction.
Recent technology developments and processing approaches set the scene for real-time geological analysis, based on fast and smart processing of hyperspectral data. However, the data volumes can be overwhelming: with this contribution we aim to resolve this limitation by introducing and demonstrating a flexible open-source software framework for the pre-processing, analysis and visualisation of hyperspectral data in real-time (within minutes of data acquisition). In doing so, hyperspectral data and their derived products can be provided promptly to inform decision making during logging, sampling or drilling, and allow rapid testing of hypotheses on, e.g., mineralogy predicted by the hyperspectral data. To ensure practical use in remote locations, these methods have been designed to require only modest computing power (i.e., a relatively standard desktop PC) and, crucially, only need local network access.
4.1 Future potential for real-time hyperspectral data in mineral exploration workflows
The framework for the real time processing and interactive visualisation that we propose and demonstrate in this contribution opens a range of interesting possibilities. First and foremost, we hope that it paves the way for significantly tighter integration between hyperspectral analyses and conventional exploration workflows. If real-time hyperspectral results can be made available before sampling and geological logging has been conducted, they could be used to significantly enhance these activities, by: 1) allowing spectral domaining approaches (e.g., De La Rosa et al., 2022) to define geologically-meaningful sampling intervals, 2) identifying anomalies, clusters or otherwise unexpected spectra for closer inspection or more detailed sampling (e.g., Gairola et al., 2023), and 3) incorporating spectral interpretations into geological logging and, e.g., alteration mapping (e.g., Géring et al., 2023; Lypaczewski et al., 2019). Importantly, feedback from these geological activities would ideally be integrated to test and adjust or update hyperspectral analysis routines, without requiring laborious relogging or other post hoc quality control or hypothesis testing.
The continuous and mineralogically revealing data captured by hyperspectral scanners also provides an interesting foundation for further automated data collection. For example, a small number of hyperspectral endmember pixels and/or representative domains can be automatically selected in each core box as part of the real-time processing routine, and used to guide the collection of complementary data using handheld XRF or LIBS instruments. Industrial tools, such as robotic arms, could even be deployed to completely automate this.
Lastly, the rich data stream made available by real-time hyperspectral analyses could be fed into self-updating 3D geological models, to help make rapid decisions on, e.g., further drilling. Several authors (e.g., De La Rosa et al., 2022; Zaitouny et al., 2021) have already suggested methods that could be used to identify lithological domains in hyperspectral data (at adjustable scales), while developments in implicit 3D geological modelling workflows (e.g., Grose et al., 2021; Hillier et al., 2023; Varga et al., 2019) provide the basic tools needed to construct geological models that can automatically incorporate new data.
4.2 Outstanding challenges
Our experience testing the processing methods presented above during multi-kilometer scanning campaigns suggest several challenges remain before the full potential of real-time processing can be realised.
Firstly, as mentioned already, robustly deriving masks separating the core samples of interest from background and core-box pixels proved challenging. While deep-learning (CNN) based (e.g., Arbash et al., 2023; Rotem et al., 2023) and/or spectral-based (e.g., De La Rosa et al., 2021; Rogers and Pracht, 2023) methods can generally be tuned to work in specific situations (e.g., a single box material and dimensions), these proved challenging to generalise and prone to misclassify unexpected materials (e.g., metre markers inserted into core trays, foam spacers, mud, etc.). Hence, while deep-learning based tray masking shows significant promise, we suggest that further work is needed to 1) compile training datasets involving a diversity of core box types and conditions, 2) better integrate spectral information into CNN-based masking approaches, and 3) achieve performances and computational requirements that are compatible with real-time masking.
In the meantime, we have circumvented these limitations by performing real time analyses on unmasked images. For classic spectral analyses (e.g., band ratios, minimum wavelength maps; Géring et al., 2023) this is not an issue, though the inclusion of background pixels requires greater computation power (as more pixels need to be processed) and limits the applicability of other common statistical approaches (e.g., dimensionality reduction) that are negatively influenced by irrelevant variability in the background pixels. Realising many of the possibilities outlined above (e.g., data-driven sampling, robot-assisted point measurements or self-updating 3D models) would require a robust and generalisable solution to drill core masking (e.g., Arbash et al., 2023).
Coregistration with pixel or sub-pixel accuracy also remains a significant challenge. While not strictly necessary if mineralogy is relatively homogenous (at the mm scale), subpixel coregistration accuracy is needed to accurately compare spectra between sensors for, e.g., coarse-grained igneous or sedimentary rocks (to avoid juxtaposing spectra from different minerals). Our current workflow automatically computes a homography transformation that aligns co-registration points automatically detected during a (regularly repeated) calibration scan. This implicitly assumes a planar geometry, resulting in coregistration errors above or below the plane for which this calibration was performed (the focal plane of the sensors), causing several-pixel offsets where the samples being scanned are at the incorrect height or non-planar (e.g., round cores). However, better coregistration could be achieved using an approach that does not rely on a homography transform, requiring either:
1. Development of computer vision matching techniques (keypoint detection and/or optical flow algorithms) that are robust to the significant variability in reflectance between the different spectral ranges, such that (highly) non-linear transformations can be used to warp the data cubes from each sensor into alignment. New deep-learning approaches to image matching, such as Super-Glue (Sarlin et al., 2020; Barath et al., 2023), may resolve this challenging problem.
2. Use of sensors with overlapping spectral ranges, such that e.g., optical flow algorithms can be used to construct accurate pixel displacement maps, and so fit data cubes from each sensor together.
3. Integration of 3-D information, by adding e.g., a laser profiler to the scanner setup. As well as capturing additional useful geometric information on the drill cores (and potentially useful features for tray masking), the resulting height maps could theoretically be used to achieve accurate coregistration using a back-projection method similar to that used for airborne or UAV hyperspectral data (e.g., Thiele et al., 2022).
5 Conclusion
Hyperspectral characterisation of exploration drill cores is most useful if acquired as soon as feasible after drilling, such that 1) preliminary spectral results can be used to inform time-critical decision making on drilling, sampling and logging activities, and 2) predictions or hypotheses resulting from the hyperspectral data can be tested while core is still easily accessible. To enable this, we present and demonstrate an open-source software pipeline that facilitates the real-time preprocessing, analysis and visualisation of large hyperspectral drill core databases. We suggest that this allows for efficient, timely, and automated delivery of hyperspectral data to enhance geological activities, and hope that the tools we describe can help to facilitate the uptake of hyperspectral core scanning data by industry, geological surveys and academia. In doing so, the information captured within these rich datasets could be accessed in real-time and used to enhance explorer’s abilities to log, sample and, ultimately, vector towards much-needed ore deposits.
Data availability statement
The datasets presented in this study can be found in online repositories. The names of the repositories and accession number(s) can be found below: https://doi.org/10.14278/rodare.2866, https://doi.org/10.14278/rodare.2868, https://doi.org/10.14278/rodare.2864.
Author contributions
ST: Conceptualization, Data curation, Formal Analysis, Investigation, Methodology, Resources, Software, Supervision, Validation, Visualization, Writing–original draft, Writing–review and editing. MK: Conceptualization, Funding acquisition, Project administration, Resources, Validation, Writing–original draft, Writing–review and editing. SL: Methodology, Software, Writing–original draft, Writing–review and editing. HS: Methodology, Software, Visualization, Writing–original draft, Writing–review and editing. SE: Methodology, Software, Visualization, Writing–original draft, Writing–review and editing. IC: Validation, Writing–original draft, Writing–review and editing. YM: Data curation, Methodology, Writing–original draft, Writing–review and editing. RG: Funding acquisition, Project administration, Validation, Writing–original draft, Writing–review and editing.
Funding
The author(s) declare that financial support was received for the research, authorship, and/or publication of this article. This research has received funding from the European Union’s Horizon Europe research and innovation programme under grant agreement nº 101058483 and from UK Research and Innovation.
Acknowledgments
We would also like to acknowledge Tina Pereira, Group Eleven Resources Corp, Teck Ireland, Boliden Tara Mines Limited, KSL Kupferschiefer Lausitz GmbH, the Geological Survey of Ireland and the Geological Survey of Brandenburg for their support during hyperspectral scanning conducted as part of this research.
Conflict of interest
The authors declare that the research was conducted in the absence of any commercial or financial relationships that could be construed as a potential conflict of interest.
Publisher’s note
All claims expressed in this article are solely those of the authors and do not necessarily represent those of their affiliated organizations, or those of the publisher, the editors and the reviewers. Any product that may be evaluated in this article, or claim that may be made by its manufacturer, is not guaranteed or endorsed by the publisher.
Supplementary material
The Supplementary Material for this article can be found online at: https://www.frontiersin.org/articles/10.3389/feart.2024.1433662/full#supplementary-material
References
Acosta, I. C. C., Khodadadzadeh, M., Tusa, L., Ghamisi, P., and Gloaguen, R. (2019). A machine learning framework for drill-core mineral mapping using hyperspectral and high-resolution mineralogical data fusion. IEEE J. Sel. Top. Appl. Earth Obs. Remote Sens. 12, 4829–4842. doi:10.1109/JSTARS.2019.2924292
Arbash, E., Ribeiro, A. de L., Thiele, S., Gnann, N., Rasti, B., Fuchs, M., et al. (2023). Masking hyperspectral imaging data with pretrained models. doi:10.48550/arXiv.2311.03053
Arne, D., House, E., Pontual, S., and Huntington, J. (2016). Hyperspectral interpretation of selected drill cores from orogenic gold deposits in central Victoria, Australia. Aust. J. Earth Sci. 63, 1–23. doi:10.1080/08120099.2016.1223171
Barath, D., Mishkin, D., Cavalli, L., Sarlin, P.-E., Hruby, P., and Pollefeys, M. (2023). Affineglue: oint matching and robust estimation. ArXiv Prepr. ArXiv230715381. doi:10.48550/arXiv.2307.15381
Barker, R. D., Barker, S. L. L., Cracknell, M. J., Stock, E. D., and Holmes, G. (2021). Quantitative mineral mapping of drill core surfaces II: long-wave infrared mineral characterization using μXRF and machine learning. Econ. Geol. 116, 821–836. doi:10.5382/econgeo.4804
Barton, I. F., Gabriel, M. J., Lyons-Baral, J., Barton, M. D., Duplessis, L., and Roberts, C. (2021). Extending geometallurgy to the mine scale with hyperspectral imaging: a pilot study using drone- and ground-based scanning. Min. Metall. Explor. 38, 799–818. doi:10.1007/s42461-021-00404-z
Bedini, E. (2017). The use of hyperspectral remote sensing for mineral exploration: a review. J. Hyperspectral Remote Sens. 7, 189–211. doi:10.29150/jhrs.v7.4.p189-211
Bryman, D., Bueno, J., Davis, K., Kaminski, V., Liu, Z., Oldenburg, D., et al. (2014). “Muon geotomography—bringing new physics to orebody imaging,” in Building exploration capability for the 21st century. Editors K. D. Kelley, and H. C. Golden (Society of Economic Geologists), 0. doi:10.5382/SP.18.11
Carmigniani, J., and Furht, B. (2011). Augmented reality: an overview. Handb. Augment. Real. 3–46, 3–46. doi:10.1007/978-1-4614-0064-6_1
Chiu, C.-L., and Clack, N. (2022). Napari: a Python multi-dimensional image viewer platform for the research community. Microsc. Microanal. 28, 1576–1577. doi:10.1017/s1431927622006328
Cudahy, T., Jones, M., Thomas, M., Laukamp, C., Caccetta, M., Hewson, R., et al. (2008). Next generation mineral mapping: queensland airborne HyMap and satellite ASTER surveys 2006–2008. Perth Publicly Available Rep. P2007364 152.
Damaschke, M., Fellgett, M. W., Howe, M. P. A., and Watson, C. J. (2023). Unlocking national treasures: the core scanning approach. Geol. Soc. Lond. Spec. Publ. 527, 77–94. doi:10.1144/SP527-2022-58
De La Rosa, R., Khodadadzadeh, M., Tusa, L., Kirsch, M., Gisbert, G., Tornos, F., et al. (2021). Mineral quantification at deposit scale using drill-core hyperspectral data: a case study in the Iberian Pyrite Belt. Ore Geol. Rev. 139, 104514. doi:10.1016/j.oregeorev.2021.104514
De La Rosa, R., Tolosana-Delgado, R., Kirsch, M., and Gloaguen, R. (2022). Automated multi-scale and multivariate geological logging from drill-core hyperspectral data. Remote Sens. 14, 2676. doi:10.3390/rs14112676
Dominy, S. C., O’Connor, L., Parbhakar-Fox, A., Glass, H. J., and Purevgerel, S. (2018). Geometallurgy—a route to more resilient mine operations. Minerals 8, 560. doi:10.3390/min8120560
Gairola, G., Thiele, S., Khanna, P., Ramdani, A., Gloaguen, R., and Vahrenkamp, V. (2023). A data-driven hyperspectral method for sampling of diagenetic carbonate fabrics. doi:10.2139/ssrn.4435524
Géring, L., Kirsch, M., Thiele, S., De Lima Ribeiro, A., Gloaguen, R., and Gutzmer, J. (2023). Spectral characterisation of hydrothermal alteration associated with sediment-hosted Cu–Ag mineralisation in the central European Kupferschiefer. Solid earth. 14, 463–484. doi:10.5194/se-14-463-2023
Grose, L., Ailleres, L., Laurent, G., and Jessell, M. (2021). LoopStructural 1.0: time-aware geological modelling. Geosci. Model Dev. 14, 3915–3937. doi:10.5194/gmd-14-3915-2021
Hillier, M., Wellmann, F., de Kemp, E. A., Brodaric, B., Schetselaar, E., and Bédard, K. (2023). GeoINR 1.0: an implicit neural network approach to three-dimensional geological modelling. Geosci. Model Dev. 16, 6987–7012. doi:10.5194/gmd-16-6987-2023
Johnson, K. M., Hammarstrom, J. M., Zientek, M. L., and Dicken, C. L. (2014). Estimate of undiscovered copper resources of the world, 2013. U. S. Geol. Surv. Fact. Sheet 2014, 3004. doi:10.3133/fs20143004
Kirillov, A., Mintun, E., Ravi, N., Mao, H., Rolland, C., Gustafson, L., et al. (2023). Segment anything. ArXiv Prepr. ArXiv230402643. doi:10.48550/arXiv.2304.02643
Kirsch, M., Lorenz, S., Zimmermann, R., Tusa, L., Möckel, R., Hödl, P., et al. (2018). Integration of terrestrial and drone-borne hyperspectral and photogrammetric sensing methods for exploration mapping and mining monitoring. Remote Sens. 10, 1366. doi:10.3390/rs10091366
Kirsch, M., Mavroudi, M., Thiele, S., Lorenz, S., Tusa, L., Booysen, R., et al. (2023). Underground hyperspectral outcrop scanning for automated mine-face mapping: the lithium deposit of Zinnwald/Cínovec. Photogramm. Rec. 38, 408–429. doi:10.1111/phor.12457
Kuhn, K., Meima, J. A., Rammlmair, D., and Ohlendorf, C. (2016). Chemical mapping of mine waste drill cores with laser-induced breakdown spectroscopy (LIBS) and energy dispersive X-ray fluorescence (EDXRF) for mineral resource exploration. J. Geochem. Explor. 161, 72–84. doi:10.1016/j.gexplo.2015.11.005
Kurz, T. H., Buckley, S. J., Howell, J. A., and Schneider, D. (2011). Integration of panoramic hyperspectral imaging with terrestrial lidar data. Photogramm. Rec. 26, 212–228. doi:10.1111/j.1477-9730.2011.00632.x
Laukamp, C., Rodger, A., LeGras, M., Lampinen, H., Lau, I. C., Pejcic, B., et al. (2021). Mineral physicochemistry underlying feature-based extraction of mineral abundance and composition from shortwave, mid and thermal infrared reflectance spectra. Minerals 11, 347. doi:10.3390/min11040347
Linowes, J., and Babilinski, K. (2017). Augmented reality for developers: build practical augmented reality applications with unity, ARCore, ARKit, and Vuforia. Packt Publishing Ltd.
Linton, P., Kosanke, T., Greene, J., and Porter, B. (2023). The application of hyperspectral core imaging for oil and gas. Geol. Soc. Lond. Spec. Publ. 527, 95–119. doi:10.1144/SP527-2022-2
Lypaczewski, P., Rivard, B., Gaillard, N., Perrouty, S., Piette-Lauzière, N., Bérubé, C. L., et al. (2019). Using hyperspectral imaging to vector towards mineralization at the Canadian Malartic gold deposit, Québec, Canada. Ore Geol. Rev. 111, 102945. doi:10.1016/j.oregeorev.2019.102945
Malehmir, A., Durrheim, R., Bellefleur, G., Urosevic, M., Juhlin, C., White, D. J., et al. (2012). Seismic methods in mineral exploration and mine planning: a general overview of past and present case histories and a look into the future. GEOPHYSICS 77, WC173–WC190. doi:10.1190/geo2012-0028.1
Nikonow, W., Rammlmair, D., Meima, J. A., and Schodlok, M. C. (2019). Advanced mineral characterization and petrographic analysis by μ-EDXRF, LIBS, HSI and hyperspectral data merging. Mineral. Pet. 113, 417–431. doi:10.1007/s00710-019-00657-z
Okada, K. (2021). A historical overview of the past three decades of mineral exploration technology. Nat. Resour. Res. 30, 2839–2860. doi:10.1007/s11053-020-09721-4
Paclík, P., Leitner, R., and Duin, R. P. W. (2006). A study on design of object sorting algorithms in the industrial application using hyperspectral imaging. J. Real-Time Image Process 1, 101–108. doi:10.1007/s11554-006-0018-5
Pilkington, M. (2014). Evaluating the utility of gravity gradient tensor components. GEOPHYSICS 79, G1–G14. doi:10.1190/geo2013-0130.1
Rankin, W. J. (2011). Minerals, metals and sustainability: meeting future material needs. CSIRO publishing.
Rogers, R., and Pracht, M. (2023). Hyperspectral facies analysis as a lithological interpretation tool for carbonate rocks. Geosciences 13, 381. doi:10.3390/geosciences13120381
Rotem, A., Vidal, A., Pfaff, K., Tenorio, L., Chung, M., Tharalson, E., et al. (2023). Interpretation of hyperspectral shortwave infrared core scanning data using SEM-based automated mineralogy: a machine learning approach. Geosciences 13, 192. doi:10.3390/geosciences13070192
Sarlin, P.-E., DeTone, D., Malisiewicz, T., and Rabinovich, A. (2020). “Superglue: learning feature matching with graph neural networks,” in Proceedings of the IEEE/CVF conference on computer vision and pattern recognition, 4938–4947.
Schmidt, P., Clark, D., Leslie, K., Bick, M., Tilbrook, D., and Foley, C. (2004). GETMAG – a SQUID magnetic tensor gradiometer for mineral and oil exploration. Explor. Geophys. 35, 297–305. doi:10.1071/EG04297
Thiele, S. T., Bnoulkacem, Z., Lorenz, S., Bordenave, A., Menegoni, N., Madriz, Y., et al. (2022). Mineralogical mapping with accurately corrected shortwave infrared hyperspectral data acquired obliquely from UAVs. Remote Sens. 14, 5. doi:10.3390/rs14010005
Thiele, S. T., Lorenz, S., Kirsch, M., Acosta, I. C. C., Tusa, L., Hermann, E., et al. (2021). Multi-scale, multi-sensor data integration for automated 3-D geological mapping. Ore Geol. Rev. 136, 104252. doi:10.1016/j.oregeorev.2021.104252
Tuşa, L., Kern, M., Khodadadzadeh, M., Blannin, R., Gloaguen, R., and Gutzmer, J. (2020). Evaluating the performance of hyperspectral short-wave infrared sensors for the pre-sorting of complex ores using machine learning methods. Min. Eng. 146, 106150. doi:10.1016/j.mineng.2019.106150
van der Meer, F. D., van der Werff, H. M. A., van Ruitenbeek, F. J. A., Hecker, C. A., Bakker, W. H., Noomen, M. F., et al. (2012). Multi- and hyperspectral geologic remote sensing: a review. Int. J. Appl. Earth Obs. Geoinformation 14, 112–128. doi:10.1016/j.jag.2011.08.002
van Ruitenbeek, F. J. A., van der Werff, H. M. A., Bakker, W. H., van der Meer, F. D., and Hein, K. A. A. (2019). Measuring rock microstructure in hyperspectral mineral maps. Remote Sens. Environ. 220, 94–109. doi:10.1016/j.rse.2018.10.030
Varga, M., Schaaf, A., and Wellmann, F. (2019). GemPy 1.0: open-source stochastic geological modeling and inversion. Geosci. Model Dev. 12, 1–32. doi:10.5194/gmd-12-1-2019
Keywords: hyperspectral (HS), big data and analytics, visualisation and interaction, minerals exploration, drillcore, geology
Citation: Thiele ST, Kirsch M, Lorenz S, Saffi H, El Alami S, Contreras Acosta IC, Madriz Y and Gloaguen R (2024) Maximising the value of hyperspectral drill core scanning through real-time processing and analysis. Front. Earth Sci. 12:1433662. doi: 10.3389/feart.2024.1433662
Received: 16 May 2024; Accepted: 25 July 2024;
Published: 06 August 2024.
Edited by:
Ebrahim Fathi, West Virginia University, United StatesReviewed by:
Mark Lindsay, Commonwealth Scientific and Industrial Research Organisation (CSIRO), AustraliaTom Horrocks, University of Western Australia, Australia
Copyright © 2024 Thiele, Kirsch, Lorenz, Saffi, El Alami, Contreras Acosta, Madriz and Gloaguen. This is an open-access article distributed under the terms of the Creative Commons Attribution License (CC BY). The use, distribution or reproduction in other forums is permitted, provided the original author(s) and the copyright owner(s) are credited and that the original publication in this journal is cited, in accordance with accepted academic practice. No use, distribution or reproduction is permitted which does not comply with these terms.
*Correspondence: Samuel T. Thiele, cy50aGllbGVAaHpkci5kZQ==