 Erxing Peng
 Dandan Li3
- 1State Key Laboratory of Performance Monitoring and Protecting of Rail Transit Infrastructure, East China Jiaotong University, Nanchang, Jiangxi, China
- 2Key Laboratory of Cryospheric Science and Frozen Soil Engineering, Northwest Institute of Eco-Environment and Resources, Chinese Academy of Sciences, Lanzhou, Gansu, China
- 3School of Civil Engineering, Lanzhou University of Technology, Lanzhou, Gansu, China
- 4School of Civil Engineering and Architecture, East China Jiaotong University, Nanchang, Jiangxi, China
- 5China Railway Qinghai-Tibet Group Co., Ltd, Chengdong, China
To clarify the influence range and saturation distribution after the biogas desaturation method is applied, a three-dimensional model is established with TOUGH2 software to analyze the effect of construction parameters such as grouting volume, grouting rate, grouting depth, nitrogen source concentration, and soil porosity. After that, the sensitivity of the parameters on the influence range is determined. The grouting volume and soil porosity are the most sensitive to the lateral and vertical influence range, respectively. This study provides a basis for the engineering practice of treating liquefiable subgrade by the biogas desaturation method.
1 Introduction
Seismic subsidence and lateral expansion caused by the liquefaction of saturated soil can cause a series of serious seismic and geological disasters, such as collapse, tilting, uneven settlement of upper structures, road cracking, uplift of underground structures, and foundation damage (Feng et al., 2023; Xiang et al., 2023; Cai et al., 2024). Desaturation is a new and low-carbon treatment method for liquefiable subgrade (Jiang et al., 2020; Bianet al. 2024). This method can not only be used in new construction projects but can also be used to treat subgrade under existing buildings or structures (Eseller-Bayat E E, 2009). In recent years, some scholars have studied the desaturation method and suggested that the liquefaction resistance of sand can be improved with significant decrease in saturation. Martin et al. (1978) pointed out that under cyclic loading, when the saturation of sand samples with a porosity of 0.4 is reduced by 1%, the increment in excess pore water pressure will be reduced by 28%. Chaney (1978) found that when the saturation of sand decreases to 90%, its liquefaction resistance increases by two times. Yoshimi et al. (1989) carried out cyclic torsional shear tests on the samples under different saturation levels, and the results showed that the liquefaction resistance of soil increased significantly with decreasing soil saturation, and when the saturation level decreased to 70.0%, its liquefaction strength was three times that of saturated soil samples. Xia and Hu (1991) indicated that when the cyclic stress ratio is constant, the soil saturation decreases from 100.0% to 98.7%, and the critical cycle number increases by more than 30.0%. In conclusion, the saturation of sand has a significant effect on the liquefaction resistance of sand, and a slight decrease in saturation can significantly improve the liquefaction resistance of sand (Tsukamoto et al., 2002; Eseller-Bayat et al., 2013; Chen et al., 2017). However, further research is needed on the saturation distribution of the subgrade after desaturation treatment.
According to the gas/air injection method, desaturation can be divided into air injection, water electrolysis, and biogas (Peng et al., 2018). Furthermore, because nitrogen produced by the biogas method is inert, has low water solubility, and can be distributed more uniformly, this method should be studied more and promoted for application. The main principle of the biogas method is injecting the denitrifying bacterial suspension into the liquefiable soil, and the bacteria can generate nitrogen in situ to reduce soil saturation. When the liquefiable soil layer suffers vibration load, the biogas in the pores can effectively alleviate the rising trend of excess pore water pressure and improve the anti-liquefaction ability of the liquefiable soil layer. Moreover, the migration of bacteria in soil can be affected by dynamic processes, resistance, and microorganism factors (Han et al., 2016). The dynamic process includes convection and hydrodynamic dispersion, which are the two main driving forces for the migration of bacteria in the soil (Li and Wei, 2003). Li and Li (2006) conducted a mixed displacement test in saturated soil with steady flow to study the migration of Escherichia coli in sand. The results showed that with increase in the flow rate, the passing ability of the bacteria was significantly enhanced, and the retention coefficient decreased. Porosity is also an important factor affecting microbial migration dynamics. White (1985) summarized the effect of the pore scale on bacterial migration and pointed out that the increase in the pore scale would greatly increase the migration dynamics. The resistance process mainly includes filtration, adsorption, and desorption. Bradford and Bettahar (2005) conducted a soil column test using saturated quartz sand with median particle sizes of 710, 360, and 150 μm. The test results showed that with the decrease in the median diameter, the bacterial retention at the inlet end of the sample increased, while the bacterial concentration in the effluent at the outlet end decreased. Mixed displacement is a comprehensive manifestation of solute transport in soil. Most of the mathematical models of soil solute transport are used to describe the vertical one-dimensional salt movement in the soil profile and ignore the effects of salt decomposition, dissolution, precipitation, adsorption, and desorption in the soil (Romano et al., 1998). In addition, few research studies have been carried out on the migration of biogas, and most studies about the migration of gas mainly focus on the aeration method. Van et al. (1995) used the two-phase seepage method to simulate the continuous aeration process in a uniform porous medium and showed that buoyancy is dominant from the bottom of the aeration well to the low-permeability area. The air diffuses horizontally at the bottom of the low-permeability zone. In the upper part of the low-permeability zone, buoyancy is dominant again. Baker and Benson (2007) indicated that when using the aeration method to treat contaminated soil, due to the low permeability of fine-grained soil, the pressure required for gas displacement of pore water is relatively large, and the buoyancy effect of the gas is relatively weak, so the lateral influence range of the final aeration airflow state is obviously larger.
To clarify the influence range of the bacterial suspension and biogas after grouting, in this paper, a three-dimensional finite element model was established through TOUGH2 software to simulate the suspension diffusion and the migration of biogas in subgrade. The influence of bacterial suspension volume, grouting rate, grouting depth, concentration of the nitrogen source in the suspension, and soil porosity on the distribution of the suspension and biogas was analyzed. Based on the simulation results, the sensitivity of each factor to the horizontal and vertical influence ranges of saturation was analyzed. The research results can provide a theoretical basis for the technology development and application of microbial grouting to reduce soil saturation for liquefiable foundation treatment.
2 Materials and methods
2.1 Soil, bacteria, and culture medium
2.1.1 Soil
The sand was taken from a site in Nanjing, Jiangsu Province. Its specific gravity is 2.68, and the maximum and minimum pore ratios of sand are 0.946 and 0.428, respectively. The particle size distribution curve of the sand is shown in Figure 1, and the gradation constants are shown in Table 1. Table 1 and Figure 1 show that the content of the coarse sand is more than 50%, without gravel and fine particles, and Cu < 5, Cc < 1. According to the “Standard for Engineering Classification of Soil” (GB/T 50145-2007) (Ministry of Water Resources of the People’s Republic of China, 2008), it can be defined as poorly graded sand.
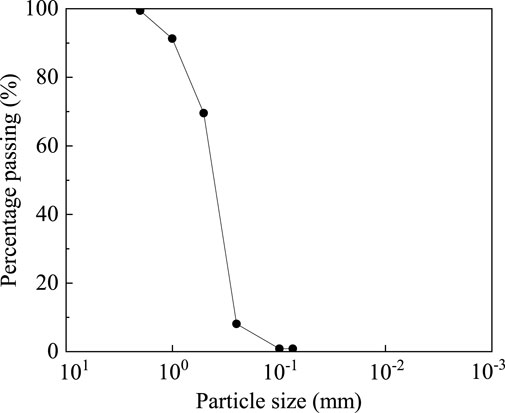
Figure 1. Particle size distribution curves of sand.
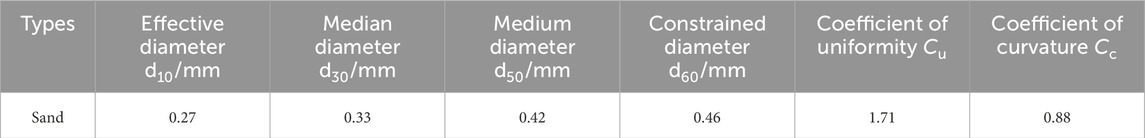
Table 1. Soil characteristics.
2.1.2 Bacteria
The bacterium is Pseudomonas stutzeri (DSMZ, 5190). P. stutzeri is a common soil bacterium, belonging to the genus Pseudomonas. It is a rod-shaped, non-spore, flagellated, aerobic Gram-negative bacteria with a strong denitrification ability. In P. stutzeri, nitrate reductase (Nar) consists of three subunits: α, β, and γ; it is encoded by the narG, narH, and narL genes, respectively. The α subunit is composed of 1,521 amino acid residues, the β subunit is composed of 512 amino acid residues, and the γ subunit is composed of 263 or 265 amino acids. The molecular weight of Nar is approximately 172 KD (Blümle and Zumft, 1991). Periplasmic-bound nitrate reductase (Nap) includes two subunits, NapA and NapB. NapA and NapB are composed of 834 and 162 amino acid residues, respectively, and their molecular weight is 112 KD (Yu et al., 2011). The type of nitrite reductase (Nir) in P. stutzeri is mainly NirS. NirS exists in the form of a dimer; each monomer is composed of 560 amino acid residues, and its molecular weight is 60 KD (Weeg-Aerssens et al., 1991). Nitric oxide reductase (Nor) is composed of two subunits, NorB and NorC and has a molecular weight of 70 KD. NorB is composed of 473 amino acid residues, and NorC is composed of 145 amino acid residues (Zumft, 2005). The type of nitrous oxide reductase (Nos) is mainly NosZ, which exists in the form of dimers. Each unit is composed of 637 amino acids, and the molecular weight is approximately 71 KD (Alvarez et al., 2001).
2.1.3 Culture medium
The culture medium is Luria–Bertani (LB) medium. The LB medium is composed of 10 g/L tryptone, 5 g/L yeast extract, and 10 g/L NaCl. The composition of the denitrification culture medium is Na3C6H5O7·2H2O 5 g/L, MgSO4·7H2O 0.2 g/L, KNO3 2 g/L, and K2HPO4 1 g/L.
2.2 Biogas production
2.2.1 Denitrification
Denitrification mainly includes four steps, as shown in Figure 2. In step 1, nitrate is reduced to nitrite by Nar and Nap. In step 2, nitrite is reduced to nitric oxide (NO) by Nir. In step 3, NO is reduced to nitrous oxide (N2O) by the catalysis of Nor. In step 4, N2O is ultimately converted into nitrogen gas by Nos. Based on the basic composition of the denitrification medium, 5 g of sodium acetate was added as the carbon source to analyze the variation in NO3− and NO2− content, and the denitrification ability of the bacteria was preliminarily verified by the denitrification tests. The detailed steps involved in the denitrification performance test are as follows:
(1) The standard curve for NO3−and NO2− was plotted using ion chromatography ICS-1500 from Dionex Inc. The ion chromatograph consists mainly of an RFC-30 automatic eluent generator, an IonPac CS12A 4-mm separation column, an IonPac CG12A 4-mm protection column, an ASRS ULTRA II automatic regeneration film suppressor, and a conductivity detector.
(2) The LB medium was used for culture, and the bacterial suspension in the logarithmic phase of growth was centrifuged at a speed of 4,000 r/min; the supernatant was removed, and the denitrifying medium was added until the optical density of the bacterial suspension was 0.1. The light density was measured using Dynamica’s HALO NDAmaster spectrophotometer. The light density was measured at a light source wavelength of 600 nm.
(3) One milliliter of the bacterial suspension was added into several 2-mL centrifuge tubes and allowed to stand at constant temperature, and the culture temperature was 30°C (the optimum temperature).
(4) The concentrations of NO3− and NO2− in the bacterial suspensions were measured every 3 h.
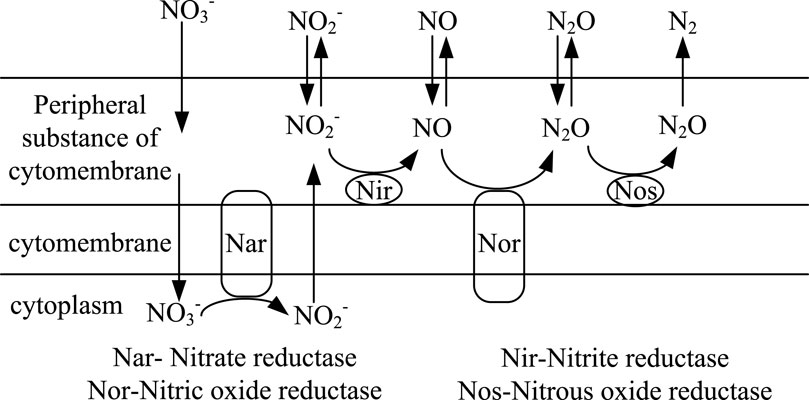
Figure 2. Process of bacterial denitrification (Rebatalanda and Santamarina, 2012).
2.2.2 Biogas production test
The bacterial suspension containing sodium citrate was prepared and mixed with sand to verify its effect of desaturation. First, the bacterial suspension with OD = 0.1 and different C/N (8.6, 5.7, 4.3, 2.9, and 2.1) was prepared. In the gas measuring device, the bacterial suspension was mixed with the dry sand, and a saturated cylindrical sand sample of 10 cm3 was prepared. The target volume and void ratio were 10 cm3 and 0.50, respectively, and it was cultured at 20°C. Second, the amount of gas generated was read every 3 h. The gas measuring device was composed of a 20-mL syringe, 4 mm × 6 mm (inner diameter × outer diameter) PVC hose, and a 2-mL glass scale pipette, as shown in Figure 3. When the bacterial suspension in the sample begins to produce gas, the pore water of the soil is discharged, and the end position of the liquefied paraffin in the glass pipette will change accordingly. The corresponding scale value of the liquefied paraffin end was recorded, and the difference between it and the initial value provides the amount of biogas produced. The calculation formula is following as Eqs 1, 2 (Peng, 2018; Zhang et al, 2023):
where Sr is the sample’s degree of saturation, Vv is the pore volume, Va is the bacterial gas produced, Vao is the initial gas content of the sample, ∆h is the variation in water thickness on the top surface of the sample, and A is the cross-sectional area of the sample.
Figure 3. Schematic diagram of the gas measurement device.
2.2.3 Gas production result
The test results are shown in Figures 4, 5. When C/N is constant, the decrease in saturation decreases linearly with decreasing concentrations of the nitrogen and carbon sources. When the carbon source concentration is 4.25 mmol/L, the gas production by bacteria is extremely low. This is mainly caused by three reasons. First, P. stutzeri is a kind of facultative heterotrophic bacteria, and in the initial stage of bacterial growth, it consumes some carbon sources for aerobic respiration. Second, in the early stage of denitrification, dissolved nitrogen is produced by the reduction of the nitrogen source and carbon sources to reach the nucleation concentration and form gas, so some carbon sources do not play a role in desaturation and just for the dissolved phase. Third, the initial bacterial concentration is relatively high, and due to competition for nutrients among microorganisms, the biological activity and utilization rate of the denitrification reaction substrate decrease. A larger C/N does not necessarily lead to higher gas production and gas production rate. When nitrate is used as a reaction substrate for denitrifying bacteria, there are two pathways for the conversion of nitrate (Mohan et al., 2004). The first one is the ammonification reaction. When the C/N ratio is high, denitrifying bacteria will reduce nitrate to nitrite and, finally, to ammonium (Richardson et al., 2001). Another pathway is denitrification, which mainly occurs when the C/N ratio is low and the final produced gas is nitrogen (Moura and Moura, 2001). However, when the C/N ratio is too low, insufficient electron donors lead to a low conversion rate of total inorganic nitrogen, which results in a decrease in gas production efficiency.
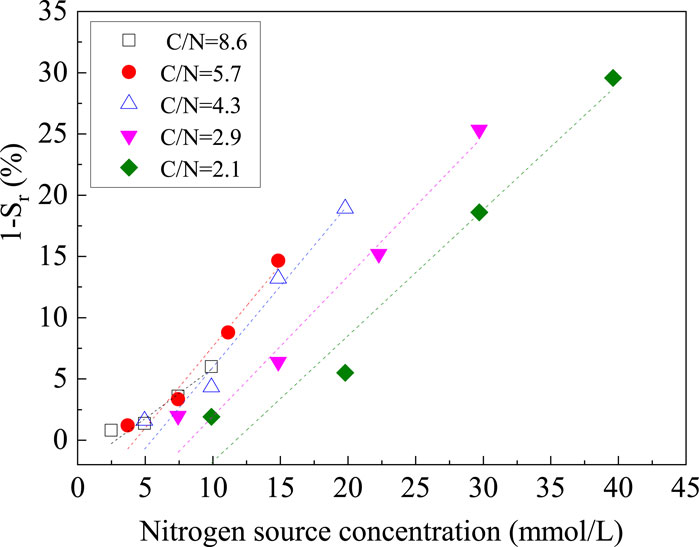
Figure 4. Relationship between 1-Sr and the nitrogen concentration at different C/N ratios.
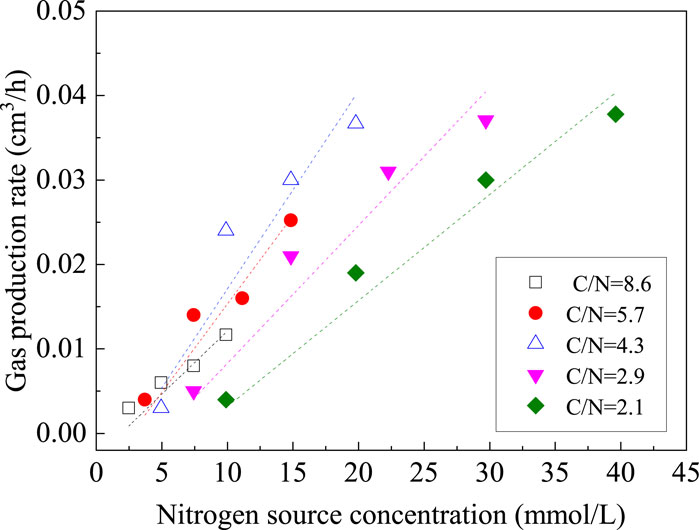
Figure 5. Relationship between the gas production rate and nitrogen source concentration.
2.3 Numerical model
The influenced area of gas production is an important parameter after microbial grouting in the design of the biogas desaturation method. The biogas flow pattern after single-point grouting and the change in gas–water pressure in soil pores after gas injection are determined, and design parameters such as grouting volume, grouting rate, grouting depth, and nitrogen source concentration are optimized. According to the results of the previous section, it is feasible to use TOUGH2 to establish a model to simulate the water–gas system. Moreover, the EWASG module in TOUGH2 is used to establish a large-scale three-dimensional model to simulate the bacterial suspension diffusion and biogas formation process to determine the influence region of the bubble.
2.3.1 Model overview
Based on a liquefiable subgrade stated in Nanjing of China, a three-dimensional calculation model is established. The size of the calculation model is 25 m × 20 m × 20 m (height × width × thickness), and the groundwater table is 1 m. The model is divided into two parts; the upper part is set as the unsaturated soil layer with a saturation of 60%, and the lower part is set as the saturated soil layer with a saturation of 100%. The first part is used to establish the model and verify it with the test results in the literature. The main purpose is to verify the correctness of the simulation method. The second part is a simulation based on a homogeneous sandy soil foundation. The main purpose of the simulation is to discuss the influence of various parameters on the influence range of desaturation and its sensitivity in the grouting process, and there is no verification process. In the second simulation, the groundwater table is 1 m, so the soil under the water level is set to be fully saturated. The specific model parameters are shown in Table 2, and the gas phase parameters are chosen according to nitrogen. The surface of the model is connected to the atmosphere, the pressure is constant at atmospheric pressure, and the other sides are permeable boundaries.
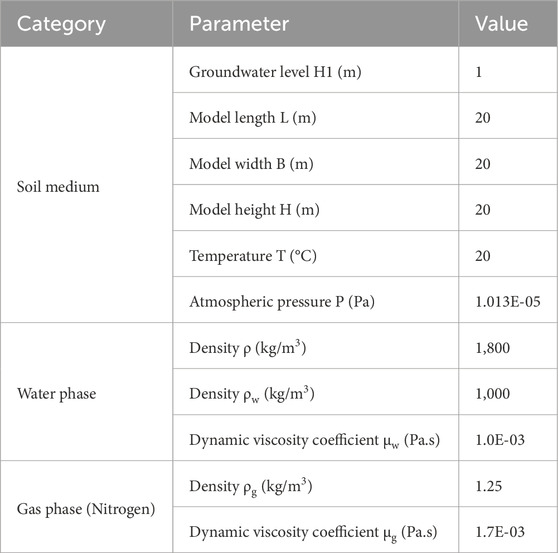
Table 2. Values of the main calculated parameters of the model.
2.3.2 Model building
2.3.2.1 Basic assumptions
The seepage in the model is isothermal; the pore medium contains water and gas phases, and the two phases are immiscible; the soil particle and water are regarded as incompressible, and it is assumed that the density of water and gas is constant; the seepage of water and gas phases in the model obeys Darcy’s law; the area under the water table is saturated, and the change in water table is not considered during seepage process; capillary pressure and gravity are considered, but effects of adsorption, degradation, and mass transfer between the phases are ignored.
2.3.2.2 Governing equation
2.3.2.2.1 Basic governing equation
The governing equations in the model are based on mass conservation and Darcy’s law, and the finite difference method of integral form is used for discrete solutions. This method is most effective for solving multiphase flow problems (Danko, 2014).
According to the principle of mass conservation, the basic equations of water and gas phase flow are expressed as in Eq. 3. In addition, the total mass accumulation of water and gas is expressed by Eq. 4. The standard gas phase accumulation without adsorption condition is shown in Eq. 5.
where Vn is any element, Гn is the closed boundary of the element, k is component water or gas, n is the normal vector cosine on Гn, Fk is the mass flux of component k into the element (kg/s), qk is the mass generation rate of component k per unit volume (kg/s), Mk is the mass of k on dVn (kg), Φ is the total porosity, the β phase includes liquid phase l and gas phase g, Sβ is the saturation of the β phase, ρβ is the density of the β phase, Xβ is the mass fraction of component k in the β phase, and Rgc is the retardation factor for the transport of organic chemicals into the gas phase, and for a two-phase flow it, can be written as Eq. 6.
According to Darcy’s law, the total mass flux Fk of component k in the gas and water phases is calculated as E. 7, and Fβk is calculated according to Darcy’s law as Eq. 8. The basic control equation for solute transport is shown in E. 9.
where K is the absolute permeability of the medium (m2), kγβ is the relative permeability of the β-phase; μβ is the dynamic viscosity coefficient of β (N·s/m2), Pβ is the pressure of β-phase (Pa), g is the vector of gravitational acceleration (N/kg), Z is the height (m), Mj= ΦSCj, Φ is the porosity, S is the liquid phase saturation, Cj is the concentration of the component j in the liquid phase (ms−1), τ is the curvature coefficient of the aqueous medium, D is the diffusion coefficient (m2d−1), and qj is the source–sink term of the component j, including the term of the hydrochemical reaction.
2.3.2.2.2 Auxiliary equation
The capillary water pressure can be expressed by Eq. 10. The saturation of the soil layer is expressed as Eq. 11. The van Genuchten model is selected for calculation, as shown in Eq. 12 (Van genuchten, 1980). The van Genuchten–Mualem model is applied to express the correlation between relative permeability and saturation, as shown in Eqs 13, 14 (Mualem, 1976).
where Pβ is the capillary pressure (Pa), Pcβ is the capillary pressure of the β-phase, Pcω is the capillary pressure of the liquid phase, Se is the effective water saturation, Sγω is the residual water saturation, Ssω is the maximum water saturation, Po is the inlet value, Pmax is the maximum inlet value, and Po, n, and m are the fitting parameters of the model. The parameter values in the model are as follows: m = 0.457, n = 1.842, Ssω = 1.0, and Sγω = 0. krl and krg are the relative permeability coefficients of the liquid and gas phases, respectively; λ is the fitting parameter; and Srg is the residual gas saturation. The values of the parameters in the model are as follows: λ = 0.457, Ssω = 1.0, Sγω = 0.15, and Srg = 0.1.
2.3.2.2.3 Grid division
The air sparging test result in Mei et al. (2002) was selected for verifying the feasibility of the model. The test model box is two-dimensional, and its width is 2.00 m and height 2.00 m. The upper surface of the model is connected with the atmosphere, and there is an unsaturated area with a height of 0.2 m above the water table. The aeration outlet is located 0.40 m above the bottom boundary, with a diameter of 0.02 m. The model parameters are shown in Table 3.
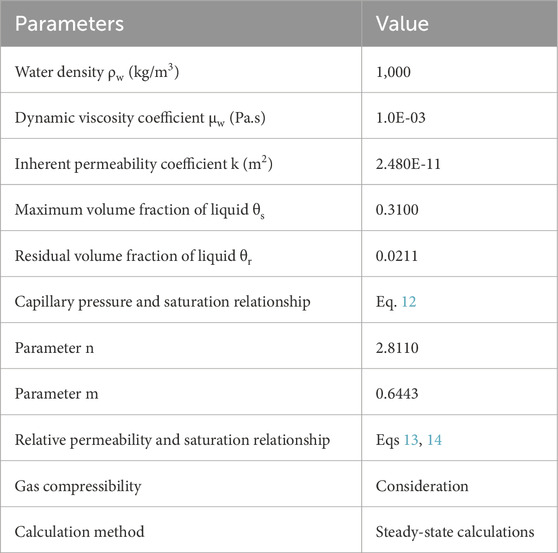
Table 3. Model calculation parameters (Mei et al., 2002).
The two-dimensional model is established according to the size of the model in the literature, and the model is divided by the rectangular grid. The model is divided into two parts. The first part is the upper unsaturated area with a height of 0.2 m, which is divided into two layers, and the height of each layer is 0.1 m. The second part is the lower saturated area with a height of 1.8 m, which is divided into nine layers, and each layer is 0.2 m high.
2.3.2.2.4 Boundary conditions
For the initial conditions, the saturation level of the upper and lower soil layers is set to 0.65 and 1.0, respectively. The upper part is connected with the atmosphere, and the pressure is constant at atmospheric pressure. The bottom, left, and right sides are impermeable boundaries. The initial and boundary conditions can be expressed by Eqs 15, 16, respectively.
2.4 Numerical scheme and validation
First, the TOUGH2 software is used to establish the gas production mathematical model. The feasibility of the model is verified by using the data cited in literature. Second, based on that modeling method, the production process and final saturation distribution of biogas under different conditions were simulated according to the characteristics of microbial gas production. The microbial bubble desaturation method is mainly achieved by grouting the bacterial solution into the soil. The main construction method is the traditional grouting method. The main construction parameters in the grouting method are grouting parameters (grouting volume, grouting rate, and grouting depth), parameter of the grouting liquid (nitrogen source concentration), and soil parameters (soil porosity). Therefore, when discussing the influence range of desaturation, the influence of the above parameters is mainly discussed, and the results can guide engineering practice.
2.4.1 Simulation scheme and method
2.4.1.1 The values of porosity and permeability
In the TOUGH2 software, porosity and the intrinsic permeability of soil are two important parameters. However, in practical applications, the intrinsic permeability is difficult to measure and apply. Therefore, this study only proposes the change in porosity. However, for a kind of soil, different porosities will correspond to different permeabilities. According to Rajani (1988), the correlation between porosity and permeability is given as follows:
where K is the intrinsic permeability of the soil (m2), Cs is a constant with value 3.05 × 10⁻³ (Locke et al., 2001), d50 is the medium diameter of the soil (m), and f(n) is a function of porosity, which is expressed as follows:
The correlation between permeability and porosity can be calculated by Eqs 17, 18, as shown in Figure 6. As can be seen from the figure, permeability increases monotonically with increasing porosity.
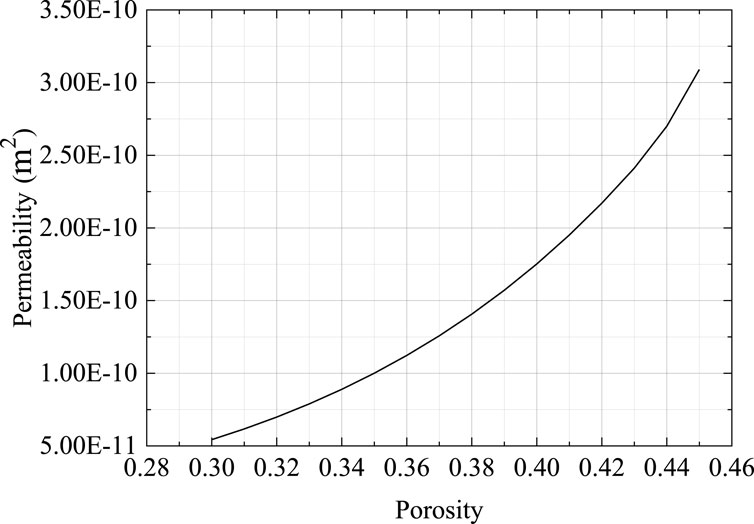
Figure 6. Relation curve between permeability and saturation.
2.4.1.2 Simulation scheme
The simulation scheme is shown in Table 4.
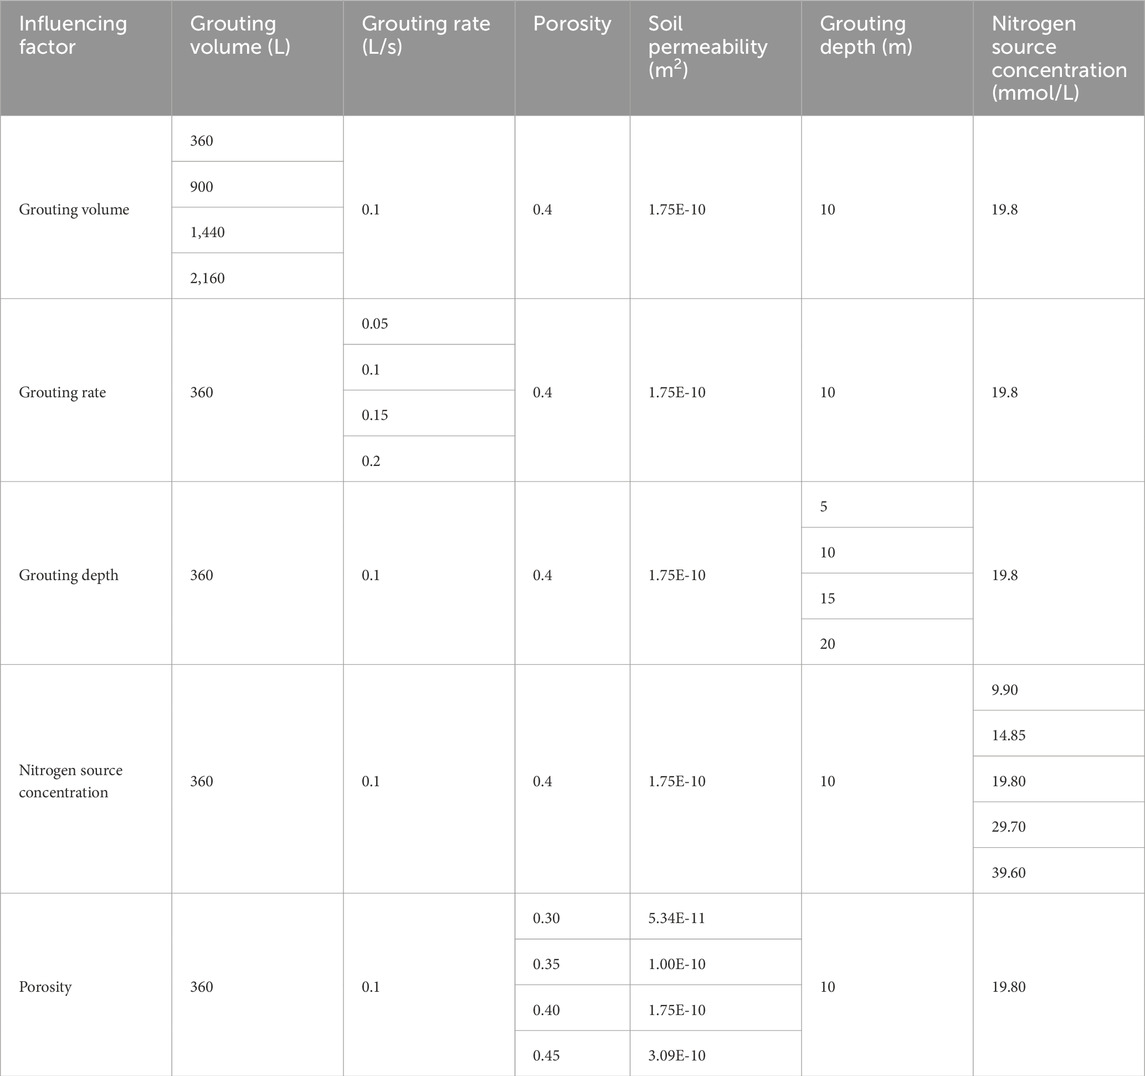
Table 4. Simulation scheme.
2.4.2 Grid division
The rectangular grid is selected for grid division, and the grid division diagram is shown in Figure 7. The thickness of the unsaturated soil layer is 1 m, which is divided into five layers with a thickness of 0.2 m. The thickness of the saturated soil layer is 24 m, which is divided into 96 layers with a thickness of 0.25 m. The width of the unit is 0.25 m in the horizontal direction.
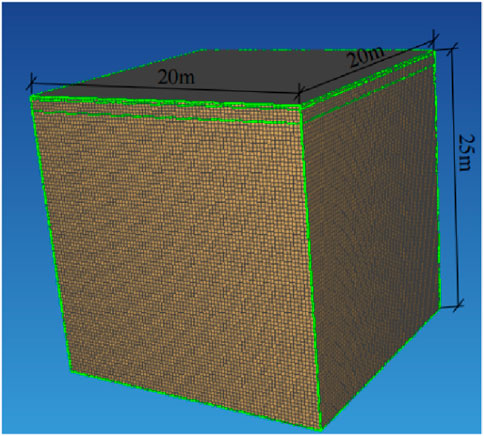
Figure 7. Grid division.
2.4.3 Model validation
Figure 8 shows the result of model validation. Figure 8A is the saturation contour map obtained in Wang and Hu (2010) in a stable state, and the influence range is conical. Figure 8B shows the gas phase saturation distribution of TOUGH2 software. Figure 8C draws a contour map of water phase saturation corresponding to Figure 8B. There is a slight difference between the two forms, as shown in Figures 8A, C. However, the gas saturation and influence range are similar. The main reason is that the jet unit adopts flow control in the TOUGH2 model, and the unit is kg/s. However, pressure control has been used in Wang and Hu (2010). In general, it is reasonable and reliable to use TOUGH2 software to analyze the pattern of water–gas two-phase migration in soil.
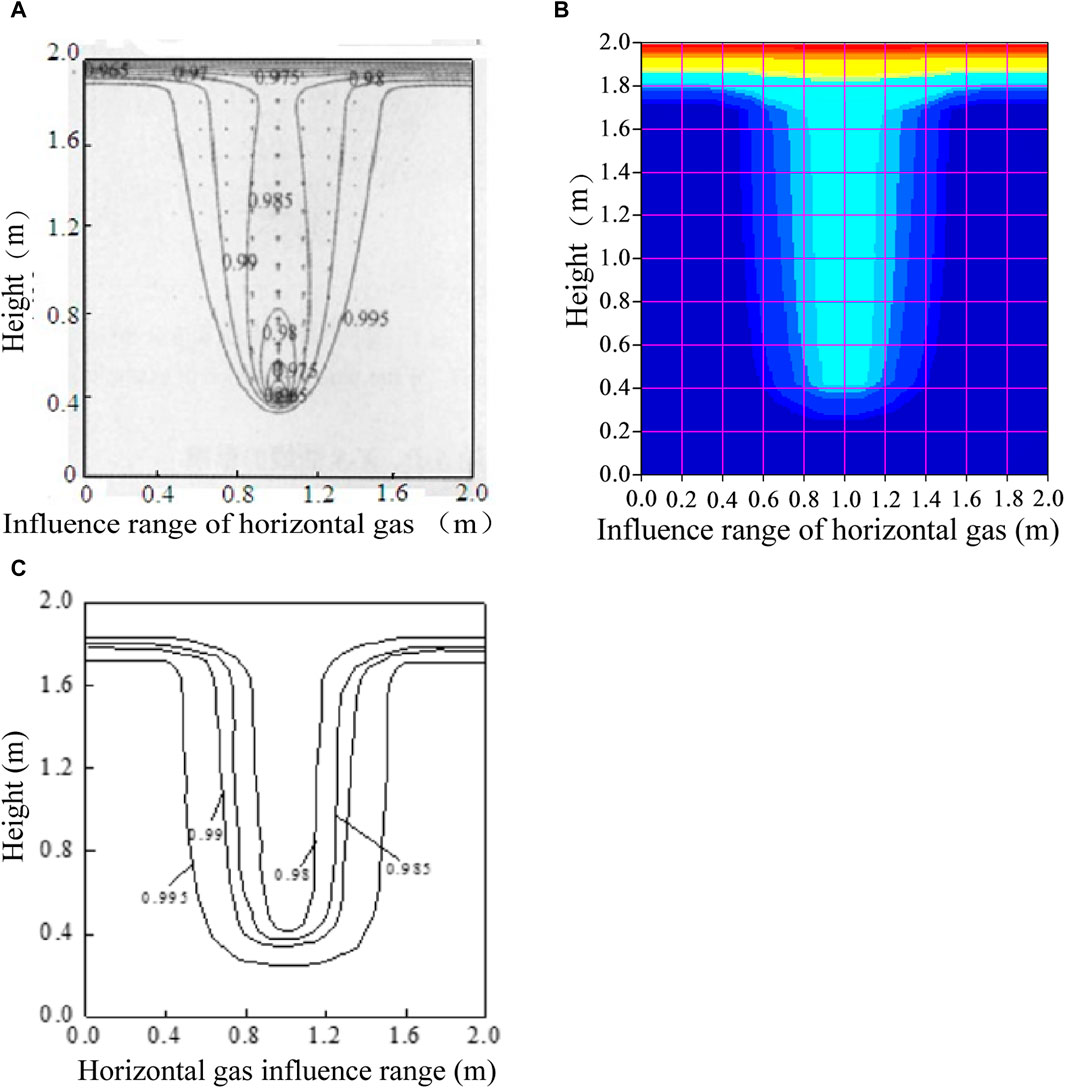
Figure 8. Model validation. (A) Saturation contour diagram in literature (Wang and Hu, 2010). (B) Gas phase saturation distribution of TOUGH2 software. (C) Saturation contour diagram.
3 Results and discussion
3.1 Distribution of bacterial suspension composition and saturation
3.1.1 Grouting volume
3.1.1.1 Distribution of bacterial suspension composition
The influence of grouting volume on the distribution of bacterial suspension composition is mainly determined by the migration process of the culture medium and bacteria during the grouting process. Because convection dispersion and molecular diffusion of ions occur, the concentration of C5H7O5COO− and NO3− and C/N will change, which affects biogas production during grouting. Both MgSO4 and K2HPO4 in the medium were bacterial growth factors, and they were not the direct substrate of the denitrification reaction. Therefore, only the migration of C5H7O5COO− and NO3− was simulated. Moreover, the distribution range of bacteria in the grouting process is similar to the influence area of the culture medium, so only medium component migration is discussed.
Figure 9 shows the variation in NO3− and C5H7O5COO− concentrations with the grouting volume when the grouting rate is 0.1 L/s. When the grouting rate is constant, the lateral influence range of each ion increases with the increase in grouting volume. The peak of ion concentration near the grouting point is similar to the initial concentration of the culture medium. When the grouting volume was 2,160 L, the concentrations of NO3− and C5H7O5COO− were 17.2 mmol/L and 15.0 mmol/L after grouting, while their initial concentrations were 19.8 mmol/L and 17.0 mmol/L, respectively. However, the ion concentration decreases rapidly in the diffusion region, and the decline rate is similar. The C/N ratio is between 4 and 6 in the effective influence area. According to Peng et al. (2018), effective C/N values are located near the demarcation point between the electron donor surplus region and shortage region. Therefore, diffusion has little effect on C/N values, and C/N is in the high conversion rate region of total inorganic nitrogen (TIN). Therefore, the culture medium components are not wasted too much.
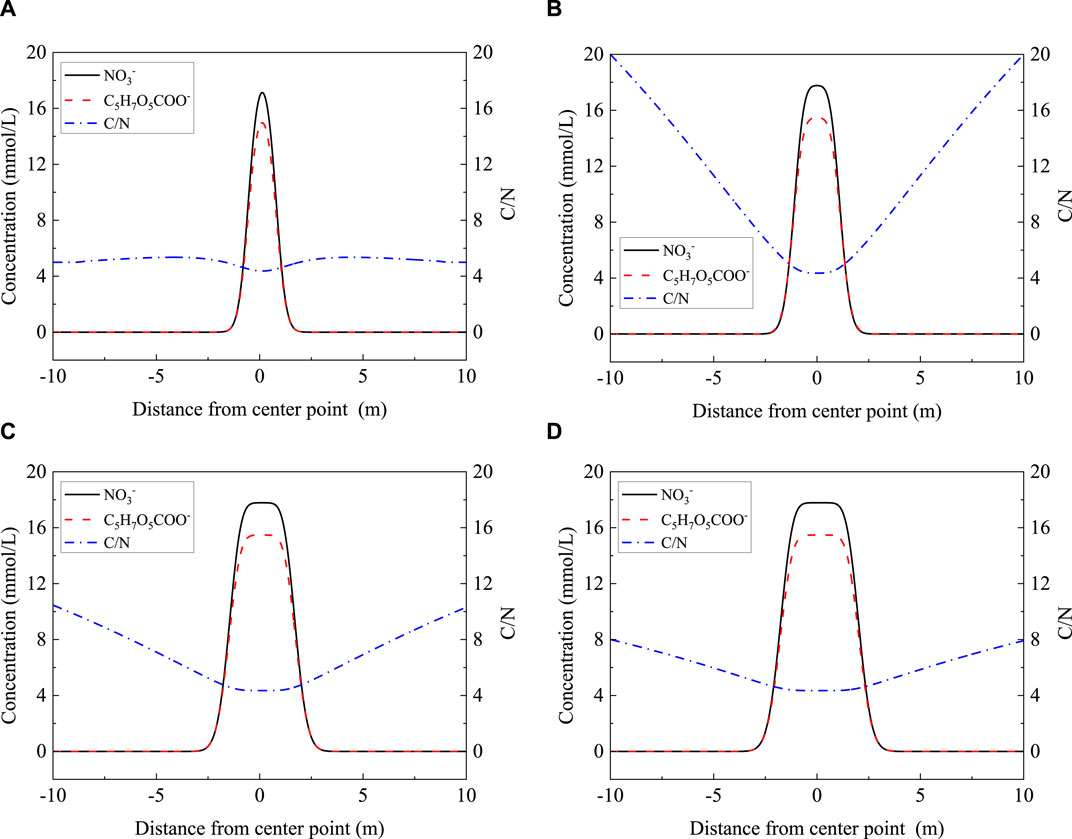
Figure 9. Distribution of NO3− and C5H7O5COO− with different grouting volumes. (A) 360 L. (B) 900 L. (C) 1,440 L. (D) 2,160 L.
Figure 10 shows the correlation between the influence range of the suspension and grouting volume. There is a good power function relationship between them.
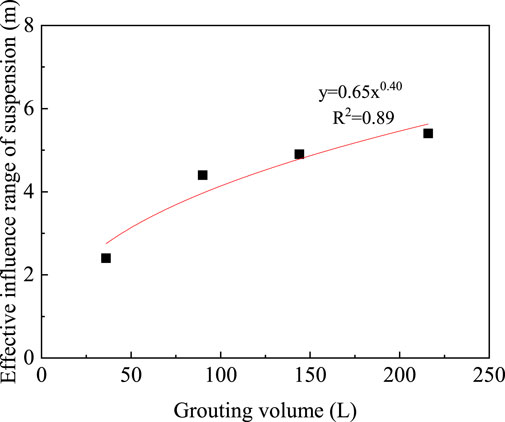
Figure 10. Relationship between the influence range of the suspension and grouting volume.
3.1.1.2 Distribution of saturation
Figure 11 shows the saturation distribution under different grouting volumes. After injecting the suspension at a depth of 10 m, the generation rate of biogas is slow, and the volume of the biogas generated is less. Therefore, it cannot emit from soil and form a stable flow state, the shape of which is similar to a “water-drop.”
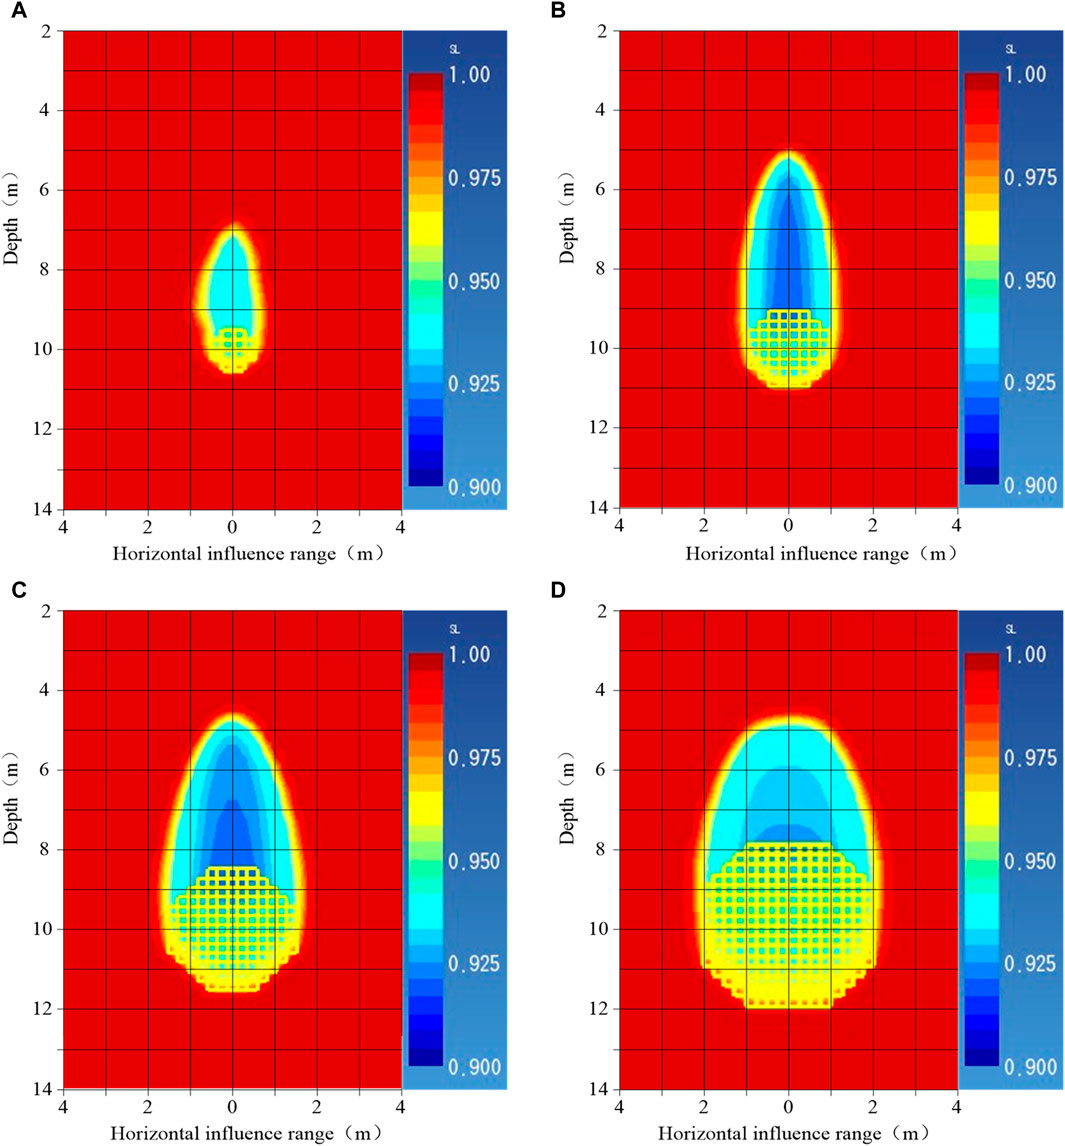
Figure 11. Saturation distribution under different grouting volumes. (A) V = 360 L. (B) V = 900 L. (C) V = 1,440 L. (D) V = 2,160 L.
Figure 12 shows the influence range for different grouting volumes. When the grouting volume increases, the lateral influence range of biogas also increases. Because the permeability of sand is high and the generation rate of biogas is low, it can result in little excess pore water pressure. Therefore, the lateral influence range of desaturation is only slightly larger than that of the suspension. The vertical influence range of desaturation increases significantly with the increase in grouting volume. As the grouting volume increases from 1,440 to 2,160 L, the vertical influence range does not become larger.
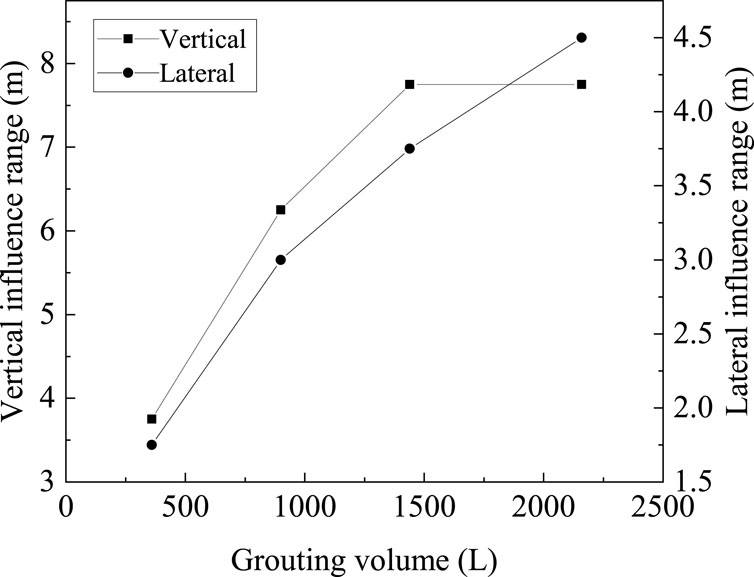
Figure 12. Influence range under different grouting volumes.
3.1.2 Grouting rate
Figure 13 shows the effect of the grouting rate on the distribution of NO3− and C5H7O5COO−. When the grouting volume is constant, the distribution of NO3− and C5H7O5COO− concentrations is basically consistent under different grouting rates. This is because the ion diffusion in pore water is mainly affected by convection dispersion during grouting, and the molecular diffusion is weak (Hu et al., 2020). Therefore, when the grouting volume is constant, the influence of the grouting rate on the distribution of the suspension and saturation is weak and can be neglected.
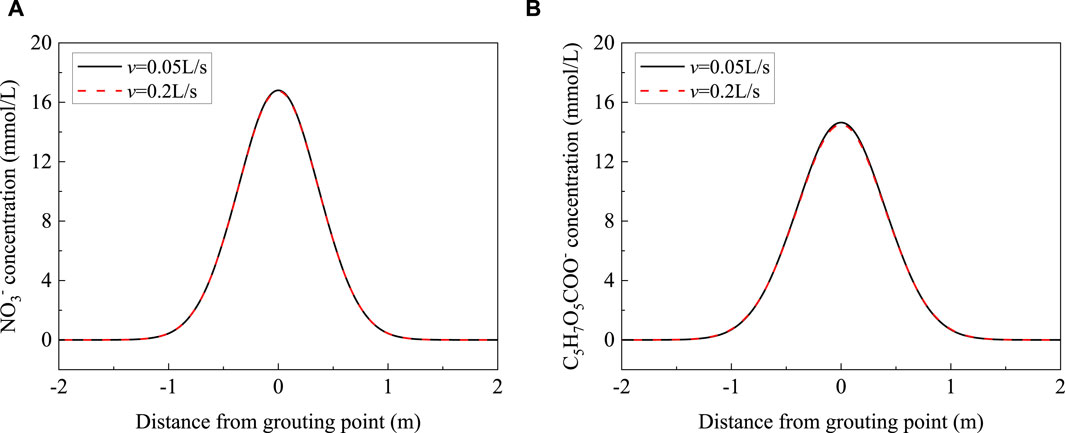
Figure 13. Effect of the grouting rate on the distribution of NO3− and C5H7O5COO−. (A) NO3−. (B) C5H7O5COO−.
The stagnation period of biogas generation is short, and it is necessary to quickly complete the aimed grouting volume before biogas generation because biogas can reduce the soil permeability (Su et al., 2012). If constant rate grouting is still conducted, excess pore water pressure will accumulate significantly. Therefore, it is necessary to consider the faster grouting rate within the allowable range. Because the excess pore water pressure cannot dissipate quickly, it shows a cumulative trend, as shown in Figure 14A. Grouting with suspension belongs to seepage grouting, and the suspension should be filled in pores of soil without destroying the soil skeleton by excessive pore water pressure. Therefore, for the same soil, there is a corresponding relationship between the grouting rate and the maximum grouting volume, as shown in Figure 14B. When the grouting rate increases, the final grouting volume decreases significantly.
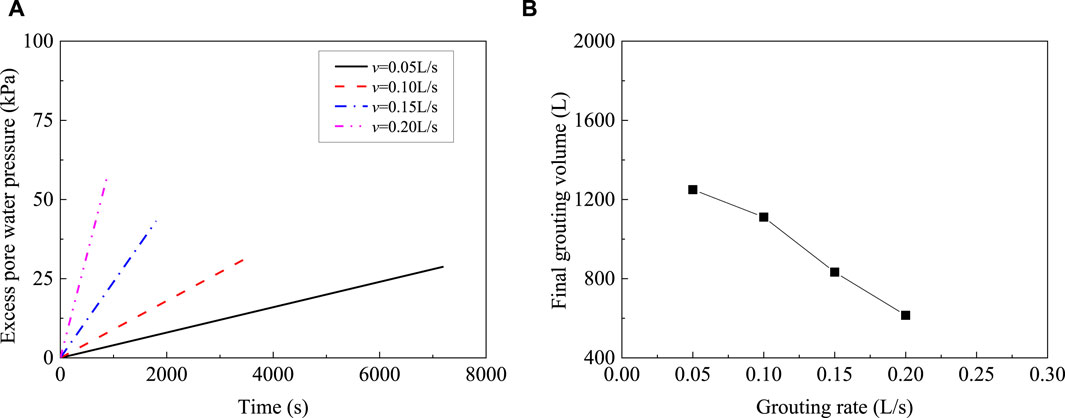
Figure 14. Excess pore water pressure and final grouting volume under different grouting rates. (A) Excess pore water pressure under different grouting rates. (B) Relationship between the grouting rate and final grouting volume.
3.1.3 Grouting depth
Figure 15 shows the distribution of desaturation and influence range under different grouting depths. The influence range of desaturation decreases slightly with grouting depth increase. Moreover, with increases in the grouting depth, the saturation becomes lower in the influence area. Due to the strong compressibility of gas, pore water pressure is higher at a deeper site, the gas is compressed, and the final saturation is lower.
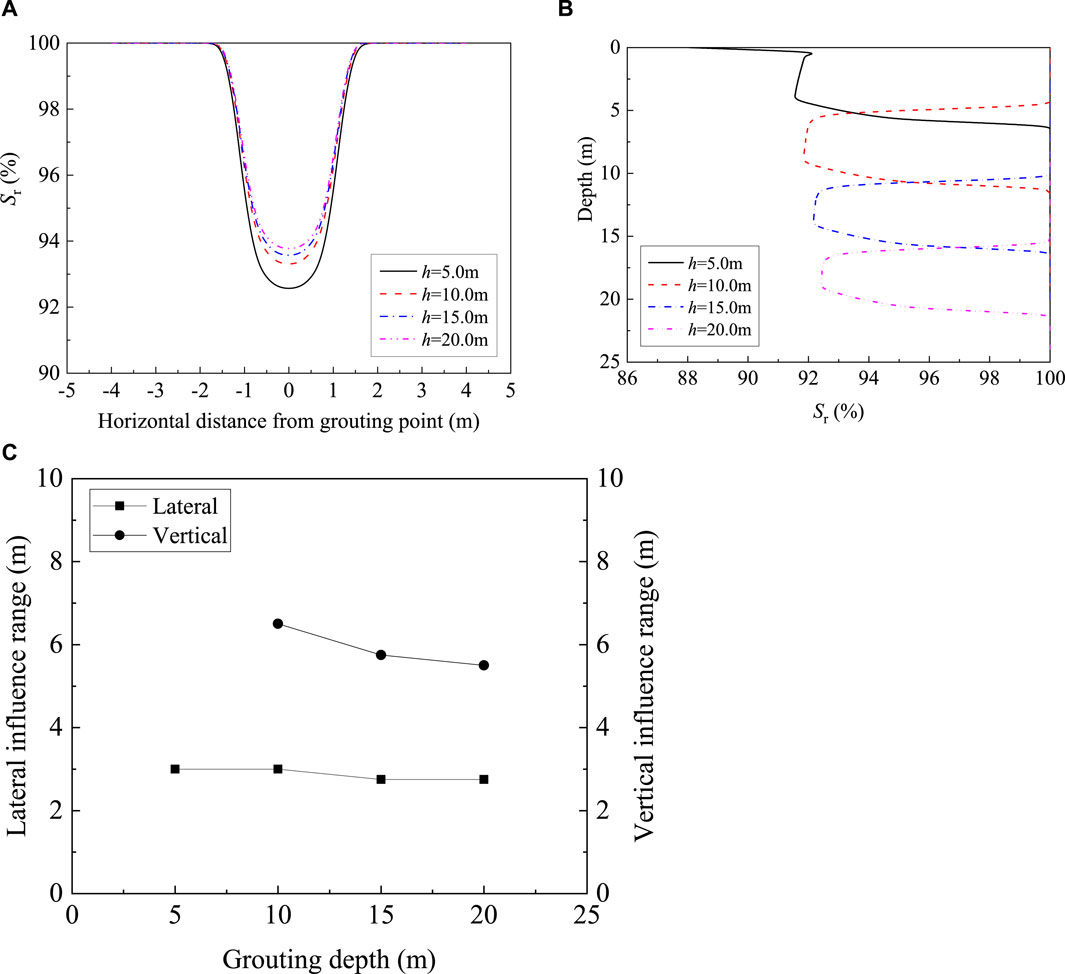
Figure 15. Distribution of desaturation and influence range under different grouting depths. (A) Lateral distribution. (B) Vertical distribution. (C) Influence range.
3.1.4 Nitrogen source concentration
3.1.4.1 Component distribution of the suspension
Figure 16 shows the effect of the initial nitrogen source concentration on the NO3− and C/N distributions. The concentration of NO3− at the grouting point is similar to that of the suspension. Moreover, a higher initial concentration of NO3− leads to a greater reduction along the lateral direction. When the initial nitrogen source concentration is 9.9 mmol/L, the fluctuation in C/N values is significant along the lateral direction. For other conditions, the distribution of C/N in other nitrogen source concentrations is basically consistent; with the decrease in the nitrogen source concentration, the C/N increases slightly.
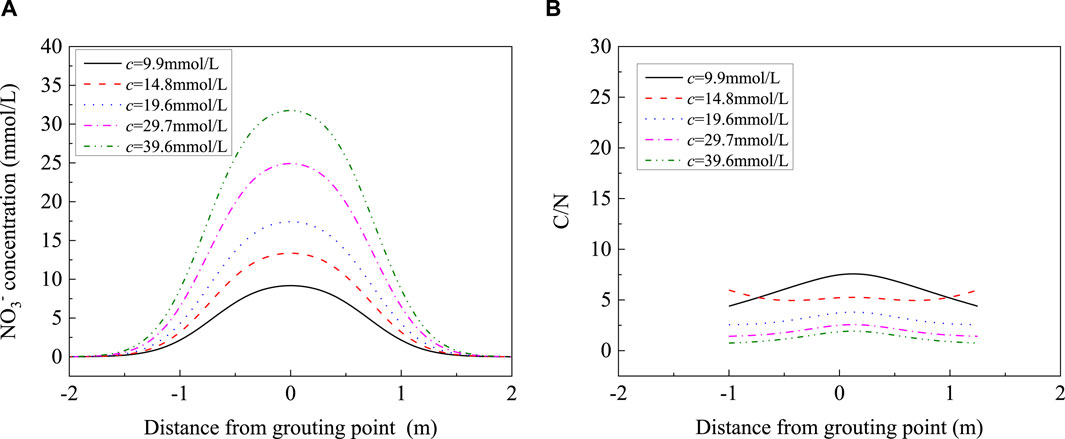
Figure 16. Effect of the initial nitrogen source concentration on the NO3− and C/N distribution. (A) NO3−. (B) C/N.
3.1.4.2 Influence range of desaturation
Figure 17 shows the lateral and vertical distributions under different nitrogen source concentrations. With increasing nitrogen source concentration, the lateral influence range is similar, and saturation is between 93.29% and 93.38%. For the vertical influence range, it increases with nitrogen source concentration monotonously. From 9.9 to 39.6 mmol/L, the influence range increases from 4 to 8.5 m, which is a 112.5% increase.
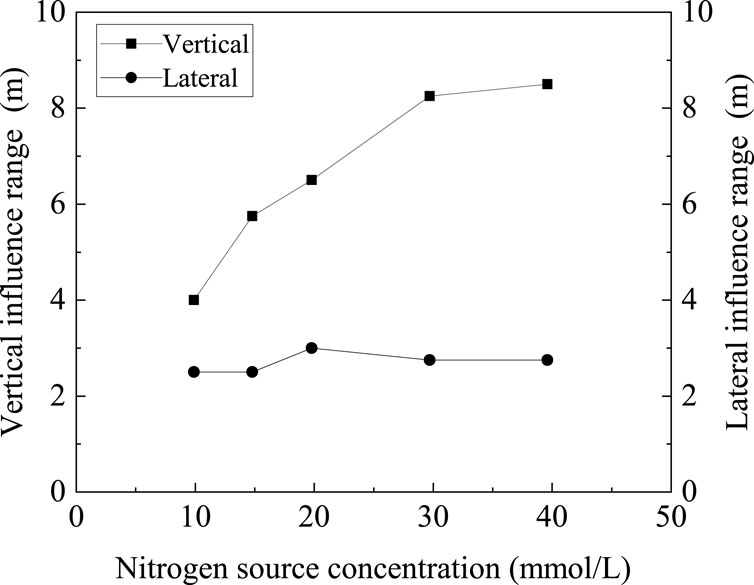
Figure 17. Lateral and vertical distribution under different nitrogen source concentrations.
3.1.5 Porosity
Figure 18 shows the lateral and vertical distribution of saturation and the influence range of desaturation under different porosities. The saturation at the grouting point decreases linearly with the decrease in porosity. With decrease in porosity and permeability, biogas migration becomes difficult, and it is easy to form the gas channel, which results in capillary force increase, thickness of the water film, and saturation decrease. Furthermore, the vertical influence range of desaturation slightly increases with increasing porosity. Moreover, the lateral influence range is consistent under different porosities.
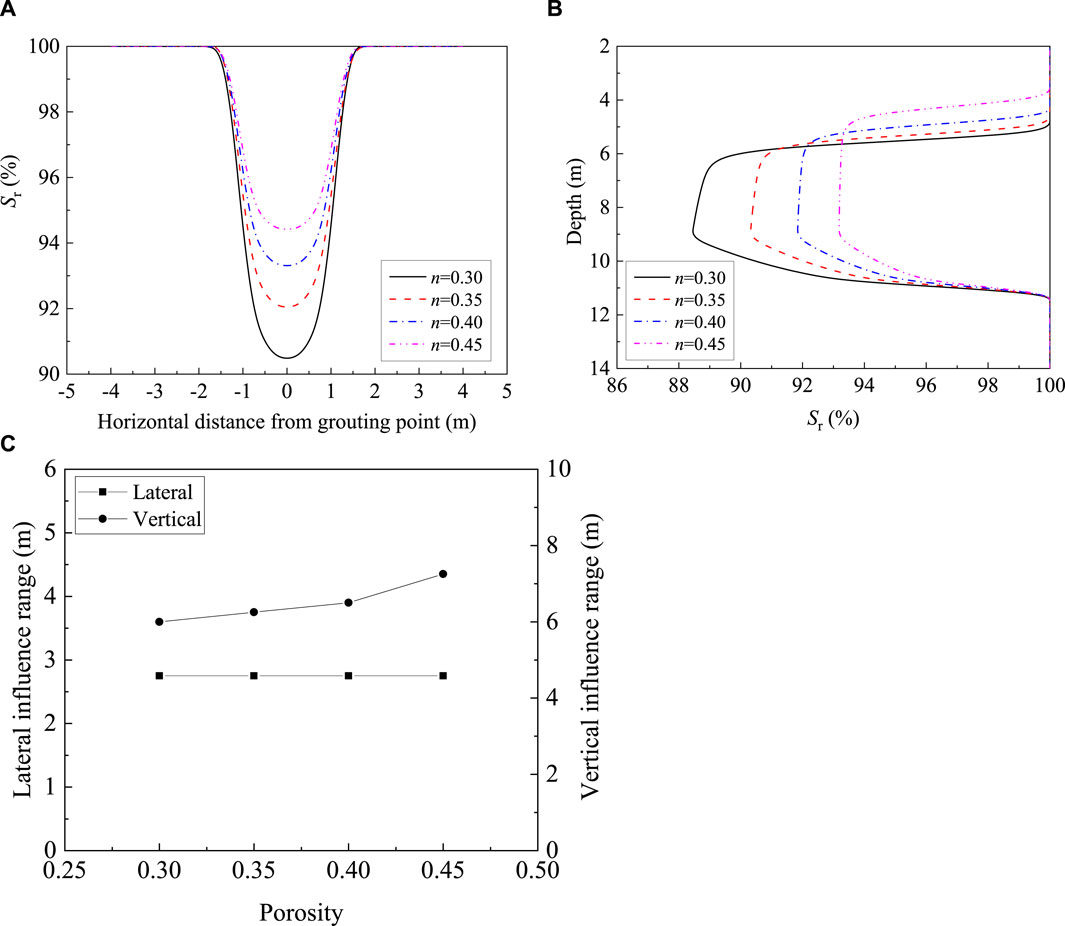
Figure 18. Lateral and vertical distribution of saturation and influence range of desaturation under different porosities. (A) Lateral distribution. (B) Vertical distribution. (C) Influence range.
3.2 Sensitivity analysis of the influencing factors
The sensitivity analysis model is represented by y = f (x1, x2,
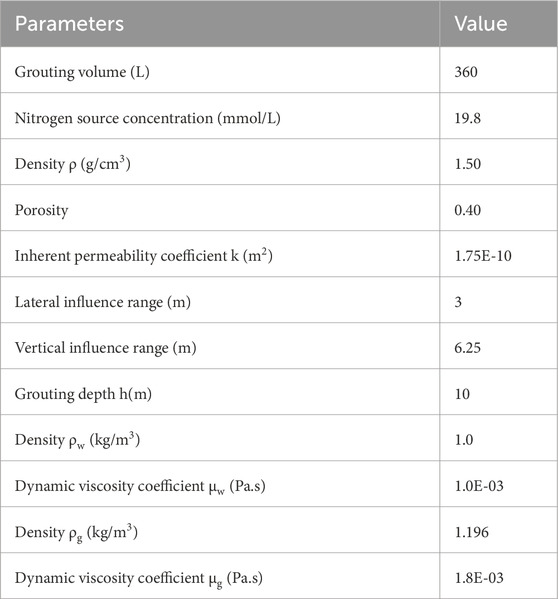
Table 5. Basic calculated values of model parameters.
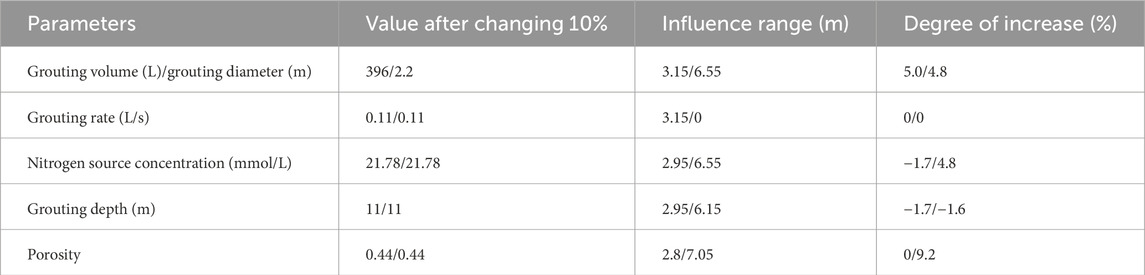
Table 6. Parameter sensitivity of the lateral/vertical influence range.
4 Conclusion
In this paper, the influence range of desaturation by single-hole grouting is analyzed. First, the basic parameters of the soil layer were selected according to the literature, and the established three-dimensional model was verified by using the test results in the literature. Then, the three-dimensional model of the foundation was established to analyze the effect of grouting volume, grouting rate, grouting depth, nitrogen source concentration, and porosity on saturation distribution and the influence range of desaturation. Furthermore, the sensitivity of each parameter was calculated. The research results can provide the theoretical basis for the development and application of microbial grouting to reduce soil saturation and treat liquefiable foundations. The main conclusions are as follows:
(1) The TOUGH2 software is used to establish the gas production mathematical model. The model results indicate that the saturation distribution and influence range are similar to the data cited in the literature. Therefore, it is reasonable to use TOUGH2 software to analyze the pattern of water–gas two-phase migration induced by biogas generation in soil.
(2) When the grouting volume increases from 360 to 2,160 L, the lateral influence range of desaturation shows a linearly increasing trend from 1.75 to 4.5 m. The vertical influence range increased rapidly when the grouting volume increased from 360 to 1,440 L. As the grouting volume continues to increase, the vertical influence range does not change. The influence of the grouting rate on each component of the bacterial suspension and the desaturation is weak. As grouting depth increases, the influence range decreases, and the saturation in the influence area increases slightly. The vertical influence range of desaturation increased with the increase in the nitrogen source concentration, but the lateral influence range changed slightly. With the increase in soil porosity, the vertical influence range of desaturation increases obviously, while the lateral influence area is consistent.
(3) The grouting volume is the most sensitive parameter to the lateral influence range, and porosity is the most sensitive to the vertical influence range. When the grouting volume increases by 10%, the lateral influence range increases by 5.0%, and the vertical influence range increases by 9.2% after the porosity increases by 10%.
Data availability statement
The original contributions presented in the study are included in the article/Supplementary Material; further inquiries can be directed to the corresponding author.
Author contributions
EP: conceptualization, funding acquisition, methodology, software, and writing–review and editing. DL: formal analysis, methodology, and writing–original draft. XH: data curation, funding acquisition, supervision, validation, and writing–original draft. BH: funding acquisition, supervision, validation, visualization, and writing–review and editing. HD: funding acquisition, supervision, validation, visualization, and writing–review and editing. YL: funding acquisition, supervision, validation, visualization, and writing–review and editing.
Funding
The author(s) declare that financial support was received for the research, authorship, and/or publication of this article. This research was funded by the open project of State Key Laboratory of Performance Monitoring and Protecting of Rail Transit Infrastructure, East China Jiaotong University (HJGZ2022107), the Science and Technology program of Gansu Province (Grant No. 23ZDFA017), and the National Natural Science Foundation of China (52368047).
Conflict of interest
HD and YL were employed by China Railway Qinghai-Tibet Group Co., Ltd.
The remaining authors declare that the research was conducted in the absence of any commercial or financial relationships that could be construed as a potential conflict of interest.
Publisher’s note
All claims expressed in this article are solely those of the authors and do not necessarily represent those of their affiliated organizations, or those of the publisher, the editors, and the reviewers. Any product that may be evaluated in this article, or claim that may be made by its manufacturer, is not guaranteed or endorsed by the publisher.
References
Alvarez, M. L., Ai, J., Zumft, W., Sanders-Loehr, J., and Dooley, D. M. (2001). Characterization of the copper-sulfur chromophores in nitrous oxide reductase by resonance Raman spectroscopy: evidence for sulfur coordination in the catalytic cluster. J. Am. Chem. Soc. 123 (4), 576–587. doi:10.1021/ja994322i
Baker, D. M., and Benson, C. H. (2007). Effect of system variables and particle size on physical characteristics of air sparging plumes. Geotech. Geol. Eng. 25 (5), 543–558. doi:10.1007/s10706-007-9127-6
Bian, X., Gao, Z. Y., Zhao, P., and Li, X. Z. (2024). Quantitative analysis of low carbon effect of urban underground space in Xinjiekou district of Nanjing city, China. Tunn. Undergr. Space Technol. incorporating Trenchless Technol. Res. 143, 105502. doi:10.1016/j.tust.2023.105502
Blümle, S., and Zumft, W. G. (1991). Respiratory nitrate reductase from denitrifying Pseudomonas stutzeri, purification, properties and target of proteolysis. Biochim. Biophys. Acta Bioenerg. 1057 (1), 102–108. doi:10.1016/S0005-2728(05)80089-1
Bradford, S. A., and Bettahar, M. (2005). Straining, attachment, and detachment of cryptosporidium oocysts in saturated porous media. J. Environ. Qual. 34 (2), 469–478. doi:10.2134/jeq2005.0469
Cai, W., Lan, F., Huang, X., Hao, J., Xia, W., Tang, R., et al. (2024). Generative probabilistic prediction of precipitation induced landslide deformation with variational autoencoder and gated recurrent unit. Front. Earth Sci. 12, 1394129. doi:10.3389/feart.2024.1394129
Chaney, R. (1978). Saturation effects on the cyclic strength of sands. Proceedings of the ASCE Geotechnical Engineering Division Specialty Conference, 342–358.
Chen, Y. M., He, S. K., Fang, Z., and Jiang, Q. (2017). Field tests on liquefaction resistance of desaturation measure of electrolysis. Chin. J. Geotechnical Eng. 39 (5), 832–838. doi:10.11779/CJGE201705007
Danko, G. L. (2014). Subsurface flow and transport process model for time dependent mine ventilation simulations. Min. Technol. 122 (3), 134–144. doi:10.1179/147490013X13639459465691
Eseller-Bayat, E., Yegian, M. K., Alshawabkeh, A., and Gokyer, S. (2013). Liquefaction response of partially saturated sands. II: empirical model. J. Geotech. Geoenviron 139 (6), 872–879. doi:10.1061/(ASCE)GT.1943-5606.0000816
Eseller-Bayat, E. E. (2009). Seismic response and prevention of liquefaction failure of sands partially saturated through introduction of gas bubbles. Boston: Northeastern University. doi:10.17760/d20000133
Feng, Y., Yang, W., Wan, J., and Li, H. (2023). Granular risk assessment of earthquake induced landslide via latent representations of stacked autoencoder. Front. Earth Sci. 11, 1308808. doi:10.3389/fenvs.2023.1308808
Han, Z. J., Li, J., Wang, W. L., and Hua, Y. (2016). Study on transport mechanisms and influencing factors of microorganisms in porous media. Anhui Agric. Sci. 44 (02), 127–130. doi:10.13989/j.cnki.0517-6611.2016.02.045
Hu, X. Y., Li, D. D., Peng, E. X., Hou, Z., Sheng, Y., and Chou, Y. L. (2020). Long-term sustainability of biogas bubbles in sand. Sci. Rep-Uk 10, 12680. doi:10.1038/s41598-020-69324-0
Jiang, X. Y., Lu, Q. R., Chen, S. J., Dai, R. H., Gao, J. H., and Li, P. (2020). Research progress of soft soil foundation treatment technology. IOP Conf. Ser. Earth Environ. Sci. 6, 012081. doi:10.1088/1755-1315/455/1/012081
Li, G. H., and Li, B. G. (2006). Non-equilibrium transport of Escherichia coli through saturated sandy loam and its simulation with CDE model. Acta Pedol. Sin. 43 (6), 197–202. doi:10.3321/j.issn:0564-3929.2006.02.004
Li, G. H., and Wei, S. Q. (2003). Progress in the study of soil solute transport in soil-water system. J. Soil Sci. 34 (6), 576–580. doi:10.19336/j.cnki.trtb.2003.06.021
Locke, M., Indraratna, B., and Adikari, G. (2001). Time-dependent particle transport through granular filters. J. Geotechnical Geoenvironmental Eng. 127 (6), 521–529. doi:10.1061/(ASCE)1090-0241(2001)127:6(521)
Martin, G. R., Seed, H. B., and Finn, W. D. (1978). Effects of system compliance on liquefaction tests. J. Geotechnical Eng. Div. 104 (4), 463–479. doi:10.1061/AJGEB6.0000614
Mei, C. C., Cheng, Z., and Ng, C. O. (2002). A model for flow induced by steady air venting and air sparging. Appl. Math. Model 26 (7), 727–750. doi:10.1016/S0307-904X(01)00083-X
Ministry of Water Resources of the People’s Republic of China (2008). Standard for engineering classification of soil. Beijing: China Planning Press.
Mohan, S., Schmid, M. M., and Cole, J. (2004). Detection and widespread distribution of the nrfA gene encoding nitrite reduction to ammonia, a short circuit in the biological nitrogen cycle that competes with denitrification. Fems Microbiol. Ecol. 49 (3), 433–443. doi:10.1016/j.femsec.2004.04.012
Moura, I., and Moura, J. J. (2001). Structural aspects of denitrifying enzymes. Curr. Opin. Chem. Biol. 5 (2), 168–175. doi:10.1016/S1367-5931(00)00187-3
Mualem, Y. (1976). A new model for predicting the hydraulic conductivity of unsaturated porous media. Water Resour. Res. 12 (3), 513–522. doi:10.1029/WR012i003p00513
Peng, E. X. (2018). Mechanism study on mitgation of liquefication using biogas. Nanjing: Southeast University. doi:10.27014/d.cnki.gdnau.2018.000061
Peng, E. X., Zhang, D. W., Sun, W. B., and Du, G. Y. (2018). Desaturation for liquefaction mitigation using biogas produced by pseudomonas stutzeri. J. Test. Eval. 46 (4), 1333–1342. PhD dissertation. doi:10.1520/JTE20170435
Rajani, B. B. (1988). A simple model for describing variation of permeability with porosity for unconsolidated sands. Situ; (United States) 12 (3), 209–226. doi:10.1016/0266-1144(88)90004-0
Rebatalanda, V., and Santamarina, J. C. (2012). Mechanical effects of biogenic nitrogen gas bubbles in soils. J. Geotechnical Geoenvironmental Eng. 138 (2), 128–137. doi:10.1061/(ASCE)GT.1943-5606.0000571
Richardson, D. J., Berks, B. C., Russell, D. A., Spiro, S., and Taylor, C. J. (2001). Functional, biochemical and genetic diversity of prokaryotic nitrate reductases. Cell. Mol. Life Sci. Cmls 58 (2), 165–178. doi:10.1007/PL00000845
Romano, N., Brunone, B., and Santini, A. (1998). Numerical analysis of one-dimensional unsaturated flow in layered soils. Adv. Water Resour. 21 (4), 315–324. doi:10.1016/S0309-1708(96)00059-0
Su, X. S., Gu, X. X., and Meng, J. Y. (2012). Simulation of reaction migration of multi-component solute under artificial recharge. J. Jilin Univ. (Earth Sci. Ed.) 42 (02), 485–491. doi:10.13278/j.cnki.jjuese.2012.02.030
Tsukamoto, Y., Ishihara, K., Nakazawa, H., Kamada, K., and Huang, Y. (2002). Resistance of partly saturated sand to liquefaction with reference to longitudinal and shear wave velocities. J. Jpn. Geotechnical Soc. 42 (6), 93–104. doi:10.3208/sandf.42.6_93
Van, D., Vanderzee, M. S., and Vanduijn, C. J. (1995). Multi-phase flow modeling of air sparging. Adv. Water Resour. 18 (6), 319–333. doi:10.1016/0309-1708(95)00028-H
Van genuchten, M. T. (1980). A closed-form equation for predicting the hydraulic conductivity of unsaturated soils. Soil Sci. Soc. Am. J. 44 (5), 892–898. doi:10.2136/sssaj1980.03615995004400050002x
Wang, J., and Hu, L. M. (2010). “Numerical simulation of two-phase seepage in groundwater aeration method,” in The 11th national conference on rock mechanics and engineering (Wuhan: ISRM). doi:10.1016/j.compgeo.2022.105239
Weeg-Aerssens, E., Wu, W. S., Ye, R. W., Tiedje, J. M., and Chang, C. K. (1991). Purification of cytochrome cd1 nitrite reductase from Pseudomonas stutzeri JM300 and reconstitution with native and synthetic heme d1. J. Biol. Chem. 266 (12), 7496–7502. doi:10.1016/S0021-9258(20)89474-5
White, R. E. (1985). Effect of macropore flow on the transport of indigenous solutes in soil. The influence of macropores on the transport of dissolved and suspended matter through soil. New York: Springer, 95–120. doi:10.1007/978-1-4612-5090-6_3
Xia, H., and Hu, T. (1991). Effects of saturation and back pressure on sand liquefaction. J. Geotechnical Eng. 117 (9), 1347–1362. doi:10.1061/(ASCE)0733-9410(1991)117:9(1347)
Xiang, G., Jiang, T., Yang, Q., Cui, S., Zhu, L., He, Y., et al. (2023). The influence of vertical seismic acceleration on the triggering of landslides constrained by bedding faults under an inertial frame reference: the case of the daguangbao (DGB) landslide. Appl. Sci. 13 (23), 12911. doi:10.3390/app132312911
Yoshimi, Y., Tanaka, K., and Tokimatsu, K. (1989). Liquefaction resistance of a partially saturated sand. Soils Found. 27 (3), 157–162. doi:10.3208/sandf1972.29.3_157
Yu, H., Yuan, M., Lu, W., Yang, J., Dai, S., Li, Q., et al. (2011). Complete genome sequence of the nitrogen-fixing and rhizosphere-associated bacterium Pseudomonas stutzeri strain DSM4166. J. Bacteriol. 193 (13), 3422–3423. doi:10.1128/JB.05039-11
Zumft, W. G. (2005). Nitric oxide reductases of prokaryotes with emphasis on the respiratory, heme-copper oxidase type. J. Inorg. Biochem. 99 (1), 194–215. doi:10.1016/j.jinorgbio.2004.09.024
Keywords: influence range, sensitivity analysis, desaturation, biogas, TOUGH2
Citation: Peng E, Li D, Hu X, He B, Dang H and Liu Y (2024) The influence range of the biogas desaturation method for mitigating sand liquefaction. Front. Earth Sci. 12:1433507. doi: 10.3389/feart.2024.1433507
Received: 16 May 2024; Accepted: 05 July 2024;
Published: 31 July 2024.
Edited by:
Chong Xu, Ministry of Emergency Management (China), ChinaReviewed by:
Lei Gao, Hohai University, ChinaXia Bian, Hohai University, China
Huajin Li, Chengdu University, China
Copyright © 2024 Peng, Li, Hu, He, Dang and Liu. This is an open-access article distributed under the terms of the Creative Commons Attribution License (CC BY). The use, distribution or reproduction in other forums is permitted, provided the original author(s) and the copyright owner(s) are credited and that the original publication in this journal is cited, in accordance with accepted academic practice. No use, distribution or reproduction is permitted which does not comply with these terms.
*Correspondence: Erxing Peng, ZXJ4aW5ncGVuZ0BsemIuYWMuY24=