 Yu Lei
 Li Jianyong3*
 Yu Chen
 Zhang Haizhen
 Ma Weiyu
- 1Anhui Earthquake Agency, Hefei, China
- 2University of Science and Technology of China, Hefei, China
- 3China Earthquake Network Center, Beijing, China
- 4National Satellite Meteorological Center, China Meteorological Administration, Beijing, China
The Load/Unload Response Ratio (LURR) is a seismic prediction method based on the dynamic evolution of the stress-strain relationship of rocks. By adopting Benioff strain as the response indicator, an in-depth analysis was conducted on the LURR anomalies within 400 km of the epicenter and its surrounding areas before the Ms7.4 earthquake in Madoi, Qinghai Province, on 22 May 2021. The analysis revealed that the LURR value peaked 1 month before the earthquake and then declined within half a month, indicating that the rock medium in the seismic gestation area was approaching the end of its yielding phase. Further investigation using the Outgoing Longwave Radiation (OLR) data from the National Oceanic and Atmospheric Administration (NOAA) satellite was conducted to study the short-term and imminent anomalous evolution of ground longwave radiation values after the high values declined (from May 14 to 25). The results showed that, spatially, significant and continuous OLR anomalies were observed only in the northern area of the epicenter before the earthquake, and these anomalies exhibited a trend of expanding towards the epicenter. Temporally, the entire anomalous evolution process can be divided into six phases: initial warming, anomaly expansion, peak intensity, anomaly weakening, earthquake occurrence, and anomaly disappearance. To validate this finding, the spatiotemporal evolution characteristics of LURR and OLR within 300 km of the epicenter and its surrounding areas before the Ms6.4 earthquake in Yangbi, Yunnan Province, on 21 May 2021, were analyzed, and similar patterns were found. These results suggest that the high LURR value before its decline may mark the end of the rock medium’s yielding phase, and OLR data can reflect, to some extent, the state of tectonic stress accumulation along active faults in a critical condition. A comprehensive study of the anomalous evolution characteristics of these two physical parameters before the earthquake is not only conducive to the continuity from long-term to short-term forecasts but also of great significance for more accurately assessing the trend of seismic activity.
1 Introduction
The study of Solid Earth-atmosphere interactions in the epicentral region, particularly through the analysis of thermal infrared anomalies on the Earth’s surface in the short term preceding earthquakes, has garnered significant interest in seismic forecasting. Mogi (1984) pioneered this field, and subsequent research has furthered our understanding. For instance, Gorny (1988) observed a notable enhancement in the thermal infrared radiation over a large area approximately 10 days prior to several major earthquakes in the Gazli region in 1984. Ouzounov and Freund (2004), in their analysis of MODIS data, identified significa nt land surface temperature patterns preceding earthquakes, which they attributed to a positive hole-type charge.
Mechanism Saraf et al. (2008) examined 10 earthquakes in the Iranian region and reported an increase in land surface temperature (LST) of about 2°C–13°C at the epicenter and its vicinity 1–10 days before the main shock. Additionally, rock mechanics experiments, such as those conducted by Cui, C., et al. (1993) and Wu, L., et al. (2004), have demonstrated that the destabilization and fracturing of rocks are accompanied by the emission of infrared radiation. These experimental findings offer a mechanical rationale for the use of infrared remote sensing in seismic monitoring and prediction.
Currently, the identification and extraction of pre-earthquake thermal infrared anomalies predominantly rely on statistical methods, as discussed by Tramutoli (2007). Lisi et al. (2010) applied the Robust Satellite Technique (RST) to analyze thermal infrared observations associated with the Abruzzo earthquake on 6 April 2009. Yang and Guo (2010) introduced a novel subtraction method to investigate the thermal anomalies preceding the Zhangbei earthquake in China. However, due to the complexity of thermal infrared anomaly changes, these statistical methods have inherent limitations. They often result in issues such as the broad distribution of anomaly areas, high variability in the spatial distribution of anomalies, and an absence of clear temporal patterns (Qiang, Z., et al., 1997; Xu, X., et al., 1990; Yu, C., et al., 2023). Consequently, there is an urgent need to develop methods with a solid physical basis and mechanical underpinnings to more accurately and swiftly ascertain the background values of thermal infrared anomalies in the lead-up to strong earthquakes.
In recent years, the load-unload response ratio (LURR) has emerged as a valuable tool for analyzing the nonlinear mechanical processes preceding major earthquakes, as documented in the works of Yu and Zhu, 2010 and Zakupin et al. (2021). This approach aids in refining the selection of thermal infrared background values. The concept of LURR was introduced by Yin et al. (1995) and has since become a staple in retrospective seismic prediction studies, as referenced in Yu et al. (2015). Drawing from systematology, the dynamic evolution of constitutive relations within rock media in seismogenic regions is investigated. This is achieved by establishing a relationship between internal system dynamics and external factors, as depicted in Figure 1. During the elastic phase of rock media, the responses to loading and unloading are nearly identical, yielding a LURR value of approximately 1.0. However, as the rock mass transitions into the dilatancy phase due to stress accumulation, the responses to loading and unloading become markedly different, resulting in a LURR value exceeding 1.0. Consequently, LURR serves as a diagnostic tool to identify the critical state of the medium prior to catastrophic rupture, offering a robust reference for the determination of thermal infrared anomaly background values.
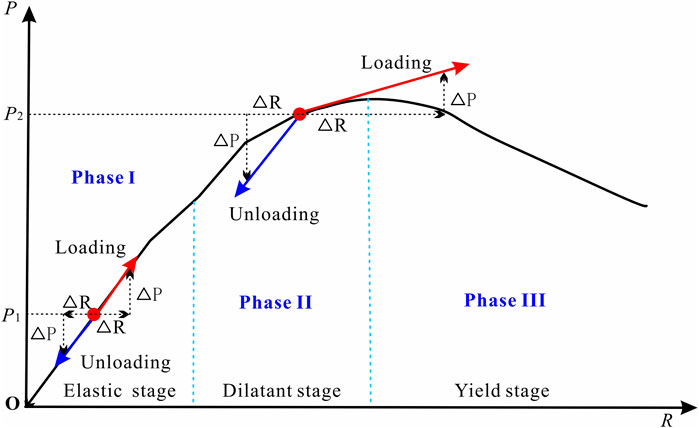
Figure 1. Schematic diagram of the rock constitutive relationship. P and R represent the load and response, respectively. At the point P1 in phase I, the response (ΔR) to the small changes of ΔP in the loading and unloading are almost the same. At the phase II, the response to loading is significantly greater than unloading, and the phase III is characterized with macroscopic damage.
Earthquakes result from the rapid release of accumulated energy when stress within the rock medium reaches a critical state, leading to fault instability and rupture. Outgoing longwave radiation (OLR), an observable remote sensing parameter, theoretically concentrates at wavelengths between 8 and 12.5 μm, primarily determined by the temperature and emissivity of the emitting surface. Real-time OLR essentially reflects the surface temperature variations of the observed region, and recent studies have found a correlation between pre-earthquake dynamic evolution of OLR and changes in geostresses (Wu et al., 2006). Additionally, LURR, a physical quantity reflecting the stress state of the rock medium, often utilizes Benioff strain as a responsive measure for the loading-unloading process. Therefore, establishing a physical correlation between LURR and OLR could provide a mechanical basis for the selection of OLR background values, enhancing the reliability of this selection, reducing the uncertainty in conclusions due to the randomness of the calculation process, and narrowing the spatial range of anomalies, thereby excluding potentially interfering anomalous areas.
Thus, this paper attempts to integrate the LURR method into longwave radiation seismic observation techniques. By analyzing the coupling relationship between the pre-earthquake short-term evolution of LURR and OLR anomalies, we aim to determine the stress state of the seismogenic region prior to an earthquake. The Coulomb failure stress induced by the solid tide on the fault plane serves as the criterion for judging the loading-unloading process (Yin et al., 2008). To explore the correlation between these two, this study takes the Ms7.4 Madoi earthquake in China, which occurred in 2021, as a case study.
2 Methods
Over the past 2 decades since its introduction, the LURR has become a widely utilized tool in the practice of earthquake prediction (Yu and Zhu, 2010; Liu and Yin, 2017). Time series analyses have consistently demonstrated significant anomalies in the form of elevated values on a temporal scale ranging from months to years preceding major seismic events. These anomalies can be instrumental in identifying the prospective timing and epicentral regions of future earthquakes (Liu et al., 2012).
2.1 Judgment of loading and unloading process
The load-unload response ratio, denoted as Y (LURR), is formulated as Y = X+/X−, where the symbols “+” and “−” represent the loading and unloading processes, respectively, and x signifies the response rate.
In the field of earthquake prediction, the determination of loading and unloading phases hinges on the variations in coulomb fracture stress (ΔCFS), which are provoked by the tidal forces of the sun and moon acting upon the seismic fault surface.
Generally, the aggregate of tectonic and tidal shear stresses is indicative of the shear stress acting upon the fault plane, as illustrated in Figure 2, that is Equation 3:
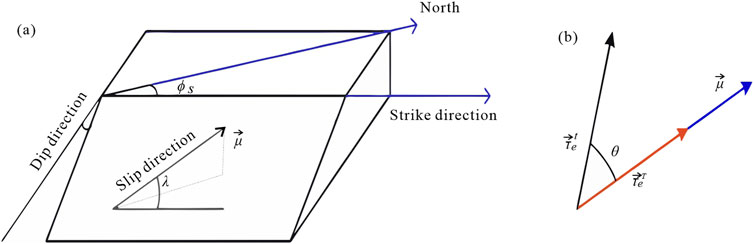
Figure 2. Determination of loading and unloading periods induced by tidal stress (A) the slip direction on the focal plane driven by the tectonic shear stress; (B) the relationship between the tectonic and tide effective shear stresses.
Despite the fact that tectonic stress significantly exceeds tidal stress by several orders of magnitude, its rate of change is so gradual that it can be regarded as constant during practical computational procedures. The increase in effective shear stress attributable to tidal forces on the fault plane can be formulated as:
As illustrated in Figure 2B, when the angle θ is less than 90°, the forces are additive, signifying a rise in stress. Conversely, when θ exceeds 90°, they are subtractive, indicating a reduction in stress. Differential the Formula 4 in the time domain:
The criterion delineating loading and unloading is derived from Equation 5, where a positive value of “g” indicates loading, and a negative value signifies unloading.
2.2 The selection of response quantities
In the realm of earthquake prediction, theoretically, any geophysical variables capable of reflecting the instability process within the seismogenic region are viable candidates for response variables. Assuming “P” and “R” denote load and response, respectively, the response rate, X, can be reformulated as follows (Equation 6):
ΔR represents the alteration in response “R” that results from the variation in the load variable, ΔP. When the medium’s strength substantially exceeds the load, X+ is approximately equal to X−, hence the LURR is approximately 1. As the medium approaches failure, X+ exceeds X−, resulting in a LURR greater than 1, which allows us to assess if the medium remains in a stable phase.
The loading-unloading response ratio is defined in terms of seismic energy, E, and its associated parameters, serving as the response quantity:
in Formula 7, Ei denotes seismic energy and “+”“−” denotes loading and unloading respectively. M can be 0, 1/3, 1/2, 2/3 or 1. When M = 1, Em is the earthquake energy. When M = 1/3 or 2/3, Em denotes linear scale and surface scale of seismogenic region, respectively. When M = 1/2, Em denotes the Benioff strain. When M = 0, the Y value corresponds to the number of earthquakes occurring during addition and unloading.
3 Applications and data
In this retrospective study, the LURR method is applied to long-wave radiation observations to analyze the dynamic evolution characteristics of the Madoi Ms7.4 earthquake that occurred on 22 May 2021, in the northwestern part of Qinghai Province, China (34.59° N, 98.34° E). Historical seismicity data reveal that there have been five earthquakes with a magnitude of seven or greater within a 300 km radius of the epicenter since 1900, indicating a region of active seismicity (Figure 3). Notably, the most significant of these was the Magnitude 7.7 earthquake on 17 March 1947, in Dari County, Guoluo Prefecture, Qinghai Province, which was approximately 179 km from the Madoi earthquake’s epicenter. The most recent significant earthquake was a 7.1 magnitude event on 14 April 2010, approximately 224 km from Yushu City in Yushu Prefecture, Qinghai Province. The closest in terms of spatial proximity was the 7.5 magnitude earthquake on 7 January 1937, situated 122 km east of Aran Lake, Qinghai Province.
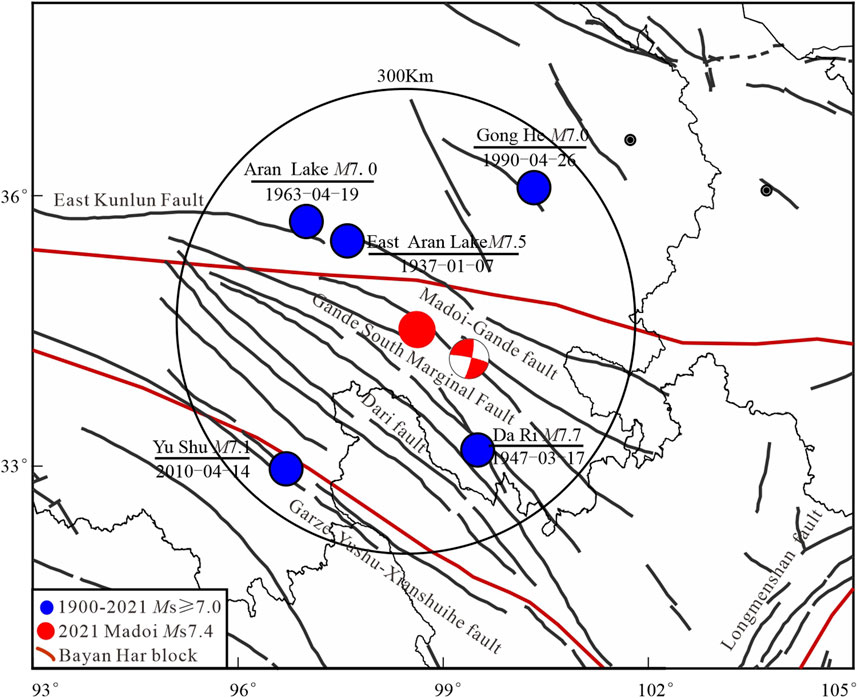
Figure 3. Active faults and historically earthquakes above 7.0 magnitude within 300 km of the epicenter The blue dots in the diagram represent historical earthquakes within 300 km of the epicenter from 1900–2021.
The Madoi County earthquake is situated within the interior of the Bayan Har block, with the closest fault being the Gande South Marginal Fault Zone. The Bayan Har block, located in the central-eastern region of the Tibetan Plateau, is bounded by significant left-lateral strike-slip fault zones: the East Kunlun Fault to the north and the Garze-Yushu-Xianshuihe fault system to the south, both of which trend nearly east-west. Its eastern boundary is marked by the Longmenshan thrust fault zone, which strikes in a NNE direction and plays a crucial role in accommodating the present-day crustal deformation of the Tibetan Plateau. The Bayan Har block is a significant tectonic unit that has been the most seismically active region in mainland China over the past 2 decades, experiencing several earthquakes with a magnitude of Ms ≥ 7.0 (Figure 3). In addition to the aforementioned fault zones, Figure 3 also marks several larger fault zones around the Madoi earthquake, such as the Madoi-Gande fault and the Dari fault zone, etc.
Perform a spatial evolution analysis on the LURR anomalies prior to the Madoi Ms7.4 earthquake with the following computational parameters: Spatially, a step size of 0.25° is used for sliding along the longitude and latitude directions. Within the scanning area, the Benioff strain of earthquakes ranging from 0 to 4.0 magnitudes (m = 1/2) is taken as the response quantity, and the ΔCFS with an internal fault friction coefficient f = 0.4 is calculated based on the rate-and-state-dependent friction model by Yin et al. (2000). The calculation time window is set to 6 months, with a sliding time window of 0.5 months. The calculation results represent the distribution of LURR anomalies at the end of the time window (Figure 4). Figure 4 displays the LURR time series computed by using earthquakes within 100, 200, and 400 km from the Madoi mainshock. The input data is retrieved from the CENC catalog (http://www.ceic.ac.cn).
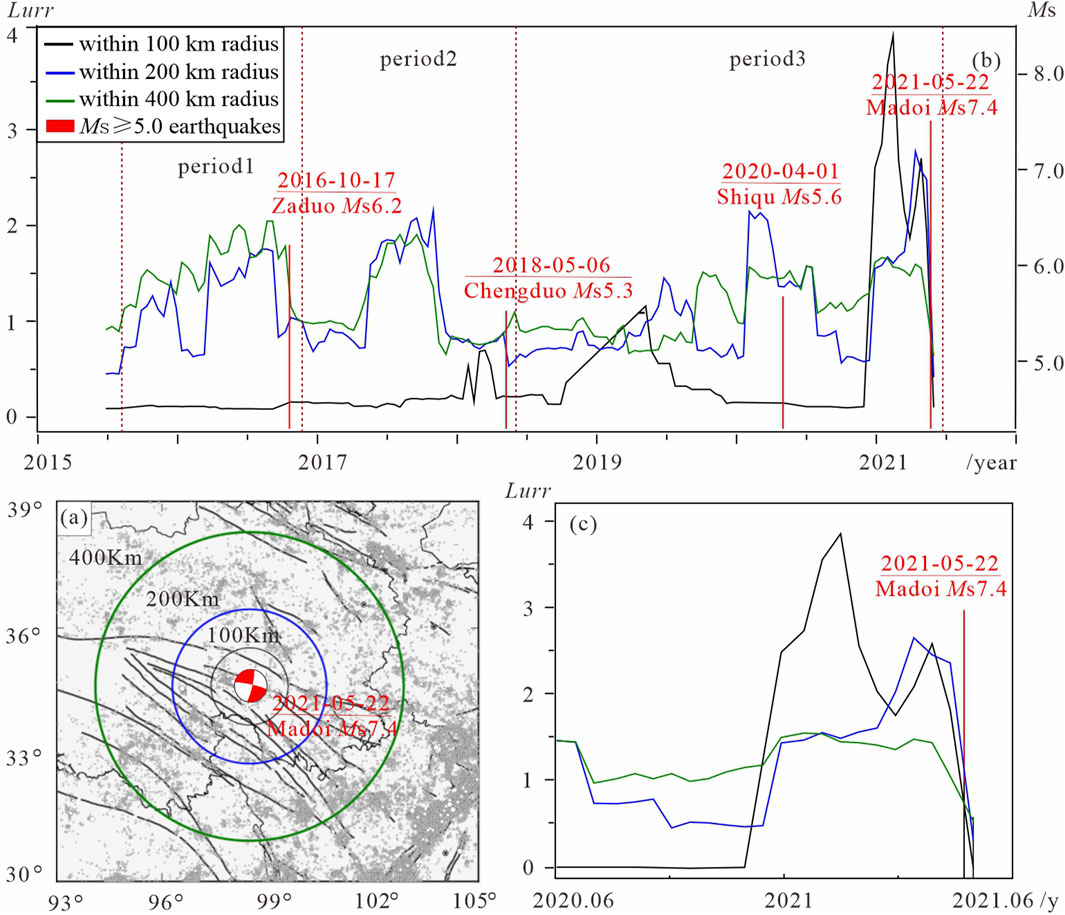
Figure 4. LURR time series of the Madoi Ms7.4 earthquake (A) different distance scales; (B) LURR time series with three different distance scales; (C) Magnification result of LURR timing curve.
The OLR data utilized in this study originates from the series of satellites operated by the United States National Oceanic and Atmospheric Administration (NOAA). This data is employed to analyze the pre-earthquake coupling relationship with LURR. The dataset is recognized for its good applicability and completeness, with a spatial resolution of 1°×1° and a temporal resolution of 1 day. Each data file comprises 360×181 grid points that cover the globe. To more accurately determine the timing of the LURR high-value drop and to avoid discrepancies in the final analysis due to variations in the length of the background date selection, we have plotted an enlarged version of the LURR time series curve from June 2020 to June 2021 (Figure 4C). Based on the outcomes from the 100 km and 200 km analyses, in conjunction with the focal mechanism solutions, May 13th has been preliminarily identified as the peak decline period for LURR. Consequently, the OLR data from this particular day have been chosen as the reference background values. The observational precision of the NOAA satellite sensor indicates a data uncertainty of 0.5 W/m2. Subtracting the background day’s longwave radiation values from the nighttime terrestrial longwave radiation values for the period spanning May 14th to 25th, 2021, within the specified spatial bounds of (31∼39°N, 88∼105°E), yields the ΔOLR values. The calculation of ΔOLR is articulated by the following formula:
in Equation 8, OLRi represents the OLR value at a specific point in time on day i, while OLRb denotes the OLR value of the reference background day.
Zhang, Y. et al. (2021) performed a statistical analysis on thermal infrared anomalies preceding earthquakes in China from 2011 to 2017, focusing on the magnitude range of M4.0 to M7.0. The findings indicated that the amplitude of variation in longwave radiation prior to these earthquakes ranged from 75 W/m2 to 100 W/m2. Given that the Madoi earthquake in 2021 had a magnitude of MS7.4, the study selected an anomaly fluctuation range of 90 to 100 W/m2 for detailed examination. The determination of the ΔOLR anomaly threshold is grounded in the following approach: identifying the maximum ΔOLR value across the entire study area for this seismic event, which is set at 100 W/m2, and using this as the upper limit of the color scale. The scale then descends to the lowest value by decrements of 10 W/m2, establishing the lower limit at 90 W/m2. This results in a data variation range of 10 W/m2. The findings are depicted in Figure 5.
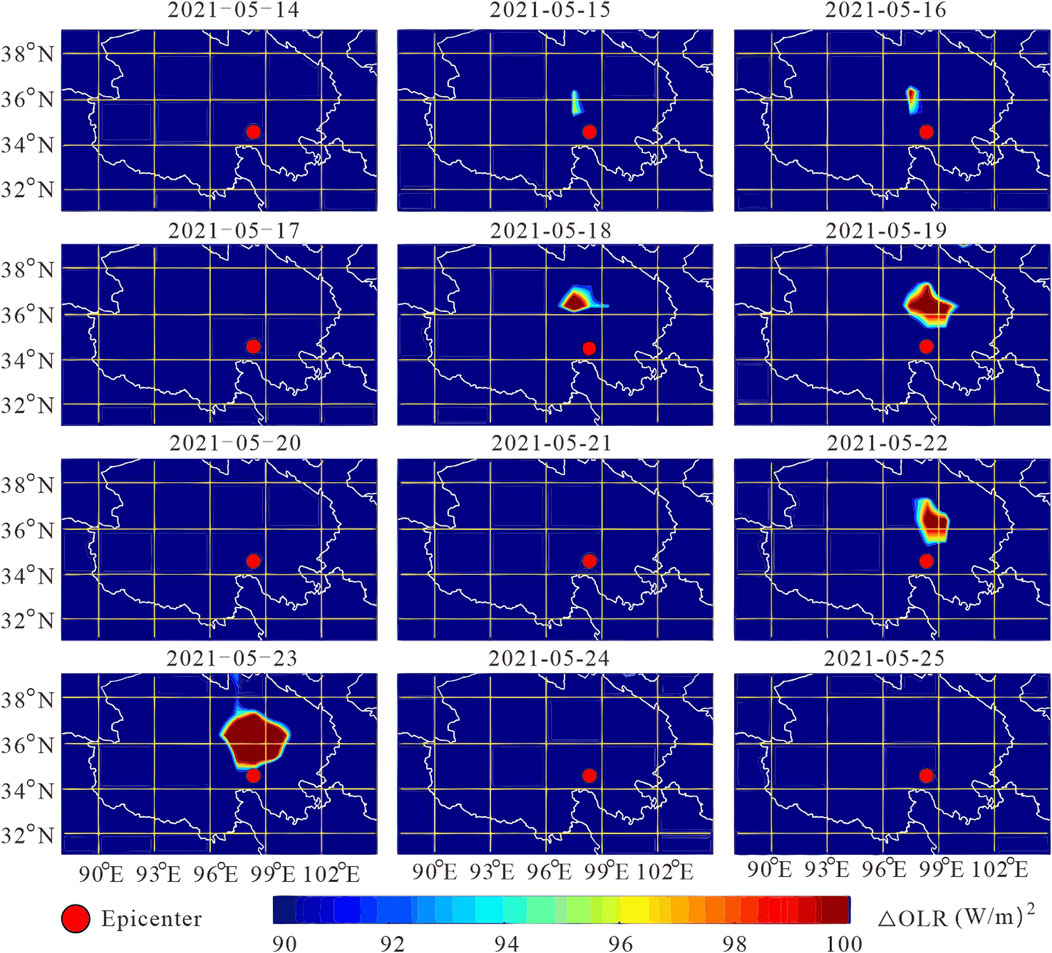
Figure 5. Spatio-temporal evolution of the OLR anomaly of the Madoi Ms7.4 earthquake the OLR data of May 13th is chosen as the reference background value.
4 Results and explanations
Overall, as depicted in Figure 4B, the LURR time series calculated at three different spatial scales generally remain below the threshold of 1.0 for the majority of the time. However, in the brief period preceding the Madoi mainshock, the LURR values rapidly increase to significantly high levels, far exceeding 1.0. These findings are supported by the research of Yin et al. (2000) and Yu et al. (2020), who observed that LURR values fluctuate around 1.0 for several months to 3 years prior to the mainshock. Subsequently, the LURR values ascend rapidly to abnormally high levels, reaching up to 2.0, and persist for several months before declining just before the earthquake, with the shortest duration being less than 2 months.
To rigorously and accurately examine the relationship between LURR anomalies and the stress state in the seismogenic region, it is necessary to conduct analyses using different critical area scales. We computed the LURR time series curves for three distinct radii centered on the mainshock epicenter. The amplitude of the LURR high-value decline prior to the mainshock decreases with the radius, and the results for the smallest radius of 100 km exhibit the most pronounced LURR anomaly peak. This may indicate that the stress accumulation in the seismogenic region is primarily concentrated within a 100 km range. Furthermore, prior to several other earthquakes (M≥5.0) within a 400 km radius of the epicenter since 2015, similar LURR evolution patterns of rapid increase and sustained high values followed by a decline before the earthquake were observed with both 200 km and 400 km radii. In conjunction with the 100 km results, this suggests that the selection of different seismogenic areas for LURR calculation significantly influences the sensitivity of measuring the critical degree of stress accumulation before a major earthquake (Yu et al., 2006).
As shown in Figure 5, within the study area, a significant anomaly in OLR was observed before and after the earthquake following the decline of the high LURR values. On May 14, no significant radiation enhancement was observed near the epicenter. On the 15th, a slight radiation enhancement appeared north of the epicenter, with an increase of up to 94 W/m2. On the 16th, the OLR anomaly showed a slight increase in both spatial extent and intensity. The anomaly diminished on the 17th, but from the 18th to the 19th, the OLR anomaly exhibited a significant enhancement in both spatial extent and intensity. The anomaly continued to expand in the northern region of the epicenter, with the affected area increasing and gradually shifting towards the epicenter, reaching an anomaly increase of 98 W/m2. The increase then declined on the 20th and 21st. Following the earthquake on May 22, the OLR anomaly showed an explosive increase from the 22nd to the 23rd, with the maximum increase exceeding 100 W/m2. The anomalous area continued to expand north of the epicenter, and the anomaly dissipated after the 24th. Statistical analysis of the anomaly amplitude and range is presented in Table 1. The specific numerical values of the anomaly amplitude and range also reveal the same phenomenon.
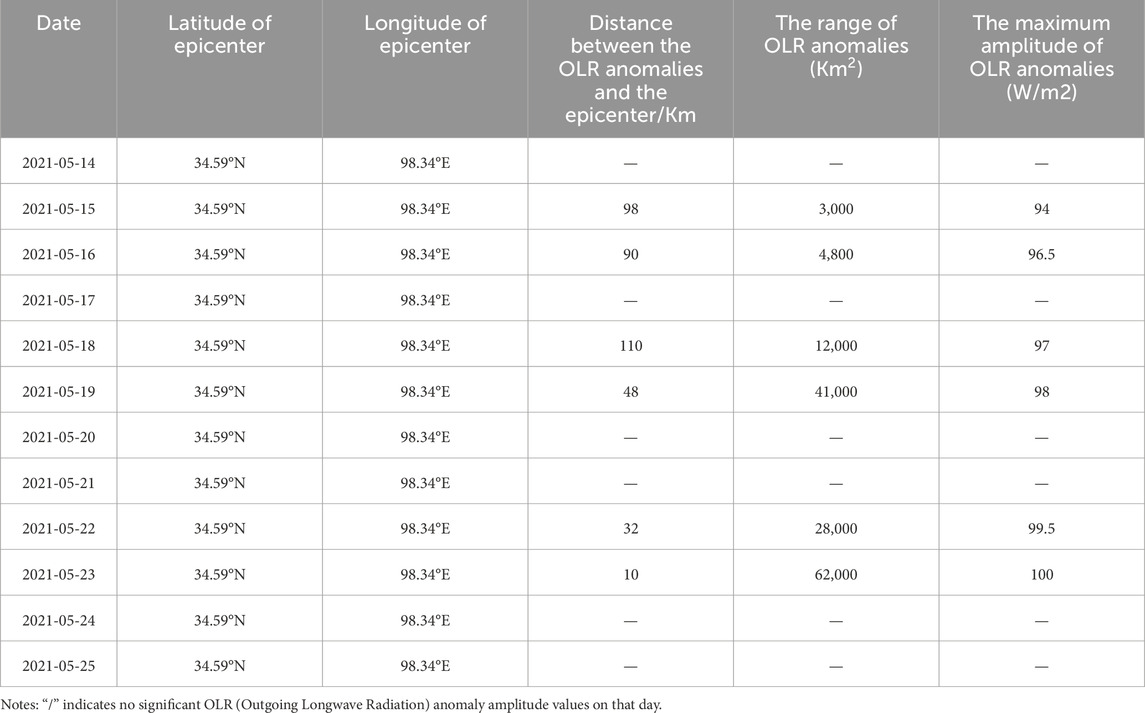
Table 1. Statistical table of OLR anomalies from May 14th to May 25th.
5 Discussion
Earthquake prediction primarily encompasses long-term, mid-term, and short-term time scales. Taking China as an example, routine consultations are held annually, monthly, and weekly, with different durations of predictions adopting different approaches and tracking different anomalous features. In long-term forecasting, annual predictions include methods such as the R-score, exploration of seismic activity (e.g., seismic quiescence, seismic belts), and seismological parameters (e.g., b-value), where anomalies must generally exceed a certain threshold and persist for more than 3 months. By comparing existing anomalies with their related predictive indicators, a comprehensive probability analysis method is used to derive the final prediction results. The R-value test of the prediction results over the past 30 years shows an upward trend in effectiveness, with the value gradually rising from 0.1 in 1990 to the current level of 0.35 (Yu et al., 2022).
For mid-term and short-term forecasting, monthly and weekly consultations target areas based on annual results. Evidence supporting mid-term and short-term predictions is based on significant increases or cessations in seismic activity, as well as sudden changes in geochemical and geophysical observational data, with anomalies (exceeding the threshold) generally lasting no more than 3 months. Yu et al. (2022) analyzed the time series of monthly prediction R-values for earthquakes of magnitude 5.0 or above occurring in the following calendar month, using 2018 as a reference. The results indicate that before June 2018, due to the absence of earthquakes in the seismic hazard areas, the R-value was negative. However, after that, the R-value turned positive as some earthquakes were detected. The annual average R-value was 0.11, significantly lower than the annual R-score.
Currently, short-term earthquake prediction is more challenging than mid-term prediction because mid-term anomalies persist for a longer duration, usually several months or even years. Observed anomalies can be continuously used for multiple short-term predictions, making it difficult to link anomalies with the timing of earthquakes on a short time scale, which also reflects that short-term prediction remains a current challenge.
The LURR, based on the Benioff strain release from small earthquakes triggered by tidal stress, serves as an effective physical parameter to reflect the dynamic evolution of the constitutive relationship within rock media. When tectonic stress is at a low level, indicative of the elastic phase, minor stress variations, such as those due to tides, are insufficient to trigger seismic events. During this phase, the differences in Benioff strain response between loading and unloading are negligible, and the LURR is expected to fluctuate around 1.0. However, when the accumulated tectonic stress on a fault reaches a higher level, even the slightest stress change can be seismically significant. This perspective is validated by the pre-failure dilatancy model proposed by Brace and colleagues (Brace et al., 1966; Scholz et al., 1973). According to the Kaiser effect (Li and Nordlund, 1993), in this phase, earthquakes are often triggered by an increase in Coulomb failure stress, implying that under the periodic tidal shear stress, the Benioff strain release during loading exceeds that during unloading. Consequently, this differential strain release between loading and unloading can be detected by the LURR method, mathematically expressed as a LURR ratio significantly greater than 1.0 (as shown in Figure 4). This suggests that an anomalously high LURR value can indicate a high-stress state in the region, which can lead to changes in the elastic modulus of the rock media.
Further analysis indicates that the duration (T2) from the decline of LURR to the occurrence of an earthquake may correlate with the intensity of seismic activity in the region. We can divide the period from 2015 to 2021 into three phases, defining T3 as the time interval between the last earthquake of one phase and the first of the subsequent phase. The statistical results are as Table 2.
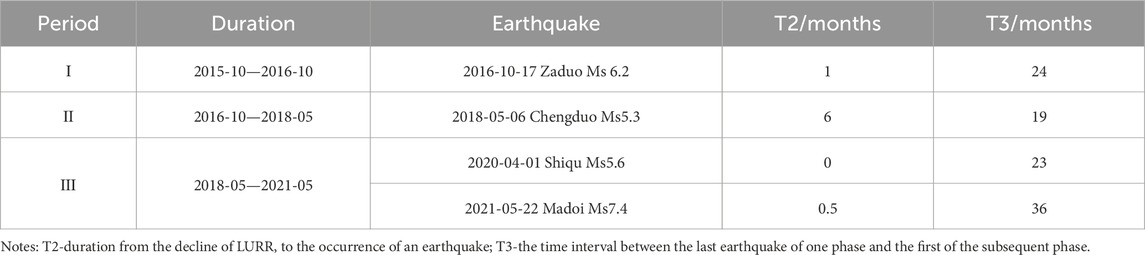
Table 2. Time duration corresponding to each phase in Figure 4 and the and the T2 and T3 associated with the earthquakes.
The results indicate that shorter intervals of T3 are associated with longer durations of T2. This finding can be interpreted as follows: when the medium’s homogeneity is higher, such as in regions that have not experienced earthquakes for an extended period, ruptures may occur sooner. Conversely, areas characterized by a lower degree of medium uniformity, typically associated with regions of heightened seismic activity, may experience a protracted timeline for rupture occurrence. By considering the characteristics of regional seismic activity, the timing of future earthquakes might be more accurately determined by the moment when LURR values begin to decline.
We diligently endeavor to apply the LURR (load-unload response ratio) method to evaluate the post-earthquake aftershock scenarios. In response to the urgent requirement for swift determination following seismic events, we have fine-tuned the computational time frame to a 5-day window with a 1-day slide, while maintaining all other parameters constant. This adjustment facilitates the generation of the LURR time-series variations post the Madoi earthquake, as depicted in Figure 6, As illustrated in Figure 6, despite the intense aftershock activity in the immediate aftermath of the earthquake, the LURR values are observed to be low. This phenomenon can be attributed to the main shock and the several strong aftershocks that transpired within a short time span, which were characterized by an unloading process, thus leading to the observed results. Later, in the months of July and August, two significant aftershocks occurred within the aftershock zone. Notably, the LURR results for both 50 km and 100 km distances exhibited a pronounced increase prior to the occurrence of these strong aftershocks. This suggests that the LURR method provides a certain degree of predictive insight into the analysis of post-earthquake aftershocks.
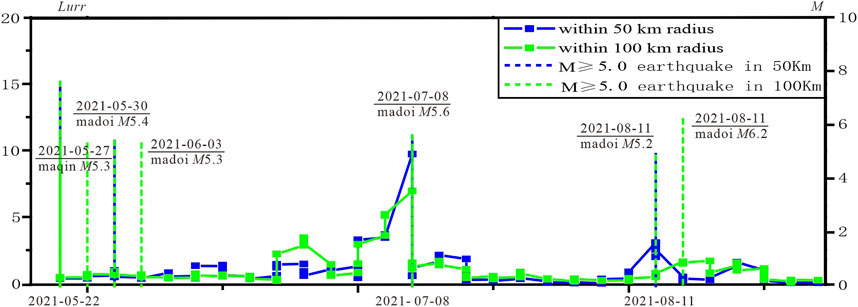
Figure 6. LURR Time-series curve following the Ms 7.4 Madoi earthquake in 2021.
OLR, as a physical observation that reflects the surface temperature changes of the observed region, has been widely utilized in the field of earthquake prediction. Ma Jin and others have conducted extensive research on the evolution of the fault temperature field before earthquakes. Based on experimental results from rock samples, they divided the deformation phase of a single stick-slip event into two phases: the stress accumulation phase (LO) and the stress release phase (OP). The stress release phase can be further divided into four phases: OA represents the initial phase of sub-critical instability, AB the second phase of sub-critical instability, BE the instability phase, and EP the post-instability phase. Recent studies have shown that if the medium’s stress change process is in the OB phase (sub-critical instability phase), the process leading to the medium’s failure becomes irreversible, and an inevitable earthquake is imminent. According to the theoretical implications of LURR, the rapid rise and subsequent decline of the LURR time series curve before an earthquake can reflect the MO to OE phases of the sample’s rupture process. The moment of the high-value return can be considered as an indication of the time when the sample enters the OE phase (Figure 7). The corresponding times for each moment in Figure 7 and the percentage distribution of time for each deformation phase are listed in Tables 3, 4.
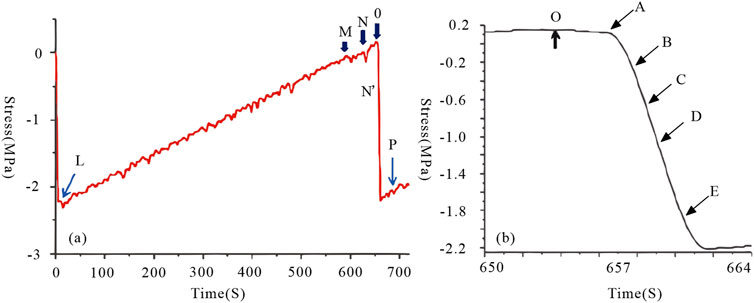
Figure 7. An enlarged diagram of the differential stress-time process (A) the instability time process (B) in a stick-slip event (From Ma and Guo, 2012).

Table 3. Corresponding times for each moment in Figure 7.
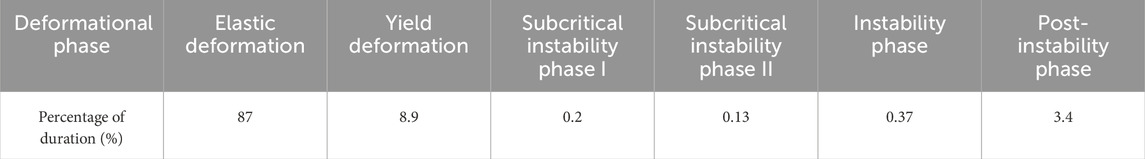
Table 4. Percentage of time for each deformation phase in Figure 7.
Rock loading experiments have demonstrated that local temperatures near the fault plane, particularly at positions adjacent to the rupture point, increase following the peak stress moment, denoted as time O. Subsequently, at time A, the fault undergoes comprehensive cooling as it enters a phase of rapid stress release. Some measurement points located on either side of the fault experience a rapid temperature increase during the instability phase (BE), coincident with fault slip. Furthermore, a continued temperature rise is observed even after the slip has occurred (EP phase), as depicted in Figure 8. This phenomenon can be attributed to two primary factors. Firstly, the low thermal conductivity of rocks implies that the transfer of heat from the fault zone to the surface may be delayed. Secondly, the impact of post-seismic slip on temperature, while often overlooked, is a significant consideration. The continued temperature increase after fault slip underscores the complex thermal dynamics at play during seismic events.
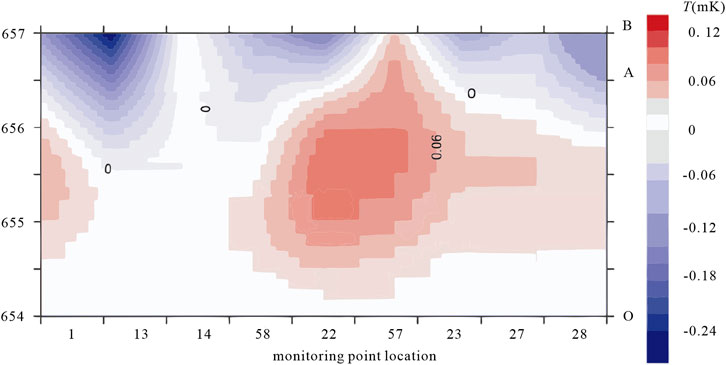
Figure 8. Sub-instability phase (O-A-B) along the fault temperature changes with time (From Ma et al., 2012). The temperature at time O is zero.
The OLR evolution process in the epicentral area, processed in this study from the moment of the LURR high-value return to 2 days after the earthquake, appears to correlate well with the temperature changes observed in rock fracture experiments:
(1) From May 14th to 19th, an enhancement in OLR radiation near the fault was observed, with the intensity of the increase progressively strengthening, corresponding to the OA phase.
(2) On May 20th and 21st, a continuous decline in OLR radiation was noted for two consecutive days prior to the earthquake, aligning with the AB phase.
(3) Following the mainshock on May 22nd (post the E point), an enhancement in OLR radiation was observed for two consecutive days in the northern part of the epicentral area, surpassing pre-shock levels in both extent and intensity, reflecting the EP phase.
(4) By May 24th to 25th, the enhancement in OLR radiation had dissipated.
In summary, temporally, the entire OLR anomaly evolution process preceding the Madoi earthquake, as indicated by LURR changes, experienced a sequence of initial warming, anomaly expansion, peak intensity, anomaly weakening, earthquake occurrence, and anomaly disappearance over a period of 8 days. This sequence corresponds to the evolutionary characteristics of radiation emitted during each phase observed in rock fracture experiments, essentially reflecting the process of stress accumulation in the rock medium to a critical state, post-seismic stress re-distribution, and the subsequent recovery of fault strength. Spatially, the area of enhanced OLR radiation is located to the north of the epicenter, where the temperature changes in the medium are generally proportional to the incremental strain accumulation. The mainshock is situated in a transition zone from a high strain value area to a low strain value area, with the high strain value area located to the north of the epicenter, roughly coinciding with the region of enhanced OLR radiation.
To verify the accuracy and universality of the aforementioned analysis method, the temporal and spatial evolution patterns of LURR and OLR for the Ms6.4 earthquake in Yangbi County, Yunnan Province (N25.67, E99.87) on 21 May 2021, were used for validation. Earthquakes within 300 km of the Yangbi earthquake epicenter (N25.67, E99.87) from 1 January 2013, to 30 June 2021, were selected for calculation. The Benioff strain of earthquakes with magnitudes Ml 0-4.0 in the region when m = 1/2 was scanned and used as the response variable. Multiple loading and unloading cycles were applied in the calculations to prevent strong fluctuations in the load/unload response ratio that might be caused by a small number of earthquakes. In this calculation, the fault friction coefficient of CFS was taken as 0.4, with a window length of 1 month and a step length of 10 days.
Following the aforementioned method and selected data, the calculation results were plotted (Figure 9). It is evident from the figure that within the selected time period, within a 300 km radius of the Yangbi earthquake epicenter, several earthquakes above magnitude five exhibited significant high-value anomalies in LURR before occurring (Figure 9). Taking this Yangbi earthquake as an example, the LURR values gradually increased 6 months before the earthquake, reaching the maximum value half a month before the event, after which the LURR data began to decline, and the Yangbi Ms6.4 earthquake occurred during this decline. Summarizing the process of this earthquake’s occurrence, it was found that the LURR anomaly before this earthquake is consistent with the pre-earthquake LURR anomaly evolution pattern of the Ms7.4 earthquake in Madoi, Qinghai Province. Combining with the high-value anomalies of LURR before the occurrence of five other earthquakes with magnitude Ms5.0 or above in this region, it was found that the time from the high-value anomaly of LURR to the occurrence of the earthquake was no less than 1 month and no more than 15 months (Table 5). Therefore, to more accurately determine the time and location of the earthquake, this paper combines LURR with OLR, and follows the continuous daily changes of OLR after the high value of LURR has declined, in order to more accurately determine the three essential elements of the Yangbi earthquake.
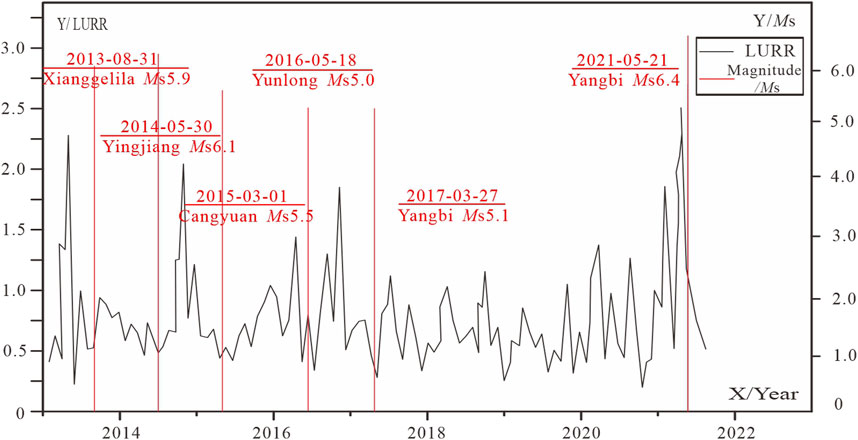
Figure 9. Time series of Yangbi MS6.4 earthquake LURR (2013.01-2021.06).
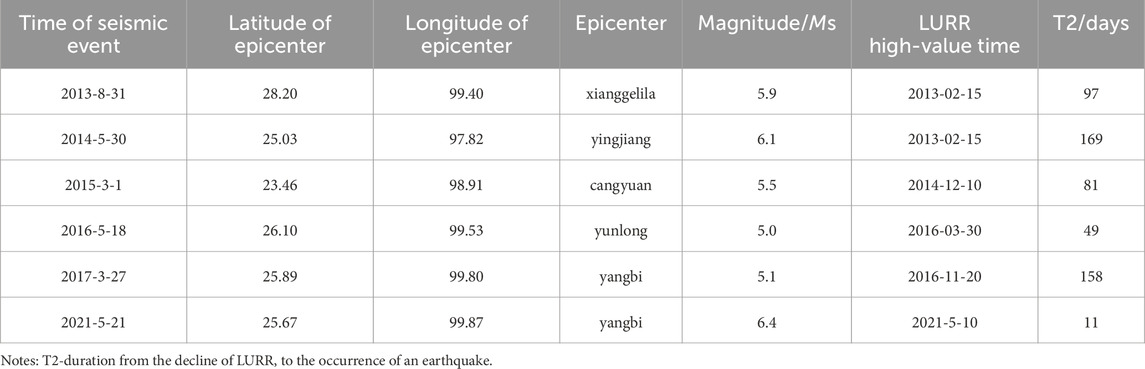
Table 5. Time series table of the Yangbi MS6.4 earthquake within 300 km from the epicenter.
In the specific analysis process, this paper selects a fixed date (10 May 2021) as the reference background for OLR data. The daily, same-time, and same-range ground longwave radiation values during the period from the fixed date to 4 days after the earthquake are subtracted from this background to obtain the continuous daily change images before and after this earthquake. These images serve as the basis for the analysis of the imminent anomalies before this earthquake (Figure 10).
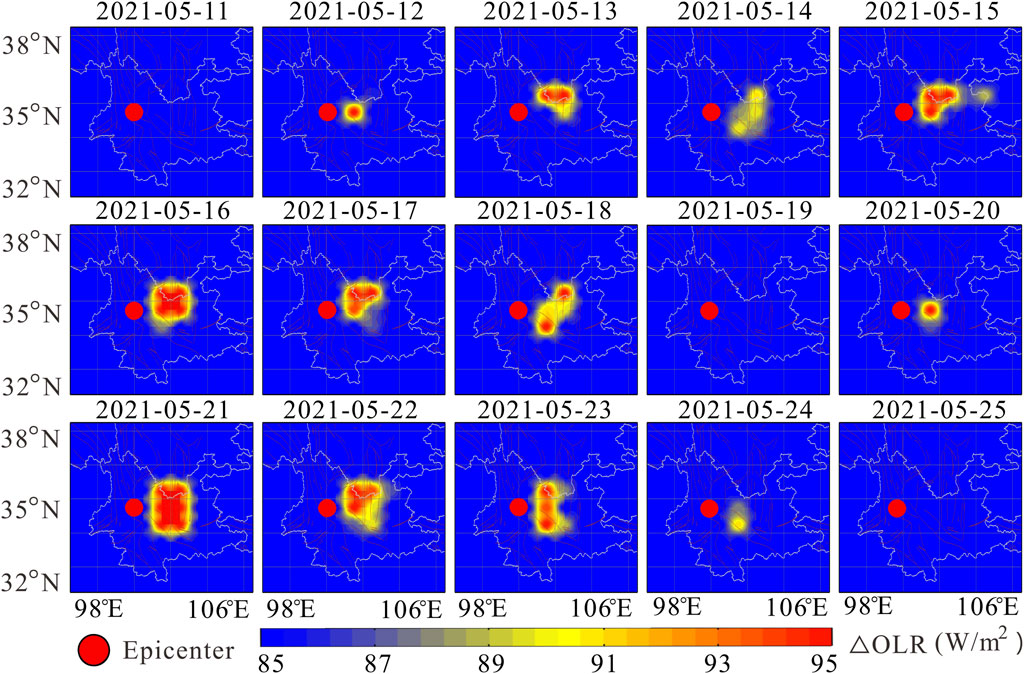
Figure 10. Spatial-temporal evolution of OLR of the Yangbi MS6.4 earthquake (2021.05.11-2021.05.25).
From May 11 to 14, 2021, no significant radiation enhancement was observed in the area near the epicenter. On the 15th, a slight radiation enhancement began in the eastern part of the epicenter, with an increase of up to 10W/m2. On the 16th, the OLR (Outgoing Longwave Radiation) anomaly continued to strengthen and spatially moved towards the epicenter. On the 17th, the OLR began to diminish, reaching its minimum value on the 19th. On the 20th, the OLR values increased again, leading up to the Yangbi Ms6.4 earthquake on the 21st. Influenced by the stress changes on the fault after the earthquake, the OLR anomaly persisted on May 22-23, with the area of the anomaly continuously shrinking, and the anomaly disappeared after the 24th. Summarizing the entire process of the earthquake’s gestation, occurrence, and development, within a relatively short period (from May 11 to May 24), the OLR anomaly went through six phases: initial warming, anomaly expansion, peak intensity, anomaly weakening, earthquake occurrence, and anomaly disappearance. The process of OLR anomaly change is consistent with the characteristics of stress accumulation in the rock medium reaching a critical state, post-seismic stress redistribution, and the recovery of fault strength in rock fracture experiments. It also matches the seismic occurrence pattern of the Ms7.4 earthquake in Madoi, Qinghai Province, as mentioned earlier in the text.
By integrating LURR with the OLR anomaly evolution, the moment of LURR’s high-value decline may provide a physically meaningful indicator of the onset of anomalies for remote sensing earthquake monitoring. This integration also provides a mechanical basis for the evolution of pre-earthquake thermal anomalies. It not only enhances the reliability of selecting OLR background values and reduces the uncertainty in conclusions caused by the randomness of the calculation process but also narrows the spatial range of anomalies, excluding potentially interfering anomalous areas. Furthermore, it improves the temporal resolution of the LURR time series, allowing for a more refined analysis of the anomaly evolution process following the LURR high-value decline, thereby increasing the accuracy of predictions. This approach facilitates a natural transition in timing from medium to short-term forecasting.
6 Conclusion
The findings of this study reveal that 3 months prior to the 2021 Madoi MS7.4 earthquake, there was a significant anomaly in the LURR values, which were based on Benioff strain as the responsive indicator. Notably, a pronounced high-value anomaly was observed. Following the decline of this abnormal peak, a significant short-term OLR anomaly emerged in the northern sector of the epicentral area. A parallel phenomenon was also identified in the 2021 Yangbi MS6.4 earthquake.
The evolution of these anomalies aligns with the process observed in loading experiments, where rock media accumulate stress to a critical threshold, leading to destabilization and eventual rupture. By integrating these two seismic prediction parameters, which possess distinct physical implications, we can more accurately reflect the stress accumulation status in the epicentral region prior to an earthquake. Furthermore, it allows for a more nuanced portrayal of the stress level variations as the fault medium approaches the terminal phase of the yielding process.
This approach enhances our understanding of the temporal and spatial dynamics involved in the gestation, occurrence, and progression of earthquakes. It offers a viable methodology for the study of earthquake prediction, contributing to a more informed and scientific basis for seismic forecasting.
Data availability statement
The raw data supporting the conclusions of this article will be made available by the authors, without undue reservation.
Author contributions
YL: Conceptualization, Formal Analysis, Investigation, Software, Supervision, Writing–review and editing. LJ: Data curation, Methodology, Software, Supervision, Writing–original draft. YC: Data curation, Formal Analysis, Methodology, Writing–original draft. ZH: Conceptualization, Data curation, Methodology, Writing–original draft. HD: Data curation, Formal Analysis, Writing–review and editing. MW: Methodology, Software, Supervision, Writing–review and editing.
Funding
The author(s) declare that financial support was received for the research, authorship, and/or publication of this article. China-ASEAN Earthquake Disaster Monitoring and Defense Capability Improvement Project (No. 123999101), the third batch of Fengyun-3 meteorological satellite projects (No.FY-3(03)-AS-11.10-ZT), General Program of National Natural Science Foundation of China (42474116), the Earthquake Joint Funds of NSFC (Grant No. U2039205), Anhui Provincial Key Research and Development Project (2022m07020002), Spark Program of Earthquake Sciences (XH23021YB), Three Combined Project (3JH-202402004). These funding bodies have had a positive impact on expenses related to data acquisition, data analysis, and participation in academic exchanges.
Acknowledgments
This paper uses NOAA satellite data from the United States.
Conflict of interest
The authors declare that the research was conducted in the absence of any commercial or financial relationships that could be construed as a potential conflict of interest.
Publisher’s note
All claims expressed in this article are solely those of the authors and do not necessarily represent those of their affiliated organizations, or those of the publisher, the editors and the reviewers. Any product that may be evaluated in this article, or claim that may be made by its manufacturer, is not guaranteed or endorsed by the publisher.
References
Brace, W. B., Paulding, J. R., and Scholz, C. H. (1966). Dilatancy in the fracture of crystalline rocks. J. Geophys. Res. 71 (16), 3939–3953. doi:10.1029/jz071i016p03939
Cui, C., Deng, M., and Geng, N. (1993). Spectral radiation characteristics of rocks under different pressures. Chin. Sci. Bull. 38 (6), 538–541. (in Chinese). doi:10.1360/csb1993-38-6-538
Gorny, V. I. (1988). The earth outgoing IR radiation as an indicator of seismic activity. Proc. Acad. Sci. USSR 301 (1), 67–69.
Li, C., and Nordlund, E. (1993). Experimental verification of the Kaiser effect in rocks. Rock Mech. Rock Eng. 26 (4), 333–351. doi:10.1007/bf01027116
Lisi, M., Filizzola, C., Genzano, N., Grimaldi, C. S. L., Lacava, T., Marchese, F., et al. (2010). A study on the Abruzzo 6 April 2009 earthquake by applying the RST approach to 15 years of AVHRR TIR observations. Nat. Hazards Earth Syst. Sci. 10 (2), 395–406. doi:10.5194/nhess-10-395-2010
Liu, Y., and Yin, X. C. (2017). A dimensional analysis method for improved load-unload response ratio. Pure Appl. Geophys. 175 (Suppl. l), 633–645. doi:10.1007/s00024-017-1716-6
Liu, Y., Yin, X. C., and Yuan, S. (2012). Exploration study of dimension analysis applying to earthquake prediction. Chin. J. Geophys. 55 (9), 3043–3050. doi:10.6038/j.issn.0001-5733.2012.09.022
Ma, J., Sisherman, M., and Guo, Y. (2012). Identification of pre-earthquake sub-instability stress state-taking the evolution of temperature field of 5 ° bend fault as an example. Earth Sci. 42 (5), 633–645. (in Chinese).
Mogi, K. (1984). “Fundamental studies on earthquake prediction,” in A collection of papers of international symposium on continental seismicity and earthquake prediction (ISCSEP). Beijing: Seismological Press, 619–652.
Ouzounov, D., and Freund, F. (2004). Mid-infrared emission prior to strong earthquakes analyzed by remote sensing data. Adv. Space Res. 33 (3), 268–273. doi:10.1016/s0273-1177(03)00486-1
Qiang, Z., Kong, L., Guo, M., Wang, Y., Zheng, L., Lin, C., et al. (1997). Experimental study of satellite thermal infrared warming mechanism. Acta Seismol. Sin. 19 (2), 197–201. (in Chinese).
Saraf, A. K., Rawat, V., Banerjee, P., Choudhury, S., Panda, S. K., Dasgupta, S., et al. (2008). Satellite detection of earthquake thermal infrared precursors in Iran. Nat. Hazards 47 (1), 119–135. doi:10.1007/s11069-007-9201-7
Scholz, C. H., Sykes, L. R., and Aggarwal, Y. P. (1973). Earthquake prediction: a physical basis. Science 181, 803–810. doi:10.1126/science.181.4102.803
Tramutoli, V. (2007). “Robust satellite techniques (RST) for natural and environmental hazards monitoring and mitigation: theory and applications,” in 2007 International Workshop on the Analysis of Multi-Temporal Remote Sensing Images. IEEE, 1–6. doi:10.1109/MULTITEMP.2007.4293057
Wu, L., Liu, S., Wu, Y., and Li, Y. (2004). Thermal infrared radiation law of discontinuous combination fault rupture and its significance of tectonic earthquake precursor. Chin. J. Rock Mech. Eng. 23 (1), 24–30. (in Chinese).
Wu, L. X., Liu, S. J., Wu, Y., and Wang, C. (2006). Precursors for rock fracturing and failure—part I: IRR image abnormalities. Int. J. Rock Mech. Min. Sci. 43 (3), 473–482. doi:10.1016/j.ijrmms.2005.09.002
Xu, X., Qiang, Z., and Lin, C. (1990). Sudden ground warming and impending earthquake precursor. Seismol. Geol. 12 (3), 243–249. (in Chinese).
Yang, Y. Z., and Guo, G. M. (2010). Studying the thermal anomaly before the Zhangbei earthquake with MTSAT and meteorological data. Int. J. Remote Sens. 31 (11), 2783–2791. doi:10.1080/01431160903095478
Yin, X. C., Chen, X., Song, Z., and Yin, C. (1995). A new approach to earthquake prediction: the Load/Unload Response Ratio (LURR) Theory. Pure Appl. Geophys. 145, 701–715. doi:10.1007/978-3-0348-9065-6_17
Yin, X. C., Wang, Y. C., Peng, K., Bai, Y. L., Wang, H., and Yin, X. F. (2000). Development of a new approach to earthquake prediction: load/unload response ratio (LURR) theory. Pure Appl. Geophys. 157, 2365–2383. doi:10.1007/978-3-0348-7695-7_29
Yin, X. C., Zhang, L. P., Zhang, Y. X., Peng, K. Y., Wang, H. T., Song, Z. P., et al. (2008). The newest developments of load-unload response ratio (LURR). Pure Appl. Geophys. 165, 711–722. doi:10.1007/s00024-008-0314-z
Yu, C., Cui, J., Zhang, W., Ma, W., Ren, J., Su, B., et al. (2023). Quasi-synchronous variations in the OLR of NOAA and ionospheric Ne of CSES of three earthquakes in xinjiang, january 2020. Atmosphere 14 (12), 1828. doi:10.3390/atmos14121828
Yu, H., Yu, C., Ma, Z., Zhang, X., Zhang, H., Yao, Q., et al. (2020). Temporal and spatial evolution of load/unload response ratio before the M 7.0 Jiuzhaigou Earthquake of Aug. 8, 2017 in Sichuan province. Pure Appl. Geophys. 177, 321–331. doi:10.1007/s00024-019-02101-x
Yu, H., Yuan, Z., Yu, C., Zhang, X., Gao, R., Chang, Y., et al. (2022). The medium-to-short-term earthquake predictions in China and their evaluations based on the R-score. Seismol. Soc. Am. 93 (2A), 840–852. doi:10.1785/0220210081
Yu, H. Z., Shen, Z. K., Wan, Y. G., Zhu, Q. y., and Yin, X. c. (2006). Increasing critical sensitivity of the Load/Unload Response Ratio before large earthquakes with identified stress accumulation pattern. Tectonophysics 428 (1), 87–94. doi:10.1016/j.tecto.2006.09.006
Yu, H. Z., Zhou, F. R., Cheng, J., and Wan, Y. G. (2015). The sensitivity of load/unload response ratio and critical region selection before large earthquakes. Pure Appl. Geophys. 172, 173–183. doi:10.1007/s00024-014-0903-y
Yu, H. Z., and Zhu, Q. Y. (2010). A probabilistic approach for earthquake potential evaluation based on the load/unload response ratio method. Concurrency Comput. Pract. Exp. 22 (12), 1520–1533. doi:10.1002/cpe.1509
Zakupin, A. S., Bogomolov, L. M., and Boginskaya, N. V. (2021). Using the load/unload response ratio and self-developing processes methods of analyzing seismic sequences to predict earthquakes in sakhalin. Izvestiya, Atmos. Ocean. Phys. 56 (7), 693–705. doi:10.1134/s0001433820070105
Keywords: LURR, OLR, NOAA, Madoi earthquake, stress state
Citation: Lei Y, Jianyong L, Chen Y, Haizhen Z, Dequan H and Weiyu M (2024) Determination of stress state based on coupling characteristics of load/unload response ratio and outgoing longwave radiation before large earthquakes. Front. Earth Sci. 12:1433395. doi: 10.3389/feart.2024.1433395
Received: 15 May 2024; Accepted: 28 August 2024;
Published: 11 September 2024.
Edited by:
Giovanni Martinelli, National Institute of Geophysics and Volcanology, ItalyReviewed by:
Vincenzo Lapenna, National Research Council (CNR), ItalyMita Uthaman, Indian Institute of Technology Kharagpur, India
Copyright © 2024 Lei, Jianyong, Chen, Haizhen, Dequan and Weiyu. This is an open-access article distributed under the terms of the Creative Commons Attribution License (CC BY). The use, distribution or reproduction in other forums is permitted, provided the original author(s) and the copyright owner(s) are credited and that the original publication in this journal is cited, in accordance with accepted academic practice. No use, distribution or reproduction is permitted which does not comply with these terms.
*Correspondence: Li Jianyong, anlsaUBzZWlzLmFjLmNu; Yu Chen, eXVjaGVuQHNlaXMuYWMuY24=