 Yifan Tian
 Alexander Grigorievich Palaev
94% of researchers rate our articles as excellent or good
Learn more about the work of our research integrity team to safeguard the quality of each article we publish.
Find out more
ORIGINAL RESEARCH article
Front. Earth Sci., 05 July 2024
Sec. Solid Earth Geophysics
Volume 12 - 2024 | https://doi.org/10.3389/feart.2024.1432043
This article is part of the Research TopicAdvanced Materials and Technologies for Sustainable Development of Underground ResourcesView all 44 articles
Pipeline transportation is the main means of transportation of oil, natural gas and other energy sources. During transportation, corrosive substances in oil and natural gas can cause damage to the pipeline structure. A non-destructive testing technology for pipeline corrosion based on electromagnetic ultrasound technology was proposed to improve the stability and safety of energy pipeline transportation systems. This technology utilized empirical mode decomposition and singular spectrum analysis to denoise electromagnetic ultrasound signals. The designed electromagnetic signal denoising algorithm completely removed mild noise pollution. When using this method to detect pipeline corrosion, the maximum calculation error of pipeline wall thickness was 0.1906 mm, and the lowest was 0.0015 mm. When detecting small area corrosion deficiency, the amplitude of the detection signal increased with the depth, up to a maximum of around 24 V, which accurately reflected small area defects. This non-destructive testing technology for pipelines can effectively detect the pipeline corrosion, which is helpful for the regular maintenance of pipeline energy transmission systems.
Pipelines have the characteristics of low cost and high convenience in transporting energy such as natural gas and oil, making them the main mode of energy transportation (Sampath et al., 2021). Oil and natural gas energy pipelines are mostly made of alloys or plastics, Natural gas and oil contain a large amount of substances such as carbon dioxide and hydrogen sulfide, which can mix or react during transportation, causing corrosion to the inner walls of pipelines (Marinina et al., 2022). Pipeline corrosion is a major threat to the safe operation of pipelines. There are various forms of corrosion defects, including localized pitting, which refers to strong corrosion in small areas of the material surface (Islamov et al., 2019). Sedimentary corrosion is caused by sediment coverage (Litvinenko et al., 2022b). Large area corrosion refers to uniform corrosion that covers a large surface area (Da et al., 2020). The accumulation of corrosion on the inner wall of pipelines can lead to a decrease in wall thickness and strength. This may ultimately lead to pipeline leakage or rupture, causing serious economic losses, or causing serious environmental damage (Litvinenko et al., 2022a). Therefore, it is crucial to regularly inspect and maintain the inner walls of pipelines. Non-destructive testing technology can complete regular inspections of corrosion on the inner walls of pipelines (Karyakina et al., 2021). Electromagnetic ultrasonic non-destructive testing is a commonly used non-destructive testing technique that is sensitive to various defects in the detection target (Pryakhin and Azarov, 2024). However, this technology has low conversion efficiency during the detection process and is susceptible to interference, resulting in significant errors in the detection results (Fetisov et al., 2023). Therefore, a noise suppression algorithm and different defect feature recognition algorithm for electromagnetic ultrasonic non-destructive testing are designed. Improvements are made to improve the detection accuracy of electromagnetic ultrasonic non-destructive testing (EUT) technology.
Non-destructive testing technology is widely applied in many fields (Lucas et al., 2022). Olisa et al. proposed a non-destructive evaluation method based on guided wave ultrasonic testing to investigate the impact of composite damage on metal structures. Guided wave ultrasonic testing had the ability to remotely detect metal damage. However, parameter characteristics were influenced by structure and environment (Ren et al., 2022). The existing research had not fully explored the correlation between composite damage and guided wave ultrasonic detection parameter characteristics, and further research was needed (Olisa et al., 2021). Garcia Marquez and Gomez Munoz proposed a new method based on cross-correlation and wavelet transform to detect delamination faults in wind turbine blades. This experiment was conducted on real blades, using ultrasonic guided waves to analyze faulty and non-faulty blades. This method effectively identified signal energy mutations and locate faults (Garcia Marquez and Gomez Munoz, 2020). Chabot et al. proposed a multi-sensor monitoring method based on phased array ultrasonic detection technology. This overcame the challenge of lack of structural health control in direct energy deposition processes in additive manufacturing. Phased array ultrasonic testing could detect defects in directly deposited energy manufactured components online and quantitatively predict their size (Safiullin and Tian, 2023). This detection method opened the way for in-situ control of direct energy deposition (Chabot et al., 2020). Gupta et al. further explored the application and advantages of non-destructive testing technology in various industries. They conducted an investigation and analysis of various commonly used non-destructive testing technologies. Most non-destructive testing techniques could be used not only for structural integrity testing, but also for quality analysis and casting process improvement (Gupta et al., 2022). Chen et al. proposed a method using nonlinear ultrasonic testing technology to accurately measure fatigue cracks. Traditional C-scan imaging reduced accuracy when crack directionality was poor or gaps were narrow. However, finite amplitude nonlinear ultrasonic testing was sensitive to micro damage at the optimal voltage and was not affected by macroscopic crack states, which effectively tested fatigue damage (Chen et al., 2020).
Pipeline transportation is currently the mainstream way of transporting various types of energy (Korobov and Podoprigora, 2019). How to improve the quality and service life of pipelines is also the main research direction of pipeline transportation at present. Parlak et al. investigated and analyzed intelligent cleaning devices used for steel pipelines to ensure the safety and integrity of oil and gas pipelines. They classified and discussed its working principle and application. They studied multiple sensor technologies and compared their accuracy in anomaly detection. Intelligent pipeline cleaners not only maintained pipeline safety, but also had environmental benefits (Parlak and Yavasoglu, 2023). Karkoub et al. proposed a new method for pipeline detection using small mobile robots and a reflective omnidirectional vision system to reduce maintenance costs for oil and gas pipelines. The system parameters were optimized using simulated annealing optimization method, proving the feasibility of this technology. This robot system could be used for pre-scanning, reducing the need for expensive tools, thereby reducing inspection time and cost (Karkoub et al., 2020). Ma et al. explored non-destructive testing methods to ensure the safe operation of pipelines in energy transportation. They compared the advantages and disadvantages of non-destructive testing technology and non-cleaning robot detection systems. In addition, the application of data models and management in defect quantification, classification, fault prediction, and maintenance was studied. These results revealed the importance and development trend of non-destructive testing technology in pipeline maintenance (Ma et al., 2021). Daniyan et al. designed a robot inspection system for non-destructive testing of pipelines to improve pipeline quality and reduce pipeline obsolescence caused by cracks, corrosion, and other factors. The inspection robot used ultrasonic detection technology and color perception to inspect pipelines. This robot could not only determine the corrosion situation of pipelines, but also detect the occurrence and growth of cracks in pipelines (Daniyan et al., 2022). Elankavi et al. developed pipeline inspection robots and classified them based on their movement types. This overcame the inconvenience of manual intervention in the internal repair and maintenance of pipelines. By designing and validating different models, their performance was compared. These different types of robots had different functions in pipeline internal maintenance, providing important insights for selection, development, and research (Elankavi et al., 2020). Wang et al. proposed a new type of transducer that generates spiral Lamb waves in pipelines to study the mechanism of transducer action in electromagnetic ultrasonic testing, and established a finite element model to simulate the wave generation and propagation of the transducer. The results show that existing transducers with winding coils are not suitable for generating spiral waves (Wang et al., 2020). In order to solve the problems of poor accuracy and high noise in electromagnetic ultrasonic testing technology in pipeline inspection, Li et al. designed a pipeline crack quantitative detection device consisting of three uniformly distributed probes on the circumference. The results showed that the positioning error of the crack was less than 6.75%. Based on the characteristic coefficient method, the quantitative error of crack size is less than 8.75% (Li et al., 2022).
In summary, the inner wall of the pipeline will come into direct contact with the conveyed content. Corrosion or damage can easily occur under the impact of conveyed content, leading to leakage and loss of conveyed content. Regular inspection and maintenance of the inner wall of pipelines can effectively improve their service life and prevent losses in a timely manner. However, the inner wall of the pipeline cannot be directly inspected. Non-destructive testing technology can complete the detection of targets without causing damage. Therefore, this study proposes to use ultrasonic testing technology to detect and analyze the corrosion of the inner wall of pipelines.
The innovation of this study lies in the design of a signal denoising method based on Empirical Mode Decomposition (EMD) and Singular Spectrum Analysis (SSA) to denoise EUT signals. This study also proposes a defect signal feature extraction algorithm based on signal envelope, which further improves the detection accuracy of EUT. The main contribution of this study is to design a new signal denoising method and a signal feature extraction method for processing detection signals. This improves the target of EUT detection accuracy and enhances the stability and safety of energy transportation.
The research on pipeline inner wall corrosion defect detection technology based on EUT includes two parts. Section 1 is the study of EUT from signal preprocessing and noise cancellation. Section 2 is the study of EUT based on defect signal feature recognition and extraction.
EUT combines the principles of electromagnetics and ultrasound to detect defects, foreign objects, or other structural issues in materials. This technology applies electromagnetic fields to the tested material during detection and uses ultrasound to detect changes in the internal structure of the target for structural detection (Deepak et al., 2021; Nikolaev et al., 2018). The ultrasonic excitation force mechanism of this method in detection will change according to the material of the detection target. The mechanism of electromagnetic ultrasonic excitation force includes Lorentz force, magnetization force, and magnetostrictive force (Fetisov, 2024). Oil and natural gas transmission pipelines are iron pipelines made of ferromagnetic materials. The mechanisms of ultrasonic excitation in these materials include Lorentz force, magnetization force, and magnetostrictive force. Figure 1 shows the detection principle.
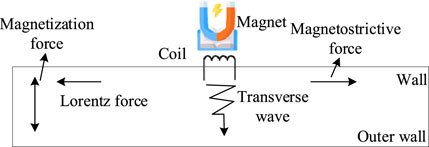
Figure 1. Principle of electromagnetic ultrasonic detection of pipeline inner wall.
During EUT, the permanent magnet will generate a bias magnetic field around it. This magnetic field will interact with the excitation coil to generate an alternating magnetic field. The particles on the pipe wall will begin to vibrate and form ultrasonic waves. The echo signal is the key signal for EUT to achieve non-destructive testing. However, the echo signal is susceptible to various types of pollution interference, resulting in a significant decrease in detection accuracy. EMD is a time series data processing technique used for analyzing nonlinear and non-stationary signals (Zhou et al., 2021). This technology can segment complex echo signal data into a series of intrinsic mode functions. The number of extremes and zeros in all intrinsic mode function signals is basically the same, with a difference of no more than 1. At any position of the intrinsic mode function signal, the mean of the maximum and minimum envelope lines of the signal is 0. Figure 2 shows the EMD steps.
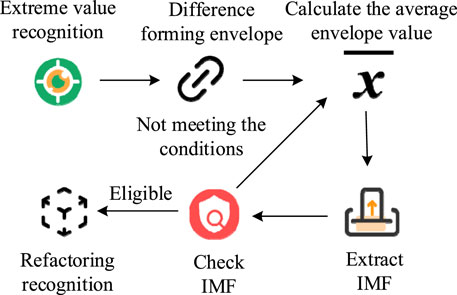
Figure 2. The empirical mode decomposition and the echo signal processing.
The steps for processing electromagnetic ultrasound detection echo signals using EMD are as follows: Firstly, signal preprocessing. Necessary preprocessing is performed on the collected electromagnetic ultrasound detection echo signals, such as filtering to remove noise (Shi et al., 2023a; Shi et al., 2023b; Shi et al., 2023c). Secondly, EMD decomposition involves inputting the preprocessed signal into the EMD algorithm and iteratively decomposing the signal into several IMFs and residual signals (Wu et al., 2020; Wu et al., 2022; Wu et al., 2024; Zheng et al., 2024). Each IMF represents an inherent oscillation mode of the signal. Thirdly, screen IMFs, analyze the obtained IMFs, identify which ones contain useful signal features, and which ones may contain noise or irrelevant information. Fourthly, signal reconstruction can selectively reconstruct certain IMFs as needed to obtain signals that remove noise or highlight specific features. Fifth, post-processing, further processing of the reconstructed signal, such as wavelet transform denoising, feature extraction, etc., to meet specific analysis needs. Fifth, result analysis: Analyze the processed signal, extract useful information such as defect size, position, etc., and provide explanations (Towsyfyan et al., 2020; Stroykov et al., 2021). This study assumes that the original signal is
In Eq. 1,
In Eq. 2,
In Eq. 3,
In Eq. 4,
In Eq. 5,
In Eq. 6,
After filtering and reconstructing the signal using EMD, it is not possible to completely eliminate the noise in the original signal. SSA is a non-parametric statistical method used for analyzing time series data. This method can effectively extract trends, periodic components, noise, etc. from time series. SSA also has good processing ability for non-stationary and nonlinear data. Figure 3 shows the basic process of SSA (Nikolaev and Zaripova, 2021).
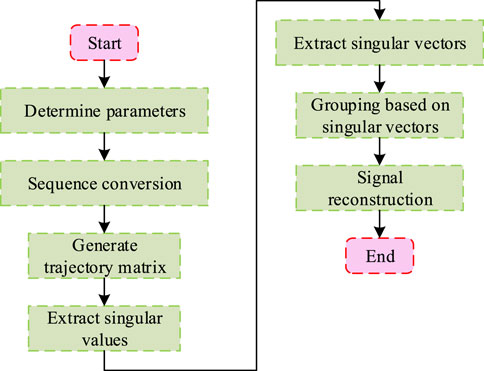
Figure 3. Analysis of the signal singular spectrum detected by electromagnetic ultrasound.
When performing SSA on EUT signals, it is necessary to first convert the original sequence into a trajectory matrix. When embedding the original sequence of ultrasound detection signals, it is necessary to first decompose the original sequence number
In Eq. 7,
In Eq. 8,
Then, matrix
After completing singular value decomposition on the original sequence, grouping can begin. Grouping is the process of dividing the trajectory matrix into
In Eq. 11,
In Eq. 12,
In Eq. 13,
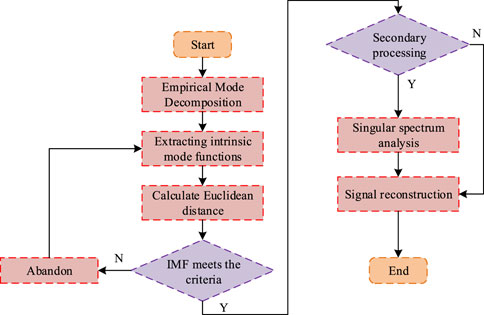
Figure 4. Research on signal noise reduction treatment based on empirical mode decomposition and singular spectrum analysis.
When using this technology to process EUT signals, it is necessary to first use EMD to decompose the original signal. Intrinsic mode components are extracted and qualified intrinsic mode function components are selected for SSA, further eliminating small noise in the original signal. After secondary noise reduction processing, the intrinsic mode function component signal can be reconstructed.
After denoising the electromagnetic ultrasonic signal, the changes in ultrasonic waveform under different degrees of corrosion can be analyzed. Corresponding features can be extracted, and the corrosion situation of pipelines can be determined. Pipeline corrosion is usually divided into large area and small area corrosion based on the corrosion area. The changes in ultrasonic waveform under different corrosion areas are inconsistent. Figure 5 shows the specific changes.
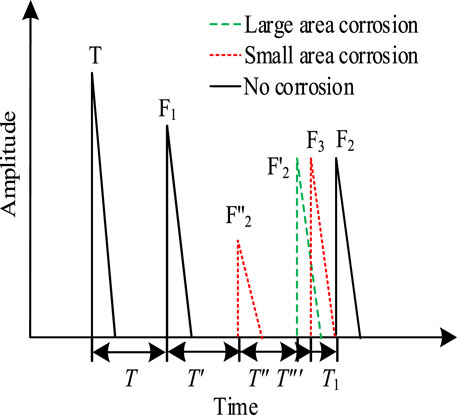
Figure 5. Detection of pipeline corrosion and waveform change.
In Figure 5,
In Eq. 14,
In Eq. 15,
The experimental results analysis of non-destructive testing technology for corrosion defects on pipeline inner walls includes three parts. Firstly, an experimental platform for detecting corrosion defects on the inner wall of pipelines was established. Secondly, the feasibility of signal denoising processing technology was verified. Finally, the effectiveness of pipeline corrosion detection was analyzed.
In this study, MATLAB was used to analyze the performance of the model noise reduction algorithm, and to analyze the treatment effect of different degrees of noise pollution. During the experimental verification of the pipeline inner wall corrosion defect detection technology, three experimental scenarios are designed. The first is used for the simulation detection of large area corrosion defects, the second is used for the simulation detection of small area corrosion defects, and the third is the actual detection of the pipeline inner wall. In the detection of large area corrosion defect, RAM-5000-SNAP device was used for ultrasonic excitation and reception. In the detection of small area corrosion defect, RAM-4000-SNAP device was used for the experiment, and the actual detection of the pipeline is the detection device in the pipeline. The experimental devices of the three experiments are shown in Figure 6.
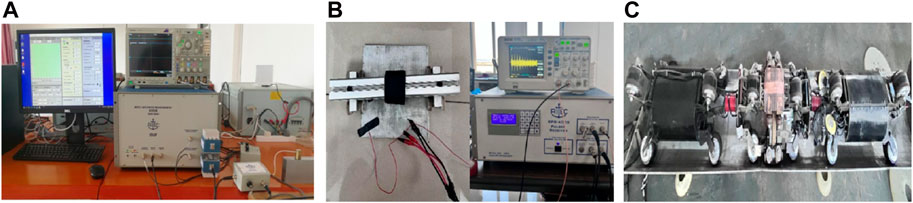
Figure 6. Experimental platform and experimental setup. (A) Large area defect detection. (B) Small area defect detection. (C) Actual pipeline detection device.
Figure 6A is a large area corrosion defect detection device, including load ohm, oscilloscope, amplifier and impedance matching equipment. Figure 6B is the actual detection device of the pipeline, which consists of three parts, including the driving section on both sides and the detection section of the intermediate part. Figure 6C shows the in-line detector.
Wavelet Soft Threshold (WST) and Wavelet Hard Threshold (WDT) are two common techniques for denoising ultrasound signals. To verify the feasibility of the EMD-SSAEUT signal denoising algorithm designed, MATLAB was used as the experimental platform to compare and analyze the denoising processing effects of the three methods mentioned above. Figure 7 shows the signal processing effects of three methods.
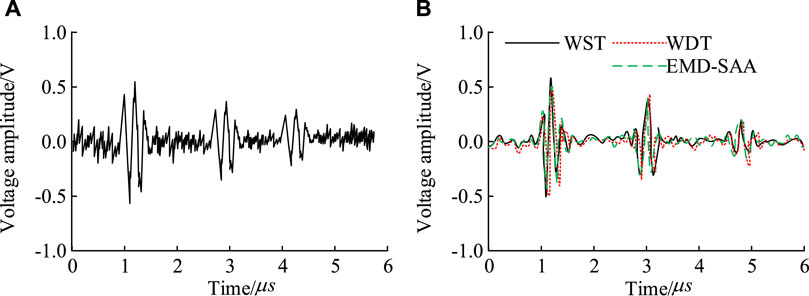
Figure 7. Comparison of the noise signal processing effect. (A) Original noise signal. (B) Signal after noise reduction.
Figure 7A shows the original noise signal. Figure 7B shows the signal processed by WST. Figure 7 shows the signal processed by WDT. Figure 7 shows the signal processed by EMD-SSA. After WST processing, the fluctuation amplitude of the original noise signal was significantly reduced. However, there were still significant fluctuations in the stable signal region. The processing effect of WDT method was worse than that of WST. The fluctuation in stable areas was more significant. After being processed by EMD-SSA, the original noise signal still had a certain noise interference at the signal’s stable point. To further verify the signal denoising effect of EMD-SSA, the Signal-to-noise Ratio (SNR) and Mean Squared Error (MSE) processed by three processing methods were compared in Figure 8.

Figure 8. SNR and MSE comparison results. (A) SNR comparison results. (B) MSE comparison results.
Figure 8A shows the SNR comparison results of three processing methods. As the SNR of the original signal increased, the SNR of the denoised signal also gradually increased. When the original SNR was 0, the SNR of the signal processed by WST was about 5 dB. The SNR processed by WDT and WST was consistent. The SNR after EMD-SSA processing was approximately 12 dB. When the original SNR increased to 20 dB, the SNR after WST processing was about 17 dB, the SNR after WDT processing was about 23 dB, and the SNR after EMD-SSA processing was about 30 dB. Figure 8B shows the MSE comparison results of three processing methods. With the increase of MSE, the MSE processed by these three processing methods was also increasing. The MSE after EMD-SSA treatment was consistently lower than the other two methods. When the initial MSE was 0.005 dB, the MSE after EMD-SSA processing was about 0.5 dB, while the MSE after WST and WDT processing are both above 1.0 dB. When the initial MSE was 0.007 dB, the MSE after WST and WDT processing was basically the same. The MSE after EMD-SSA treatment was much lower than that after WST and WDT treatment.
In the detection of large-scale corrosion defects, firstly, this study compared the effectiveness of this noise reduction method on different noises under the same parameters. Figure 9 shows the processing effect of mild noise.
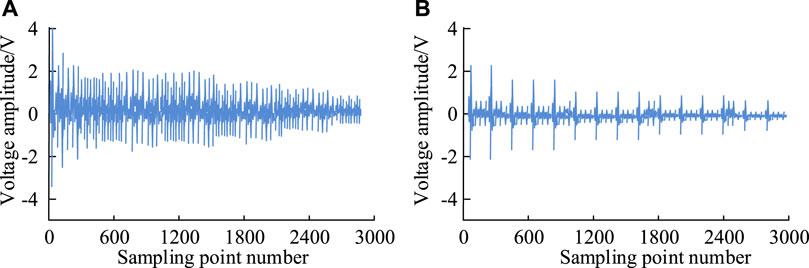
Figure 9. Treatment effect of light noise pollution. (A) Mild noise pollution signal. (B) Mild noise pollution signal after processing.
Figure 9A shows the original noise signal with mild pollution. The voltage amplitude of the original noise signal reached 4 V. The amplitude fluctuation of the original noise signal was irregular, and the signal was relatively chaotic, but the signal extremum could still be observed. Figure 9B shows the noise signal after EMD-SSA processing. After EMD-SSA processing, there was a very clear pattern of signal fluctuations. There were three significant peaks in a sampling length of 600. EMD-SSA effectively removed mild noise pollution. Figure 10 shows the treatment effect of moderate pollution.
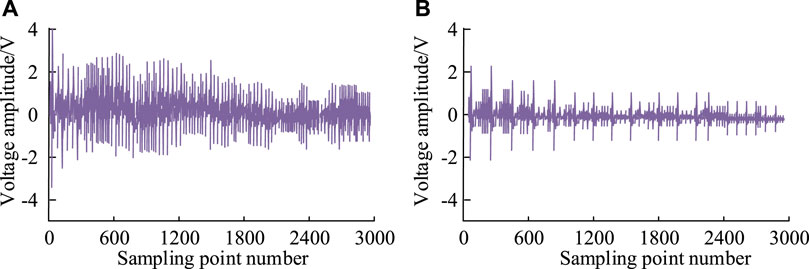
Figure 10. Treatment effect of mild noise pollution. (A) Mild noise pollution signal. (B) Mild noise pollution signal after treatment.
Figure 10A shows the raw noise signal with mild noise pollution. The original noise signal had no pattern. The effective signal band was basically completely covered, and the magnitude of the extreme value of the effective signal could not be determined. Figure 10B shows the signal after EMD-SSA denoising processing. After denoising, the effective signal bands were completely separated. However, the amplitude of the effective signal band was also significantly reduced. Figure 11 shows the treatment effect of severe noise pollution.
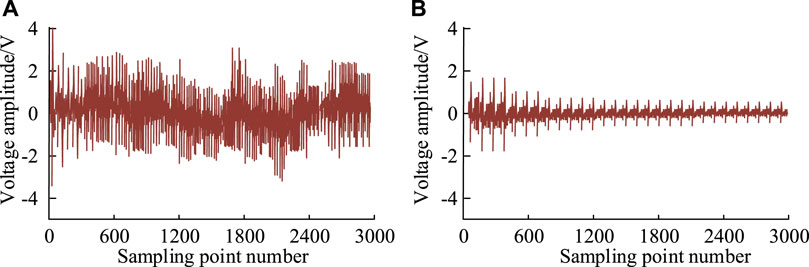
Figure 11. Treatment effect of severe noise pollution. (A) Severe noise pollution signal. (B) Severe noise pollution signal after treatment.
Figure 11A shows the original noise signal with severe noise pollution. The effective band and noise signal in the original noise signal completely covered each other, making it difficult to distinguish them. Figure 11B shows the signal after EMD-SSA denoising processing. EMD-SSA can remove most of the noise in severe noise pollution, completely distinguishing the effective band from the noise signal. However, the noise removal effect near the effective band was poor, and significant noise phenomena could still be observed.
This study also compared the signal processing effects of large-area corrosion defects under different thicknesses of steel plates in Table 1.
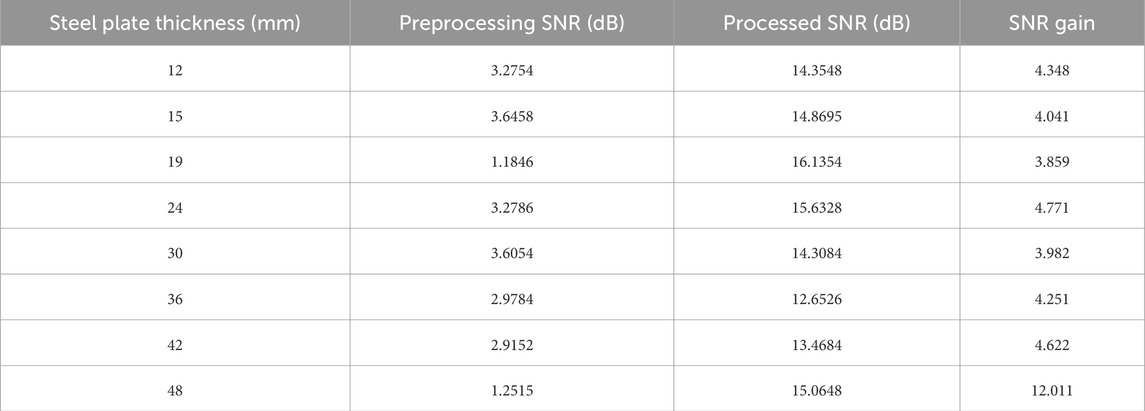
Table 1. Treatment effect of large-area corrosion defects of different thickness steel plates.
In Table 1, when the thickness of the steel plate was 19 mm, the SNR after signal processing reaches the highest value of 16.1354 dB. The SNR gain at this time was 3.859. The SNR of the signal at this thickness was also the lowest before denoising, only 1.1846 dB. When the thickness of the steel plate was 48 mm, the SNR gain after signal denoising was the highest, reaching 12.011. At this point, the SNR of the signal before denoising was 1.2515 dB. The SNR after signal denoising was 15.0648 dB. When the thickness of the steel plate was 36 mm, the SNR after signal denoising was the lowest, only 12.6526 dB. The SNR before signal denoising at this thickness was 2.9784 dB, and the SNR gain was 4.251. This study also compared the pipeline thickness values calculated from the processed signals in Table 2.
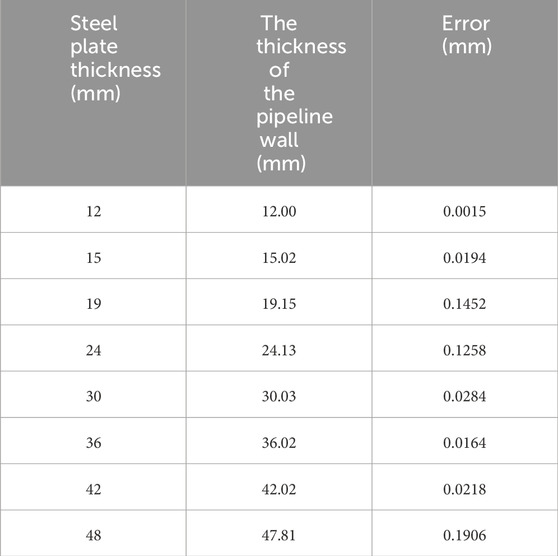
Table 2. Pipeline wall thickness calculation results and actual results of the denoised signal.
In Table 2, when the pipe wall thickness was 48 mm, the error between the calculated pipe wall thickness and the actual thickness based on the processed signal was the highest, reaching 0.1906 mm. When the wall thickness was 12 mm, the calculated wall thickness based on the processed signal had the smallest error with the actual thickness, only 0.0015 mm. Among the 8 different thicknesses of pipe walls, only three thicknesses had a calculation error greater than 0.1000 mm. When the thickness of the pipe wall was 19 mm, the calculation error was 0.1452 mm. When the thickness of the pipe wall was 24 mm, the calculation error was 0.1258 mm. Figure 12 shows the time-domain envelope spectrum and energy spectrum changes when there is a small area of corrosion defect.
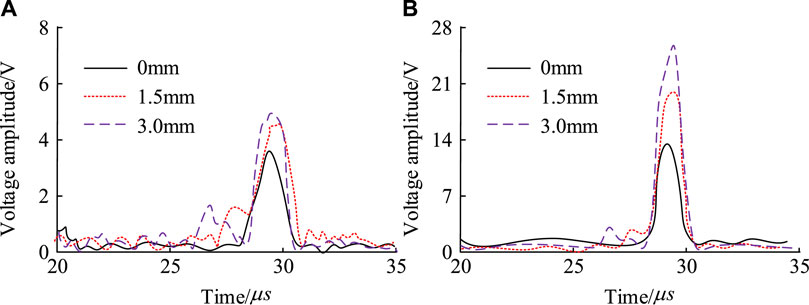
Figure 12. Time-domain envelope spectrum and energy spectrum changes of small-area defects. (A) Time domain envelope spectrum variation. (B) Changes in energy spectrum.
Figure 12A shows the variation of the time-domain envelope spectrum of small area defects. As the depth of the defect increased, the fluctuation and amplitude of the time-domain envelope spectrum gradually increased. When the defect depth was 1.5 mm, the amplitude was about 4.5 V. When the defect depth was 3.0 mm, the voltage amplitude was about 5.2 mm. Figure 12B shows the energy spectrum of small area defects. As the defect increased, the signal energy value also continued to increase. When there was no defect, the energy was about 14. After the defect depth increased to 3.0 mm, the energy value rose to about 25. Table 3 shows the pipeline’s actual inspection results.
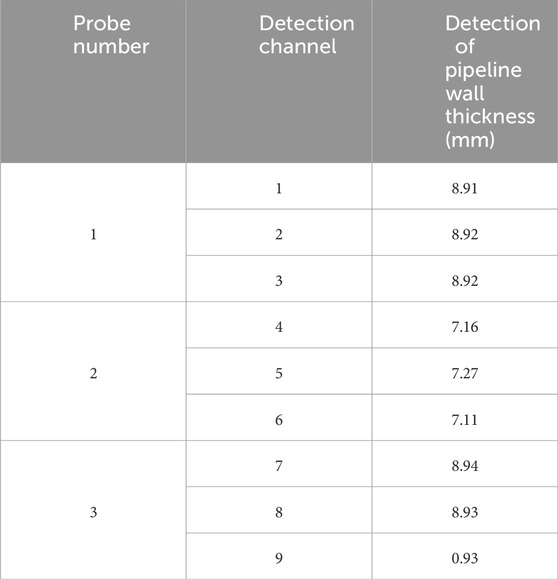
Table 3. Test results of the pipeline detection device.
In Table 3, the calculation results of the wall thickness of the detection pipeline for probes 1 and 3 were basically consistent, indicating that there were no corrosion defects on the wall of probes 1 and 3. In the detection channel of probe 2, the thickness of the detection tube wall was about 7.0 mm, which was significantly lower than the 9.0 mm thickness at probes 1 and 3. There was severe corrosion on the pipe wall at probe 2 of the detection device. By detecting the axial and circumferential positions of the device, the location of pipeline corrosion defects could be determined.
A pipeline corrosion detection technology based on electromagnetic ultrasonic non-destructive testing technology has been studied and designed. This can improve the stability of the energy delivery system and reduce the paralysis of the pipeline energy delivery system caused by pipeline corrosion and damage. This study utilized EMD and SSA to denoise EUT signals and improve the accuracy of EUT in pipeline corrosion detection. When the initial MSE was 0.005 dB, the MSE after EMD-SSA processing was about 0.5 dB, while the MSE after WST and WDT processing were both above 1.0 dB. The EMD-SSA signal denoising method effectively removed mild noise pollution, completely separating the effective signal band from noise pollution. When the thickness of the pipe wall was 19 mm, the SNR difference before and after processing of the electromagnetic ultrasound signal was the largest, increasing by a total of 14.9508 dB. When the thickness of the pipe wall was 48 mm, the error between the calculated pipe wall thickness and the actual thickness based on the processed signal was the highest, reaching 0.1906 mm. When the wall thickness was 12 mm, the calculated wall thickness based on the processed signal had the smallest error with the actual thickness, only 0.0015 mm. As the depth of small area defects increased, the signal amplitude gradually increased. When there were no defects, the maximum amplitude was only about 14 V. When the defect depth increased to 3.0 mm, the amplitude increased to above 20 V. The research and design of a pipeline corrosion defect detection technology based on electromagnetic ultrasonic non-destructive testing technology can accurately locate the location of corrosion defects in pipelines and determine the degree of corrosion when the pipe wall thickness is less than 48 mm. The design results of the study contribute to improving the transportation safety of energy sources such as oil and gas. The EUT signal denoising technology designed can effectively eliminate noise interference in pipeline detection. However, the signal denoising method designed has a poor denoising effect on severe noise pollution, resulting in the loss of effective signals. In the future, the noise resistance of electromagnetic ultrasonic pipeline non-destructive testing technology can be further improved to increase the corrosion detection accuracy of pipeline non-destructive testing technology.
The raw data supporting the conclusions of this article will be made available by the authors, without undue reservation.
YT: Conceptualization, Data curation, Formal Analysis, Funding acquisition, Investigation, Methodology, Project administration, Resources, Software, Supervision, Validation, Visualization, Writing–original draft, Writing–review and editing. AP: Conceptualization, Data curation, Investigation, Methodology, Software, Supervision, Writing–review and editing. IS: Formal Analysis, Methodology, Project administration, Supervision, Validation, Visualization, Writing–review and editing. YR: Conceptualization, Data curation, Formal Analysis, Funding acquisition, Investigation, Methodology, Project administration, Resources, Software, Supervision, Validation, Visualization, Writing–review and editing.
The author(s) declare that no financial support was received for the research, authorship, and/or publication of this article.
The authors declare that the research was conducted in the absence of any commercial or financial relationships that could be construed as a potential conflict of interest.
All claims expressed in this article are solely those of the authors and do not necessarily represent those of their affiliated organizations, or those of the publisher, the editors and the reviewers. Any product that may be evaluated in this article, or claim that may be made by its manufacturer, is not guaranteed or endorsed by the publisher.
Abed, M., and de Brito, J. (2020). Evaluation of high-performance self-compacting concrete using alternative materials and exposed to elevated temperatures by non-destructive testing. J. Build. Eng. 32, 101720. doi:10.1016/j.jobe.2020.101720
Aleksander, G. P., Yifan, T., and Fuming, Z. (2023). Predicting service life of polyethylene pipes under crack expansion using random forest method. Int. J. Eng. 36 (12), 2243–2252. doi:10.5829/ije.2023.36.12c.14
Baktizin, R. N., Zaripov, R. M., Korobkov, G. E., and Masalimov, R. B. (2020). Assessment of internal pressure effect, causing additional bending of the pipeline. Записки Горного института 242, 160–168. doi:10.31897/pmi.2020.2.160
Bolobov, V., Martynenko, Y. V., Voronov, V., and Latipov, I. (2022). Improvement of the liquefied natural gas vapor utilization system using a gas ejector. Inventions 7 (1), 14. doi:10.3390/inventions7010014
Chabot, A., Laroche, N., Carcreff, E., Rauch, M., and Hascoët, J. Y. (2020). Towards defect monitoring for metallic additive manufacturing components using phased array ultrasonic testing. J. Intelligent Manuf. 31 (5), 1191–1201. doi:10.1007/s10845-019-01505-9
Chen, Z., Lu, W., Chen, Y., and Lu, C. (2020). Fatigue crack detection in AISI 304 austenitic stainless steel using nonlinear and linear ultrasonic testing methods. J. Mater. Eng. Perform. 29, 4040–4046. doi:10.1007/s11665-020-04914-7
Da, Y., Dong, G., Shang, Y., Wang, B., Liu, D., and Qian, Z. (2020). Circumferential defect detection using ultrasonic guided waves: an efficient quantitative technique for pipeline inspection. Eng. Comput. 37 (6), 1923–1943. doi:10.1108/ec-06-2019-0260
Daniyan, I., Balogun, V., Ererughurie, O. K., Daniyan, L., and Oladapo, B. I. (2022). Development of an inline inspection robot for the detection of pipeline defects. J. Facil. Manag. 20 (2), 193–217. doi:10.1108/jfm-01-2021-0010
Deepak, J. R., Raja, V. K. B., Srikanth, D., Surendran, H., and Nickolas, M. M. (2021). Non-destructive testing (NDT) techniques for low carbon steel welded joints: a review and experimental study. Mater. Today Proc. 44, 3732–3737. doi:10.1016/j.matpr.2020.11.578
Elankavi, R. S., Dinakaran, D., and Jose, J. (2020). Developments in inpipe inspection robot: a review. J. Mech. Continua Math. Sci. 15 (5), 238–248. doi:10.26782/jmcms.2020.05.00022
Fetisov, V. (2024). Analysis of numerical modeling of steady-state modes of methane–hydrogen mixture transportation through a compressor station to reduce CO2 emissions. Sci. Rep. 14, 10605. doi:10.1038/s41598-024-61361-3
Fetisov, V., Davardoost, H., and Mogylevets, V. (2023). Technological aspects of methane–hydrogen mixture transportation through operating gas pipelines considering industrial and fire safety. Fire 6, 409. doi:10.3390/fire6100409
Garcia Marquez, F. P., and Gomez Munoz, C. Q. (2020). A new approach for fault detection, location and diagnosis by ultrasonic testing. Energies 13 (5), 1192. doi:10.3390/en13051192
Gupta, M., Khan, M. A., Butola, R., and Singari, R. M. (2022). Advances in applications of non-destructive testing (ndt): a review. Adv. Mater. Process. Technol. 8 (2), 2286–2307. doi:10.1080/2374068x.2021.1909332
Islamov, S. R., Bondarenko, A. V., and Mardashov, D. V. (2019). “Substantiation of a well killing technology for fractured carbonate reservoirs,” in Youth technical sessions proceedings: VI youth forum of the world Petroleum council – future leaders forum (London, UK: Taylor & Francis), 256–264. doi:10.1201/9780429327070-35
Karkoub, M., Bouhali, O., and Sheharyar, A. (2020). Gas pipeline inspection using autonomous robots with omni-directional cameras. IEEE Sensors J. 21 (14), 15544–15553. doi:10.1109/jsen.2020.3043277
Karyakina, E., Shammazov, I., Voronov, V., and Shalygin, A. (2021). The simulation of ultra-high molecular weight polyethylene cryogenic pipeline stress-strain state. Mater. Sci. Forum 1031, 132–140. 10.4028/www.scientific.net/msf.1031.132.
Korobov, G.Y., and Podoprigora, D. G. (2019). Complex algorithm for developing effective kill fluids for oil and gas condensate reservoirs. Int. J. Civ. Eng. Technol. 10, 2697–2713. doi:10.1109/JSEN.2020.3043277
Kruschwitz, S., Munsch, S., Telong, M., Schmidt, W., Bintz, T., Fladt, M., et al. (2023). The NMR core analyzing tomograph: a multi-functional tool for non-destructive testing of building materials. Magn. Reson. Lett. 3 (3), 207–219. doi:10.1016/j.mrl.2023.03.004
Kumavat, H. R., Chandak, N. R., and Patil, I. T. (2021). Factors influencing the performance of rebound hammer used for non-destructive testing of concrete members: a review. Case Stud. Constr. Mater. 14, e00491. doi:10.1016/j.cscm.2021.e00491
Li, W., Wang, Z., Yin, X., Yang, H., and Shao, X. (2022). Differential electromagnetic acoustic probes for quantitative detection of pipeline cracks. IEEE Sensors J. 23 (9), 9820–9831. doi:10.1109/jsen.2022.3222325
Litvinenko, V., Bowbriсk, I., Naumov, I., and Zaitseva, Z. (2022a). Global guidelines and requirements for professional competencies of natural resource extraction engineers: implications for ESG principles and sustainable development goals. J. Clean. Prod. 338, 130530. doi:10.1016/j.jclepro.2022.130530
Litvinenko, V., Bowbriсk, I., Naumov, I., and Zaitseva, Z. (2022b). Global guidelines and requirements for professional competencies of natural resource extraction engineers: implications for ESG principles and sustainable development goals. J. Clean. Prod. 338, 130530. doi:10.1016/j.jclepro.2022.130530
Lucas, P., Max, F., Markus, B., Marius, K., Raimon, T.-D., Gerald van den, B. K., et al. (2022). Testing the robustness of particle-based separation models for the magnetic separation of a complex skarn ore. Int. J. Min. Sci. Technol. 32 (3), 645–655. doi:10.1016/j.ijmst.2022.01.008
Ma, Q., Tian, G., Zeng, Y., Li, R., Song, H., Wang, Z., et al. (2021). Pipeline in-line inspection method, instrumentation and data management. Sensors 21 (11), 3862. doi:10.3390/s21113862
Marinina, O., Tsvetkova, A., Vasilev, Y., Komendantova, N., and Parfenova, A. (2022). Evaluating the downstream development strategy of oil companies: the case of Rosneft. Resources 11 (1), 4. doi:10.3390/resources11010004
Nikolaev, A., Lykov, Y. V., and Duchnevich, L. (2018). Mathematical modeling of non-stationary gas flow in gas pipeline. IOP Conf. Ser. Mater. Sci. Eng. 327 (2), 1–6. doi:10.1088/1757-899X/327/2/022034
Nikolaev, A. K., and Zaripova, N. А. (2021). Substantiation of analytical dependences for hydraulic calculation of high-viscosity oil transportation. Записки Горного института 252, 885–895. doi:10.31897/pmi.2021.6.10
Nüßler, D., and Jonuscheit, J. (2021). Terahertz based non-destructive testing (NDT) Making the invisible visible. tm-Technisches Mess. 88 (4), 199–210. doi:10.1515/teme-2019-0100
Olisa, S. C., Khan, M. A., and Starr, A. (2021). Review of current guided wave ultrasonic testing (GWUT) limitations and future directions. Sensors 21 (3), 811. doi:10.3390/s21030811
Parlak, B. O., and Yavasoglu, H. A. (2023). A comprehensive analysis of in-line inspection tools and technologies for steel oil and gas pipelines. Sustainability 15 (3), 2783. doi:10.3390/su15032783
Pryakhin, E. I., and Azarov, V. A. (2024). Increasing the adhesion of fluoroplastic coatings to steel sur-faces of pipes with a view to their use in gas transmission systems. Chernye Met. 3, 69–75. doi:10.17580/chm.2024.03.11
Pshenin, V. V., and Zakirova, G. S. (2023). Improving the efficiency of oil vapor recovery units in the commodity transport operations at oil terminals. Journal of Mining Institute. doi:10.31897/PMI.2023.29
Ren, C., Jin, Y., Liu, X., Zhang, Z., and Cai, Y. (2022). Cyclic constitutive equations of rock with coupled damage induced by compaction and cracking. Int. J. Min. Sci. Technol. 32 (5), 1153–1165. doi:10.1016/j.ijmst.2022.06.010
Safiullin, R., and Tian, H. (2023). Method of effective implementation of intelligent hardware complexes in the management of passenger transportation processes within urban agglomerations. Open Transpl. J. 18, 1. doi:10.2174/0126671212272101231128060918
Sampath, S., Chaurasiya, K. L., Aryan, P., and Bhattacharya, B. (2021). An innovative approach towards defect detection and localization in gas pipelines using integrated in-line inspection methods. J. Nat. Gas Sci. Eng. 90, 103933. doi:10.1016/j.jngse.2021.103933
Schipachev, A., Aljadly, M., Ganzulenko, O., Chernikov, D., Razzhivin, V., and Yusupov, R. (2023). Evaluating the effectiveness of magnetic-pulse treatment for healing continuity defects in the metal of oil and gas pipelines. Metals 13, 1875. doi:10.3390/met13111875
Shammazov, I. A., Sidorkin, D. I., and Batyrov, A. M. (2022). Ensuring the stability of above-ground main pipelines in areas of continuous distribution of permafrost. Eng. Georesources. 333, 200–207. doi:10.18799/24131830/2022/12/3832
Shi, H., Chen, W., Zhang, H., and Song, L. (2023a). A novel obtaining method and mesoscopic mechanism of pseudo-shear strength parameter evolution of sandstone. Environ. Earth Sci. 82, 60. doi:10.1007/s12665-023-10748-y
Shi, H., Chen, W., Zhang, H., Song, L., Ming, L., Wang, M., et al. (2023b). Dynamic strength characteristics of fractured rock mass. Eng. Fract. Mech. 292, 109678. doi:10.1016/j.engfracmech.2023.109678
Shi, H., Zhang, H., Chen, W., Song, L., and Li, M. (2023c). Pull-out debonding characteristics of rockbolt with prefabricated cracks in rock: a numerical study based on particle flow code. Comput. Part. Mech. 11, 29–53. doi:10.1007/s40571-023-00607-9
Stroykov, G., Babyr, N., Ilin, I., and Marchenko, R. (2021). System of comprehensive assessment of project risks in the energy industry. Int. J. Eng. 34 (7), 1778–1784. doi:10.5829/ije.2021.34.07a.22
Tian, H., Safiullin, R. N., and Safiullin, R. R. (2024). Integral evaluation of implementation efficiency of automated hardware complex for vehicle traffic control. Int. J. Eng. 37 (8), 1534–1546. doi:10.5829/IJE.2024.37.08B.07
Towsyfyan, H., Biguri, A., Boardman, R., and Blumensath, T. (2020). Successes and challenges in non-destructive testing of aircraft composite structures. Chin. J. Aeronautics 33 (3), 771–791. doi:10.1016/j.cja.2019.09.017
Vasiliev, G. G., Dzhaljabov, A. А., and Leonovich, I. А. (2021). Analysis of the causes of engineering structures deformations at gas industry facilities in the permafrost zone. Записки Горного института 249, 377–385. doi:10.31897/pmi.2021.3.6
Wang, Z., Wang, S., Wang, Q., Zhao, W., and Huang, S. (2020). Development of a helical lamb wave electromagnetic acoustic transducer for pipeline inspection. IEEE Sensors J. 20 (17), 9715–9723. doi:10.1109/jsen.2020.2990795
Wu, J., Jing, H., Gao, Y., Meng, Q., Yin, Q., and Du, Y. (2022). Effects of carbon nanotube dosage and aggregate size distribution on mechanical property and microstructure of cemented rockfill. Cem. Concr. Compos. 127, 104408. doi:10.1016/j.cemconcomp.2022.104408
Wu, J., Jing, H., Yin, Q., Yu, L., Meng, B., and Li, S. (2020). Strength prediction model considering material, ultrasonic and stress of cemented waste rock backfill for recycling gangue. J. Clean. Prod. 276, 123189. doi:10.1016/j.jclepro.2020.123189
Wu, J., Wong, H. S., Zhang, H., Yin, Q., Jing, H., and Ma, D. (2024). Improvement of cemented rockfill by premixing low-alkalinity activator and fly ash for recycling gangue and partially replacing cement. Cem. Concr. Compos. 145, 105345. doi:10.1016/j.cemconcomp.2023.105345
Zheng, Q., Qian, J., Zhang, H., Chen, Y., and Zhang, S. (2024). Velocity tomography of cross-sectional damage evolution along rock longitudinal direction under uniaxial loading. Tunn. Undergr. Space Technol. 143, 105503. doi:10.1016/j.tust.2023.105503
Keywords: electromagnetic ultrasound, pipeline inner wall, non-destructive testing, empirical mode decomposition, singular spectrum analysis
Citation: Tian Y, Palaev AG, Shammazov IA and Ren Y (2024) Non-destructive testing technology for corrosion wall thickness reduction defects in pipelines based on electromagnetic ultrasound. Front. Earth Sci. 12:1432043. doi: 10.3389/feart.2024.1432043
Received: 13 May 2024; Accepted: 17 June 2024;
Published: 05 July 2024.
Edited by:
Hao Shi, Anhui University of Science and Technology, ChinaReviewed by:
Xuehua Li, China University of Mining and Technology, ChinaCopyright © 2024 Tian, Palaev, Shammazov and Ren. This is an open-access article distributed under the terms of the Creative Commons Attribution License (CC BY). The use, distribution or reproduction in other forums is permitted, provided the original author(s) and the copyright owner(s) are credited and that the original publication in this journal is cited, in accordance with accepted academic practice. No use, distribution or reproduction is permitted which does not comply with these terms.
*Correspondence: Yifan Tian, dGlhbnlpZmFuQG1haWwucnU=
Disclaimer: All claims expressed in this article are solely those of the authors and do not necessarily represent those of their affiliated organizations, or those of the publisher, the editors and the reviewers. Any product that may be evaluated in this article or claim that may be made by its manufacturer is not guaranteed or endorsed by the publisher.
Research integrity at Frontiers
Learn more about the work of our research integrity team to safeguard the quality of each article we publish.